Distinct modes of SMAD2 chromatin binding and remodeling shape the transcriptional response to NODAL/Activin signaling
- The Francis Crick Institute, United Kingdom
- Bioinformatics and Biostatistics, The Francis Crick Institute, United Kingdom
- Advanced Sequencing, The Francis Crick Institute, United Kingdom
Figures
Figure 1 with 4 supplements
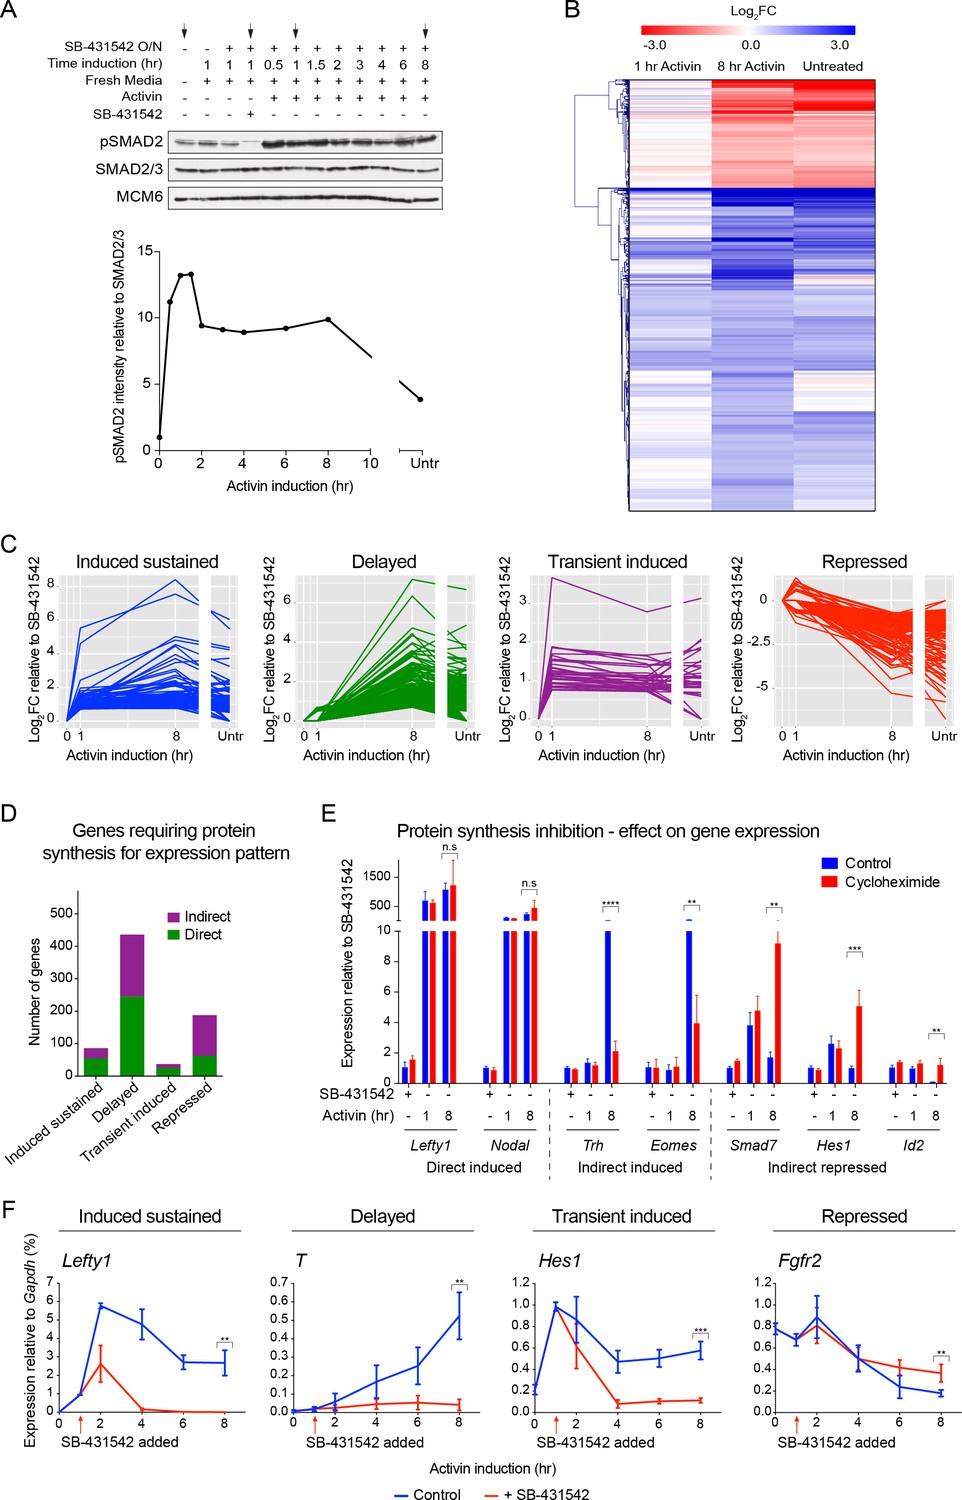
The transcriptional response to acute, sustained and chronic NODAL/Activin signaling in P19 cells.
(A) Western blot showing SMAD2 phosphorylation timecourse upon Activin induction in P19 cells. Cells were treated as indicated and lysates were blotted using the antibodies shown. Arrows indicate the conditions used for the RNA-seq. Below, the phosphorylated SMAD2 (pSMAD2) signal was quantified relative to total SMAD2/3. Untr, untreated (chronic signaling). (B) RNA-seq was performed on P19 cells either untreated or incubated overnight with SB-431542, washed out, then replaced with full media containing SB-431542 for 1 hr (SB-431542 sample), or with full media containing Activin for 1 hr or 8 hr. Shown is a hierarchically-clustered heatmap of log2FC values (relative to SB-431542) for each time point for 747 differentially-expressed genes. (C) log2FC values relative to SB-431542 at each time point plotted for the target genes falling within each of four distinct kinetic clusters. Untr, untreated. (D) Following RNA-seq of control, cycloheximide- or emetine-treated samples in the SB-431542, 1 hr Activin and 8 hr Activin conditions, genes were defined as ‘direct’ or ‘indirect’ depending on whether their pattern changed upon protein synthesis inhibition. Displayed are the relative proportions of direct and indirect target genes in each kinetic cluster. (E) Cells were treated with or without cycloheximide as in (D) and processed for qPCR. Transcript levels for a subset of target genes were quantified relative to Gapdh. Plotted are the means and SEM of two independent experiments performed in duplicate. n.s., not significant. **** corresponds to a p value of < 0.0001; *** corresponds to a p value of < 0.001 and ** corresponds to a p value of < 0.01. (F) Cells were treated overnight with SB-431542, washed out, then stimulated for the indicated times with Activin (blue line) or SB-431542 was added to the Activin-containing media after 1 hr of Activin treatment (red line). qPCR was performed for the genes shown, which are representatives of each of the four distinct transcriptional profiles. Plotted are the means and SEM of three independent experiments performed in duplicate. *** corresponds to a p value of < 0.001 and ** corresponds to a p value of < 0.01.
Figure 1—figure supplement 1
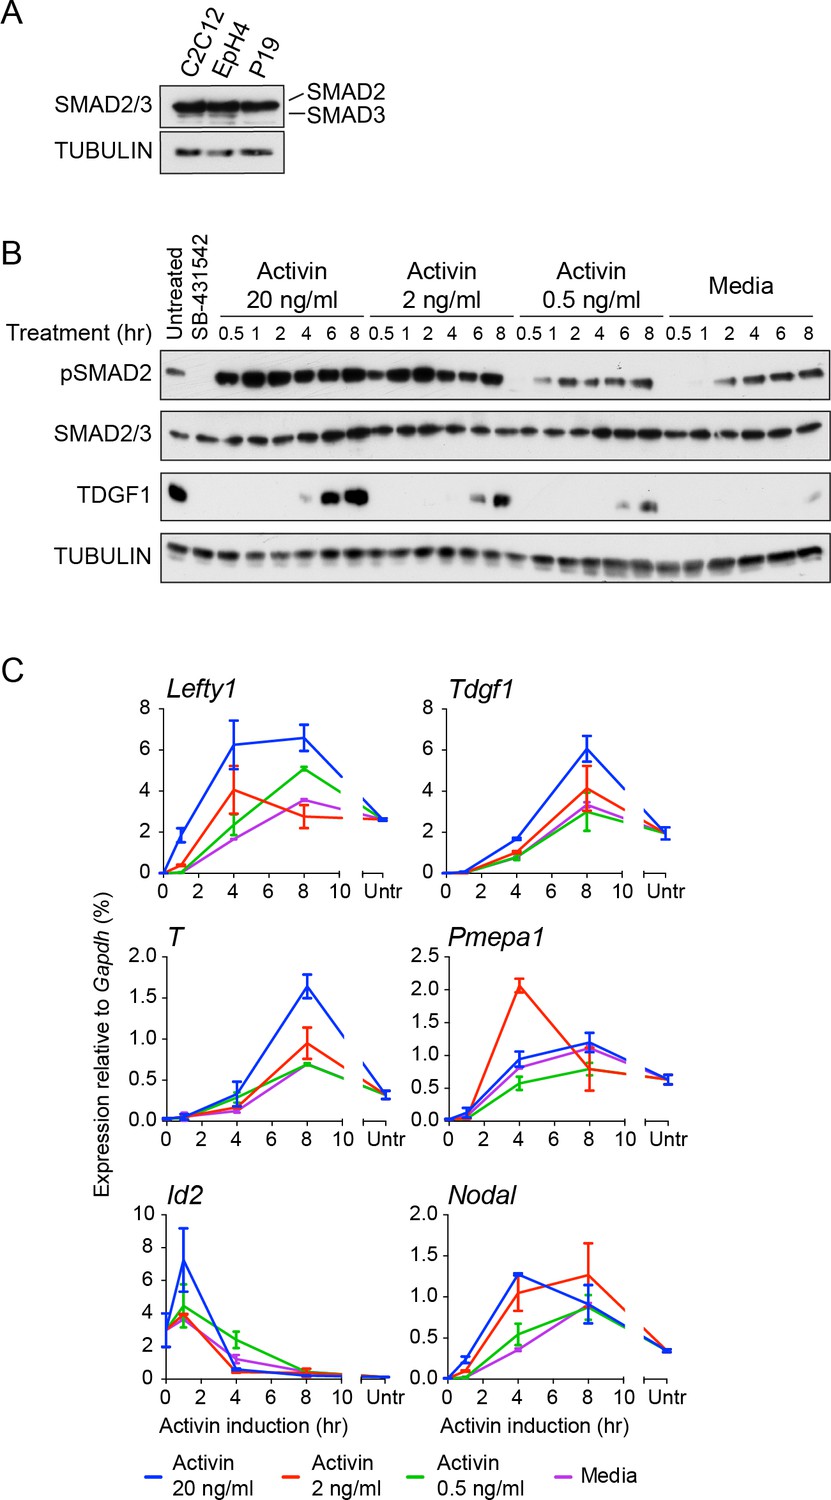
Characterization of Activin/NODAL-induced transcription in P19 cells.
(A) Western blot for SMAD2/3 and TUBULIN (loading control) on lysates collected from P19 cells and two other mouse cell lines, C2C12 and EpH4 for comparison. Note that P19 cells express similar levels of SMAD2 compared to the others cell lines, but undetectable levels of SMAD3. (B) Western blot for pSMAD2, SMAD2/3, TDGF1 and TUBULIN (loading control) on lysates collected from cells treated overnight with SB-431542, followed by washout and stimulation for the indicated times with the concentrations of Activin shown, or with media alone. (C) qPCR on samples treated as in (B), for induced and repressed genes, showing dose-dependent induction of several targets. A representative experiment (means ± SD) is shown. Untr, untreated.
Figure 1—figure supplement 2

Characterization of the autocrine signal.
(A) Fragments per kilobase of exon per million fragments mapped (FPKM) values as obtained by RNA-seq (average of duplicates) for ligands and receptors involved in Activin/NODAL signaling. Shown are the values for each of the treatment states as indicated. (B) siRNA-mediated knockdown of the indicated ligands using pooled siRNA oligonucleotides. Lysates were collected 72 hr after transfection and Western blotted for pSMAD2, total SMAD2, TDGF1 and MCM6 (loading). NT, non-targeting. (C) qPCR performed on mRNA extracted from the same samples as in (B), showing knockdown efficiency of Nodal, Gdf3 and Tdgf1 (top panel) and indicated known target genes Lefty1, Pmepa1 and Eomes (bottom panel). Values were normalized to endogenous Gapdh and shown are expression levels relative to the non-targeting (NT) siRNA control. Plotted are the means and SEM of two independent experiments performed in duplicate. **** corresponds to a p value of < 0.0001; *** corresponds to a p value of < 0.001; ** corresponds to a p value of < 0.01. (D) Western blot for TDGF1 and MCM6 (loading control) on lysates collected from untreated (Untr) P19 cells or cells treated for the indicated times with 10 µM SB-431542, showing that TDGF1 has a short half-life and is under control of SMAD2-mediated signaling.
Figure 1—figure supplement 3
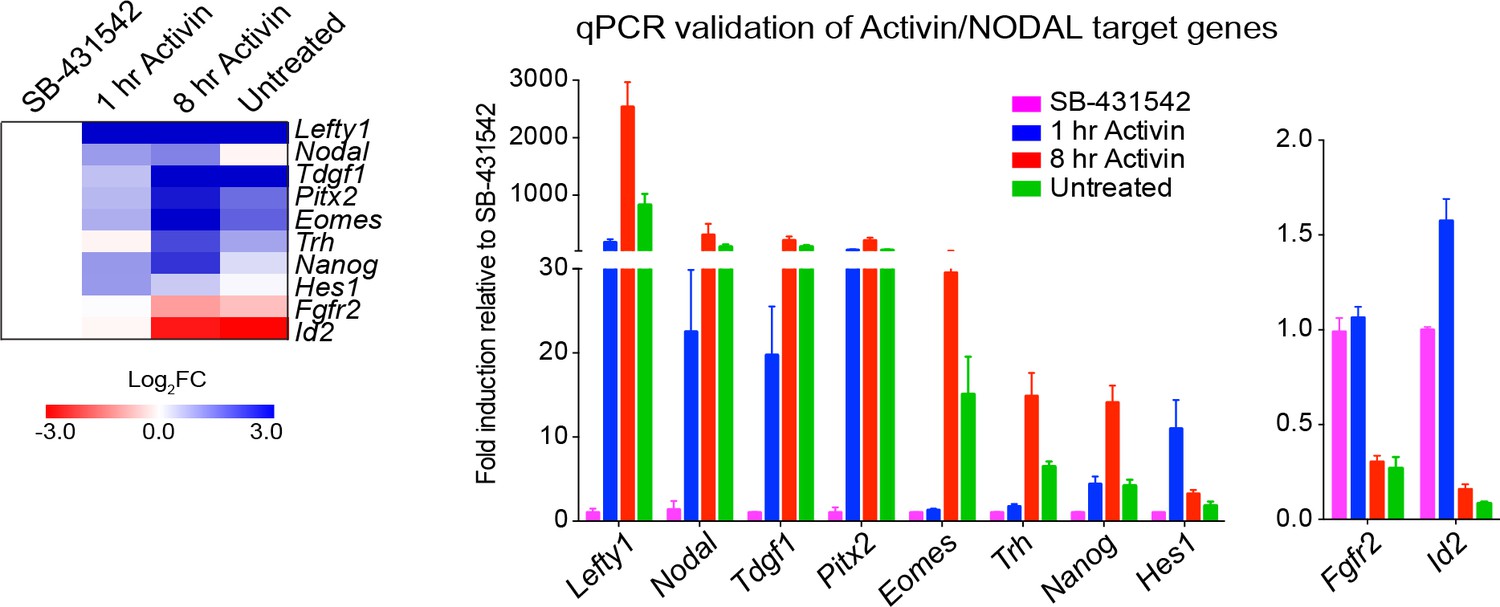
Activin/NODAL target genes are induced with different kinetics.
Left panel, a heatmap showing the log2FC values for the Activin-treated and untreated samples relative to the SB-431542-treated samples as determined by RNA-seq. Right panel, qPCR validation for selected target genes. Plotted are the means and SEM of three independent experiments of gene expression values normalized to endogenous Gapdh values.
Figure 1—figure supplement 4

Activin/NODAL target gene expression patterns require continuous Activin/NODAL signaling over a sustained time course.
(A) mRNA stability of Activin/Nodal target genes. Cells were treated with Actinomycin D (6 μM) for the indicated times to inhibit further mRNA synthesis. Levels of mRNA for a subset of target genes was measured by qPCR, and the half-life of the mRNA was calculated. Plotted are the means and SEM of three independent experiments performed in duplicate. (B and C) Effects of SB-431542 chase on Activin/NODAL-induced transcription. Cells were treated overnight with SB-431542, washed out, then stimulated for the indicated times with Activin, or SB-431542 was added to the Activin-containing media after 1 hr of Activin treatment. Whole cell extracts were prepared and Western blotted for pSMAD2, SMAD2/3, and TUBULIN (loading control) (B). Samples were also prepared for qPCR to determine mRNA levels of induced and repressed target genes (C). In (C), the means and SEM of three independent experiments performed in duplicate are plotted. **** corresponds to a p value of < 0.0001; *** corresponds to a p value of < 0.001; ** corresponds to a p value of < 0.01; n.s., not significant.
Figure 2 with 2 supplements
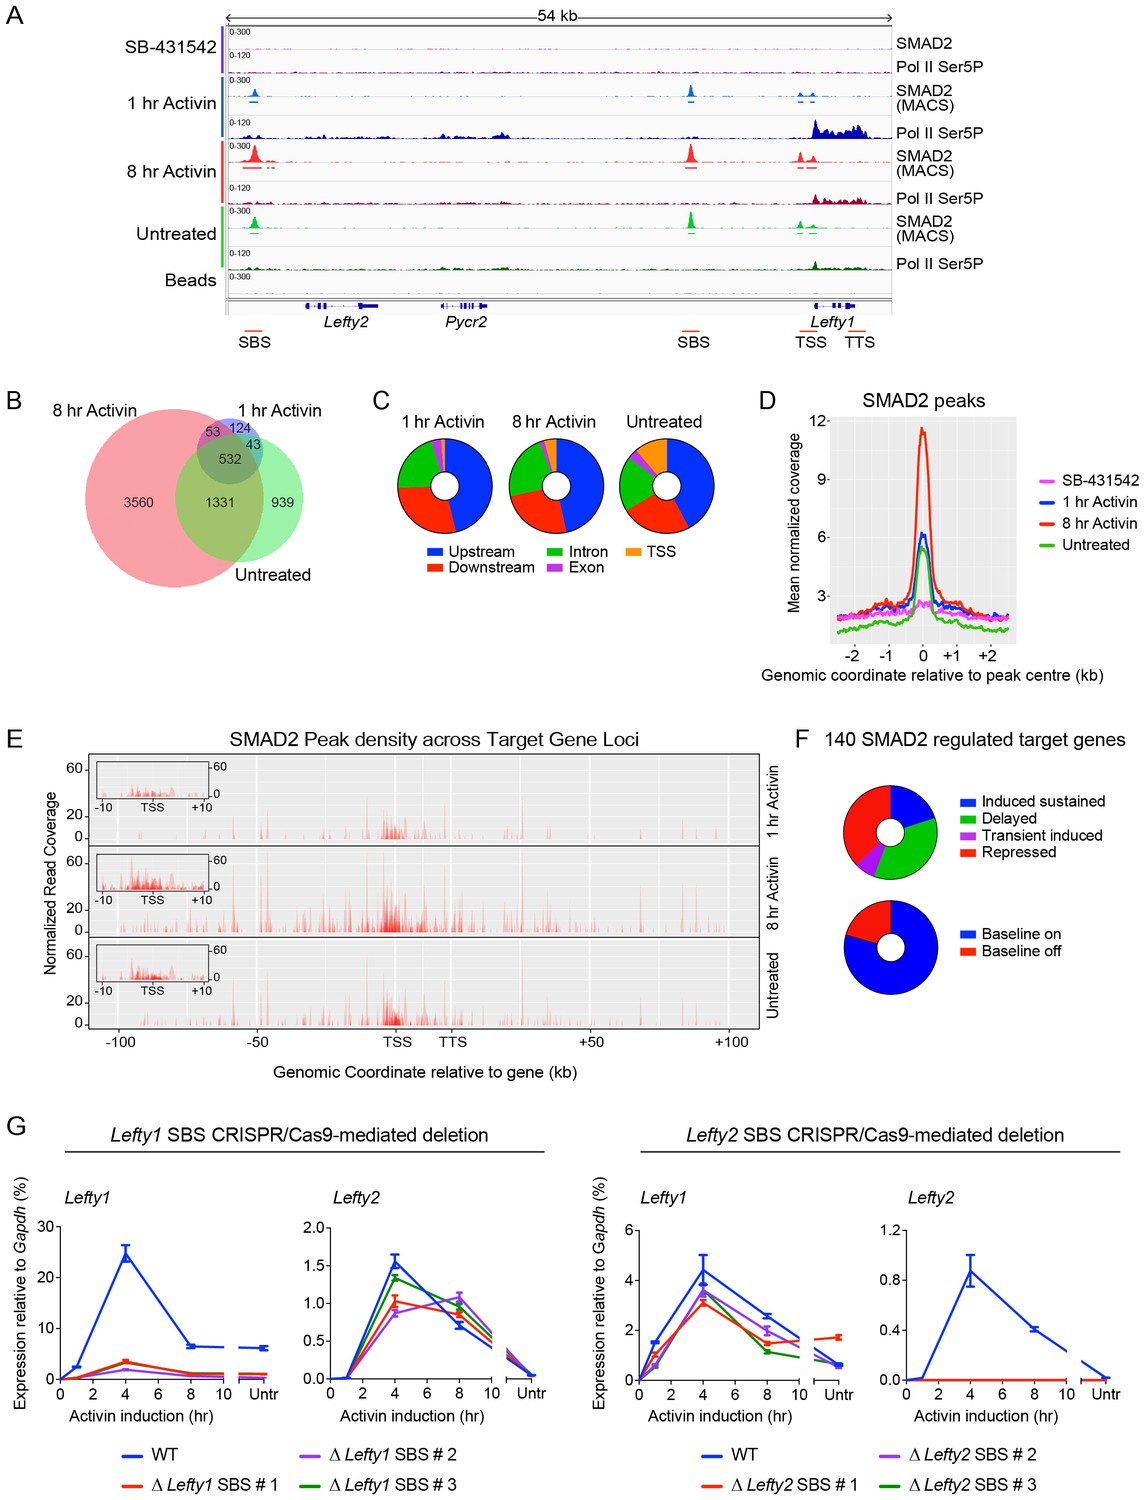
Combining RNA-seq with ChIP-seq for SMAD2 and Pol II leads to the definition of a high confidence dataset.
(A) IGV browser display of the Lefty1/Lefty2 genomic locus, showing tracks and MACS-called peaks for SMAD2 and tracks for Pol II Ser5P. Red lines below are regions for which ChIP-qPCR primers were designed. (B) SMAD2 ChIP-sequencing was performed on P19 cells in the same conditions as the RNA-seq (Figure 1). The numbers of peaks in each condition are shown in the Venn diagram. (C) Distribution of SMAD2 peaks based on their genomic annotation to upstream or downstream intergenic regions, TSS (considered TSS ± 500 bp), exonic or intronic location. (D) Metaprofiles for the SMAD2 peaks in the high confidence dataset. Normalized read counts centred on the peak ± 2 kb are shown for the four different experimental conditions. (E) Plots displaying the density of SMAD2 peaks in the high confidence dataset and their distance from the annotated TSS of the nearest regulated target gene within a ± 100 kb window for each condition. All genes are modeled as 20 kb from TSS to TTS. Insets show density of SMAD2 peaks ±10 kb centred around the TSS of the modeled target genes. (F) Distribution of the high confidence dataset of 140 SMAD2-regulated genes within each of the four categories, or segregated according to ‘baseline on’ or ‘baseline off’ in the SB-431542 state. (G) Left panel: Deletion of the upstream Lefty1 SBS in three independent clones inhibits Activin-induced Lefty1 transcription, but not Lefty2 transcription. Right panel. Deletion of the upstream Lefty2 SBS in three independent clones inhibits Activin-induced Lefty2 transcription, but not Lefty1 transcription. Transcript levels were quantified relative to Gapdh. A representative experiment (means ± SD) is shown. Untr, untreated.
Figure 2—figure supplement 1
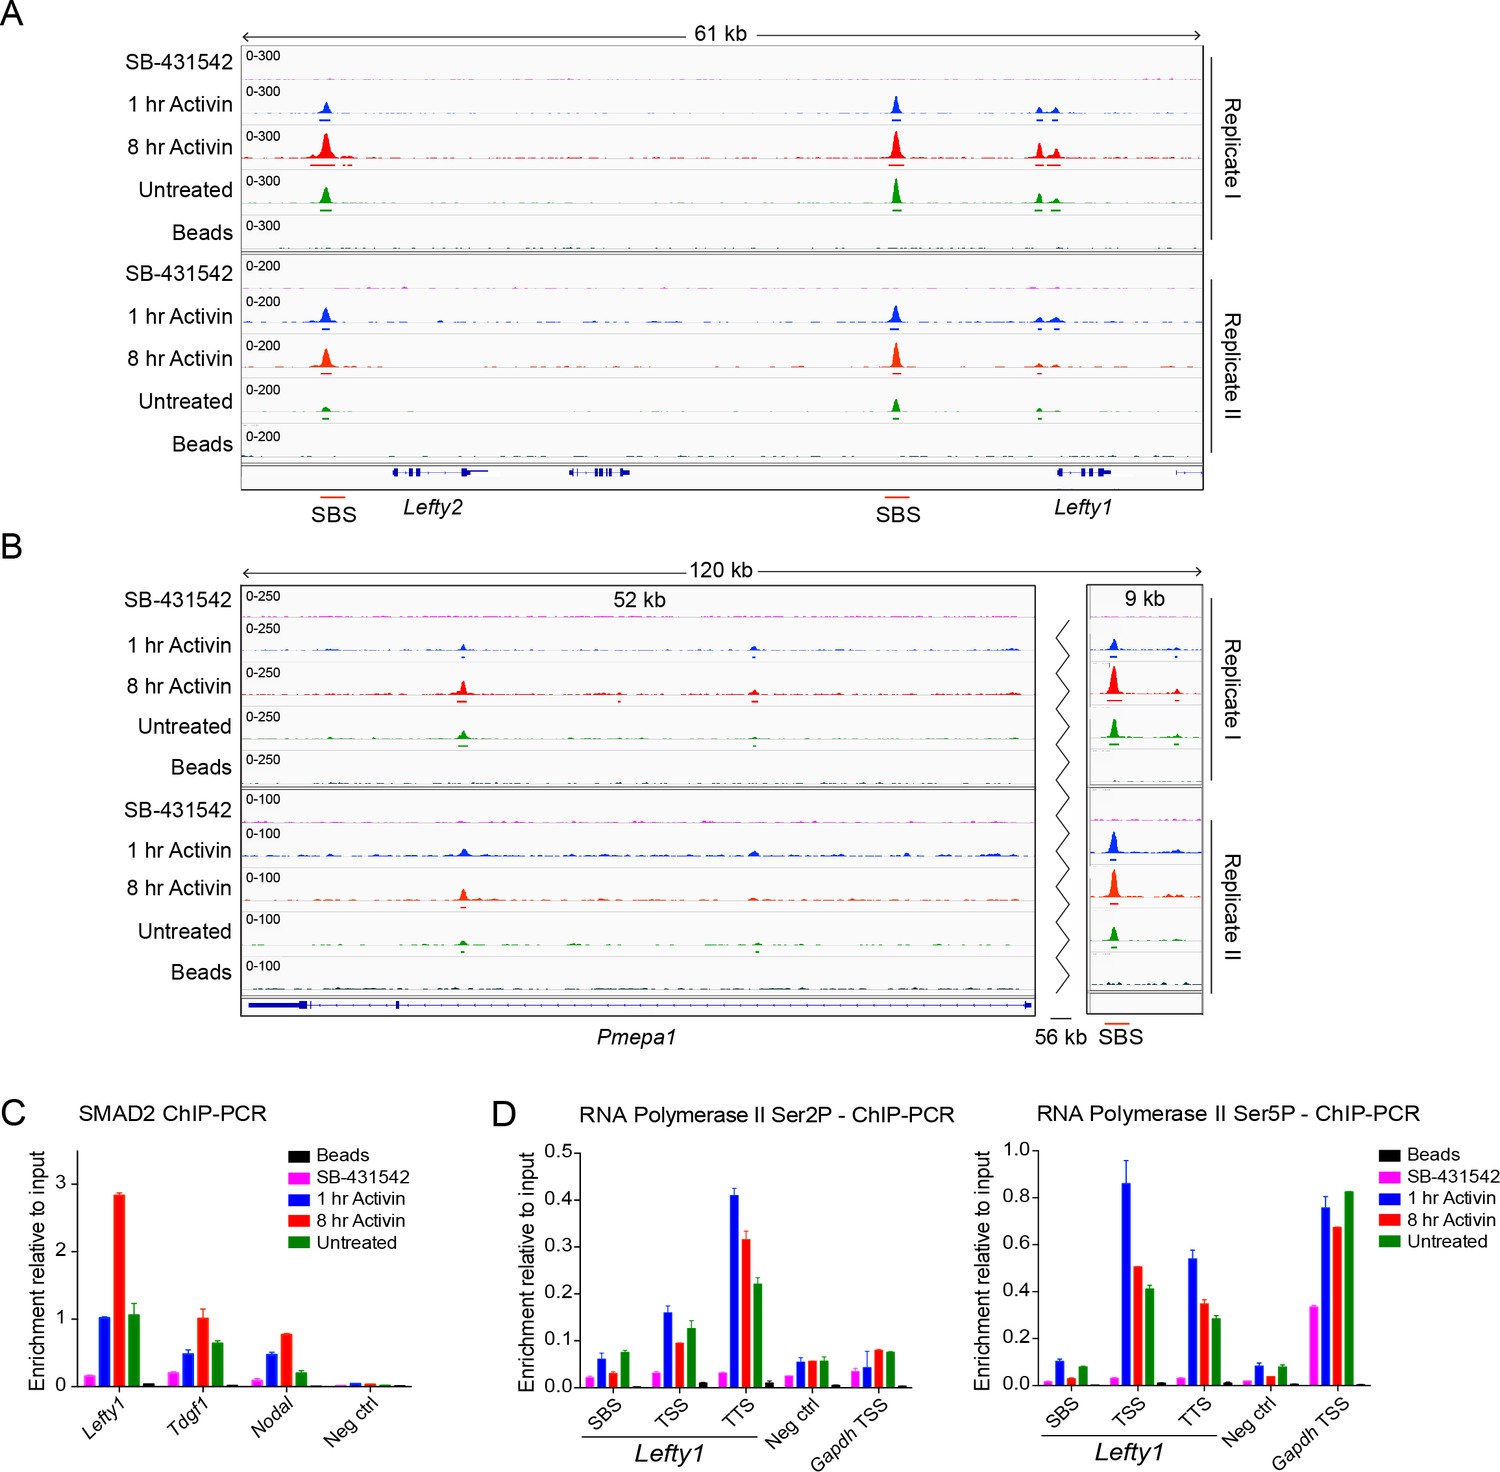
Characterization of SMAD2 and Pol II binding in response to Activin signaling.
(A and B) IGV browser displays over the Lefty1/Lefty2 locus (A) or Pmepa1 locus (B) for the 2 replicates of the SMAD2 ChIP-seq experiment to show consistency between duplicates. The tracks and MACS-called peaks for SMAD2 are shown. The conditions are as in Figure 2A. SMAD2 binding sites (SBSs) that are subsequently analyzed in the paper are indicated with a red line. (C) SMAD2 ChIP-PCR validations performed in the same treatment conditions as the ChIP-seq experiment for selected SBSs found near target genes (Lefty1, Tdgf1, Nodal). The negative control (Neg ctrl) region primers amplify an intergenic region on Chromosome 5 devoid of detectable SMAD2 binding. A representative experiment is shown (mean ± SD). (D) ChIP-PCR validations of Pol II Ser2P and Ser5P on the Lefty1 gene using the same treatment conditions as the ChIP-seq experiment, showing enrichment at the SBS, TSS and TTS sites relative to a negative control (Neg ctrl) region and the Gapdh TSS. A representative experiment is shown (mean ± SD).
Figure 2—figure supplement 2
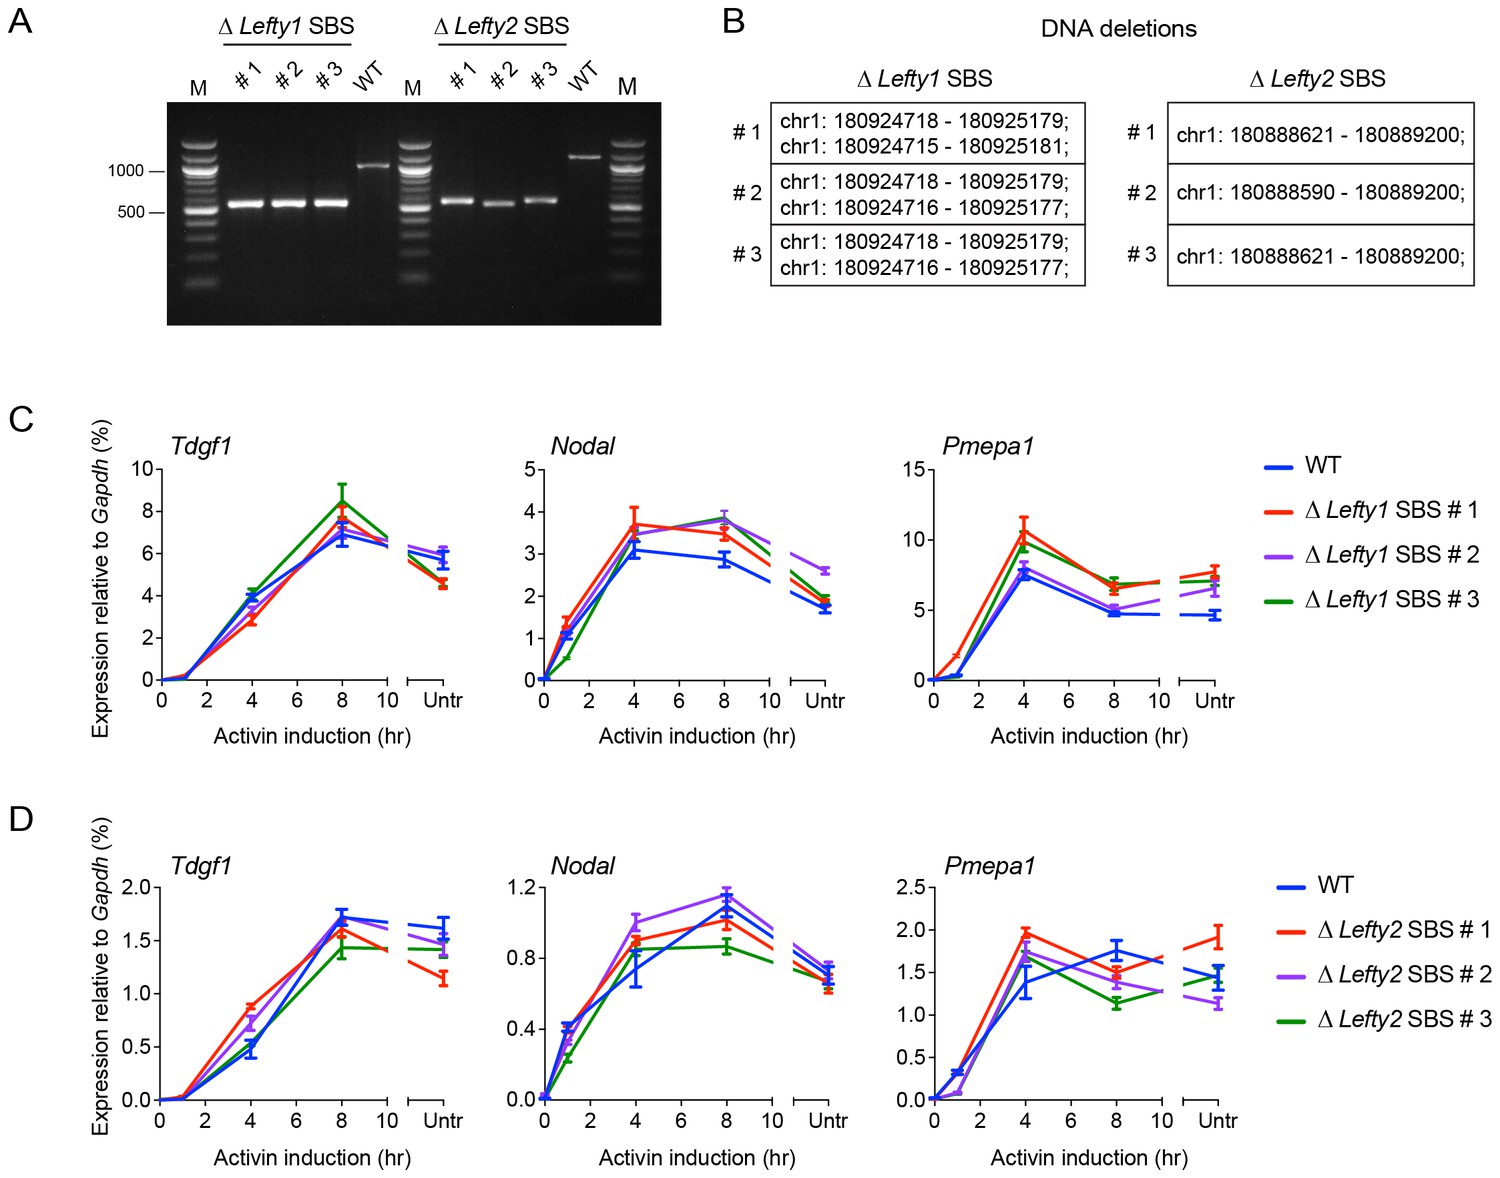
CRISPR/Cas9-induced deletion of the Lefty1 and Lefty2 upstream SBSs.
(A) Characterization of the P19 clones deleted for Lefty1 and Lefty2 upstream SBSs. Three individual clones are shown for each deletion. Fragments were amplified from genomic DNA by PCR using primers flanking the positions of the guide RNAs. Wild type genomic DNA was used as a control. M, 100 bp DNA ladder. (B) DNA regions deleted in the individual clones. In all cases the clones are compound heterozygotes. In the case of Lefty2, the deletions are the same on both alleles of the different clones, but the flanking sequences are not identical. (C and D) qPCR for the genes shown in wild type (WT) P19 cells and in the clones deleted for Lefty1 (C) and Lefty2 (D) upstream SBSs. The cells were either untreated (Untr) or incubated overnight with SB-431542, washed out, then replaced with full media containing Activin for the times shown. Representative experiments are shown (mean ± SD).
Figure 3
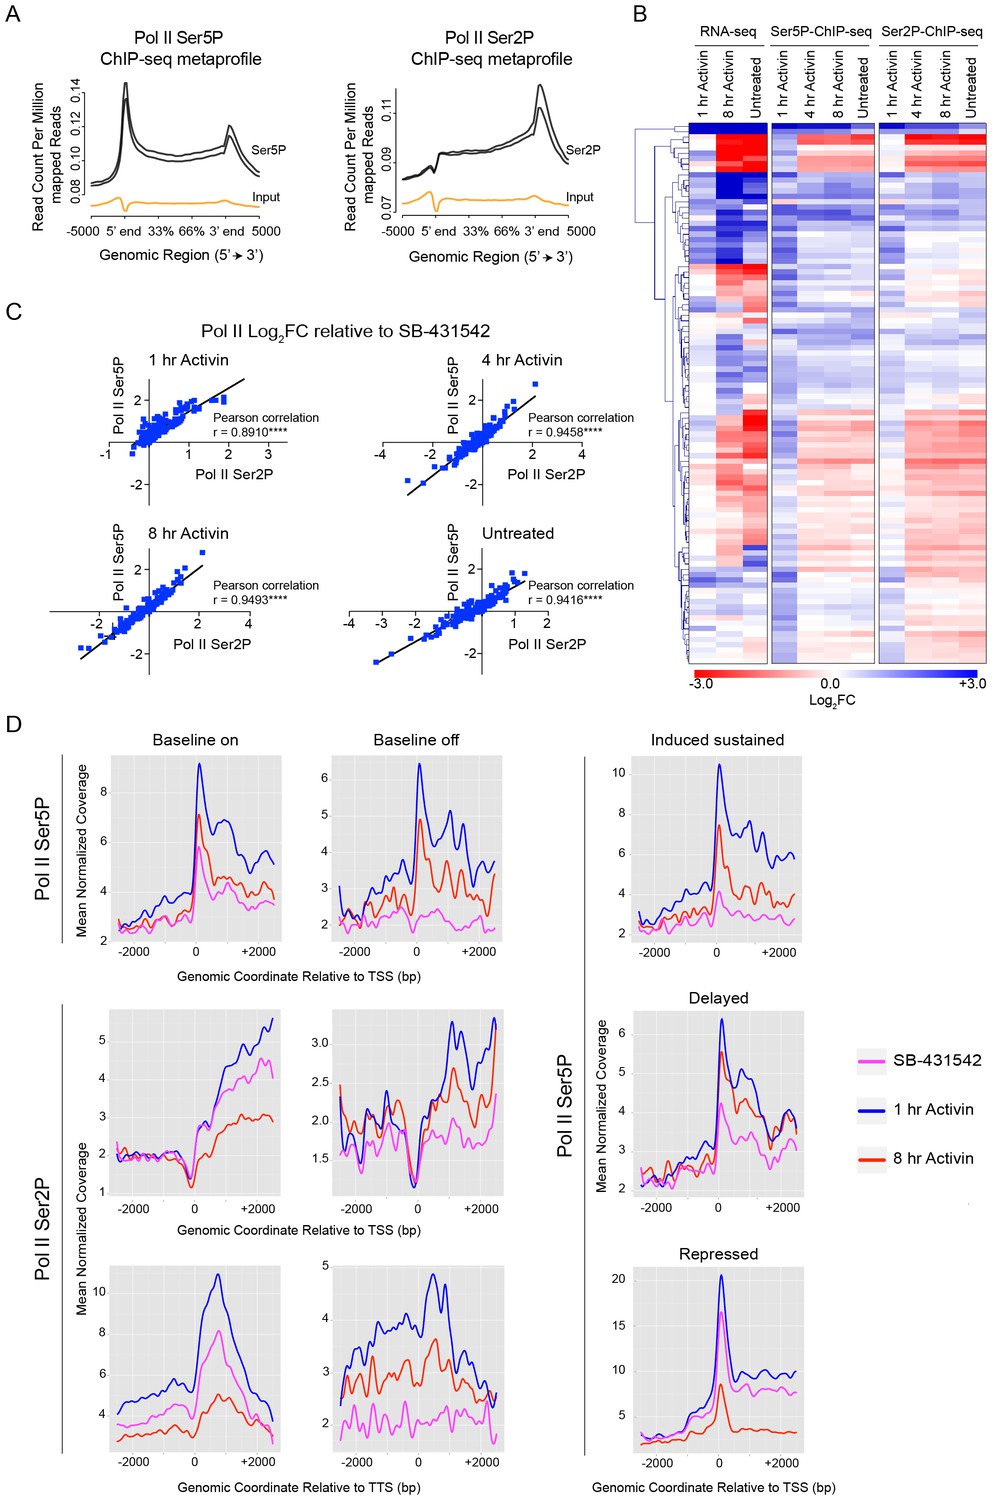
Activin-SMAD2 signaling regulates Pol II via de novo recruitment.
(A) Average metaprofiles for each of two replicates from the 1 hr Activin sample of the ChIP-seq for Ser5P or Ser2P isoforms of Pol II. Normalized read count across all genes is shown. The orange line denotes the input. (B) Activin-SMAD2 target genes from the high confidence dataset showing differential Pol II binding were hierarchically-clustered and the log2FC relative to SB-431542 for mean normalized read depth for Pol II Ser 5P and Pol II Ser2P is displayed in a side-by-side comparison with the transcript levels (determined by RNA-seq). (C) Correlations of the log2FC values of affected target genes for Pol II Ser2P and Ser5P for each individual time point. (D) Metaprofiles generated for Pol II Ser5P or Pol II Ser2P ChIP-seq data across a 5 kb window surrounding the TSS or the TTS for indicated subsets of target genes. Each colored line traces the normalized read depth of Pol II Ser5P or Pol II Ser2P in each condition.
Figure 4 with 1 supplement
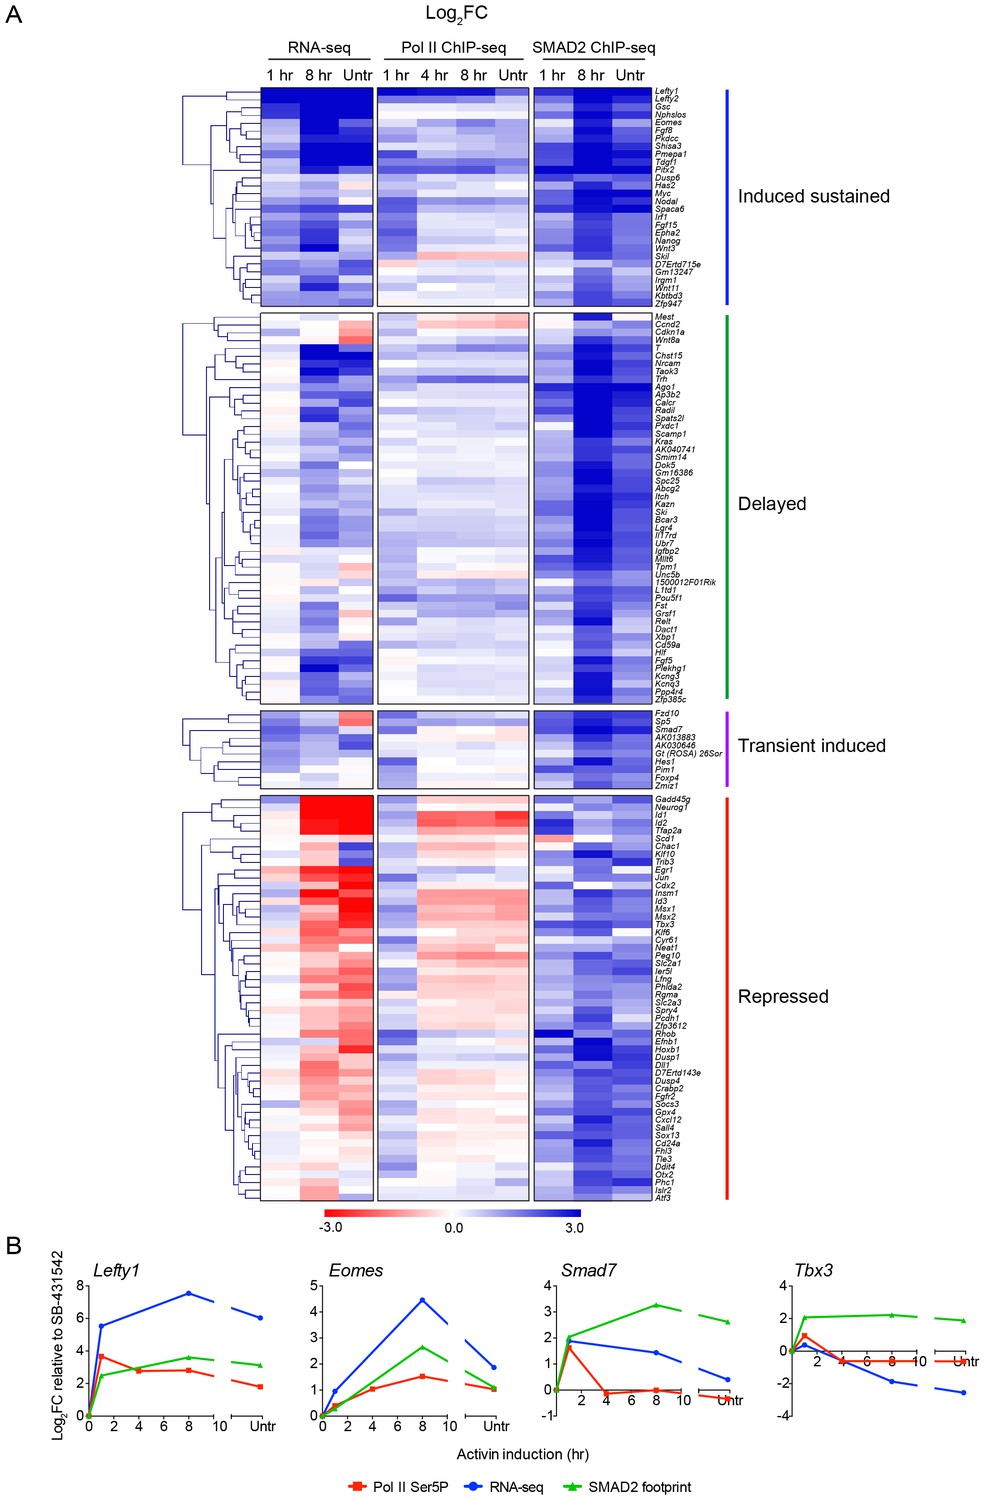
Localized SMAD2 chromatin binding does not directly correlate with transcription.
(A) Hierarchically-clustered heatmaps for each of the four different kinetic groups of target genes showing log2FC values relative to SB-431542 for gene expression as determined by RNA-seq (left), mean normalized read depth for Pol II Ser5P (middle) and SMAD2 footprint (right). Untr, untreated. (B) Transcriptional dynamics of different target genes (Lefty1, Eomes, Smad7, Tbx3). (For IGV browser displays, see Figure 2A and Figure 4—figure supplement 1). Plotted are quantifications of transcript levels obtained by RNA-seq, Pol II Ser5P occupancy expressed as mean normalized read depth, and SMAD2 footprint, all depicted as log2FC relative to SB-431542. Untr, untreated.
Figure 4—figure supplement 1
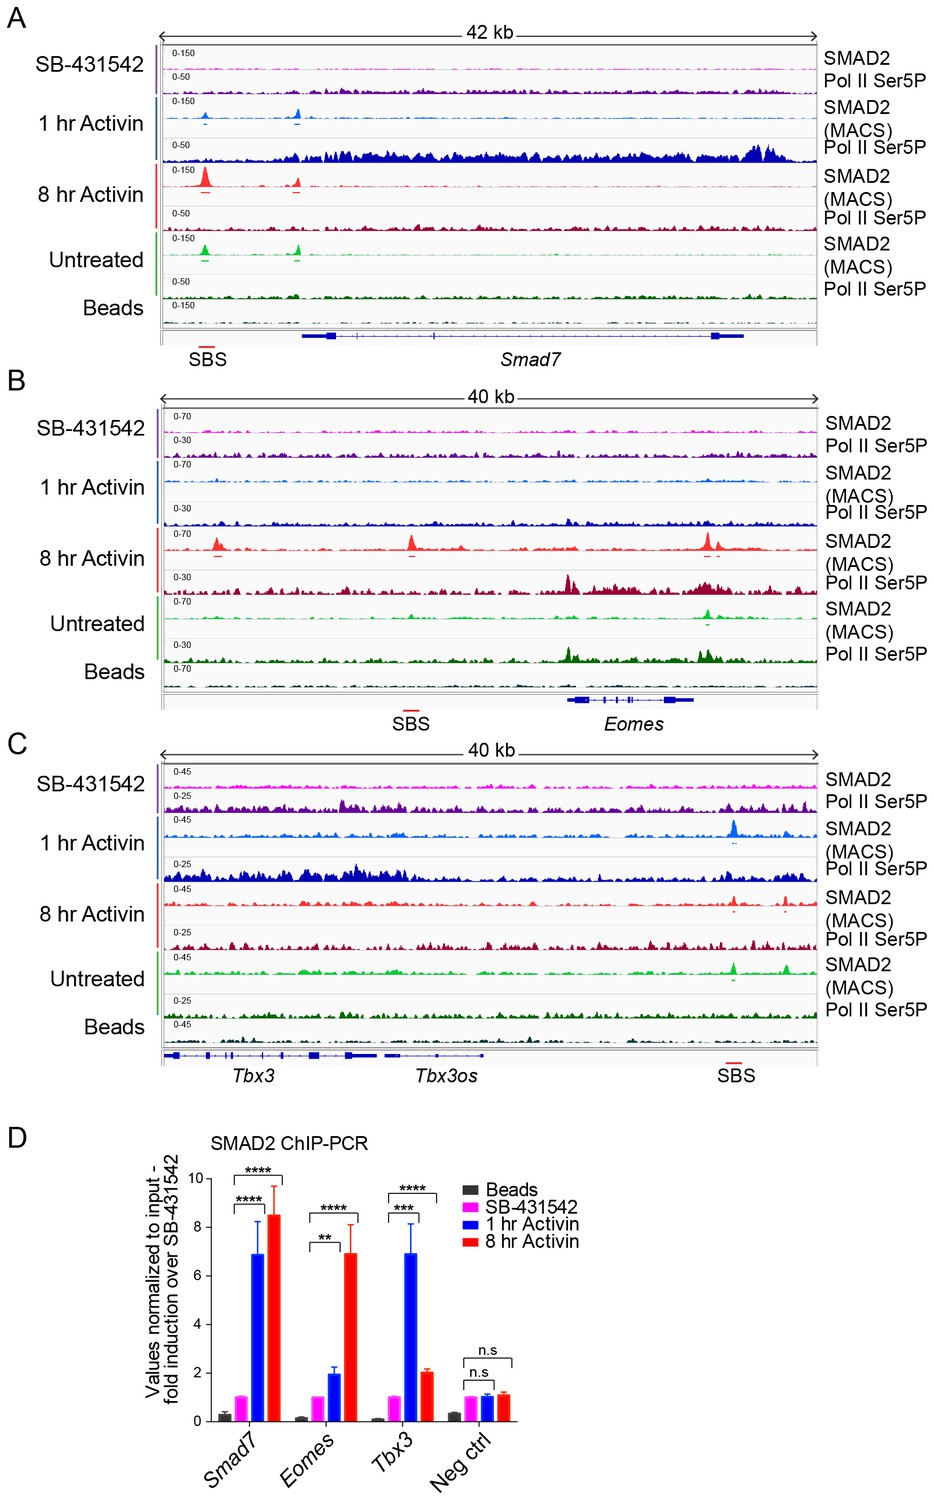
IGV browser displays of genes and associated peaks showing differential transcription and SMAD2 binding dynamics.
(A–C) IGV browser displays over the transiently induced gene Smad7 (A), Eomes (B) that is induced with delayed kinetics, and Tbx3 (C) which is a gene containing peaks which are more highly enriched at 1 hr than at 8 hr. The tracks and MACS-called peaks for SMAD2, and tracks for Pol II Ser5P are shown. Denoted underneath each panel is the SBS, for which primers were designed for ChIP-PCR. (D) SMAD2 ChIP-PCR performed on SBSs surrounding the indicated genes in the conditions shown. Neg ctrl, negative control. Plotted are the means and SEM of three independent experiments. n.s., not significant; **** corresponds to a p-value of <0.0001; *** corresponds to a p-value of <0.001; ** corresponds to a p-value of <0.01.
Figure 5 with 3 supplements
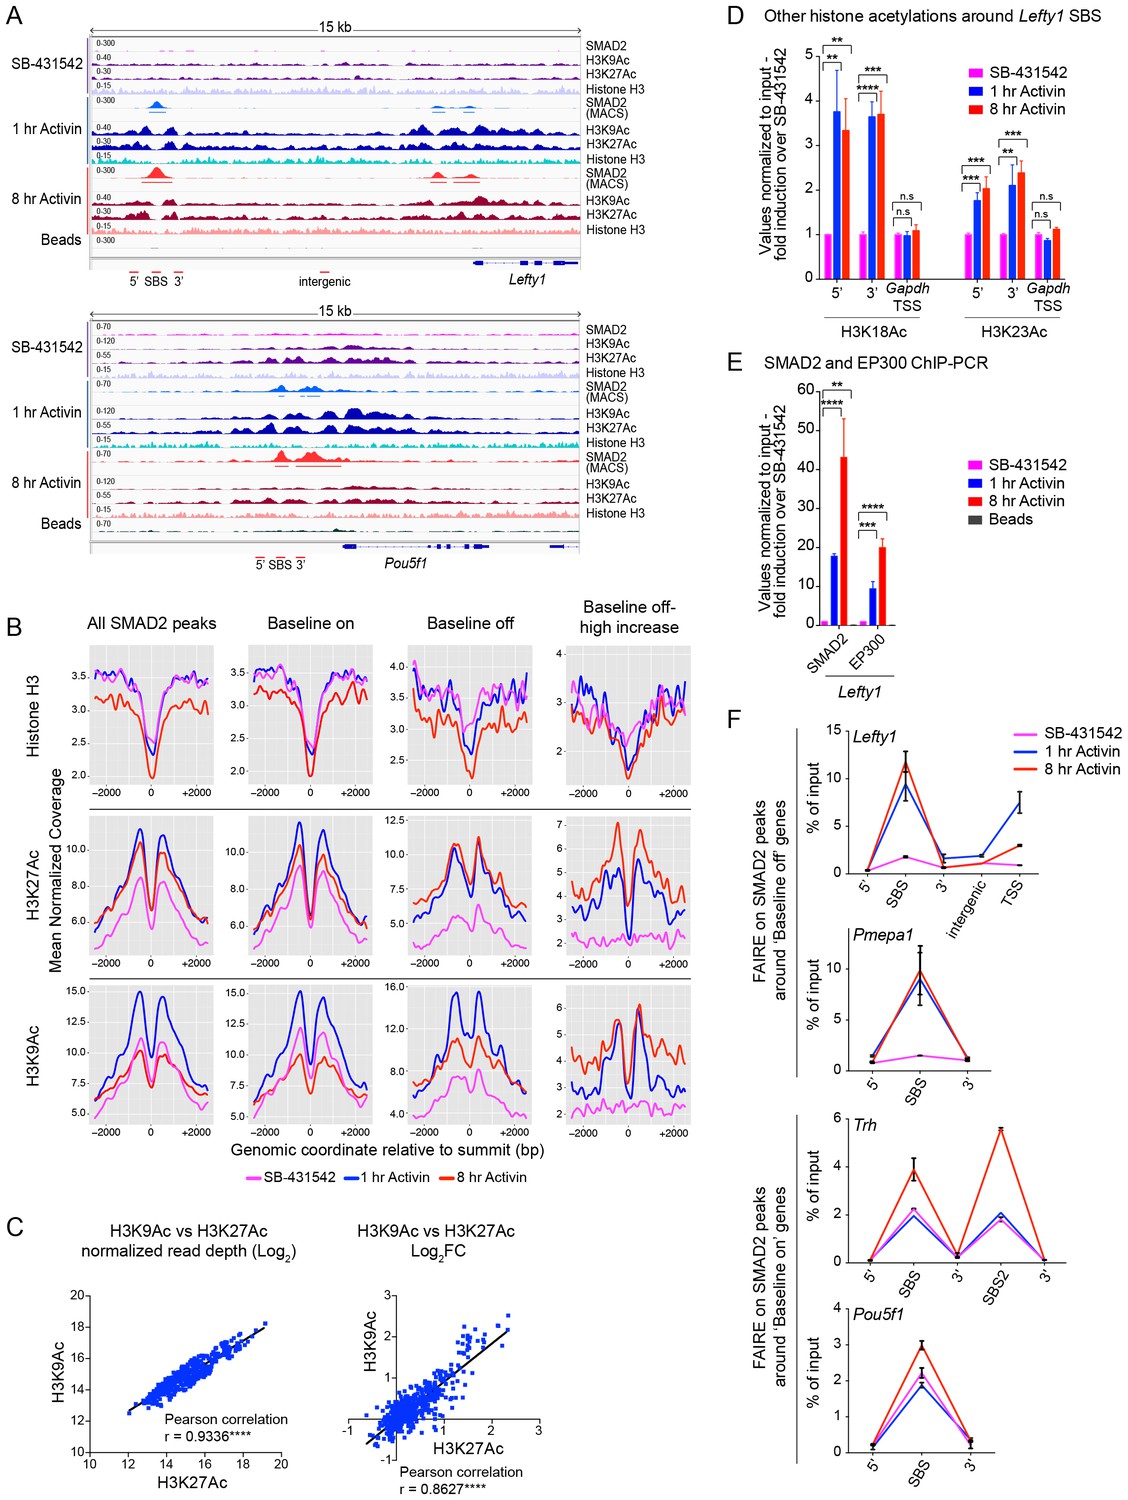
Changes in chromatin landscape around SBSs in response to signaling.
(A) IGV browser displays for the Lefty1 and Pou5f1 loci displaying ChIP-seq tracks for SMAD2, H3K9Ac, H3K27Ac and total histone H3 for the indicated treatments. For the SMAD2 ChIP-seq the MACS-called peaks are also shown. (B) Metaprofiles denoting coverage of total histone H3, H3K27Ac and H3K9Ac in a 5 kb window surrounding the average summit across SMAD2 consensus peaks. Each line within a plot traces the normalized read depth of H3 or acetylated H3 for each treatment. The left panels show metaprofiles for all 478 SMAD2 peaks, while the other panels only show those regions found near genes which are induced from an ‘on’ baseline or from an ‘off’ baseline. The right panels show metaprofiles for the subset of SMAD2 peaks which is associated with genes induced from an ‘off’ baseline and show changes in H3Ac enrichment from a low baseline as defined in Figure 6D. (C) Correlation plots showing normalized read depth (Log2) (left graph) or log2FC relative to SB-431542 (right graph) for H3K27Ac and H3K9Ac values, detected in the 1 hr Activin sample. (D) ChIP-PCR on the nucleosomes flanking the Lefty1 SBS (A) for H3K18Ac and H3K23Ac in P19 cells treated as indicated. Plotted are the means and SEM of three independent experiments. (E) ChIP-PCR showing enrichment of both SMAD2 and EP300 at the Lefty1 SBS in P19s treated as indicated. Plotted are the means and SEM of four independent experiments. (F) FAIRE-ChIP was performed on SB-431542, 1 hr Activin or 8 hr Activin-treated P19 cells. Soluble chromatin fractions were assayed for enrichment of the specific regions indicated which are highlighted in the IGV browser displays in panel (A) and Figure 2—figure supplement 1 and Figure 5—figure supplement 1. A representative experiment in shown (means ± SD). See Figure 5—figure supplement 1B for the averages of the three experiments and the statistical analyses. In D and E, n.s., not significant; **** corresponds to a p value of < 0.0001; *** corresponds to a p value of < 0.001 and ** corresponds to a p value of < 0.01.
-
Figure 5—source data 1
H3K27Ac and H3K9Ac values detected in the 1 hr Activin sample.
- https://doi.org/10.7554/eLife.22474.015
Figure 5—figure supplement 1
Validation of induced acetylation and FAIRE at and around SBSs.
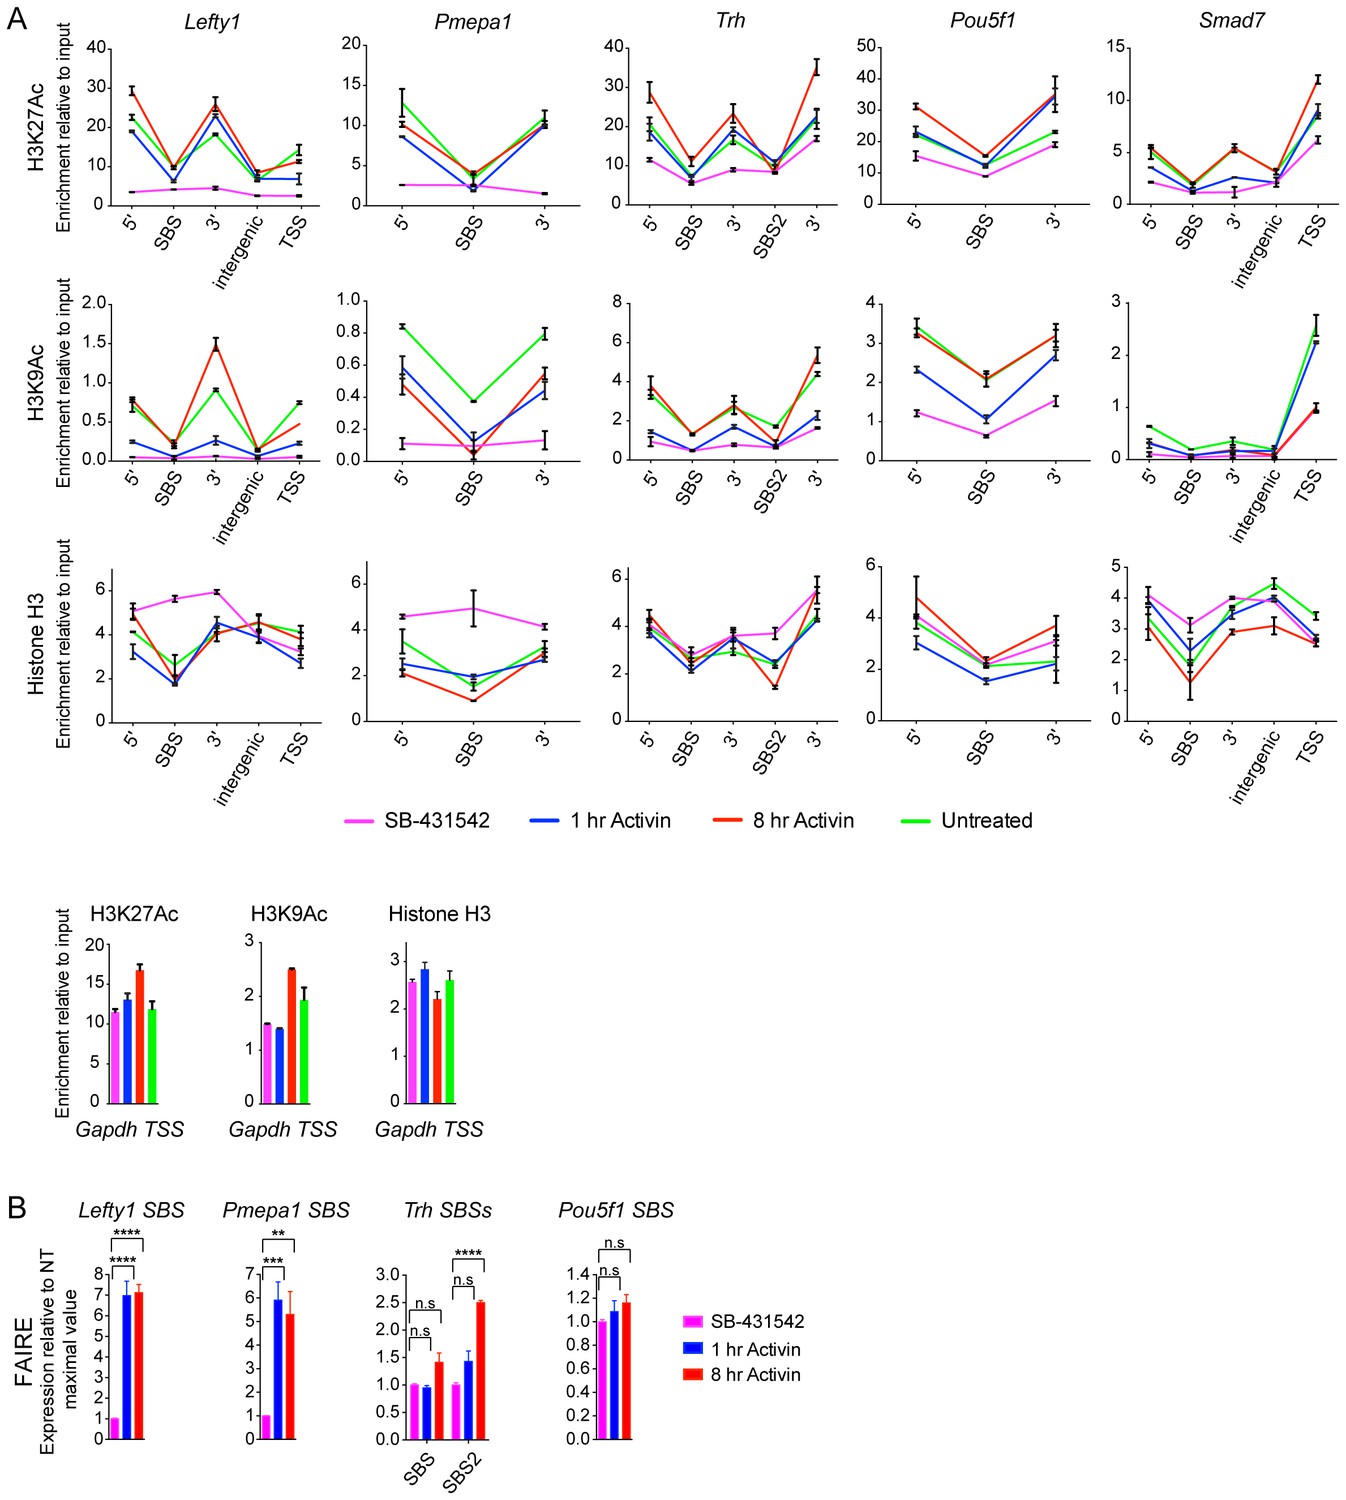
(A) ChIP-PCR for either H3K27Ac, H3K9Ac or Histone H3 was performed on P19 cells treated as indicated. Regions corresponding to the SBS around Lefty1, Pmepa1, Trh (two peaks), Pou5f1 and Smad7 were amplified, as well as the regions directly flanking the peak where the acetylated nucleosomes are found. These are denoted as 5’ and 3’ to SBS. For Lefty1 and Smad7, enrichment of H3Ac was also determined at the TSS and in the region between the peak and TSS (intergenic). All amplified genomic regions are denoted in the IGV browser displays in Figure 5A and Figure 5—figure supplement 2. Enrichment of the modifications is also shown on the Gapdh TSS as a control (Bottom panels). A representative experiment is shown (means ± SD). (B) P19 cells were treated as indicated. The nucleosomes at the selected SBSs were assayed for FAIRE-PCR. Plotted are the means and SEM of three independent experiments. n.s., not significant; **** corresponds to a p value of < 0.0001; *** corresponds to a p value of < 0.001; ** corresponds to a p value of < 0.01.
Figure 5—figure supplement 2

IGV browser displays of genes and associated peaks showing changes in chromatin landscape.
IGV browser displays over the Pmepa1, Trh and Smad7 loci. Displayed are ChIP-seq tracks for SMAD2, H3K9Ac, H3K27Ac and total histone H3 in P19 cells which were treated as indicated. MACS-called peaks for SMAD2 are also shown, and the regions amplified in ChIP-PCR (Figure 5—figure supplement 1) are denoted below each panel.
Figure 5—figure supplement 3

Correlation between histone H3 acetylation changes and gene expression.
Hierarchically-clustered heatmaps for each of the four different kinetic groups of target genes. Color intensity denotes log2FC values relative to SB-431542 for either gene expression as determined by RNA-seq (left), or mean normalized read depth for H3K9Ac (middle) or H3K27Ac (right) over a 5 kb window surrounding the annotated TSS of each target gene. Untr, untreated.
Figure 6
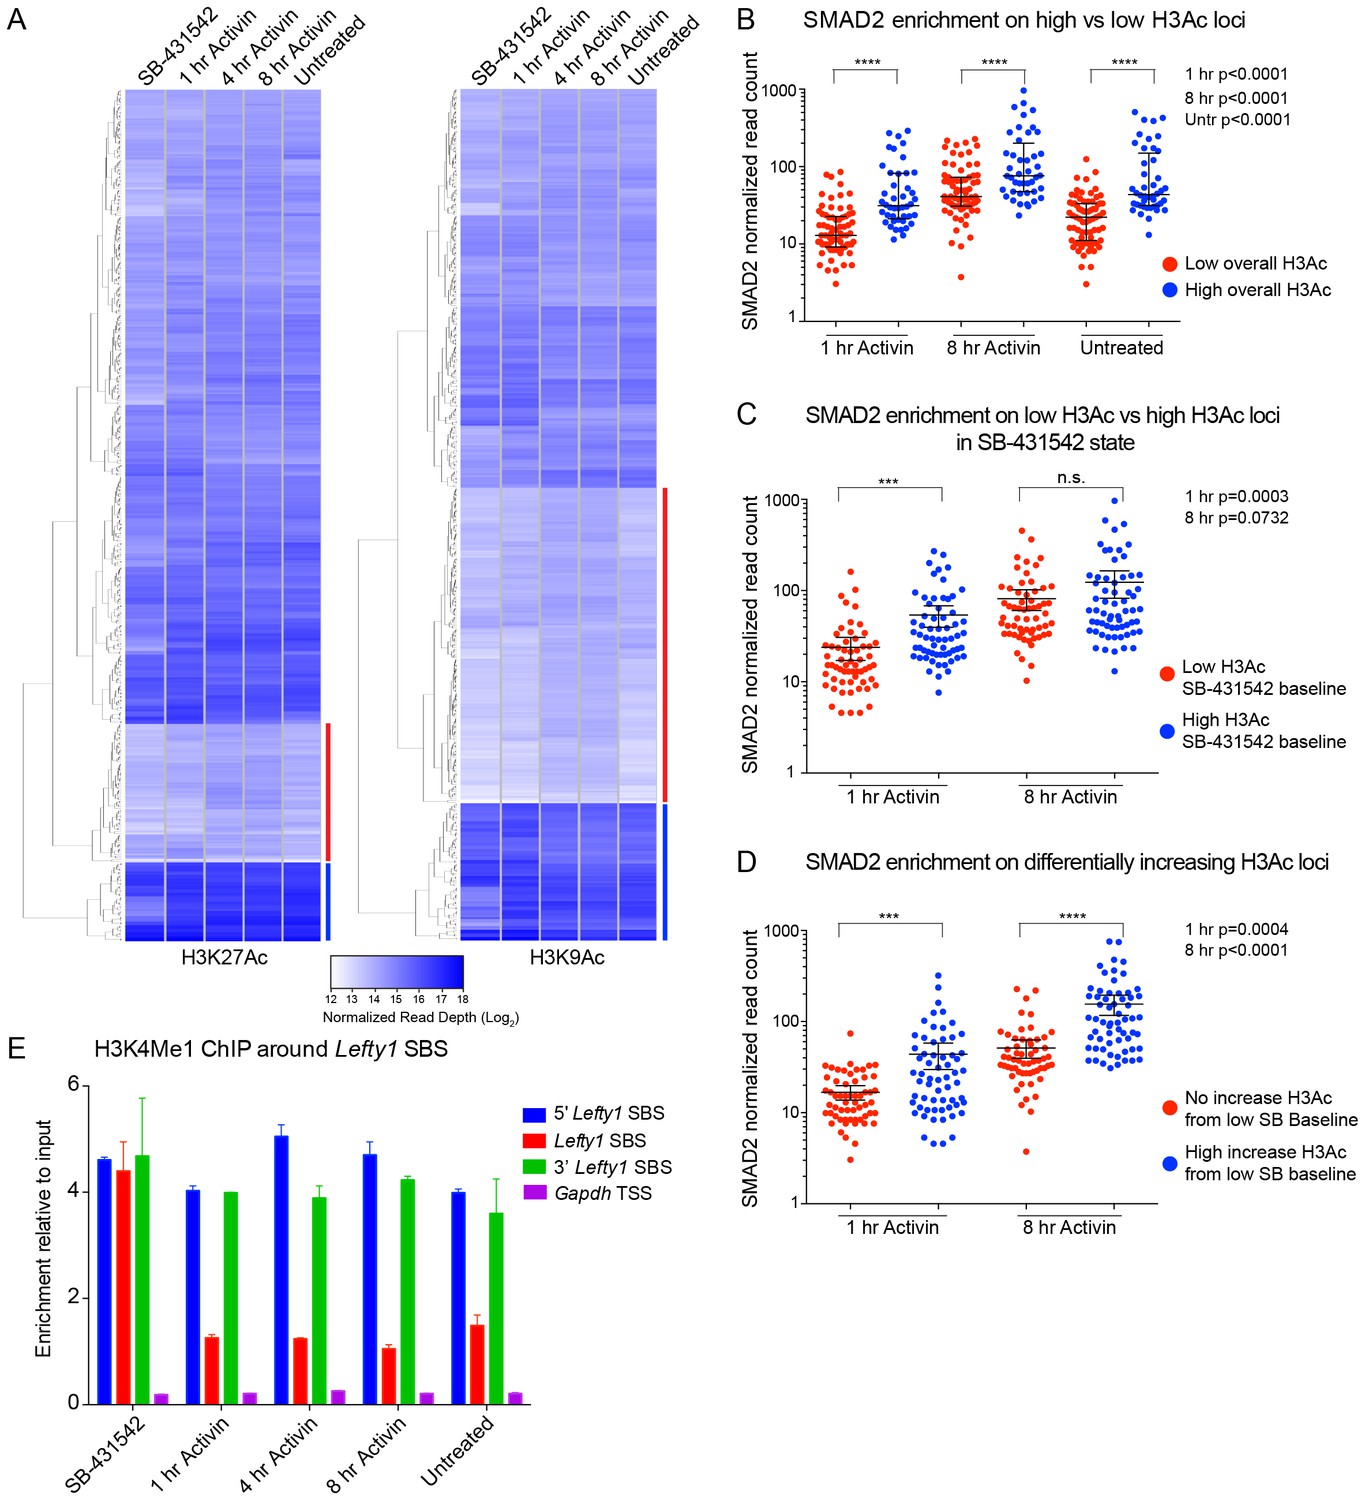
Relationship between chromatin state and SMAD2 binding strength.
(A) Hierarchical clustering of average read intensity (Log2) over a 5 kb window surrounding all SMAD2 consensus peak summits for each indicated treatment is shown for H3K27Ac (left panel) and H3K9Ac (right panel). Red line, peaks associated with low overall acetylation; blue line, peaks found in highly acetylated chromatin. (B–D) Correlation between normalized SMAD2 read counts and H3 acetylation state. The SMAD2 read counts over consensus peaks in either the ‘low overall acetylation’ (red) or ‘high overall acetylation’ (blue) category were plotted for the three conditions (B). The SMAD2 read counts over consensus peaks that were defined as either low H3Ac or high H3Ac in the SB-431542 state were plotted for the 1 hr and 8 hr Activin conditions (C). The SMAD2 read counts over subsets of loci selected based on changes in H3Ac enrichment from a low baseline (D). In all cases the black bars indicate the mean and 95% confidence interval. n.s., not significant. The p-values are given in the plots. (E) ChIP-PCR for H3K4Me1 for the nucleosomes at and flanking the Lefty1 SBS or a control region within the Gapdh coding locus. A representative experiment is shown (means ± SD).
-
Figure 6—source data 1
Average read intensity over a 5 kb window surrounding all SMAD2 consensus peak summits for H3K27Ac and H3K9Ac.
- https://doi.org/10.7554/eLife.22474.020
Figure 7 with 4 supplements
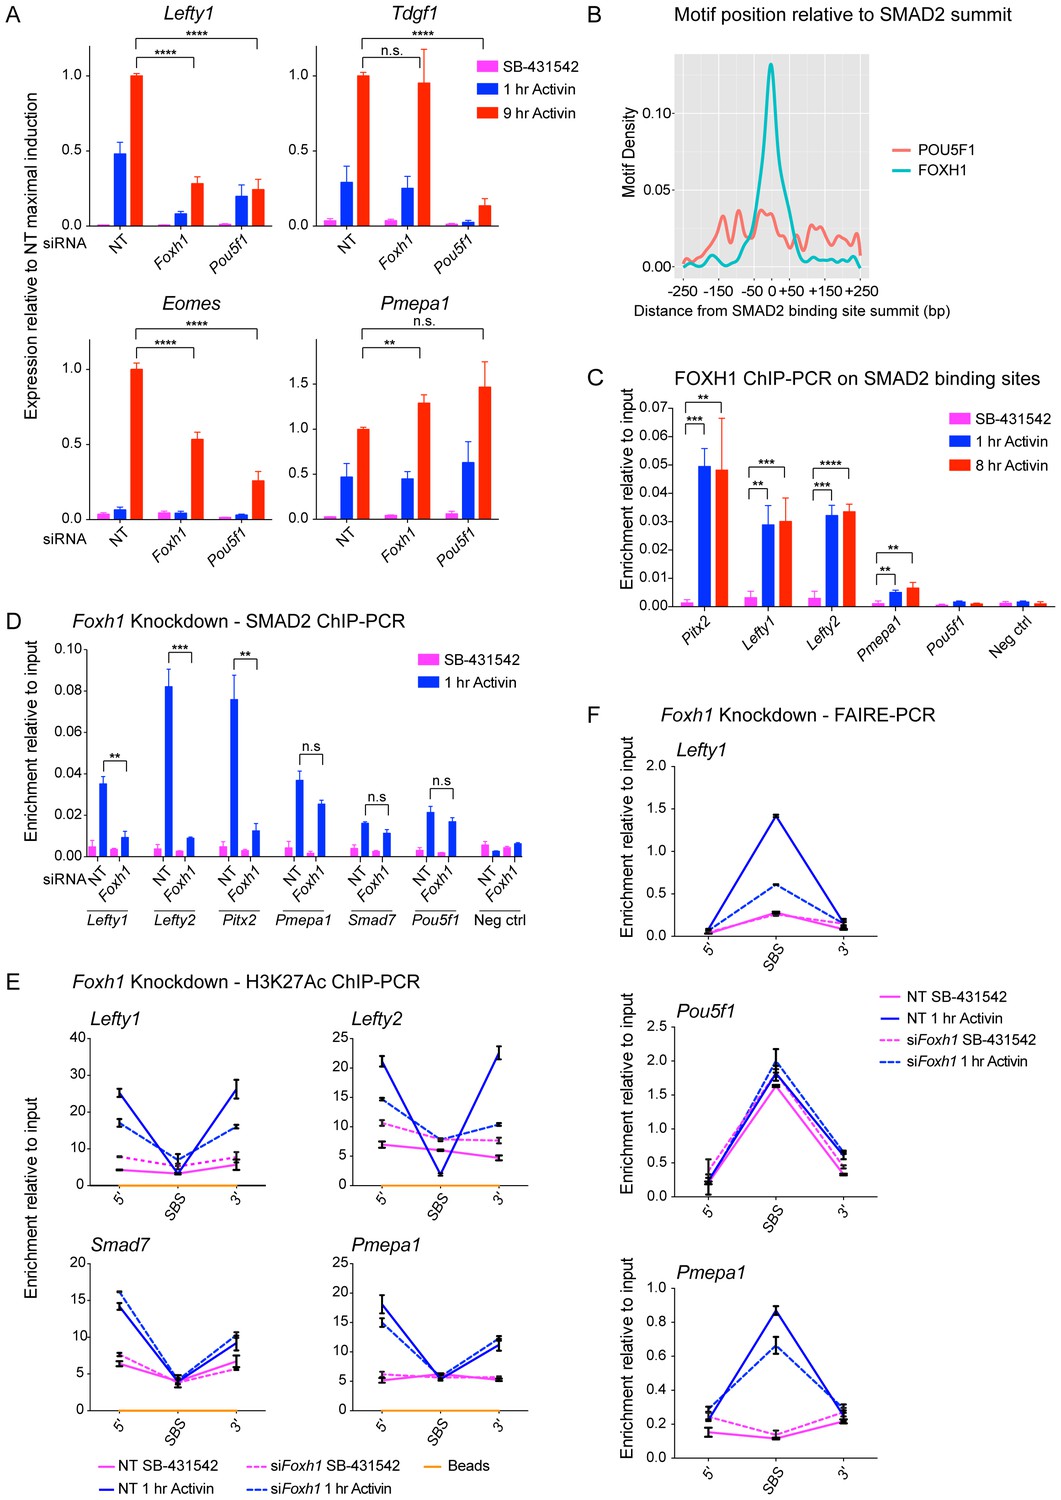
FOXH1 is required for SMAD2 recruitment and nucleosome remodeling at a subset of Activin target genes.
(A) P19 cells were transfected with siRNAs directed against either Pou5f1 or Foxh1, along with a non-targeting control (NT). Following signal inhibition or Activin induction, qPCR was performed for the genes shown. Plotted are the means and SEM of three independent experiments performed in duplicate of gene expression values normalized to endogenous Gapdh values. (B) The position of FOXH1 or POU5F1 motifs (regardless of orientation or strand) was plotted relative to the summit of all the peaks used in Figure 7—figure supplement 1A. (C) ChIP-PCR for FOXH1 at the indicated SBSs and negative control (Neg ctrl) region using P19 cells in the conditions shown. Plotted are the means and SEM of two independent experiments performed in duplicate. (D–F) P19 cells were transfected with either non-targeting (NT) or Foxh1 siRNAs, which were then signal inhibited (SB-431542) or stimulated with Activin for 1 hr after SB-431542 washout. They were assayed for SMAD2 ChIP-PCR (D), H3K27Ac ChIP-PCR (E) or FAIRE-PCR (F) on the selected SBSs indicated. Plotted in D are the means and SEM of three independent experiments. Neg ctrl, negative control. The data in E and F are from a representative experiment of three (means ± SD). See Figure 7—figure supplement 4 for the averages of the three experiments and the statistical analyses. In A, C and D, n.s., not significant; **** corresponds to a p value of < 0.0001; *** corresponds to p value of < 0.001; ** corresponds to a p value of < 0.01.
-
Figure 7—source data 1
The position of FOXH1 or POU5F1 motifs relative to the summit of all the consensus peaks.
- https://doi.org/10.7554/eLife.22474.022
Figure 7—figure supplement 1
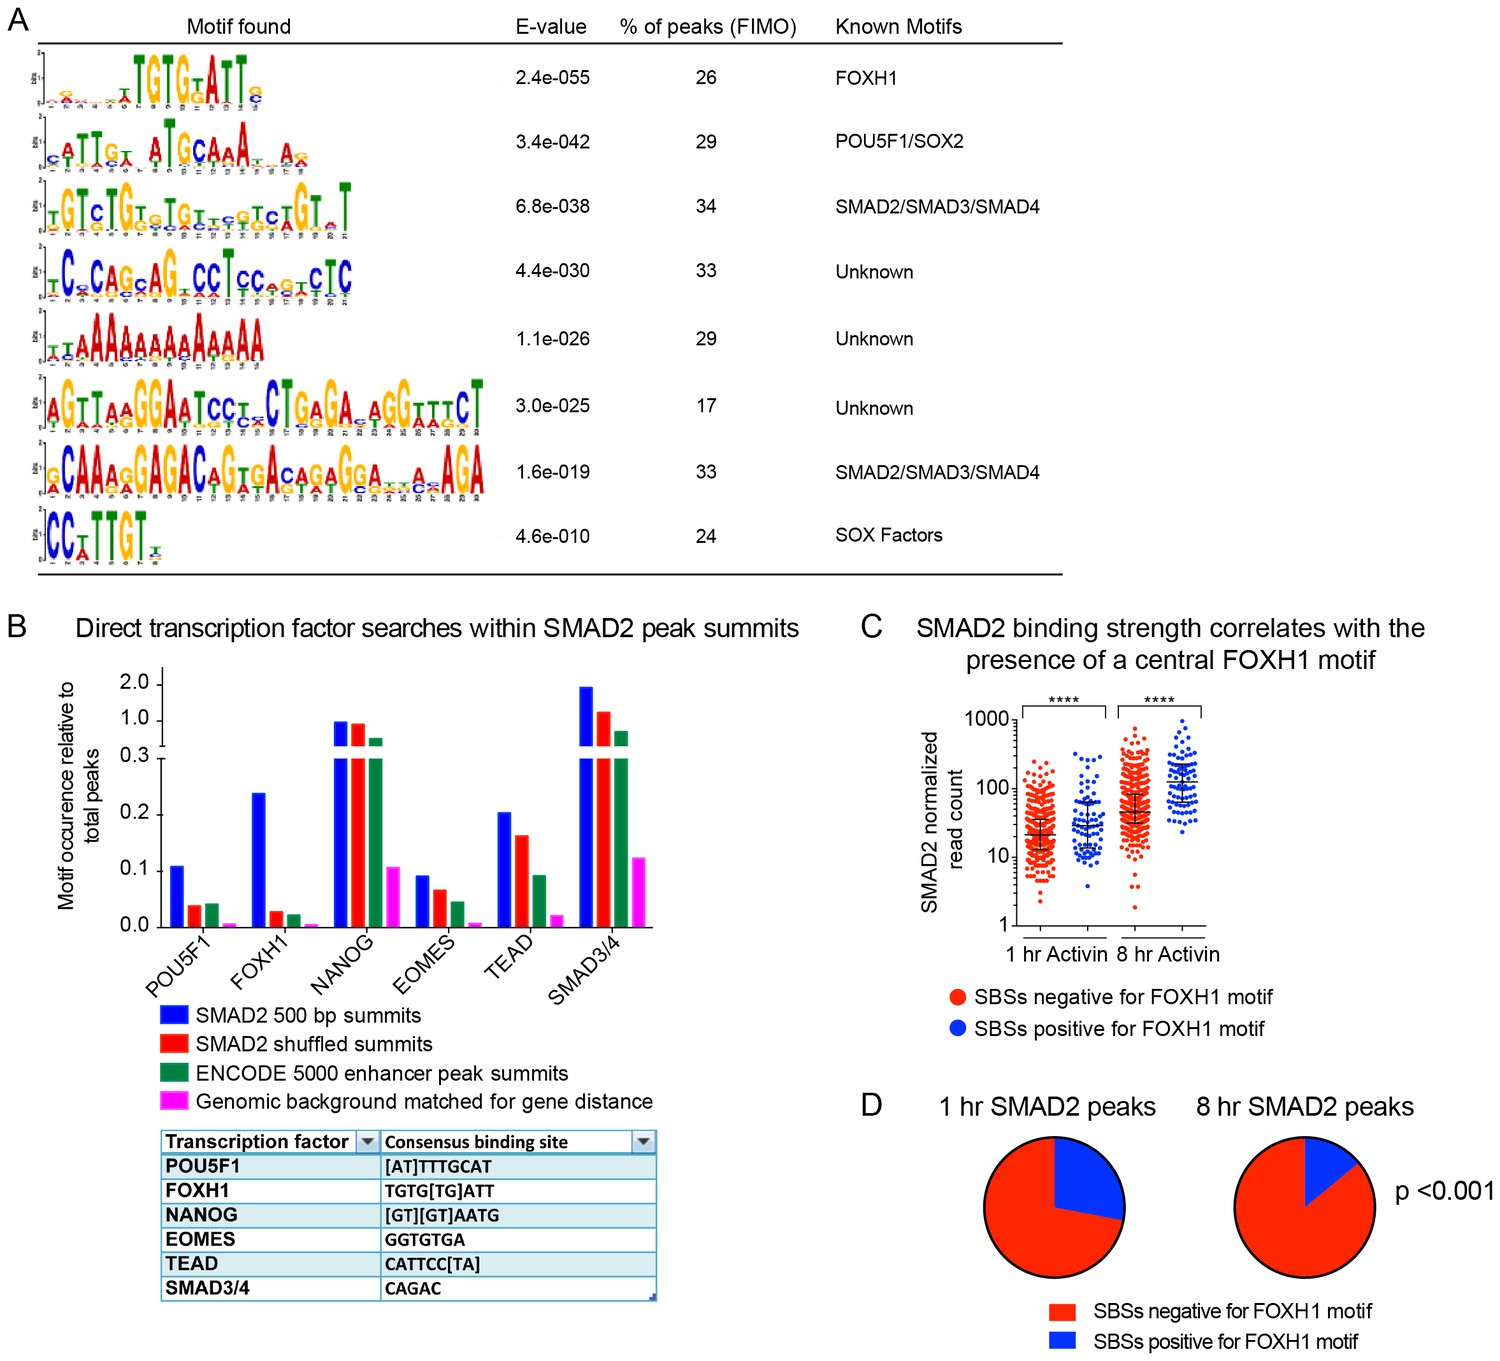
TF binding sites under SMAD2 peaks.
(A) The top most enriched known and de novo motifs as obtained from a MEME-ChIP analysis on all SMAD2 peaks in the high confidence dataset. From the 478 consensus peaks found surrounding regulated genes, the 500 bp summit of each contributing MACS peak was taken and submitted as input, comprising a total of 757 MACS peak summits. E-values, % of peaks containing the different motifs and matching TFs are indicated. (B) Directed motif searches using the Fuzznuc program were carried out on the 500 bp summits of 757 MACS peaks as in A. In the table (bottom) the search strings are displayed for POU5F1, FOXH1, NANOG, EOMES, TEAD and the SMAD binding element itself. The total motif identifications per factor are quantified relative to the total number of peaks in the input. The blue bar denotes the amount of motifs found in the SMAD2 target gene list, whilst the other three datasets represent different background datasets, see Methods for details. (C) The 478 SMAD2 consensus peaks were separated based on the presence (blue) or absence (red) of the FOXH1 motif in a 100 bp window centered on the consensus peak summit. FIMO software with standard settings was used to detect the FOXH1 motif. The SMAD2 read counts over consensus peaks in the two categories were plotted for the 1 hr and 8 hr Activin conditions. In all cases the black bars indicate the mean and 95% confidence interval. ****, p-value <0.0001. (D) The 478 SMAD2 consensus peaks were classified based on the presence of a contributing MACS peak at 1 hr or 8 hr of Activin treatment (see Supplementary file 1). For the two groups, the percentage of peaks which have a FOXH1 motif in a 100 bp window centered on the consensus peak summit is reported in blue. Note that this percentage is significantly different between the 1 hr group and the 8 hr group. The p-value was calculated using an un-paired Chi-square test, 95% confidence interval.
Figure 7—figure supplement 2

The role of FOXH1 in SMAD2-mediated transcription.
(A) For experiment shown in Figure 7A, where gene expression following siRNA-mediated knockdown of Foxh1 or Pou5f1 was assessed, qPCR was performed on the untreated samples to determine expression levels of Pou5f1 and Foxh1 itself, as quantified relative to endogenous Gapdh. Means ± SEM of three independent experiments performed in duplicate are shown. NT, non-targeting. (B) Lysates were collected from wild type P19 cells or P19 cells stably expressing MYC-tagged FOXH1, treated for the indicated times with either 20 ng/ml Activin and/or 10 µM SB-431542. Shown are Western blots for MYC, pSMAD2 and MCM6 (loading). Note that expression of MYC-FOXH1 does not alter the kinetics of pSMAD2 induction. (C) qPCR for Foxh1 was performed on samples collected from either wild type P19 cells or P19 cells stably expressing MYC-tagged FOXH1 as in (B), treated as indicated. Shown are expression levels of Foxh1 determined relative to Gapdh. Note that MYC-FOXH1 is expressed at roughly endogenous levels. A representative experiment (means ± SD) is shown. (D) ChIP-PCR for MYC-FOXH1 at the indicated SBSs and negative control (Neg ctrl) region using the P19 cells stably expressing MYC-tagged FOXH1 as in (B) in the conditions shown. A representative experiment (means ± SD) is shown. (E) qPCR for Foxh1 performed on non-targeting (NT) control or Foxh1 siRNA-transfected cells used for the experiments shown in Figure 7D–F to show the efficiency of knockdown. Values were normalized to endogenous Gapdh. A representative experiment (means ± SD) is shown. (F) A control H3K27Ac ChIP-PCR on the Gapdh TSS from the samples used in Figure 7E. A representative experiment (means ± SD) is shown.
Figure 7—figure supplement 3
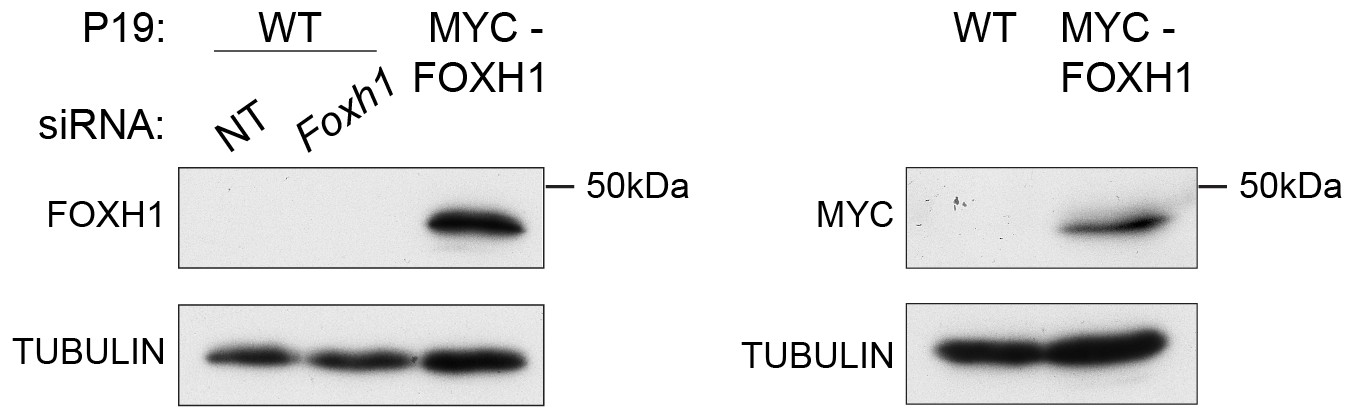
Characterization of the in-house anti FOXH1 antibody.
Lysates were collected from wild type P19 cells transfected with either non-targeting (NT) or Foxh1 siRNAs and from P19 cells stably expressing MYC-tagged FOXH1 (see Figure 7—figure supplement 2B–D). Shown are Western blots for FOXH1, MYC and TUBULIN (loading). Note that a band at the predicted molecular size of FOXH1 is detected in the P19 MYC-FOXH1 sample when incubating the blot with either the in-house anti FOXH1 antibody (left panel) or an anti MYC antibody (right panel). No bands are detected in wild type P19 samples by anti FOXH1 in-house antibody. Thus the in house anti FOXH1 antibody detects MYC-tagged FOXH1, but not endogenous FOXH1 in Western blot analysis.
Figure 7—figure supplement 4
The role of FOXH1 in SMAD2-mediated chromatin remodeling.
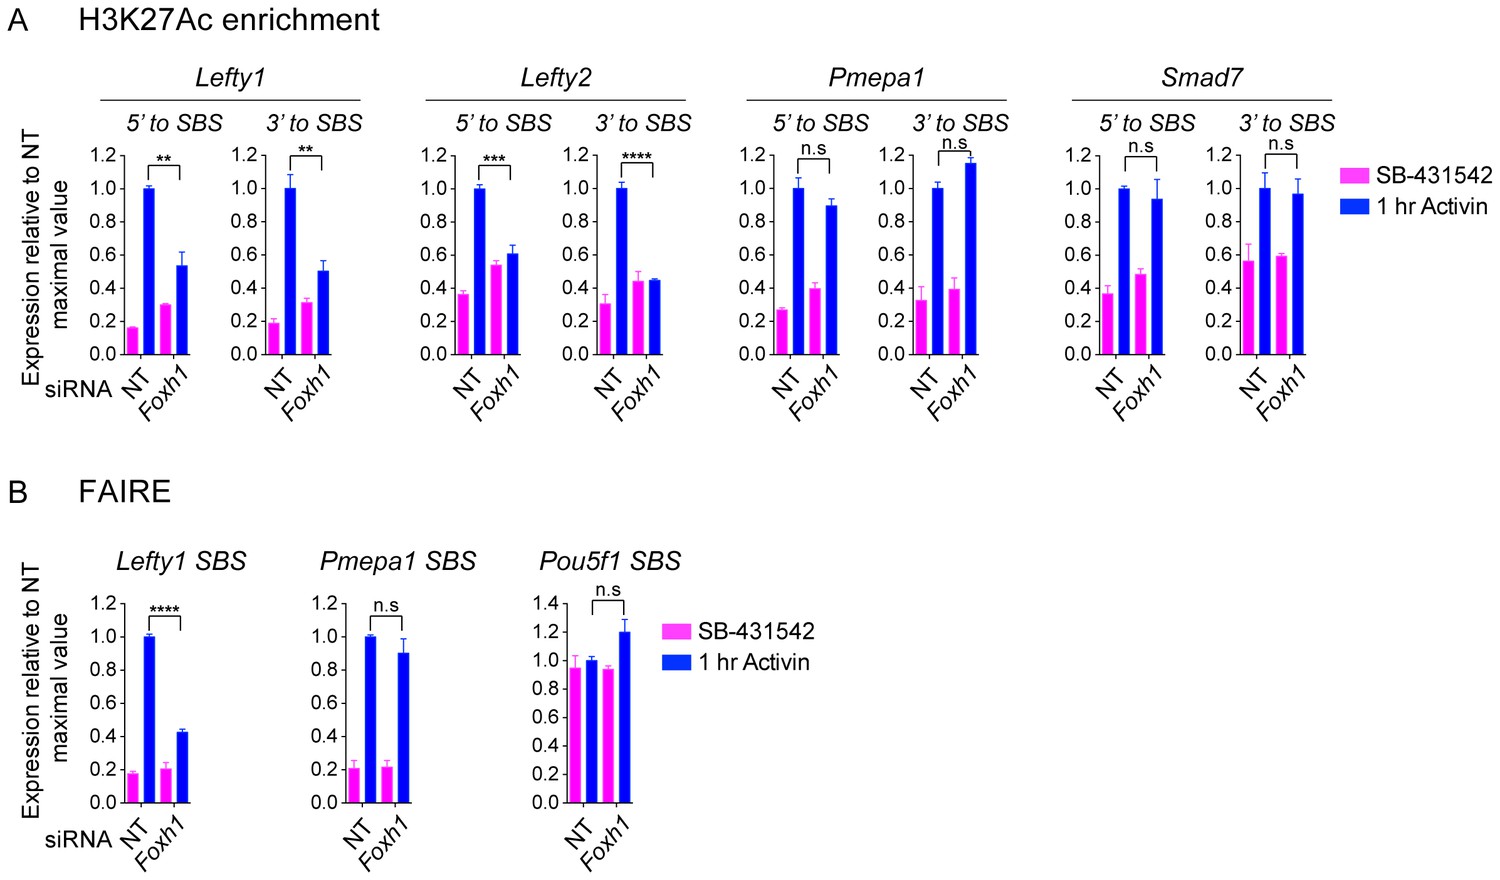
(A and B) P19 cells were transfected with either non-targeting (NT) or Foxh1 siRNAs, and were then signal inhibited (SB-431542) or stimulated with Activin for 1 hr after SB-431542 washout. The nucleosomes flanking or at selected SBSs were assayed for H3K27Ac enrichment by ChIP-PCR (A) or assayed for FAIRE-PCR (B). Plotted are the means and SEM of three independent experiments performed in duplicate. n.s., not significant. **** corresponds to a p value of < 0.0001, *** corresponds to a p value of < 0.001, ** corresponds to a p value of < 0.01.
Figure 8 with 1 supplement
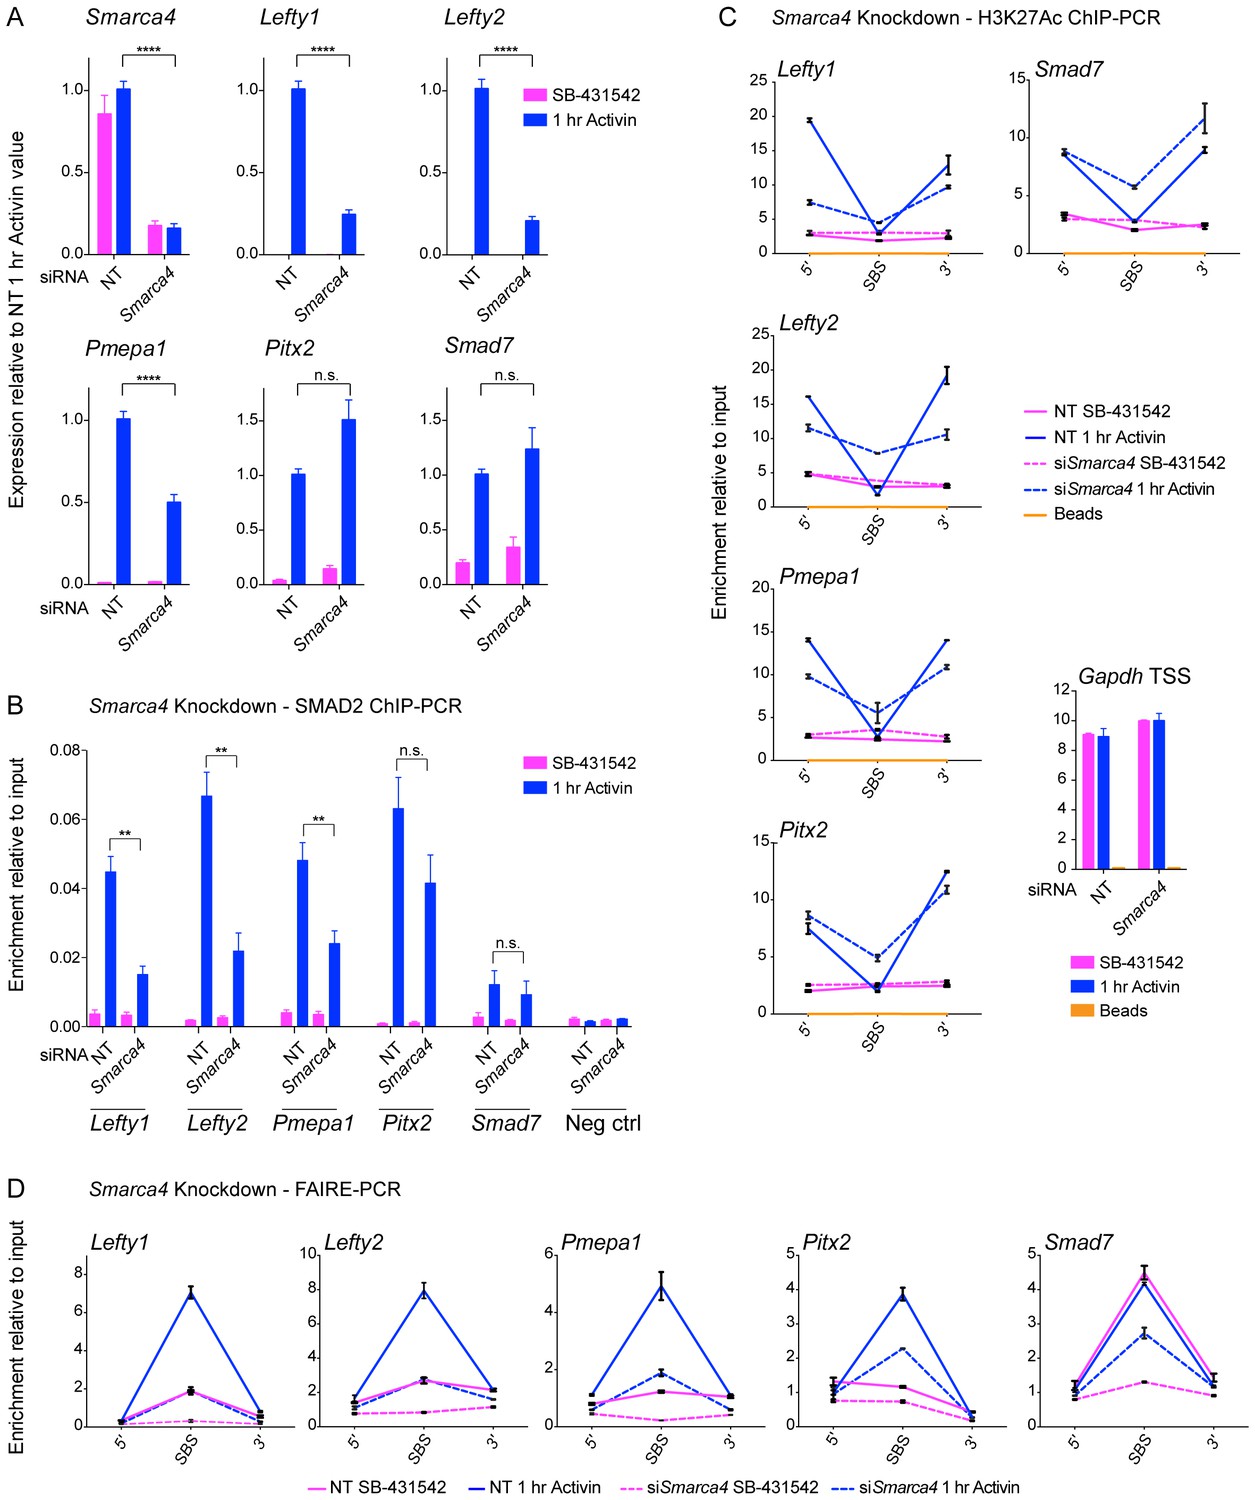
SMARCA4 is required for SMAD2 binding, nucleosome eviction and histone acetylation at a subset of Activin target genes.
(A) P19 cells were transfected with either non-targeting (NT) or Smarca4 siRNAs. Cells were then signal inhibited (SB-431542) or stimulated with Activin for 1 hr after SB-431542 washout. They were assayed for transcription by qPCR. The data shown are means ± SEM from four independent experiments. (B–D). Samples were prepared as for A and assayed for SMAD2 ChIP-PCR (B), H3K27Ac ChIP-PCR (C), or FAIRE-PCR (D) on the selected SBSs indicated. Plotted in B are the means and SEM of four independent experiments. Neg ctrl, negative control. The data in C and D are from a representative experiment of three (means ± SD). See Figure 8—figure supplement 1 for the averages of the three experiments and the statistical analyses. In A and B, **** corresponds to a p value of < 0.0001. ** corresponds to a p value of < 0.01; n.s., not significant.
Figure 8—figure supplement 1

The role of SMARCA4 in SMAD2-mediated chromatin remodeling.
(A and B) P19 cells were transfected with either non-targeting (NT) or Smarca4 siRNAs, and were then signal inhibited (SB-431542), or stimulated with Activin for 1 hr after SB-431542 washout. The nucleosomes flanking or at selected SBSs were assayed for H3K27Ac enrichment by ChIP-PCR (A) or assayed for FAIRE-PCR (B). Plotted are the means and SEM of three independent experiments performed in duplicate. n.s., not significant. **** corresponds to a p value <0.0001, *** corresponds to a p value of < 0.001, ** corresponds to a p value of < 0.01.
Figure 9

A model of dynamic SMAD2-dependent transcription.
The two modes of SMAD2 binding to either acetylated (green diamonds) nucleosome-depleted chromatin or closed, non-acetylated chromatin marked by H3K4Me1 (blue diamonds) upon Activin stimulation from the SB-431542 state are depicted. SMAD2 binds in conjunction with FOXH1 at some targets or with distinct TFs at others. Once bound, SMAD2-containing complexes locally increase H3K27Ac and H3K9Ac via recruitment of HATs, and can induce nucleosome displacement, which for ‘baseline off’ genes requires SMARCA4. Upon sustained signaling, SMAD2 may be recruited to new targets in a delayed manner or already-bound SMAD2 may recruit repressors to dampen or inhibit transcription at later time points.
Author response image 1

24 hr and 48 hr of Activin treatment partially recapitulate the untreated condition for pathway activation and induction of target genes.
(A) Western blot for pSMAD2, SMAD2/3 and TUBULIN (loading control) on lysates collected from cells treated overnight with SB-431542, followed by washout and stimulation for the indicated times with the concentrations of Activin shown, or left untreated from plating to harvest (48 hr). (B) qPCR on samples treated as in (A) for representative target genes. Plotted are the means and SEM of three independent experiments performed in duplicate. *** corresponds to a p-value of < 0.001; ** corresponds to a p-value of < 0.01; n.s., non-significant.
Author response image 2
Author response image 3
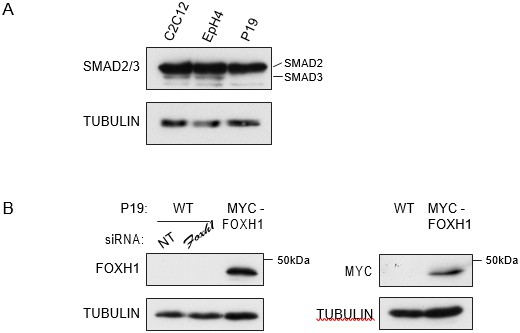
A) P19 cells express low level of SMAD3.Western blot for SMAD2/3 and TUBULIN (loading control) on lysates collected from three different mouse cell lines, the myoblast line, C2C12, the mammary epithelial cell line, EpH4 and P19 cells.
Note that P19 cells express similar level of SMAD2 compared to the others cell lines, but undetectable levels of SMAD3. B) Characterization of the in house FOXH1 antibody. Lysates were collected from wild type P19 cells transfected with either non-targeting (NT) or Foxh1 siRNAs and from P19 cells stably expressing MYC-tagged FOXH1 (see Figure 7—figure supplement 2B–D). Shown are Western blots for FOXH1, MYC and TUBULIN (loading). Note that a band at the predicted molecular weight of FOXH1 is detected in the P19 MYC-FOXH1 sample when incubating the blot with either anti FOXH1 in-house antibody (left panel) or anti MYC antibody (right panel). Note that the levels of endogenous FOXH1 are below the threshold of detection in Western blots for the anti FOXH1 in-house antibody.
Additional files
-
Supplementary file 1
RNA-seq and ChIP-seq datasets.
- https://doi.org/10.7554/eLife.22474.030
-
Supplementary file 2
Gene set enrichment analysis
- https://doi.org/10.7554/eLife.22474.031
-
Supplementary file 3
List of reagents used in the study.
- https://doi.org/10.7554/eLife.22474.032
Download links
A two-part list of links to download the article, or parts of the article, in various formats.
Downloads (link to download the article as PDF)
Open citations (links to open the citations from this article in various online reference manager services)
Cite this article (links to download the citations from this article in formats compatible with various reference manager tools)
Distinct modes of SMAD2 chromatin binding and remodeling shape the transcriptional response to NODAL/Activin signaling
eLife 6:e22474.
https://doi.org/10.7554/eLife.22474


