Co-option of an endogenous retrovirus envelope for host defense in hominid ancestors
- The Rockefeller University, United States
- MRC-University of Glasgow Centre for Virus Research, United Kingdom
- Howard Hughes Medical Institute, The Rockefeller University, United States
Figures
Figure 1 with 2 supplements

Functional reconstruction of a ~32 MY old HERV-T envelope protein.
(A) Phylogenetic tree of HERV-T3 proviral sequences in OWM and apes. Orthologous sequences are bracketed and estimated integration times indicated. * >90% bootstrap support. Red circle = ancestral root node. (B) Ancestral HERV-T3 genome with ORFs indicated. (C) Infectivity of MLV particles containing a GFP reporter and pseudotyped with the ancHTenv protein (Mean ± SD, n = 3 replicates). See also Figure 1—figure supplements 1–2.
-
Figure 1—source data 1
HERV-T elements in OWM and ape genomes.
Type: HERV-T1, HERV-T2 or HERV-T3. Start and end: coordinates in the genome scaffold. Strand: orientation of the provirus. Assembly: identifier of the genome assembly used for the screening procedure. Scaffold: identifier of the nucleotide sequence where the provirus lies. Proviral structure: coding and non-coding features present in each provirus, shown in the order they occur (LEA=leader sequence). Divergence: substitutions per site. Age: estimate of element age (i.e. time since integration) in millions of years, based on comparison of 3’ and 5’ LTRs (for proviruses that encoded paired LTRs) or comparison to a clade-specific LTR consensus sequence (for solo LTRs). ND: non-determined. Proviruses highlighted in green correspond to the sequences used in the ancestral reconstruction of HERV-T3.
- https://doi.org/10.7554/eLife.22519.004
Figure 1—figure supplement 1
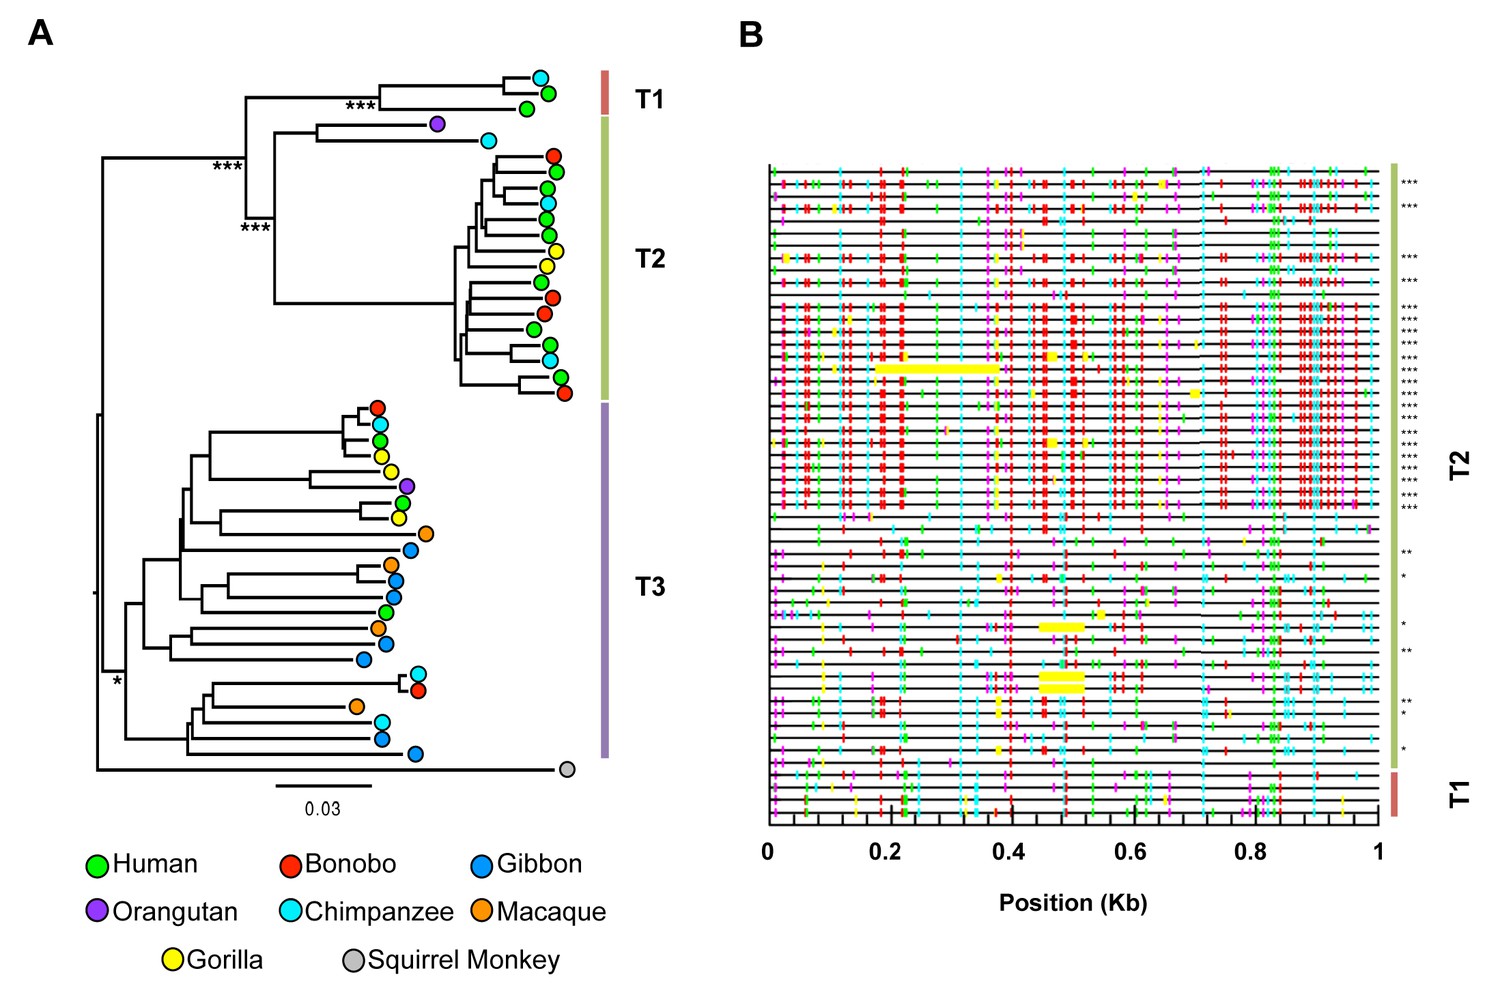
HERV-T proviruses cluster into four monophyletic clades.
(A) Maximum likelihood phylogenetic tree of 44 HERV-T proviruses. Three distinct clades in OWM and apes (HERV-T1, HERV-T2 and HERV-T3) are indicated by colored blocks. HERV-T1 had LTRs that shared 64% and 55% identity with HERV-T2 and HERV-T3 s respectively. The tree was rooted using a related outgroup sequence from the squirrel monkey (Saimiri boliviensis). Bootstrap support for internal nodes is indicated by asterisks: (*)>80%, (***)>99% (1000 bootstrap replicates). The temporal appearance of these HERV-T-like integrations and the geographical separation of the platyrrhini and catarrhini primate lineages, suggest that platyrrhini and catarrhini HERV-T-like sequences most likely result from independent germ line invasion events. (B) Proviral sequences were aligned to a consensus HERV-T sequence and analysed using Hypermut 2.0 with default parameters. Image corresponds to nucleotides 6877 to 7876 spanning the junction of the pol and env genes. Lines in red, cyan green and magenta represent (GG to AG, GA to AA, GC to AC and GT to AT transitions, respectively). Asterisks indicate statistical significance in a fisher-exact test for APOBEC3-mediated hypermutation. (*) p-value<0.05, (**) p-value<0.01, (***) p-value<0.001.
Figure 1—figure supplement 2
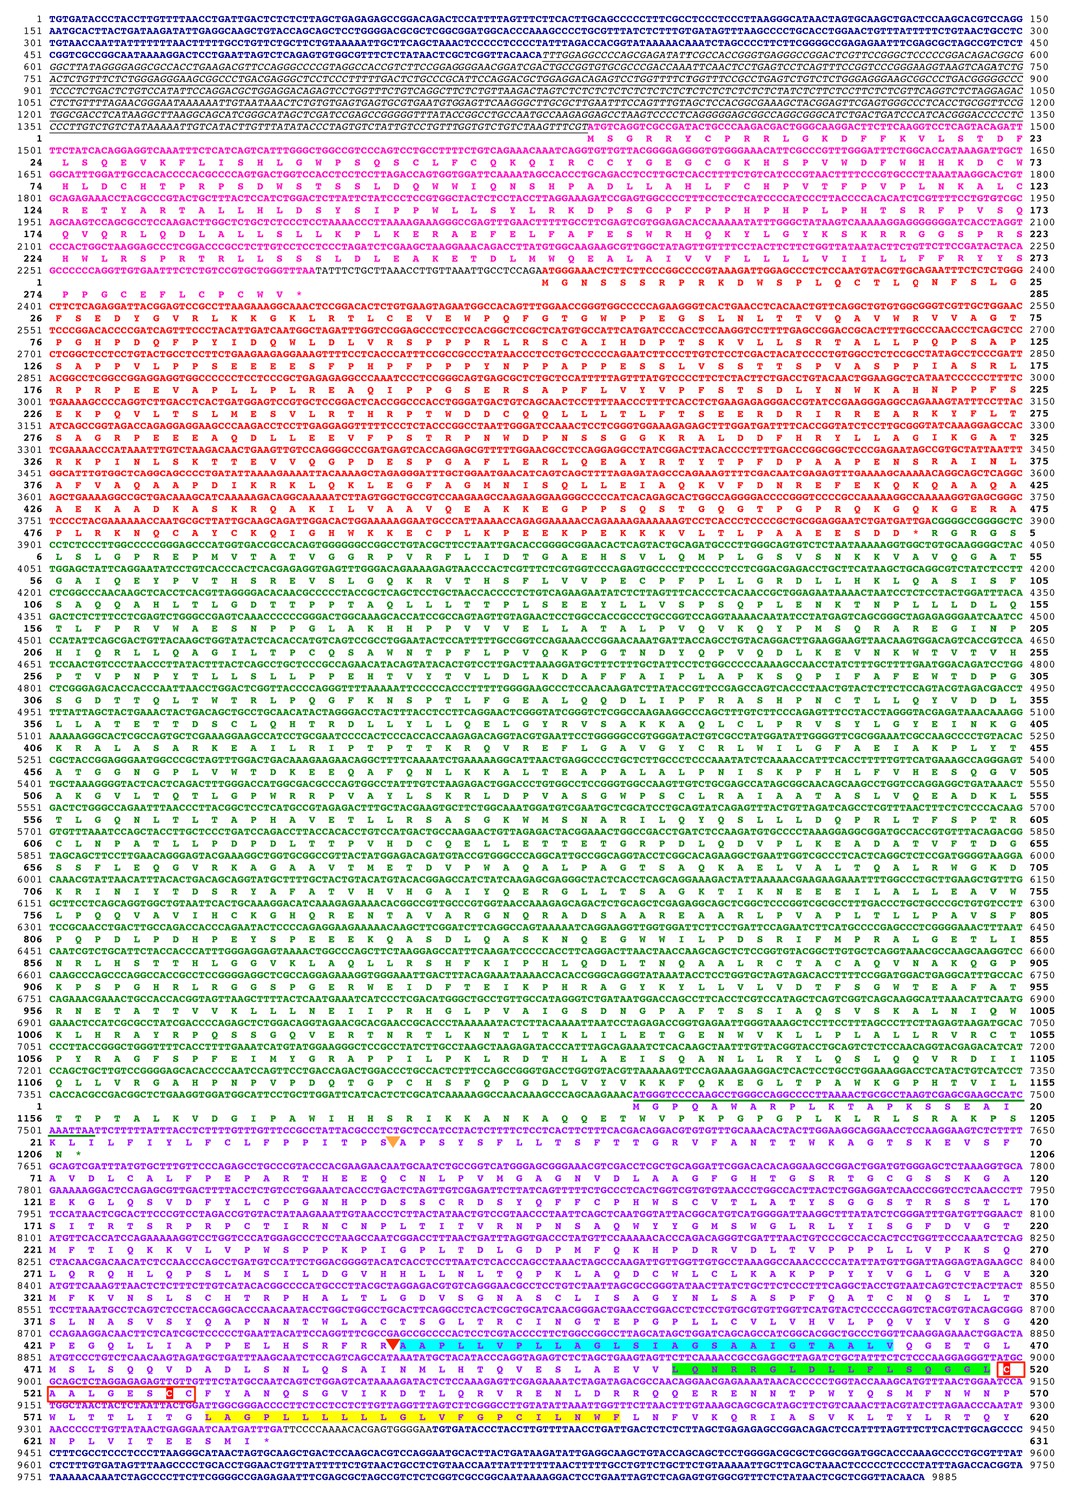
Deduced sequence of a 32MY old ancestral HERV-T3.
Nucleotide and translated amino acid sequence of the reconstructed ancestral HERV-T3 sequence. LTRs are shown in deep blue and bold. The leader sequence is shown in italics and underlined. The pre-gag, gag, pol and env ORFs are indicated in pink, red, green and purple color, respectively. Underlined in green is the sequence overlap between pol and env. The predicted signal peptide and furin cleavage sites are indicated by orange and red triangles, respectively. The predicted fusion peptide, immunosuppressive and transmembrane domains are highlighted in cyan, green and yellow, respectively. The CX6CC motif is indicated with a red box, and the cysteine residues involved in the disulfide-bonded loop are highlighted in red. Cleavage sites were predicted using ProP 1.0.
Figure 2 with 1 supplement
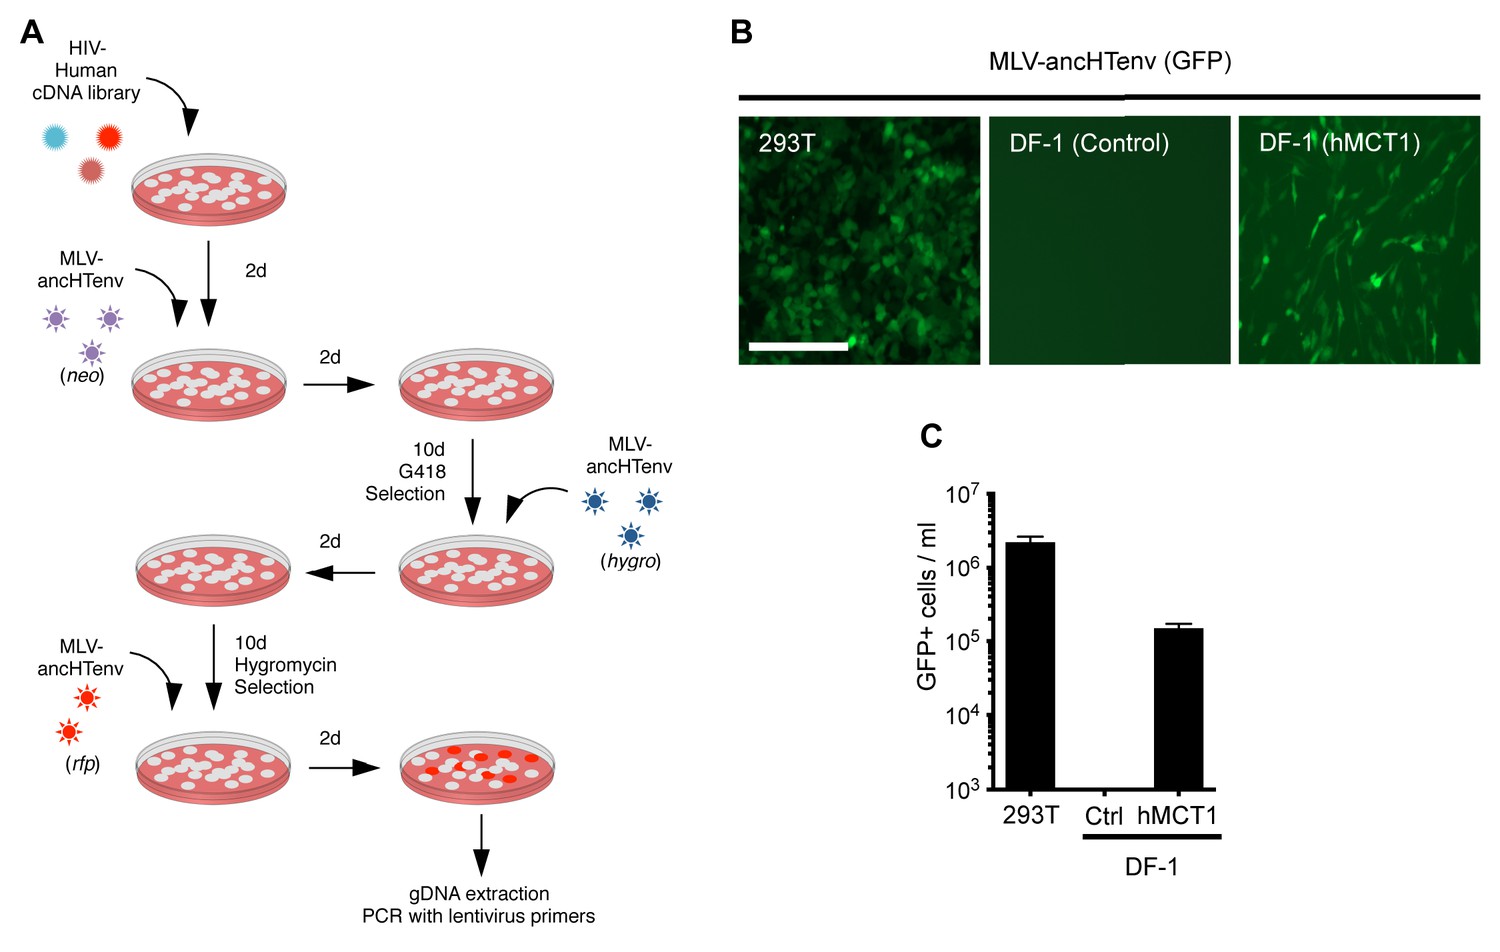
MCT-1 functions as a receptor for ancestral HERV-T.
(A) Scheme of the receptor screening strategy. DF-1 cells were transduced with a lentiviral cDNA library. Two days later, the cells were challenged with MLV-ancHTenv containing a neo gene. After a further two days, cells were placed in G418 selection. After another 10 days, G418-resistant cells were replated and challenged with MLV-ancHTenv containing a hygromycin resistance gene. Two days later cells were placed in hygromycin selection. After a further 10 days, Hygromycin-resistant cells were replated and challenged with MLV-ancHTenv containing RFP and were found to be highly susceptible to infection (Figure 2—figure supplement 1A). Genomic DNA (gDNA) was extracted from this cell population and subjected to PCR using primers specific to the lentiviral vector (Figure 2—figure supplement 1B). (B) Fluorescent micrographs of 293T and DF-1 cells, expressing hMCT1 or a control protein, following infection with MLV-ancHTenv expressing GFP as reporter. Scale bar = 200 μm. (C) Titers of MLV-ancHTenv/GFP on 293T and DF-1 cells expressing hMCT1 or a control protein (Mean ± SD, n = 2 replicates, one of two separate experiments).
Figure 2—figure supplement 1
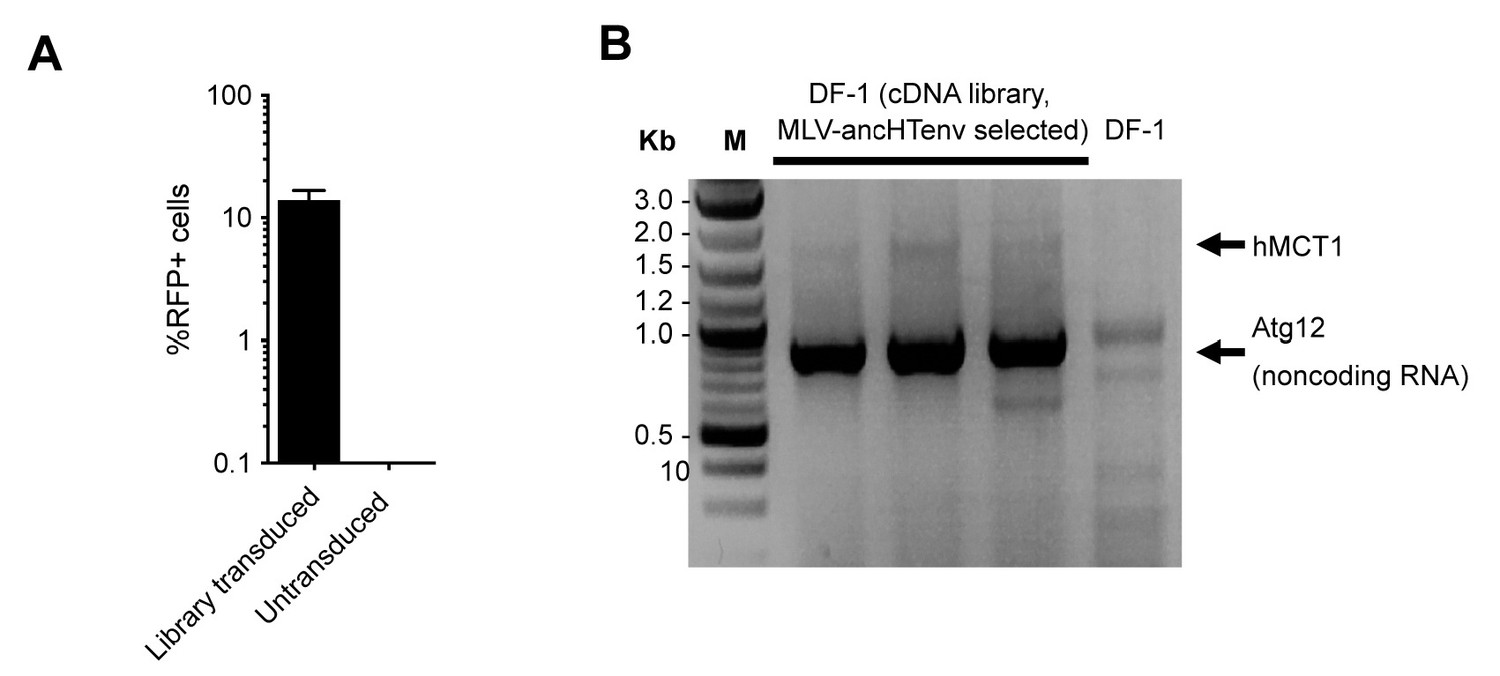
HERV-T receptor identification.
(A) Relative MLV-ancHTenv/RFP sensitivity of library transduced (Mean ± SD, n = 3 separate pools of cells assayed once each), and untransduced DF1 cells subjected to the infection selection strategy outlined in (Figure 2A). (B) Products of PCR reactions from three RFP positive DF-1 cell populations, and control DF-1 cells.
Figure 3

Binding of ancHTenv-pseudotyped MLV particles to DF1 cells expressing MCT1.
(A) Fluorescent micrographs of MLV Gag-GFP VLPs pseudotyped with ancHTenv or ecotropic MLV, bound to DF-1 cells expressing hMCT1 or an empty vector. Scale bar = 5 μm. (B) Enumeration of MLV Gag-GFP VLPs bearing the indicated Env proteins bound to DF-1 cells expressing MCT-1 or an empty vector. Each data point represents an individual cell (n = 20 for each condition).
Figure 4 with 1 supplement
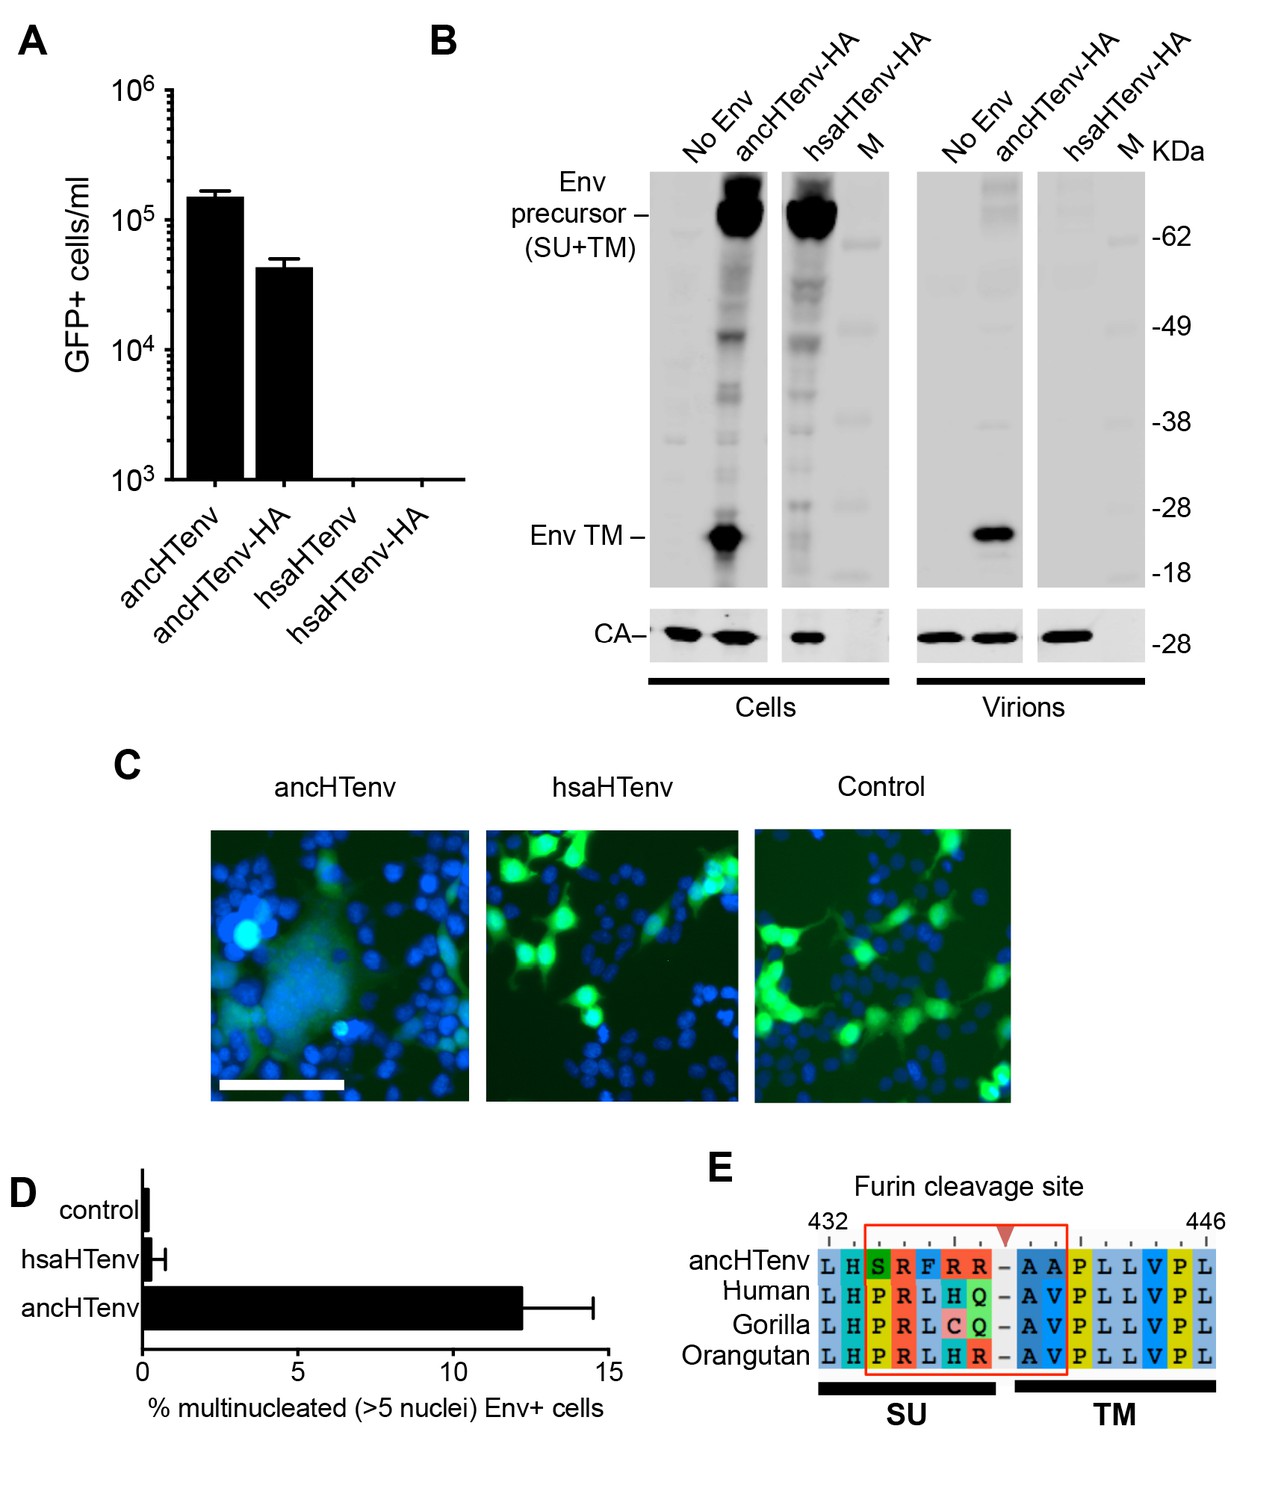
The human genome encodes a HERV-T Env ORF that does not function as a retroviral envelope.
(A) Infectiousness of MLV particles pseudotyped with untagged or C-terminally HA-tagged ancHTenv or hsaHTenv (Mean ± SD, n = 3 replicates, one of two experiments). (B) Western blot analyses (α-CA and α-HA) of cell lysates and MLV virions generated following expression of C-terminally HA-tagged ancHTenv or hsaHTenv M: markers. (C) Examples of cell fusion in 293T cell cultures expressing ancHTenv or hsaHTenv linked to IRES-GFP. Scale bar = 100 μm. (D) Percentage of GFP+ multinucleated cells (>5 nuclei/cell) in 293T cell cultures expressing ancHTenv or hsaHTenv linked to IRES-GFP (Mean ± SD, n = 3 groups of ten microscopic fields, one of two experiments) Blue: DAPI. (E) Alignment of ancHTenv and intact or nearly intact HERV-T Env protein sequences encoded by hominid genomes, proximal to the furin cleavage site. See also Figure 4—figure supplement 1.
Figure 4—figure supplement 1
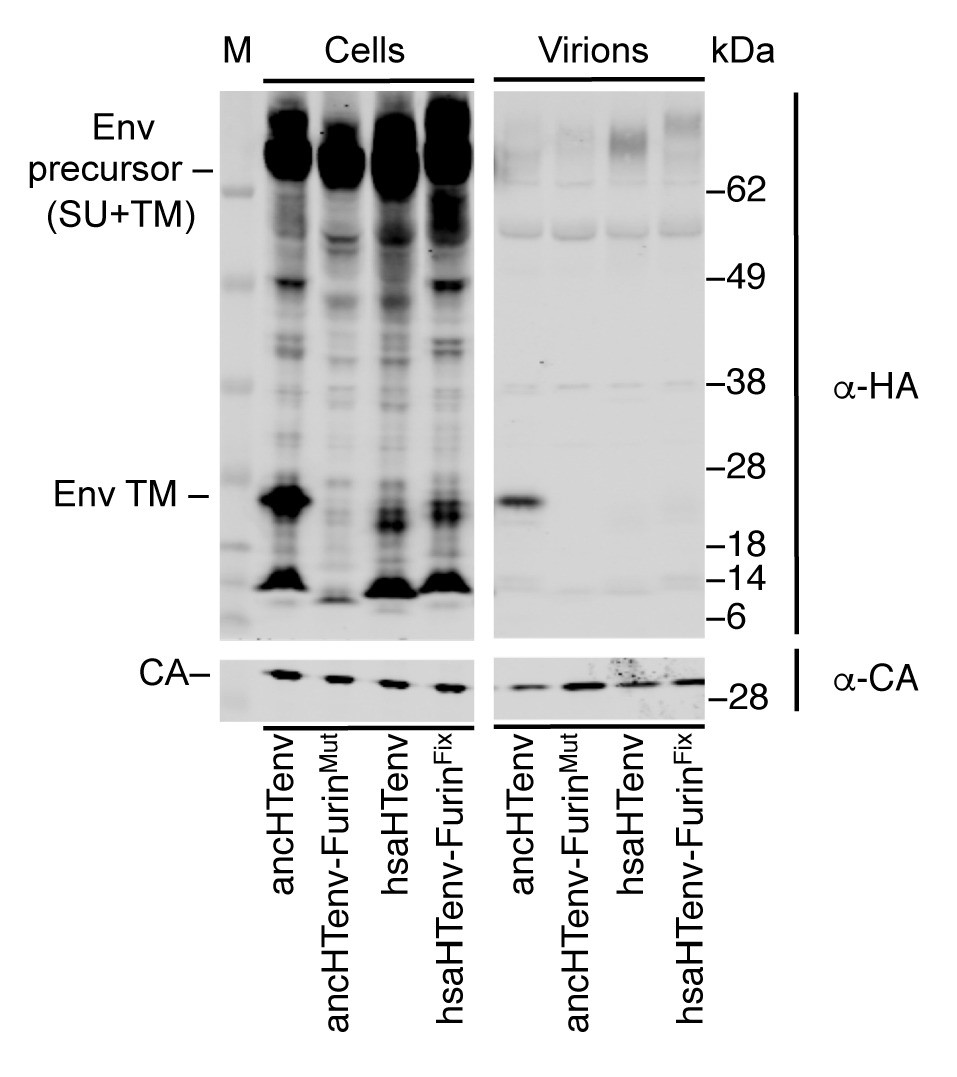
Effects of mutations at the furin cleavage site on ancHTenv and hsaHTenv processing.
Western blot (anti-CA and anti-HA) analyses of cell lysates and virions following expression of MLV Gag-Pol and HA-tagged ancHTenv, hsaHTenv, or furin cleavage site-modified derivatives. AncHTenv-FurinMut contains the furin cleavage site residues from hsaHTenv. HsaHTenv-FurinFix contains the furin cleavage site residues from ancHTenv. M= molecular weight markers.
Figure 5
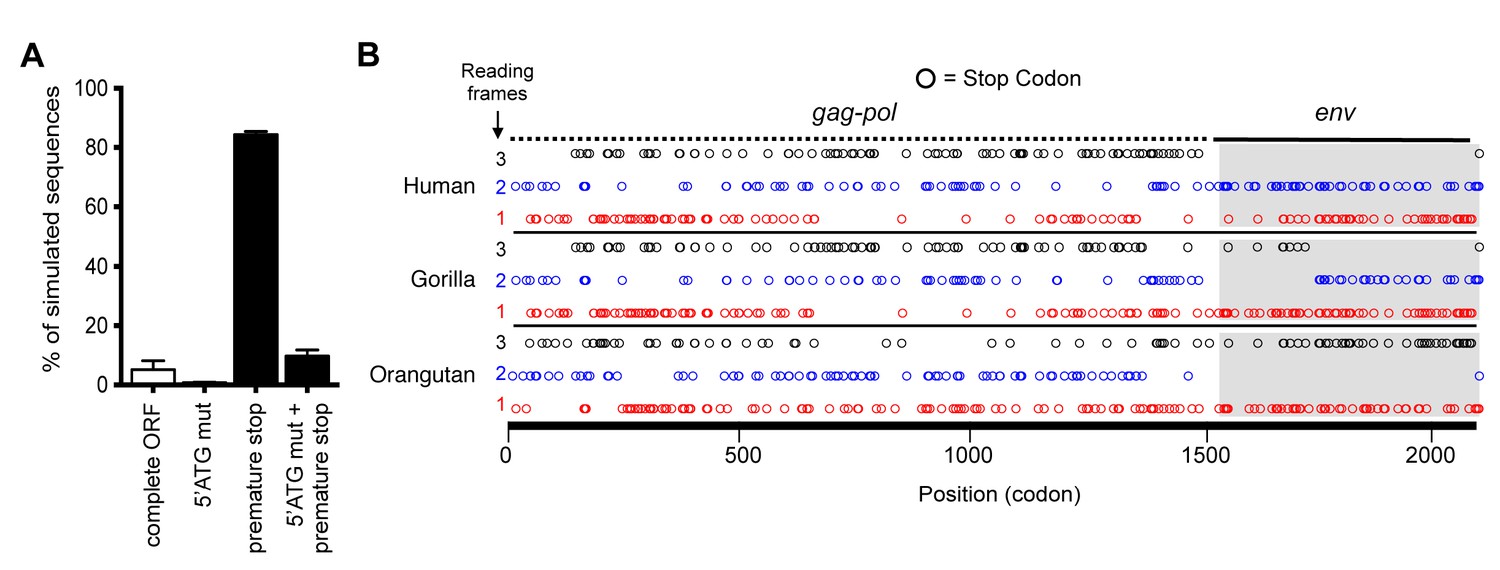
Preservation of hsaHTenv and its orthologs in hominids.
(A) Monte-Carlo simulations of ancHTenv16MYA evolution for 13.45–19.68 MY using a human neutral substitution rate. The percentage of 10,000 simulated sequences of each type is plotted with error bars indicating maximum and minimum estimates. (B) Distribution of stop codons (colored circles) in the Gag, Pol and Env coding sequence of proviruses orthologous to the HERV-T provirus containing hsaHTenv.
Figure 6 with 1 supplement
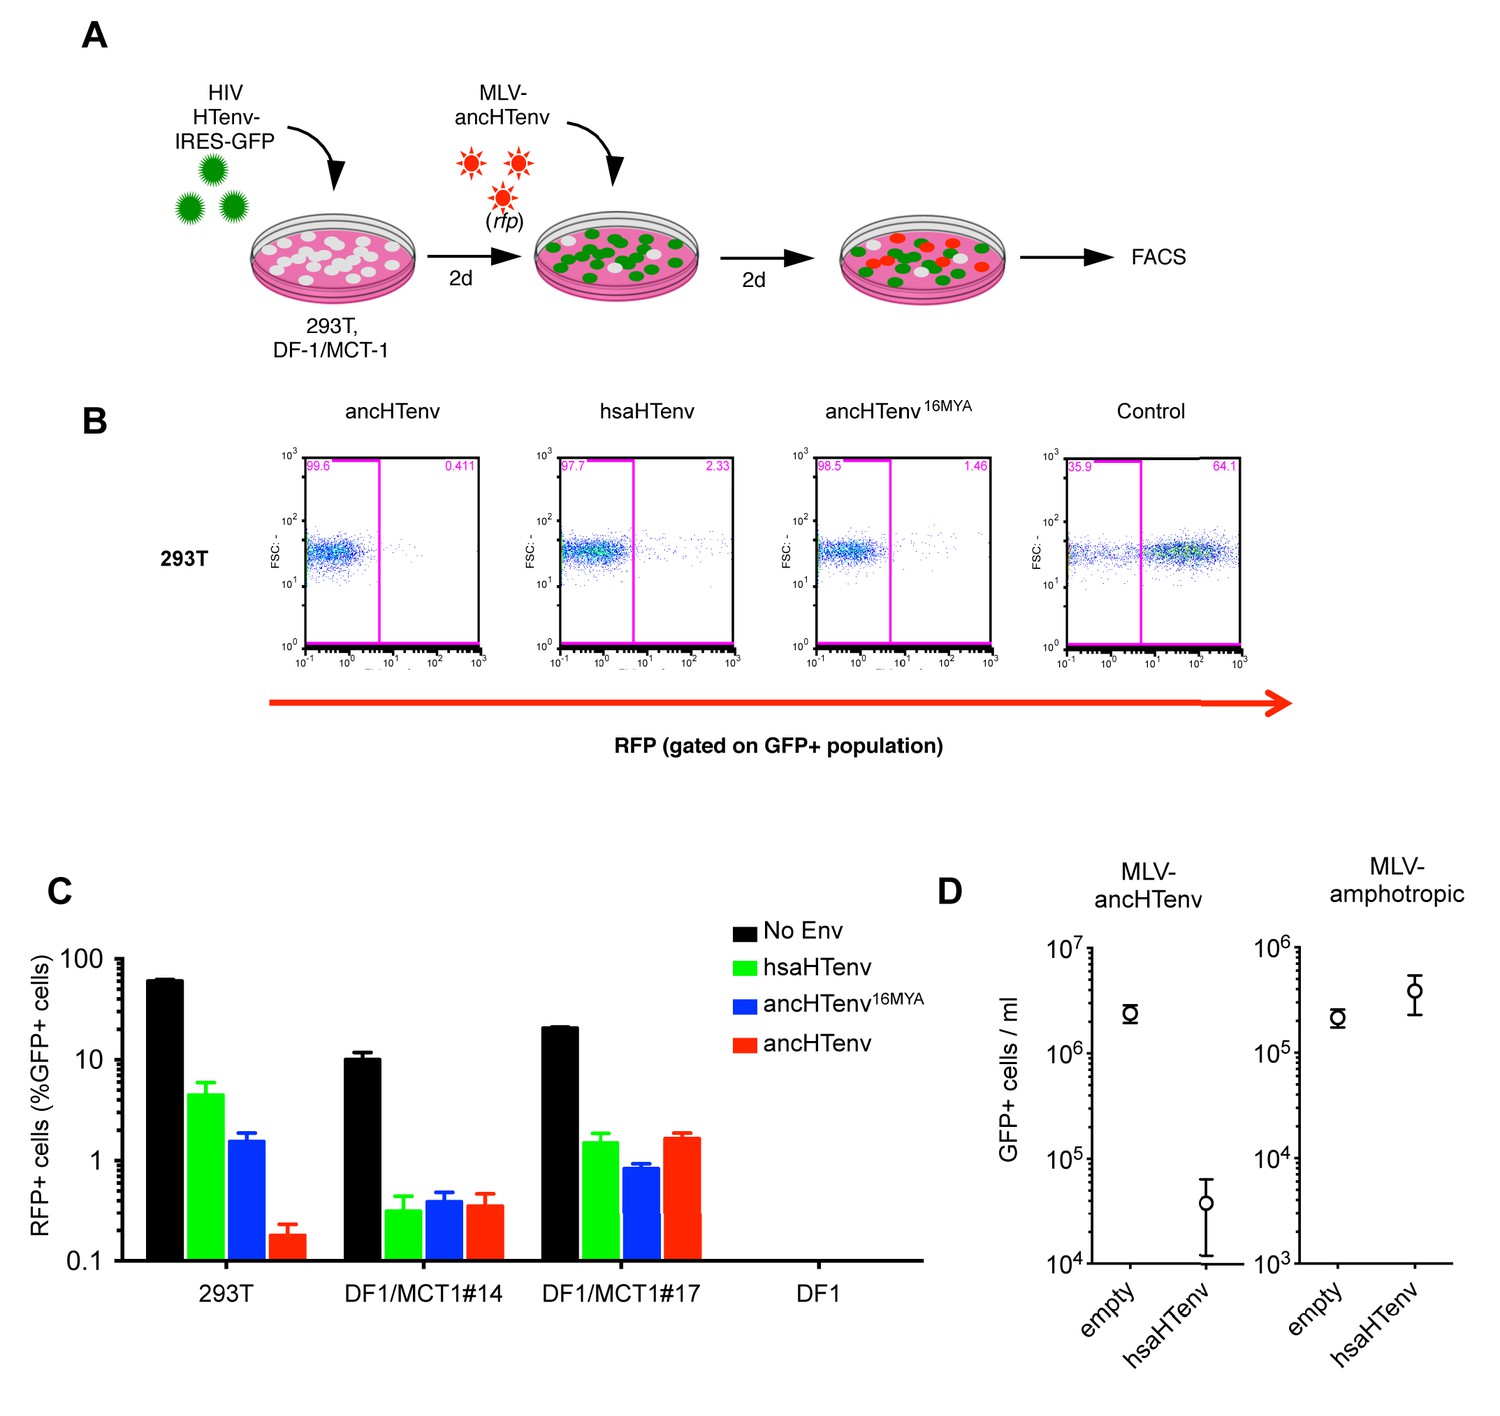
The hsaHTenv protein specifically inhibits HERV-T infection.
(A) Scheme of the antiviral assay. Cells, 293T or DF-1 expressing hMCT1, were transduced with lentiviral vectors expressing HERV-T Env proteins or an unrelated protein (No Env) together with a GFP reporter gene to monitor expression. Cells were challenged with MLV particles pseudotyped with ancHTenv that expresses RFP upon infection. Cell populations were analyzed by FACS 2 days after infection. (B) Representative experiment based on the scheme depicted in (A) conducted using 293T cells expressing the indicated Env proteins. (C) Infectivity of MLV-ancHTenv on 293T cells or two clones of MCT1-expressing DF1 cells (#14, #17), expressing HERV-T envelope proteins according to the scheme described in (A). Plots describe the percentage of RFP positive cells (infected) after gating on the GFP positive (Env-expressing) cell population. (Mean ± SD, n = 3 independent experiments). (D) Susceptibility of clones of 293T cells expressing an empty vector or hsaHTenv-HA to infection by MLV-ancHTenv/GFP or amphotropic MLV/GFP (Mean ± SD, n = 3 three independent single cell clones assayed once each). See also Figure 6—figure supplement 1.
Figure 6—figure supplement 1
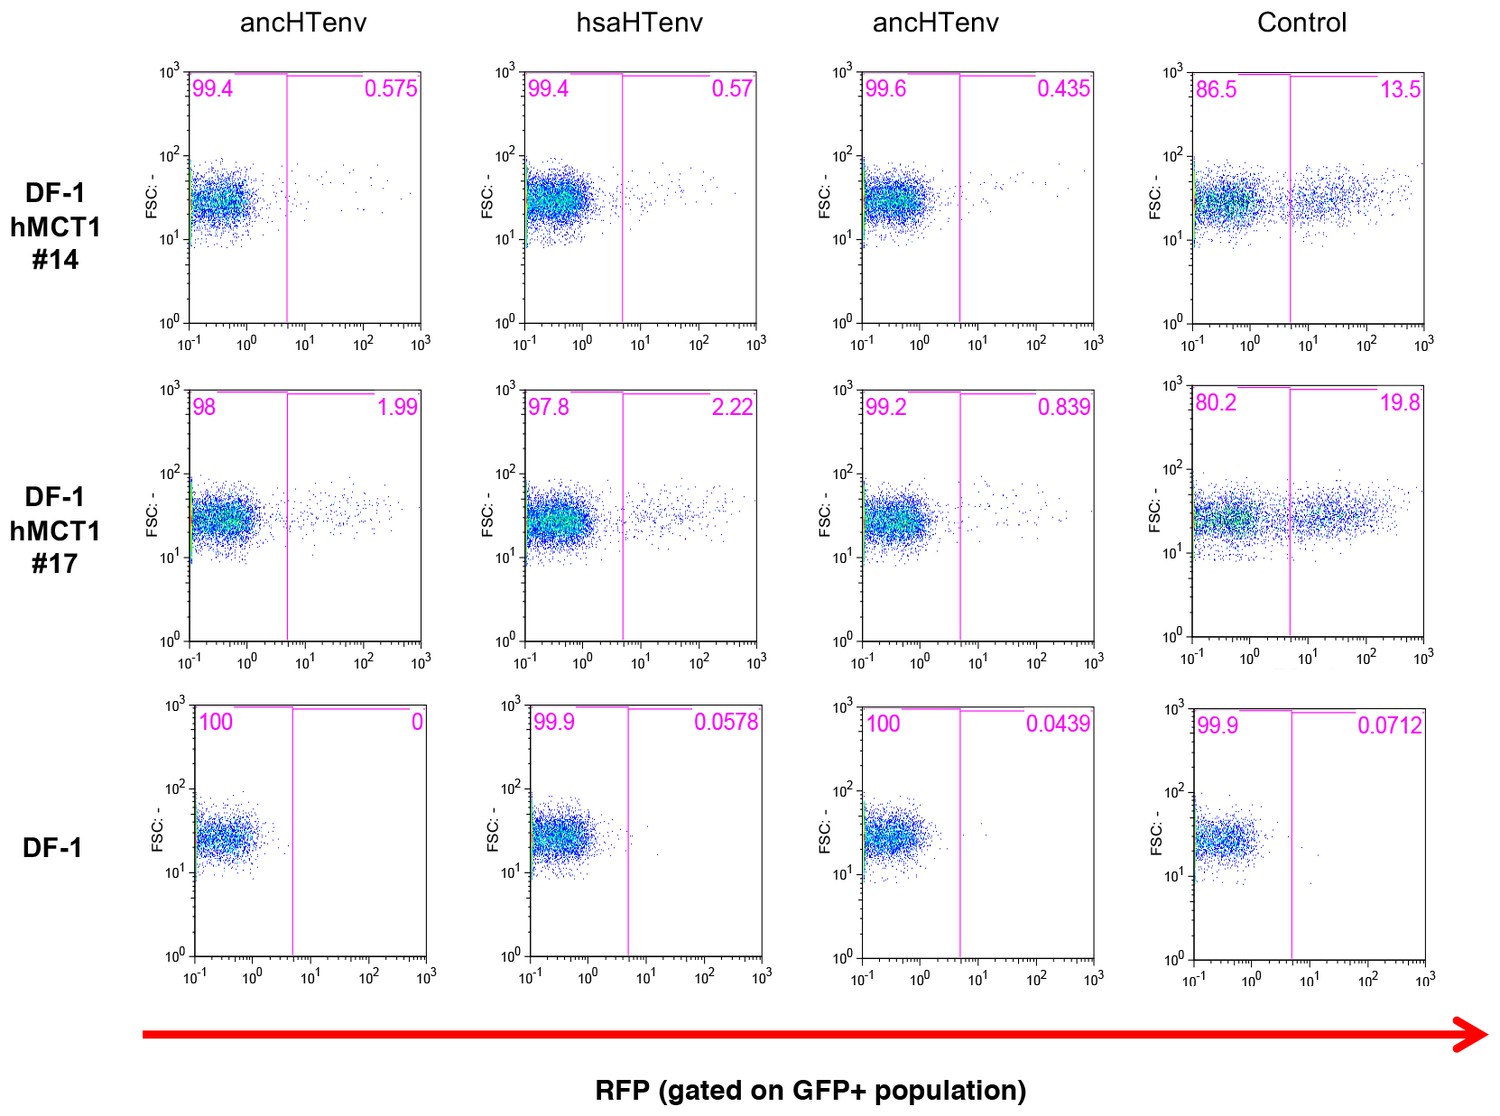
Antiviral activity of HERV-T Env proteins.
Single cell clones of DF-1 cells that expressed hMCT1-HA, or naïve DF-1 cells, were transduced with lentiviral vectors expressing HERV-T Env proteins or an unrelated protein (Control) together with a GFP reporter gene to monitor expression. Cell populations were analyzed by FACS 2 days after infection. A represesentative experiments is shown in which the percentage of RFP positive (infected) cells is determined after gating on the on the GFP positive (Env-expressing) cell population.
Figure 7 with 1 supplement
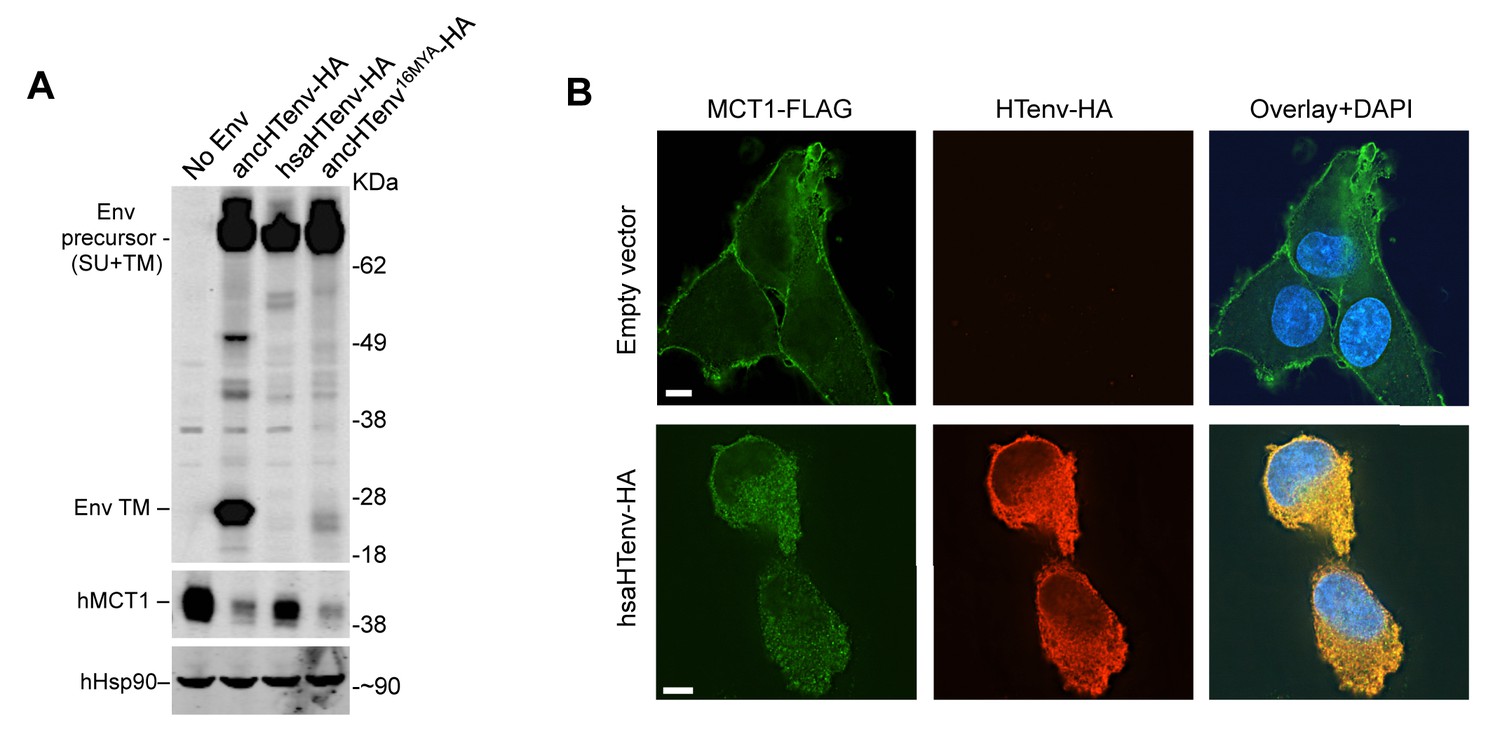
The hsaHTenv protein causes depletion of hMCT1 from the cell surface.
(A) Western blot analyses (α-HA, α-hMCT1 and α-hHsp90) of 293T cell lysates generated following transduction with lentiviral vectors encoding C-terminally HA-tagged HERV-T envelopes. (B) Immunofluorescent micrographs of hMCT1-Flag-expressing DF-1 cells transduced with vectors expressing hsaHTenv-HA or an empty vector. Green: α-Flag, red: α-HA, Blue: DAPI. Scale bar = 5 μm. See also Figure 7—figure supplement 1.
Figure 7—figure supplement 1
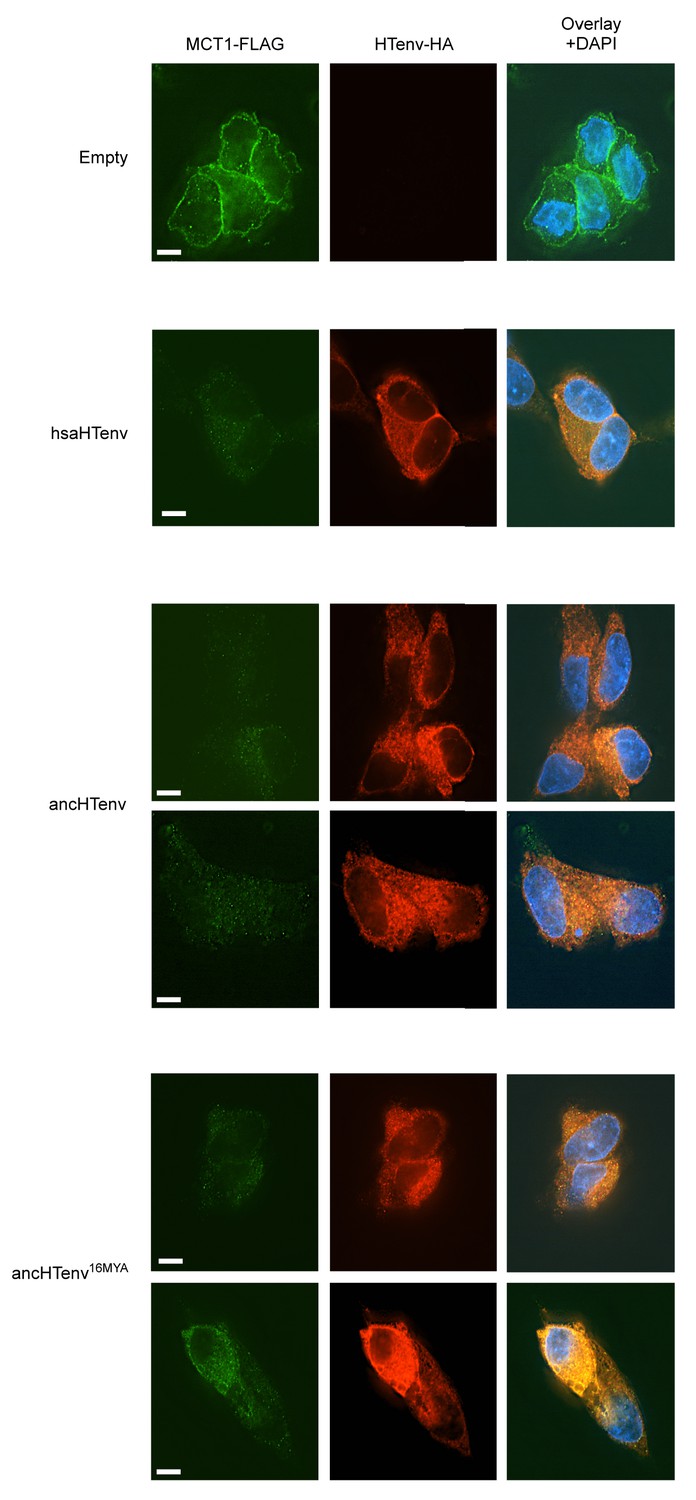
Additional examples of MCT-1 depletion and releocalization following expression of HERV-T Env proteins.
Immunofluorescent micrographs of hMCT1-Flag-expressing DF-1 cells transduced with lentiviral vectors expressing various HA-tagged HERV-T envelopes or an empty vector. Green: α-Flag, red: α-HA, Blue: DAPI. Scale bar = 5 μm.
Tables
Table 1
Molecular evolution analyses of the provirus containing hsaHTenv in its orthologs. (1) Divergence measured in substitutions per site. (2) Integration dates inferred from the divergence of the paired LTRs for human, gorilla and orangutan proviruses. Age is calculated assuming a human neutral substitution rate of 2.2 × 10⁻⁹ substitutions per site per year. (3) Pairwise dN/dS ratios for the env genes calculated using codeml (CodonFreq = F3 × 4, Kappa and Omega estimated). (**) Significantly different from dN/dS = 1 (p<0.01).
| Locus | LTR divergence(1) | Age (MY)(2) | Env dN/dS ratio(3) | |
|---|---|---|---|---|
| Gorilla | Orangutan | |||
| Human | 0.0317 | 7.20 | 1.4860 | 0.5184** |
| Gorilla | 0.0414 | 9.41 | − | 0.7592 |
| Orangutan | 0.0855 | 19.43 | 0.7592 | − |
-
Table 1—source data 1
Likelihood ratio tests on dN/dS estimates for hsaHTenv and its orthologs. dN/dS ratios (ω) were estimated on a pairwise basis using codeml.
Likelihood ratio tests were performed comparing the log likelihood of the estimated ω (L1) to the log likelihood when ω was fixed to 1 (L0, neutral selection). The probability (P) of twice the difference (D = 2(L1−L0)) was calculated using a chi-squared distribution (degrees of freedom = 1). The single nucleotide frame-shift insertion in the gorilla sequence was artificially deleted in order to compare orthologous codons.
- https://doi.org/10.7554/eLife.22519.011
Table 2
Analysis of inactivating mutations of hsaHTenv encoding provirus in human, gorilla and orangutan genomes. Proviral sequences were aligned to the ancestral HERV-T3 sequence. Nonsense mutations and frameshift indels relative to the ancestral sequence were quantified. ‘Indel’ = insertion or deletion events compared to the ancestral HERV-T3 sequence that resulted in a reading frame change. ‘Stop’ = mutations that resulted in a stop codon. (*) Indicates a single nucleotide insertion that results in the truncation of the last five amino acids compared with ancHTenv.
| Locus | Gag (length: 519 codons) | Pol (length: 1206 codons) | Env (length: 631 codons) | |||
|---|---|---|---|---|---|---|
| Indel | Stop | Indel | Stop | Indel | Stop | |
| Human | 4 | 6 | 3 | 16 | (1*) | 0 |
| Gorilla | 4 | 6 | 4 | 15 | 1 (1*) | 0 |
| Orangutan | 5 | 9 | 3 | 15 | (1*) | 0 |
Additional files
-
Supplementary file 1
Sequences of resurrected HERV-T envelopes.
Codon optimized (human) ancestral reconstructed sequences for ancHTenv and ancHTenv16MYA in Fasta format.
- https://doi.org/10.7554/eLife.22519.020
Download links
A two-part list of links to download the article, or parts of the article, in various formats.
Downloads (link to download the article as PDF)
Open citations (links to open the citations from this article in various online reference manager services)
Cite this article (links to download the citations from this article in formats compatible with various reference manager tools)
Co-option of an endogenous retrovirus envelope for host defense in hominid ancestors
eLife 6:e22519.
https://doi.org/10.7554/eLife.22519


