Single-molecule observation of DNA compaction by meiotic protein SYCP3
- University of Cambridge, United Kingdom
- Vrije Universiteit Amsterdam, The Netherlands
- University of Newcastle, United Kingdom
Figures
Figure 1
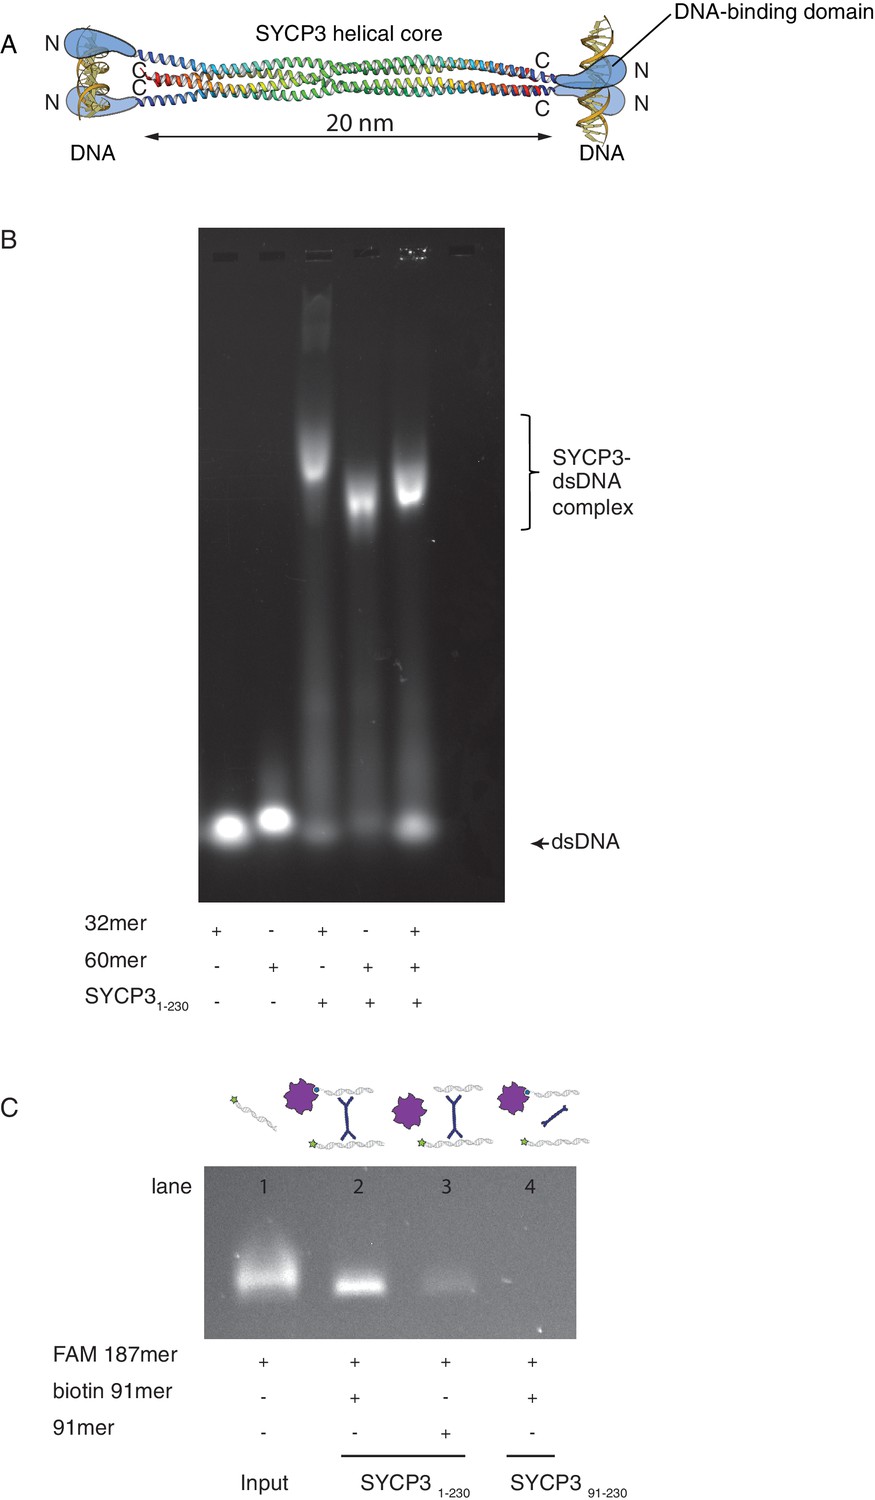
SYCP3 can bind simultaneously to two molecules of dsDNA.
(A) Model of DNA binding by the SYCP3 tetramer. The crystal structure for the helical core of the SYCP3 tetramer is shown in ribbon representation, with each chain rainbow-coloured from the N- (blue) to the C-terminus (red). In the model, pairs of N-terminal SYCP3 regions form two distinct DNA-binding domains at both ends of the SYCP3 strut-like structure. (B) Result of the electrophoretic mobility shift assay (EMSA) for SYCP3 bound to dsDNA molecules of different lengths. Lanes 1 and 2 show the electrophoretic migration of free dsDNA 32mer and 60mer, respectively. Lane 3 and 4 show the mobility shifts of SYCP3-bound DNA 32mer and 60mer, respectively. Lane 5 shows the mobility shift of a SYCP3-DNA complex in the presence of both DNA 32mer and 60mer species. (C) Result of the pull-down assay, demonstrating DNA bridging by SYCP3. Above each gel lane, drawings illustrate sample content for each pulldown experiment. The 5’ FAM-labelled DNA bound to SYCP3 was eluted from the beads in high salt and visualised under UV light after agarose gel electrophoresis (lane 2). Lane 3 shows the background retention level of fluorescently-labelled DNA due non-specific binding of the SYCP3-DNA complex to the streptavidin beads; lane 4 shows that the N-terminal region of SYCP3, known to mediate DNA binding, is necessary for pull-down of the fluorescently-labelled DNA.
Figure 2
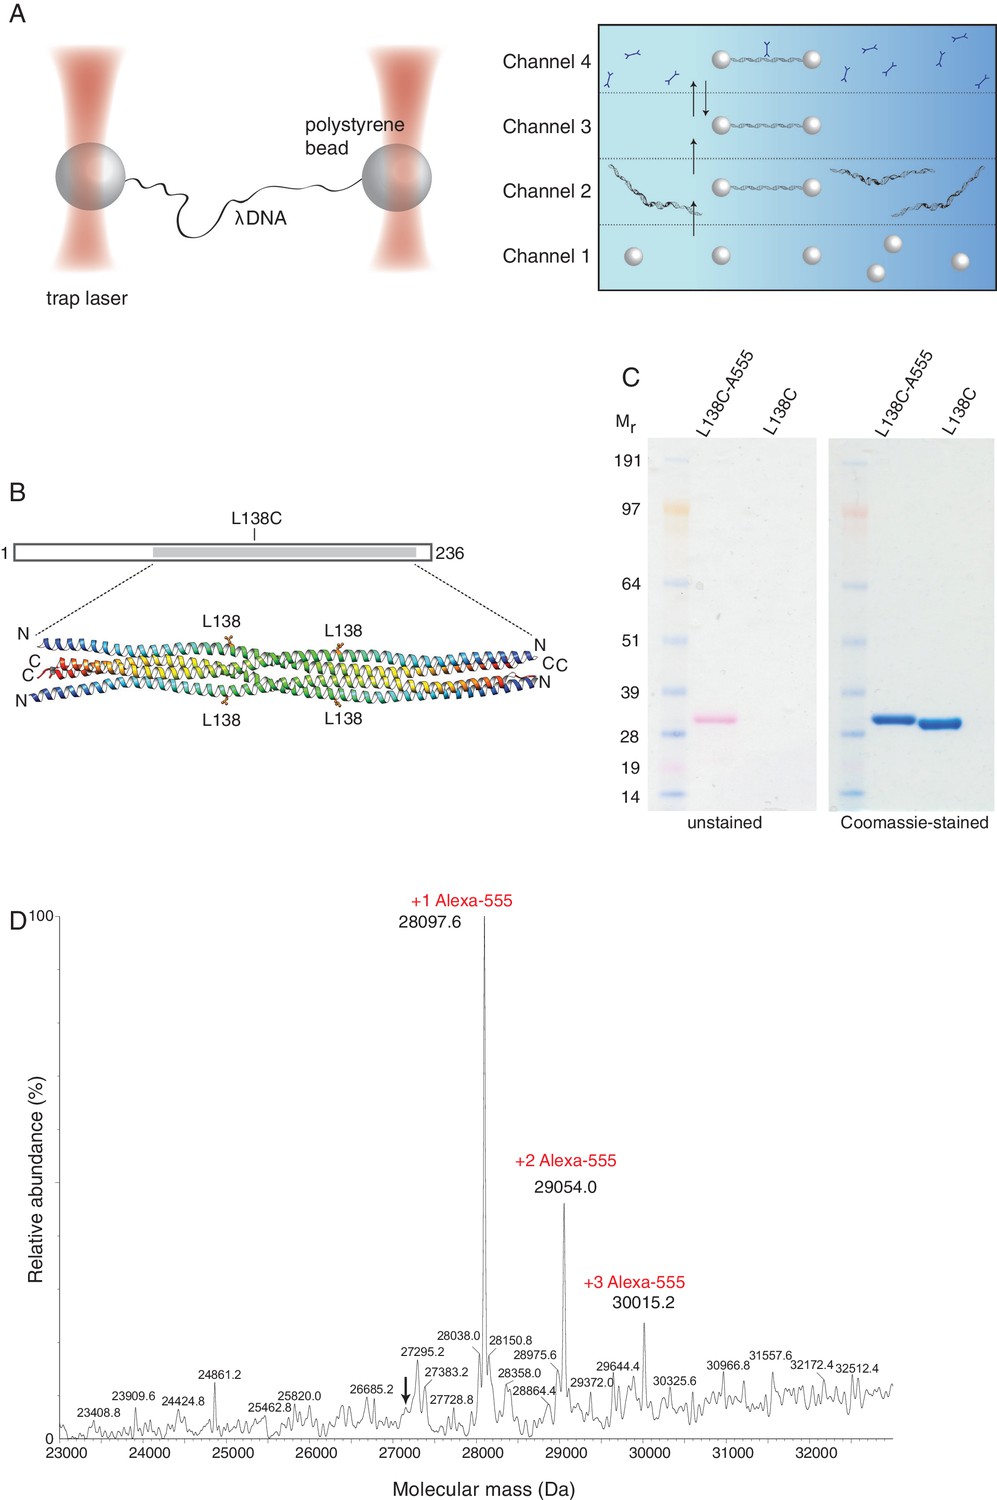
Optical tweezers can be used to study the binding of SYCP3 to double-stranded DNA.
(A) The focused trapping laser beams hold two streptavidin-coated polystyrene beads in place, while the λ DNA is tethered between the beads (right). A four-channel laminar flow cell on a mobile platform was used to perform the single-molecule experiments. The streptavidin-coated polystyrene beads were trapped with the lasers in Channel 1 and biotinylated λ DNA was then captured in Channel 2, by tethering its ends to two beads. The flow cell was subsequently moved to Channel 4, to allow fluorescently-labelled SYCP3 to bind λ DNA and, after an incubation time of 30 s, the beads were moved into Channel 3 for visualisation and analysis of DNA binding (left). (B) Residue L138 was replaced with cysteine for Alexa555-labelling of SYCP3 via maleimide chemistry. L138 was chosen because it is exposed to solvent and distant from the DNA-binding domains in the SYCP3 structure. (C) SDS-PAGE analysis of purified L138C SYCP31-230 both before (L138C sample) and after (L138C-A555 sample) conjugation to Alexa555. The proteins in the gel were visualized in the unstained gel (left) and after staining with Coomassie blue (right). (D) Mass-spectrometry analysis shows that the majority of L138C SYCP31-230 contains one Alexa555 label.
Figure 3
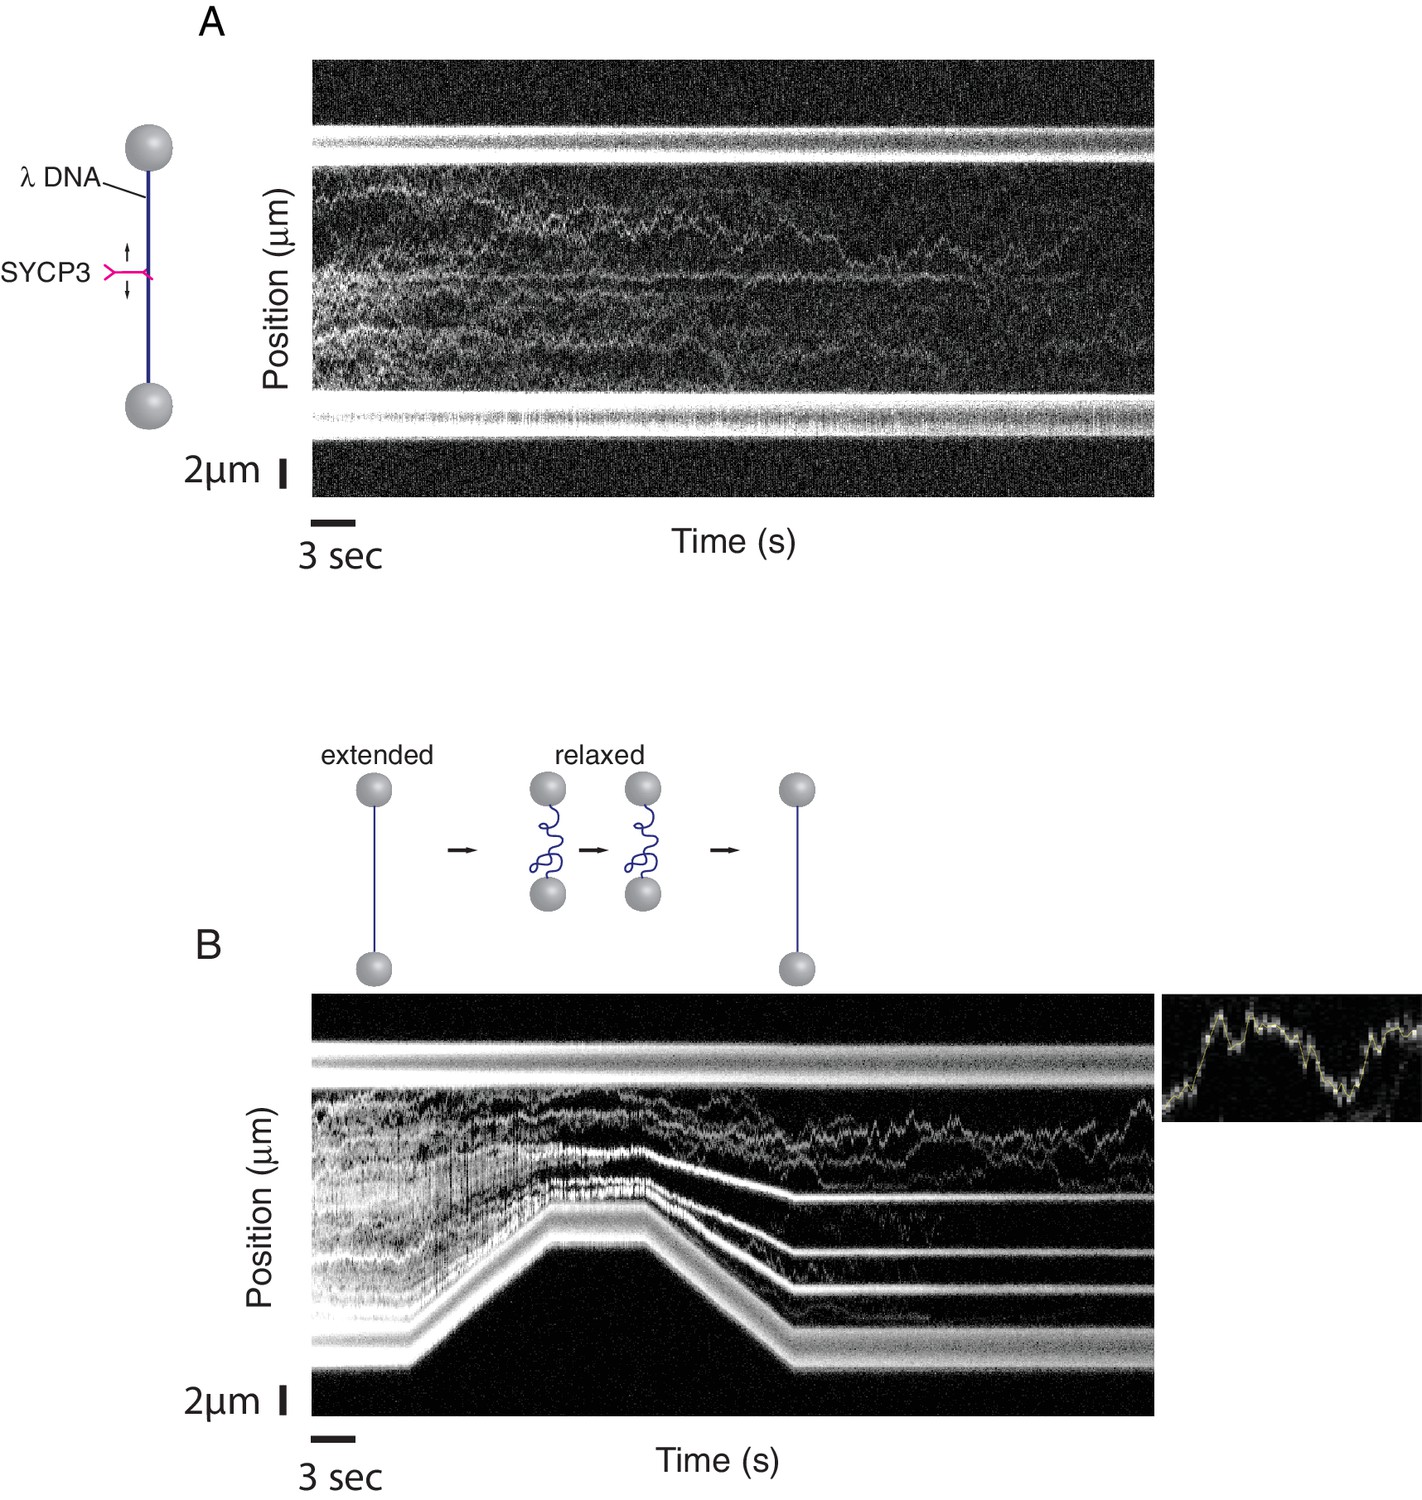
A single-molecule DNA-compaction assay shows two modes of SYCP3 binding to dsDNA.
Two representative kymographs are shown. (A) The kymograph shows the diffusive behaviour observed when SYCP3 was bound to a λ DNA molecule kept in extended conformation by the laser-trapped beads. (B) The kymograph in the bottom panel shows clustering of SYCP3 in static aggregates upon relaxation of the λ DNA molecule. The smaller panel shows details of SYCP3’s diffusive behavior, over a period of 17.5 s and within a DNA region of 3750 nanometers.
Figure 4 with 4 supplements
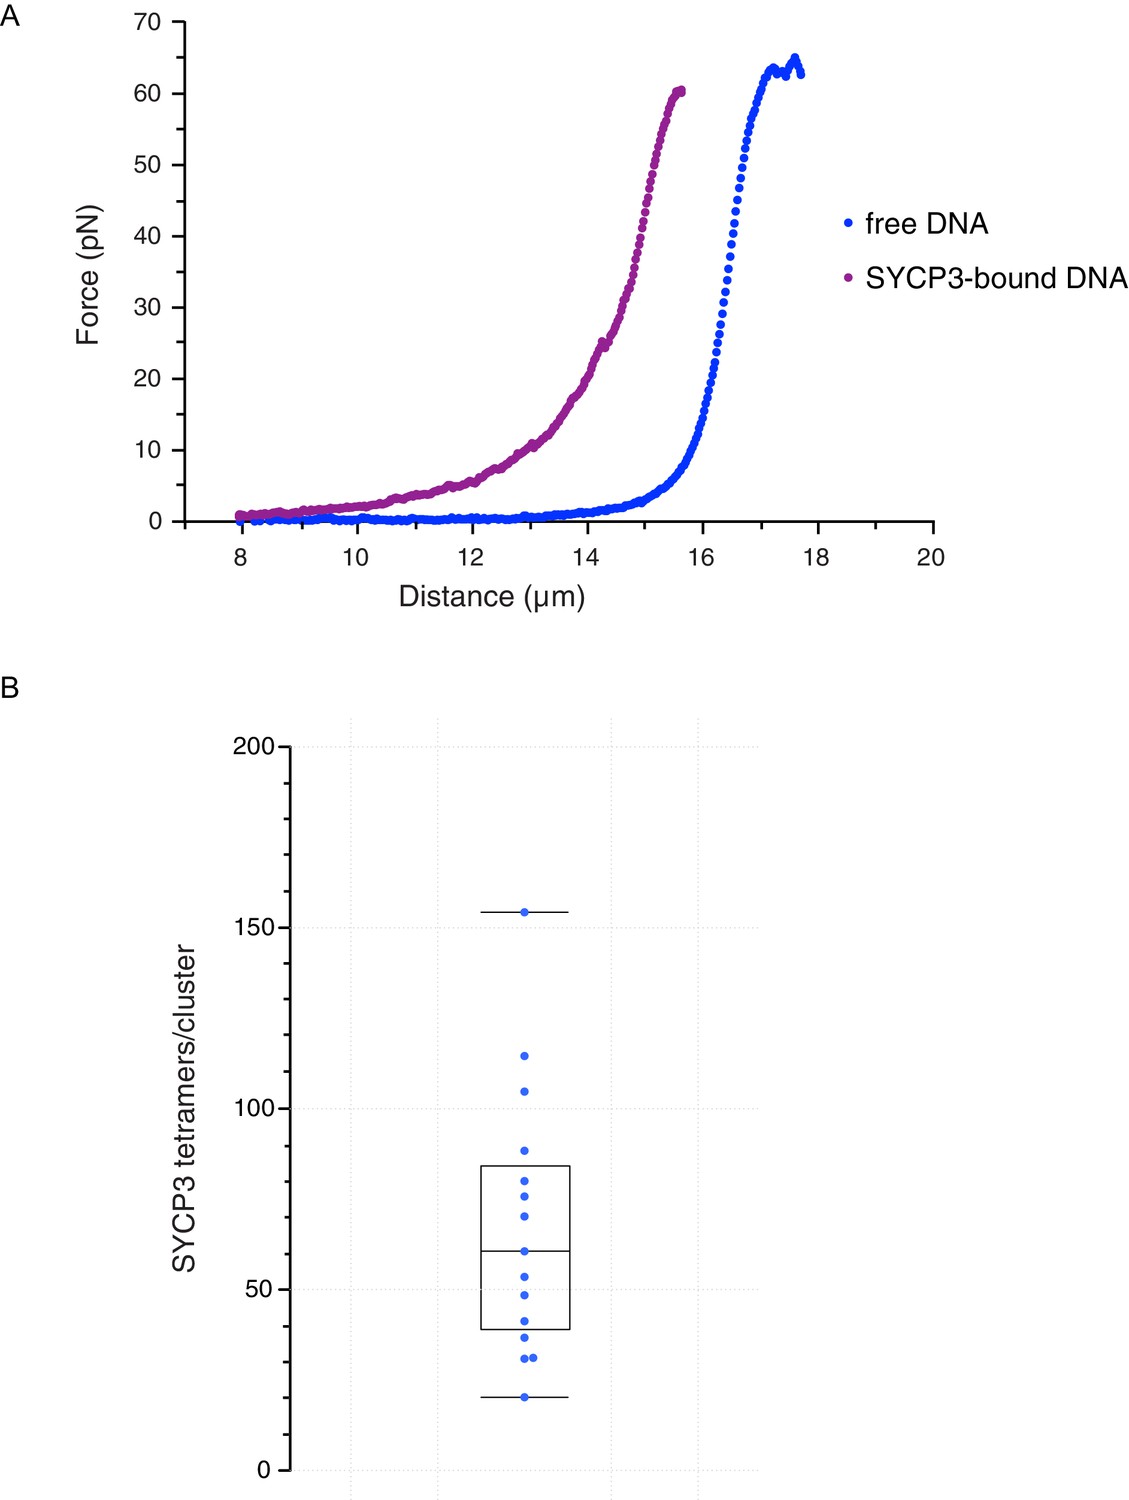
Characterisation and analysis of DNA-bound SYCP3 in the DNA-compaction assay.
(A) Force-distance curves measured for SYCP3-free λ DNA (blue curve), and during re-extension of SYCP3-compacted λ DNA (purple curve). (B) Bee-swarm box plot showing the estimated number of SYCP3 tetramers present in the static SYCP3 clusters that form on λ DNA during the compaction assay. The position of the box highlights the interquartile (50%) range. The median, minimum and maximum values are indicated with horizontal lines (line widths are arbitrary).
Figure 4—figure supplement 1
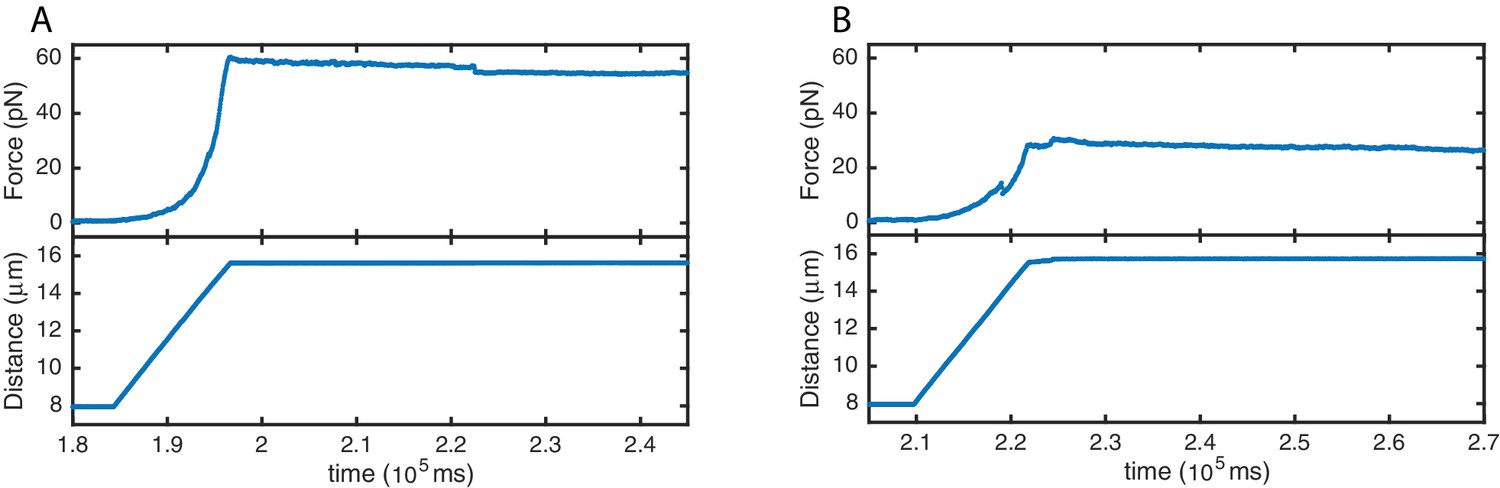
High stability of SYCP3-compacted DNA.
Force (top panels) and distance (bottom panels) traces acquired during re-extension of SYCP3-compacted DNA. No extensive rupture events or continuous molecular rearrangements are evident when applying tension of ~30 pN (A) and ~60 pN (B), implying a comparatively high stability of SYCP3-compacted DNA.
Figure 4—figure supplement 2
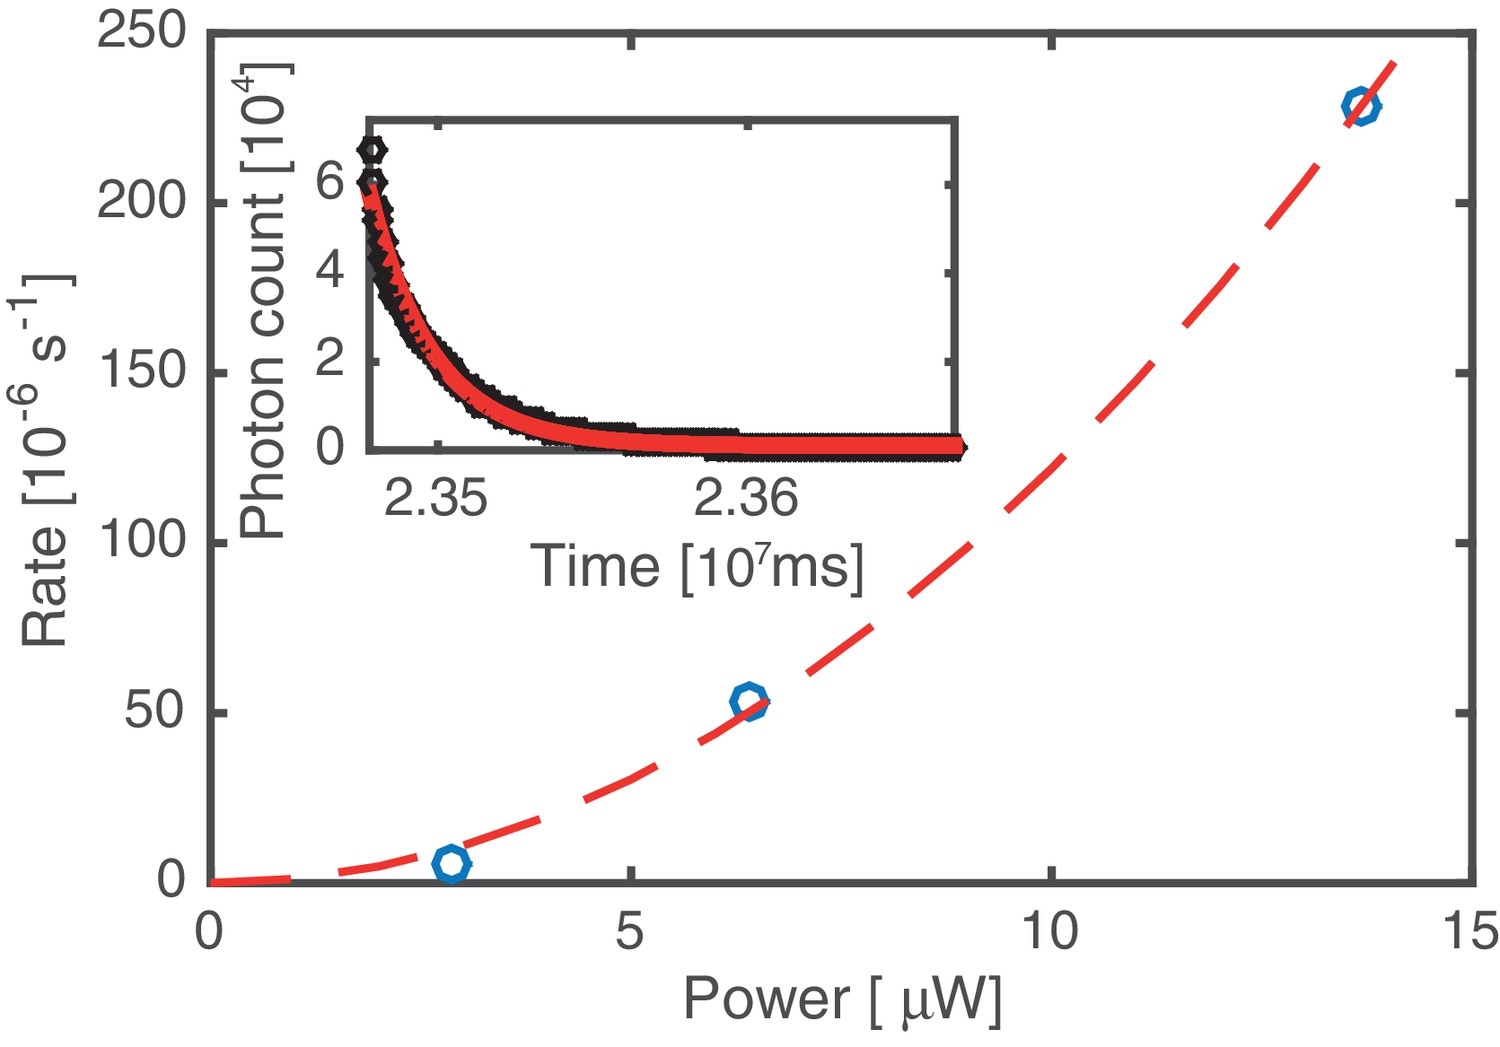
Bleaching rate analysis.
Kymographs were acquired at three different values of the excitation laser power. The average bleaching/unbinding rate (symbols) was obtained by fitting single exponentials to decaying fluorescence signals, obtained by integrating over the entire DNA molecule (cf. inset, data based on analysis of 12 kymographs). All other data in this work has been acquired at 6.4 µW laser power. Since the bleaching/unbinding rate at 2.9 µW laser power is reduced by a factor of 10 compared to that at 6.4 µW, we conclude that at 6.4 µW the experiment is limited by photobleaching. The dashed line indicates a quadratic laser power dependence, suggesting that photo bleaching is mediated by 2-photon processes induced by the 60 ps 20 MHz pulsed excitation source.
Figure 4—figure supplement 3
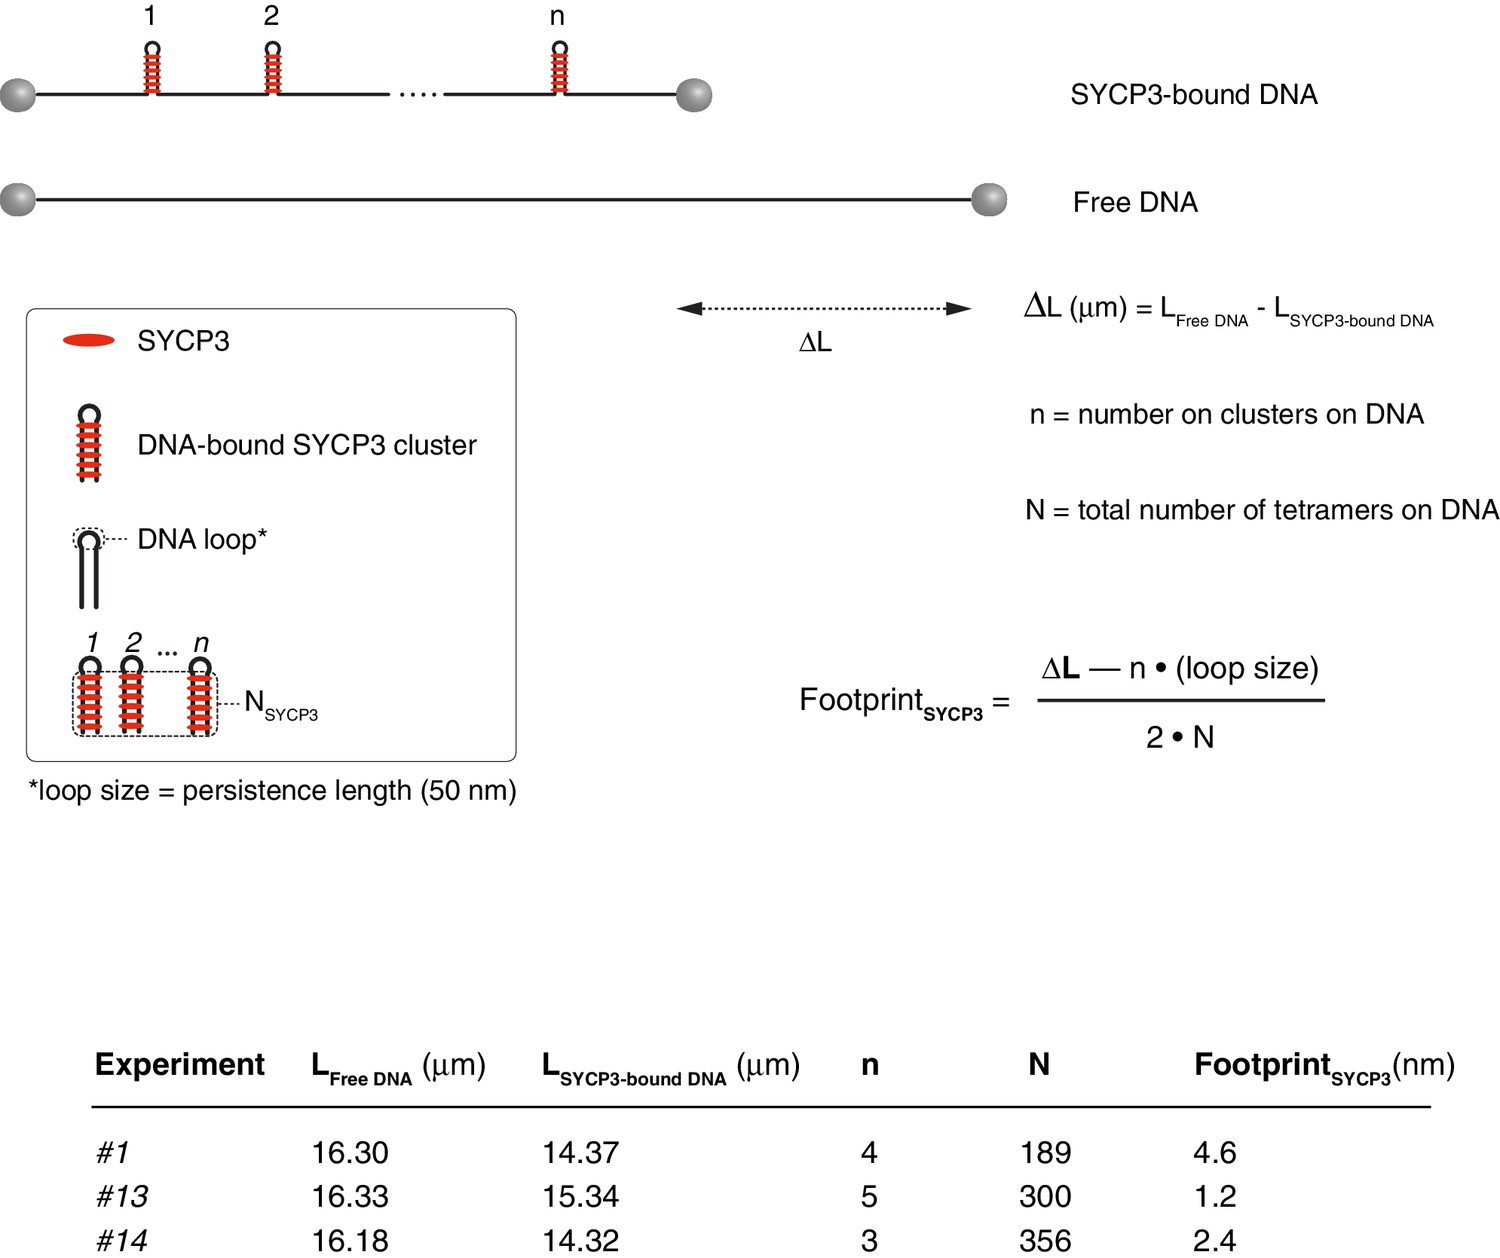
Calculation of the SYCP3 footprint size on DNA based on force - distance curves.
The experimental values for the length of free and SYCP-bound DNA, number of cluster per λ DNA molecule and total number of SYCP3 tetramers per λ DNA molecule are reported, together with the formula used in the calculation. A persistence length of 50 nm was used to approximate the size of the DNA loop connecting regions of DNA linked by bridging SYCP3 interactions in a SYCP3 cluster. The analysis was performed for 3 DNA molecules, and yielded a footprint size value of 2.7 nm ± 1.2 nm.
Figure 4—figure supplement 4
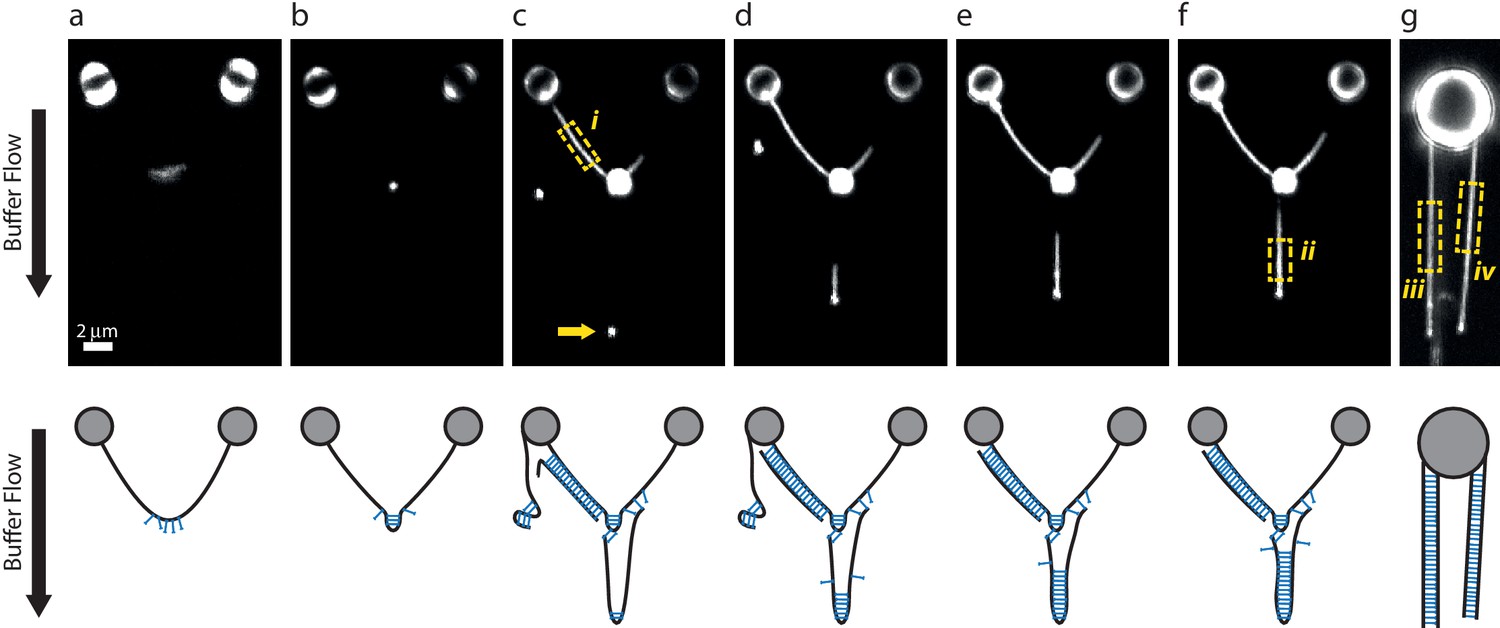
DNA-bridging experiments under flow.
(a–f) A single λ DNA molecule was tethered between two beads, then incubated in a SYCP3-containing or DNA-containing buffer while maintaining a transverse flow at 8 µm end-to-end separation. The flow drag prevents a random coil conformation of tethered DNA molecules and allows formation of large SYCP3-bridged regions between parallel flow-extended DNA molecules. Panels in the bottom row show possible interpretations for the arrangement of the DNA molecules bound by SYCP3. (a) After initial incubation, SYCP3 is observed to accumulate downstream along the DNA. No bridging is assumed to occur. (b) SYCP3 is subsequently concentrated in a bright spot, suggestive of local DNA-bridging. (c) After re-incubation in a DNA-containing buffer and subsequently in SYCP3-containing buffer, a bright spot (arrow), 8 µm downstream of the large SYCP3-DNA-cluster, indicates that SYCP3 is capable of bridging two or more separate DNA molecules. Additionally, the DNA to the left of the large SYCP3 cluster (box i) is uniformly coated with SYCP3, indicating a potentially extended bridged region between two DNA molecules. (d–f) Further SYCP3 incubation zips up the downstream tethered DNA over an increasingly long distance. (g) In a different experiment, multiple DNA molecules tethered and flow-stretched from a trapped bead appear uniformly bridged over their full parallel length. We estimated the number of SYCP3 molecules in boxes i-iv by calculating NSYCP3= (Ibox-Ibg)/(4Iref), where Ibox is the total photon count per box, Ibg is the total photon count in a box of the same size adjacent to the DNA-containing box, and Iref is the total photon count for a single fluorophore in a 2D image. Iref = A 2π (s/d)2 = 16.8, with A = 1.5 as the amplitude of a Gaussian fit for a single A555 dye (see Materials and methods), s = 100 nm the average standard deviation of the Gaussian fit and d = 75 nm the pixel size. The average SYCP3 footprint per box, calculated as the ratio of the length of the box over NSYCP3, was 4.1 nm, 3.6 nm, 3.4 nm, and 3.6 nm, for boxes i-iv respectively. 13 such analyses were performed, yielding an average footprint of 3.6 nm ± 0.3 nm (sd, N = 13). For comparison, in supposedly non-bridged conformations such as in panel a, we found an apparent average footprint of 9nm ±3 nm (sd, N = 7).
Figure 5
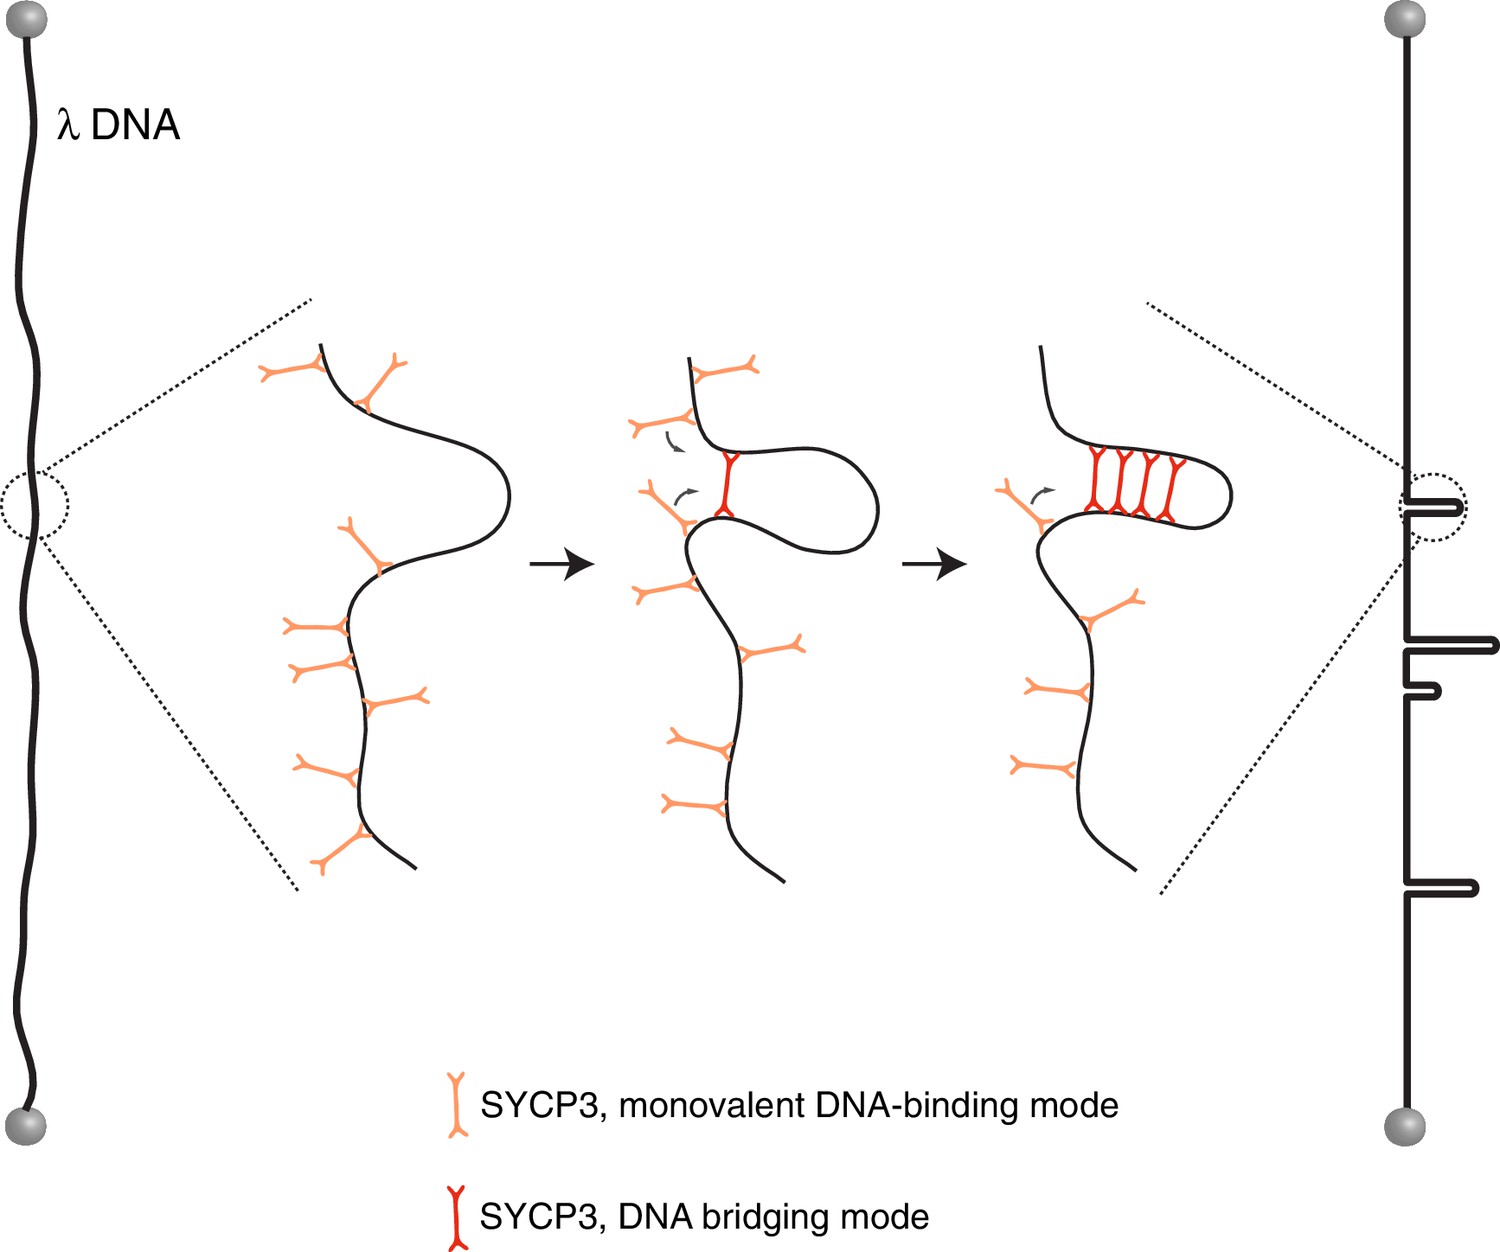
Model for the mechanism of λ-DNA compaction by SYCP3, based on its observed behaviour in the single-particle experiments.
According to the model, SYCP3 has a diffusive DNA-binding mode, likely mediated by DNA interaction at one end of its strut-like structure, and a DNA-bridging mode, where SYCP3 engages two distinct sites on the DNA with its two DNA-binding domains. DNA bridging by a single SYCP3 molecules can nucleate a DNA loop, which facilitates successive DNA-bridging interactions by other SYCP3 molecules, leading to formation of a stable DNA-bound SYCP3 cluster.
Download links
A two-part list of links to download the article, or parts of the article, in various formats.
Downloads (link to download the article as PDF)
Open citations (links to open the citations from this article in various online reference manager services)
Cite this article (links to download the citations from this article in formats compatible with various reference manager tools)
Single-molecule observation of DNA compaction by meiotic protein SYCP3
eLife 6:e22582.
https://doi.org/10.7554/eLife.22582


