Microbial consortia at steady supply
- Princeton University, United States
- The University of Texas at Austin, United States
- Ben-Gurion University of the Negev, Israel
Figures
Figure 1
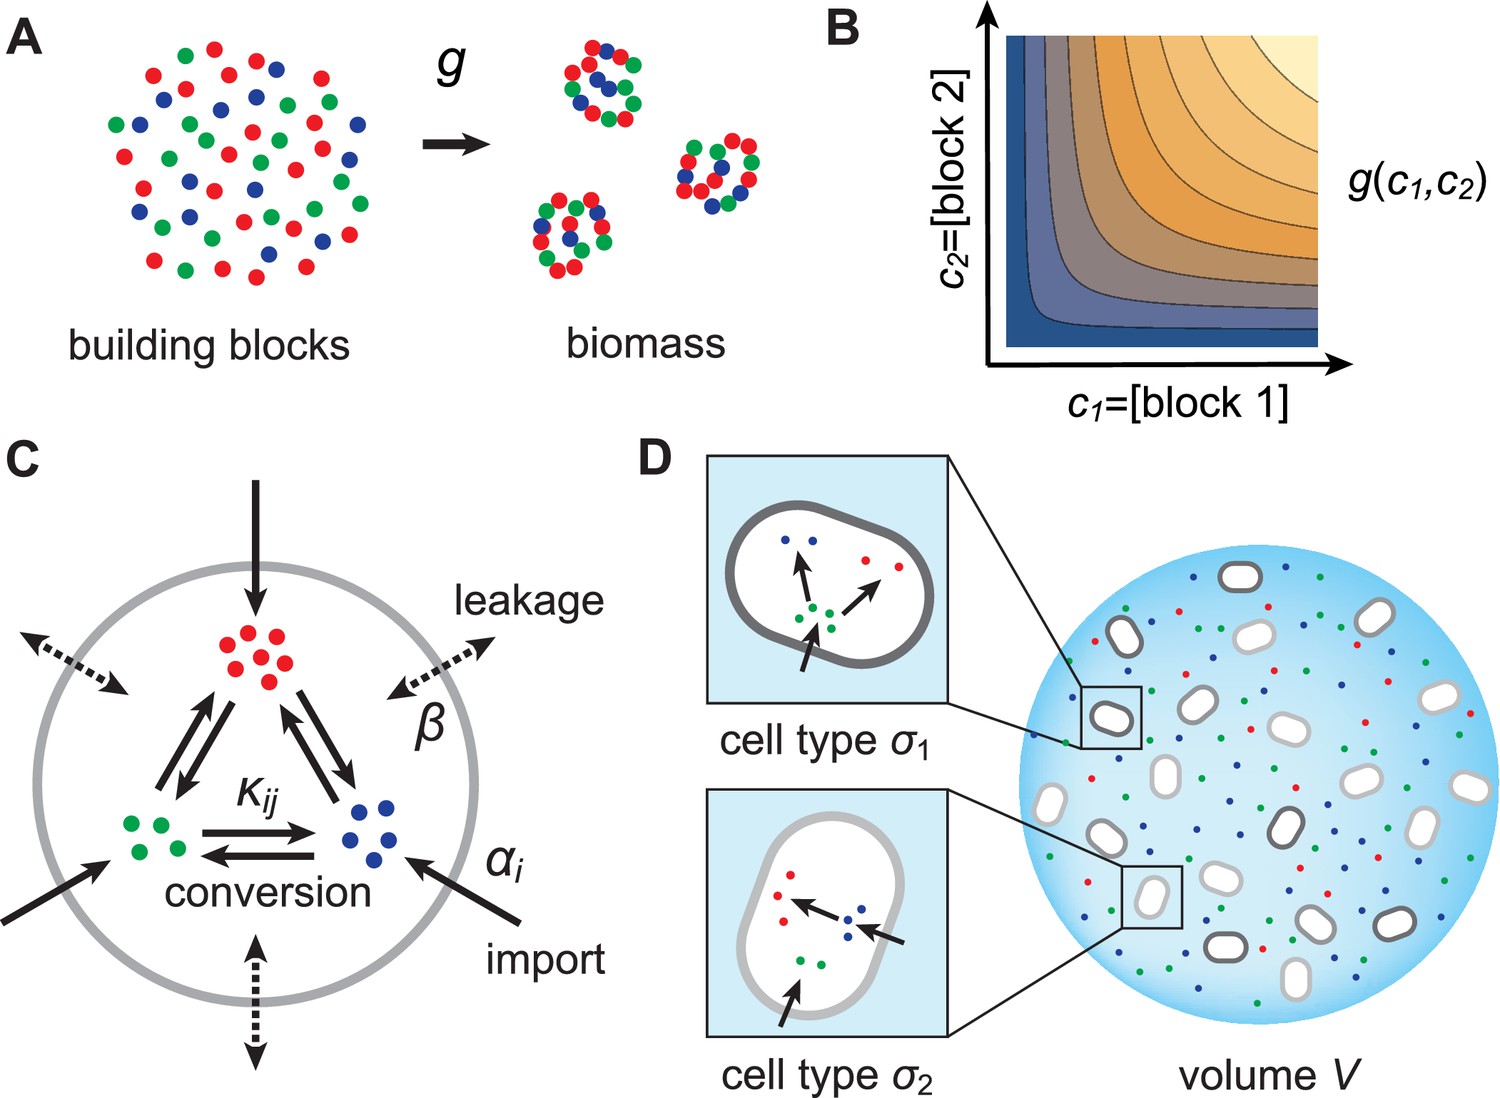
Model for metabolically competing cell types.
(A) The rate of biomass production is a function of the internal building-block concentrations. (B) Biologically relevant growth-rate functions are increasing with respect to with diminishing returns. (C) Different cell types, i.e. metabolic strategies, are defined as specific distributions of enzymes for import and conversion , subject to a finite budget. (D) Cell types (e.g. and ) compete for external building blocks that are steadily and homogeneously supplied in volume .
Figure 2
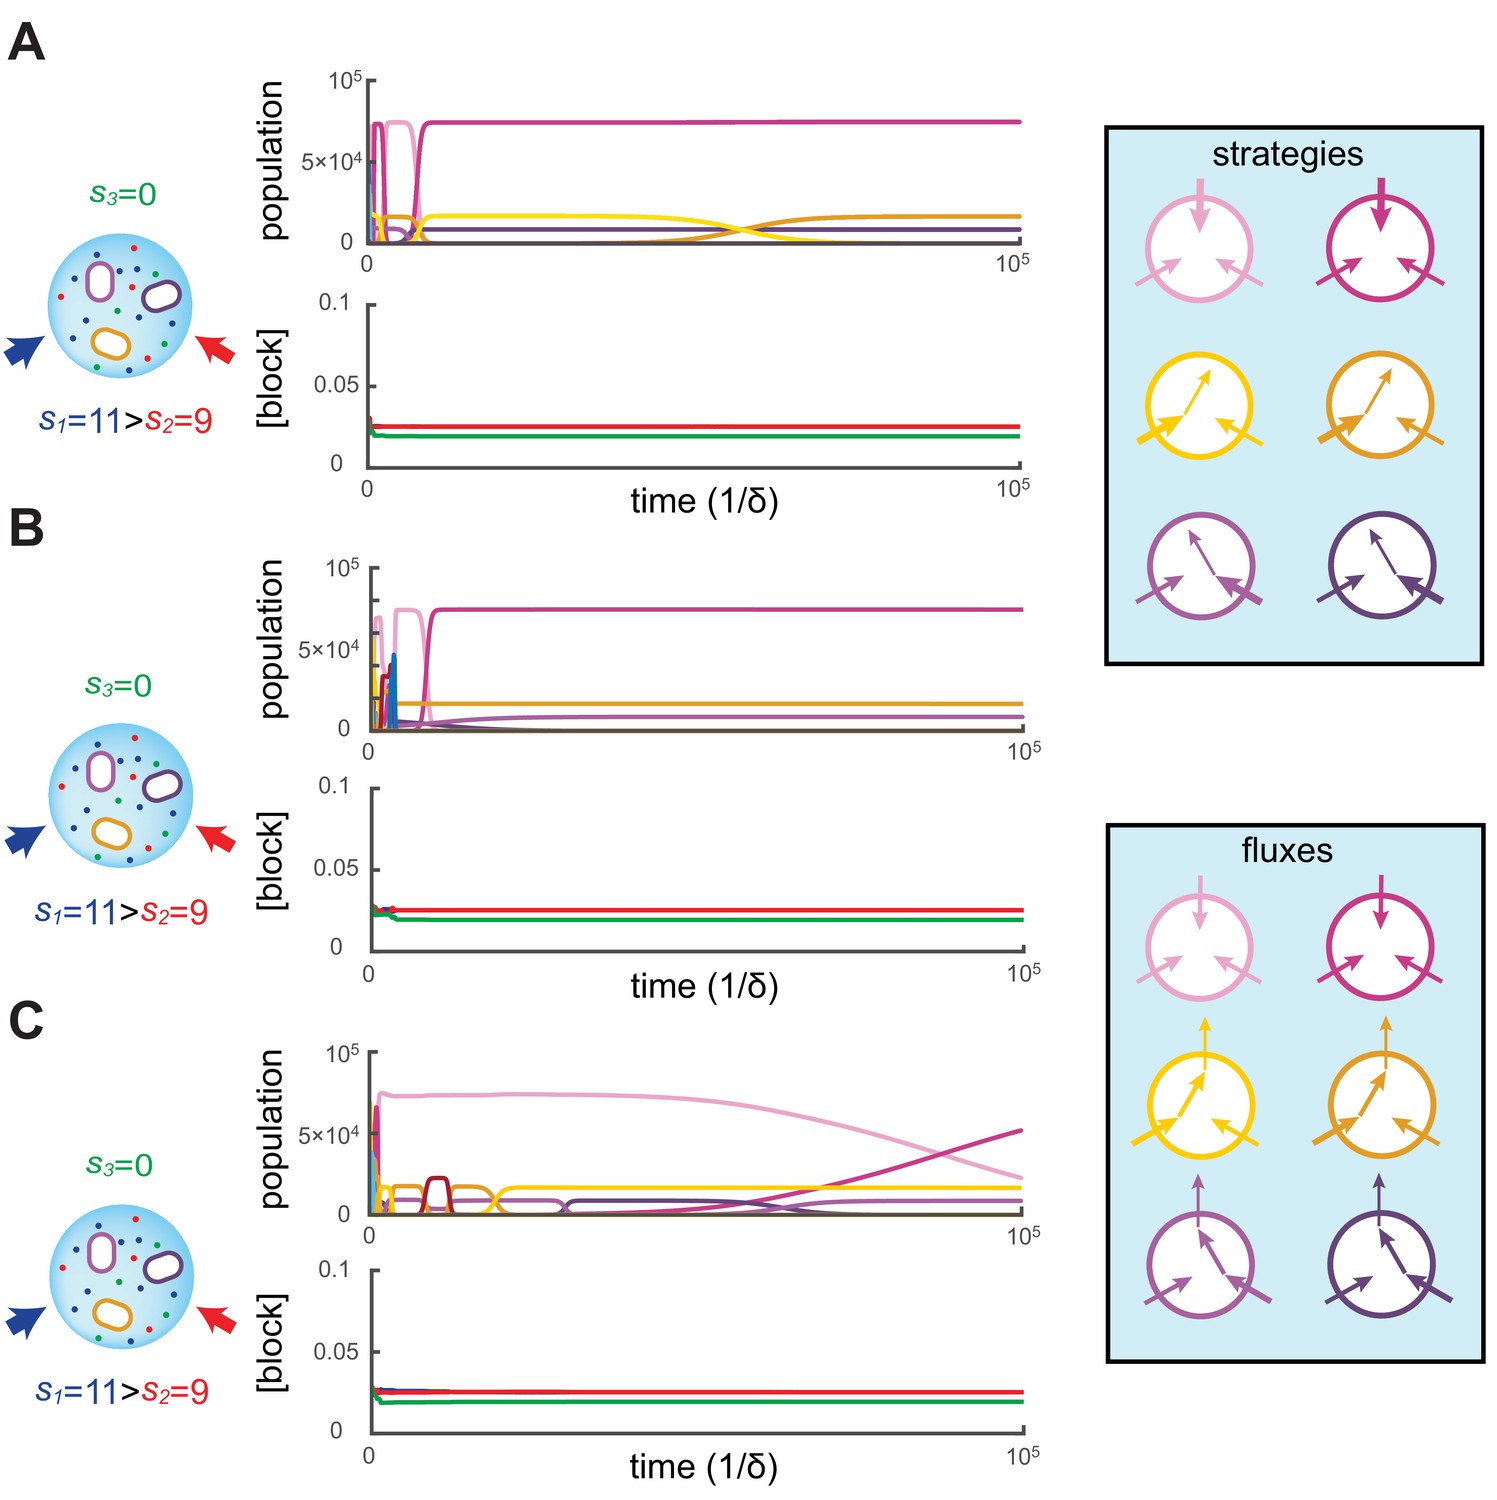
Simulated competitive dynamics.
In all panels, the left schematic indicates supply rates, the central plot shows an example of competitive population dynamics, and the right diagram depicts the strategies and their internal building-block per-cell fluxes. The initial strategies and the newly introduced strategies were randomly generated with a different seed in A, B, and C, but for the same supply rates . In each simulation, the external building-block concentrations quickly converge toward the same specific values, with . Also in each case, the simulation converges to the coexistence of the same three strategies. The dominant type with a population has a pure-importer strategy, the two other types convert one of the most abundant blocks (either block or block ) into block and the strategy converting the most abundantly provided block has the larger population ( vs. ). New cell types only manage to invade the already present bacterial population if they are ‘fitter’ versions of these three specific metabolic types. In particular, a ‘fitter’ strategy invades the overall population by replacing the already present strategy of the same metabolic type (curve crossings), with little effect on the other metabolic types or on the external building-block concentrations.
Figure 3
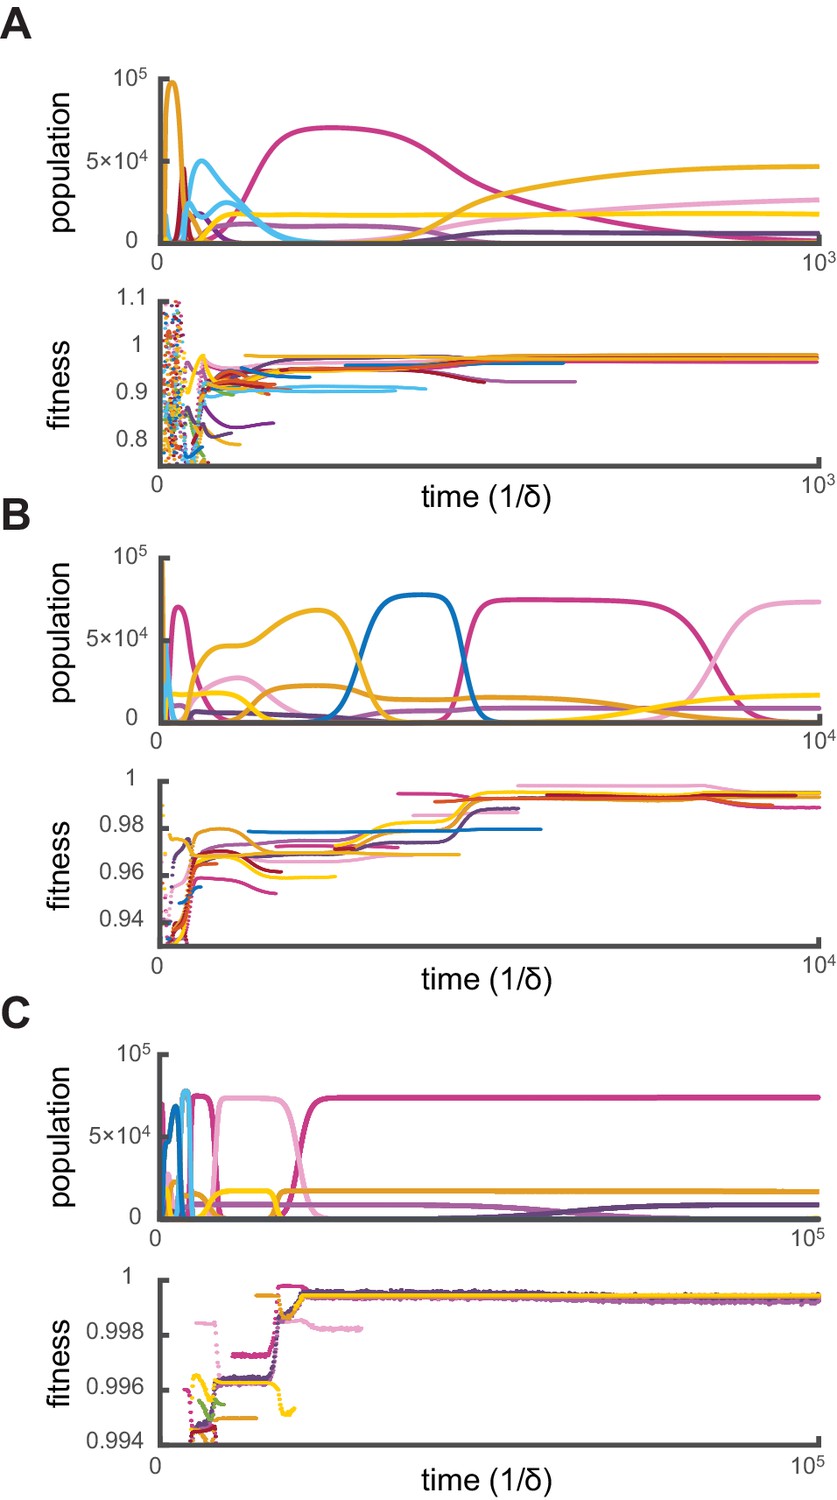
Relative fitness during competitive dynamics.
In all panels, the top plot shows the same competitive population dynamics on different time scales for , while the bottom plot shows the corresponding normalized fitness. The normalized fitness of a cell-type is defined as the ratio , where are the theoretical steady-state cell types computed via iterative optimization. (A) Before the overall population reaches capacity, cell types can have a fitness larger than one as the external building-block concentrations are substantially higher than their steady-state values. Once competition begins in earnest, all cell types present have a fitness smaller than one, indicating that an optimal cell type would outcompete any present cell for identical external building-block concentrations. (B) On longer timescales, competition between increasingly fit cell types leads to the transient coexistence of cell types with the same metabolic strategies as in Figure 2. Note that invasions by fitter cell types yield displacement events that increase the fitness of the surviving cell types. (C) On even longer timescales, the fitnesses of surviving cell types converge to one, showing that the final strategies obtained via competitive population dynamics achieve the optimal growth rate.
Figure 4
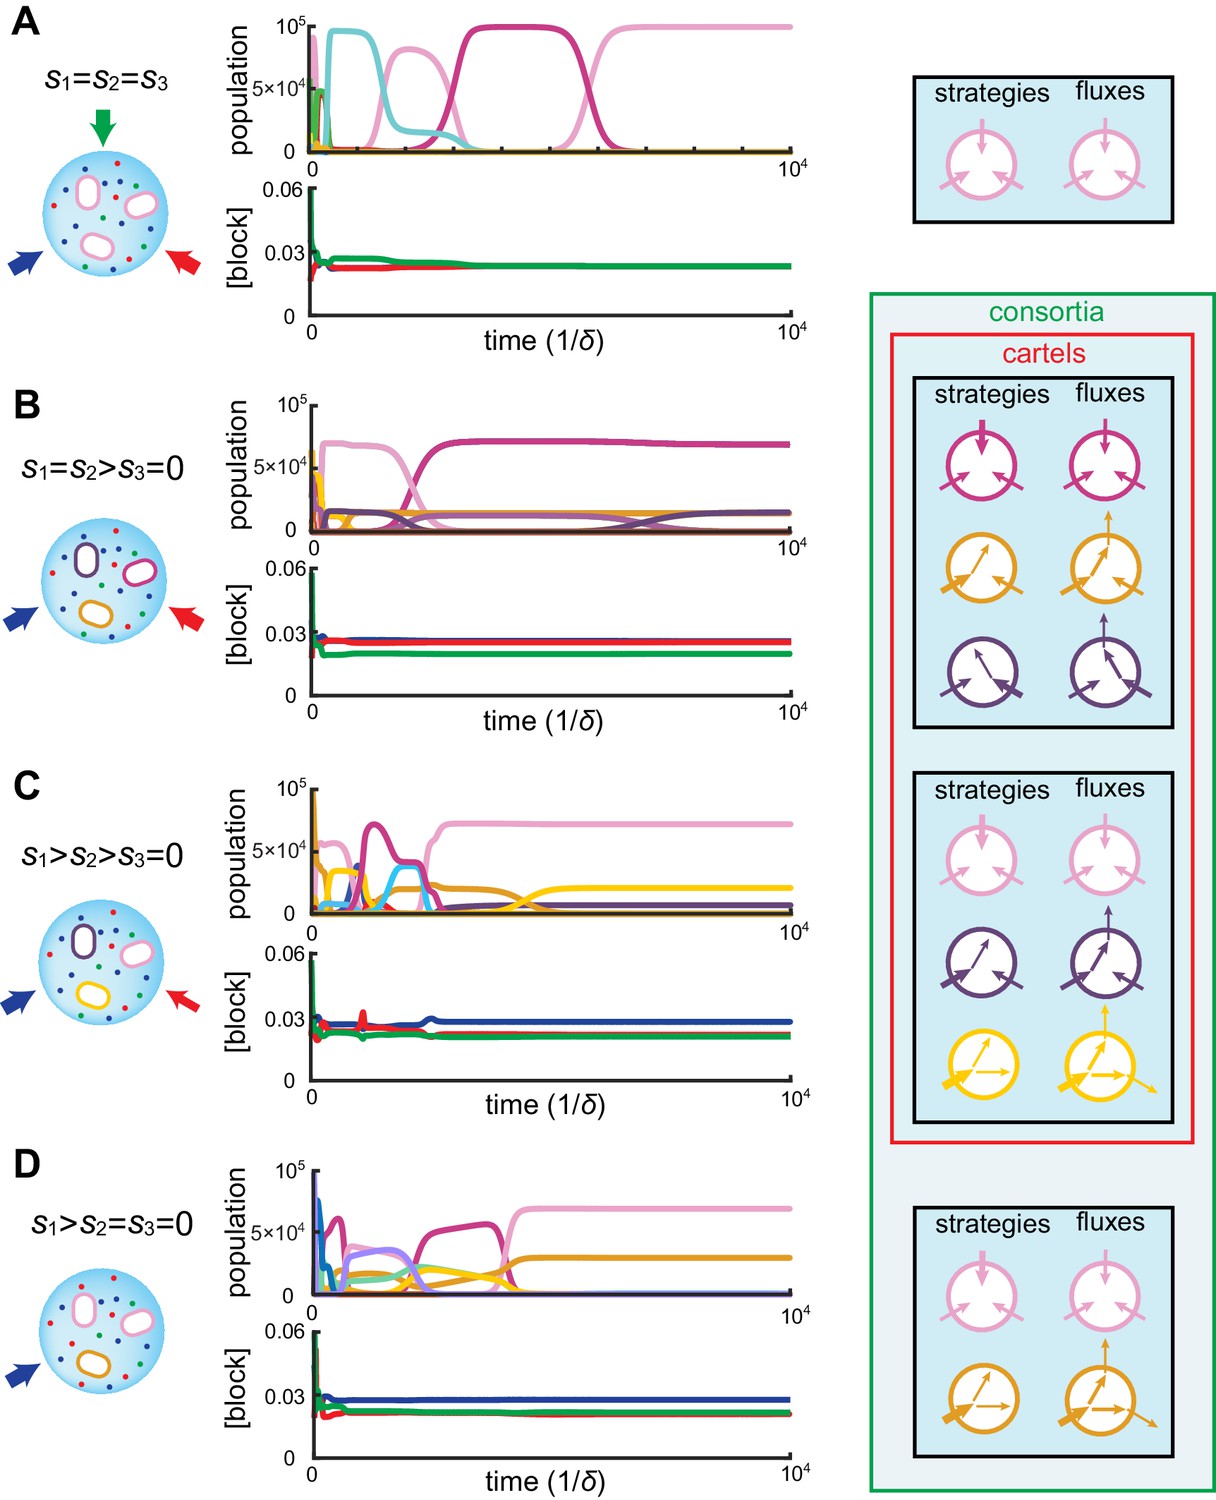
Simulated competitive dynamics.
In all panels, the left schematic indicates supply rates, the central plot shows an example of competitive population dynamics, and the right diagram depicts the final strategies and their internal building-block per-cell fluxes. (A) If the building blocks are supplied with equal stoichiometry , metabolic strategies that carry out conversions are wasteful and a single pure-importer cell type prevails. (B) If two building blocks are supplied with equal stoichiometry, e.g. and , three cell types can coexist: two ‘symmetric’ types using supplied blocks as a precursor for block , which accumulates externally due to passive leakage and release upon cell death, and, if is large enough, a third pure-importer type. (C) For large enough imbalance in the supply of building blocks and , e.g. , three distinct cell types can coexist: a pure-converter type imports block and converts blocks and ; if is large enough, a mixed type emerges, importing blocks and , and converting to ; and, if is large enough, a pure-importer type. (D) If only one building block is supplied, e.g. , two strategies coexists: a pure-converter type releases blocks and , which can lead to the emergence of a pure-importer type. The external building-block concentrations fluctuate, albeit only slightly later in the simulations, due to the invasion by and extinction of metabolic variants.
Figure 5
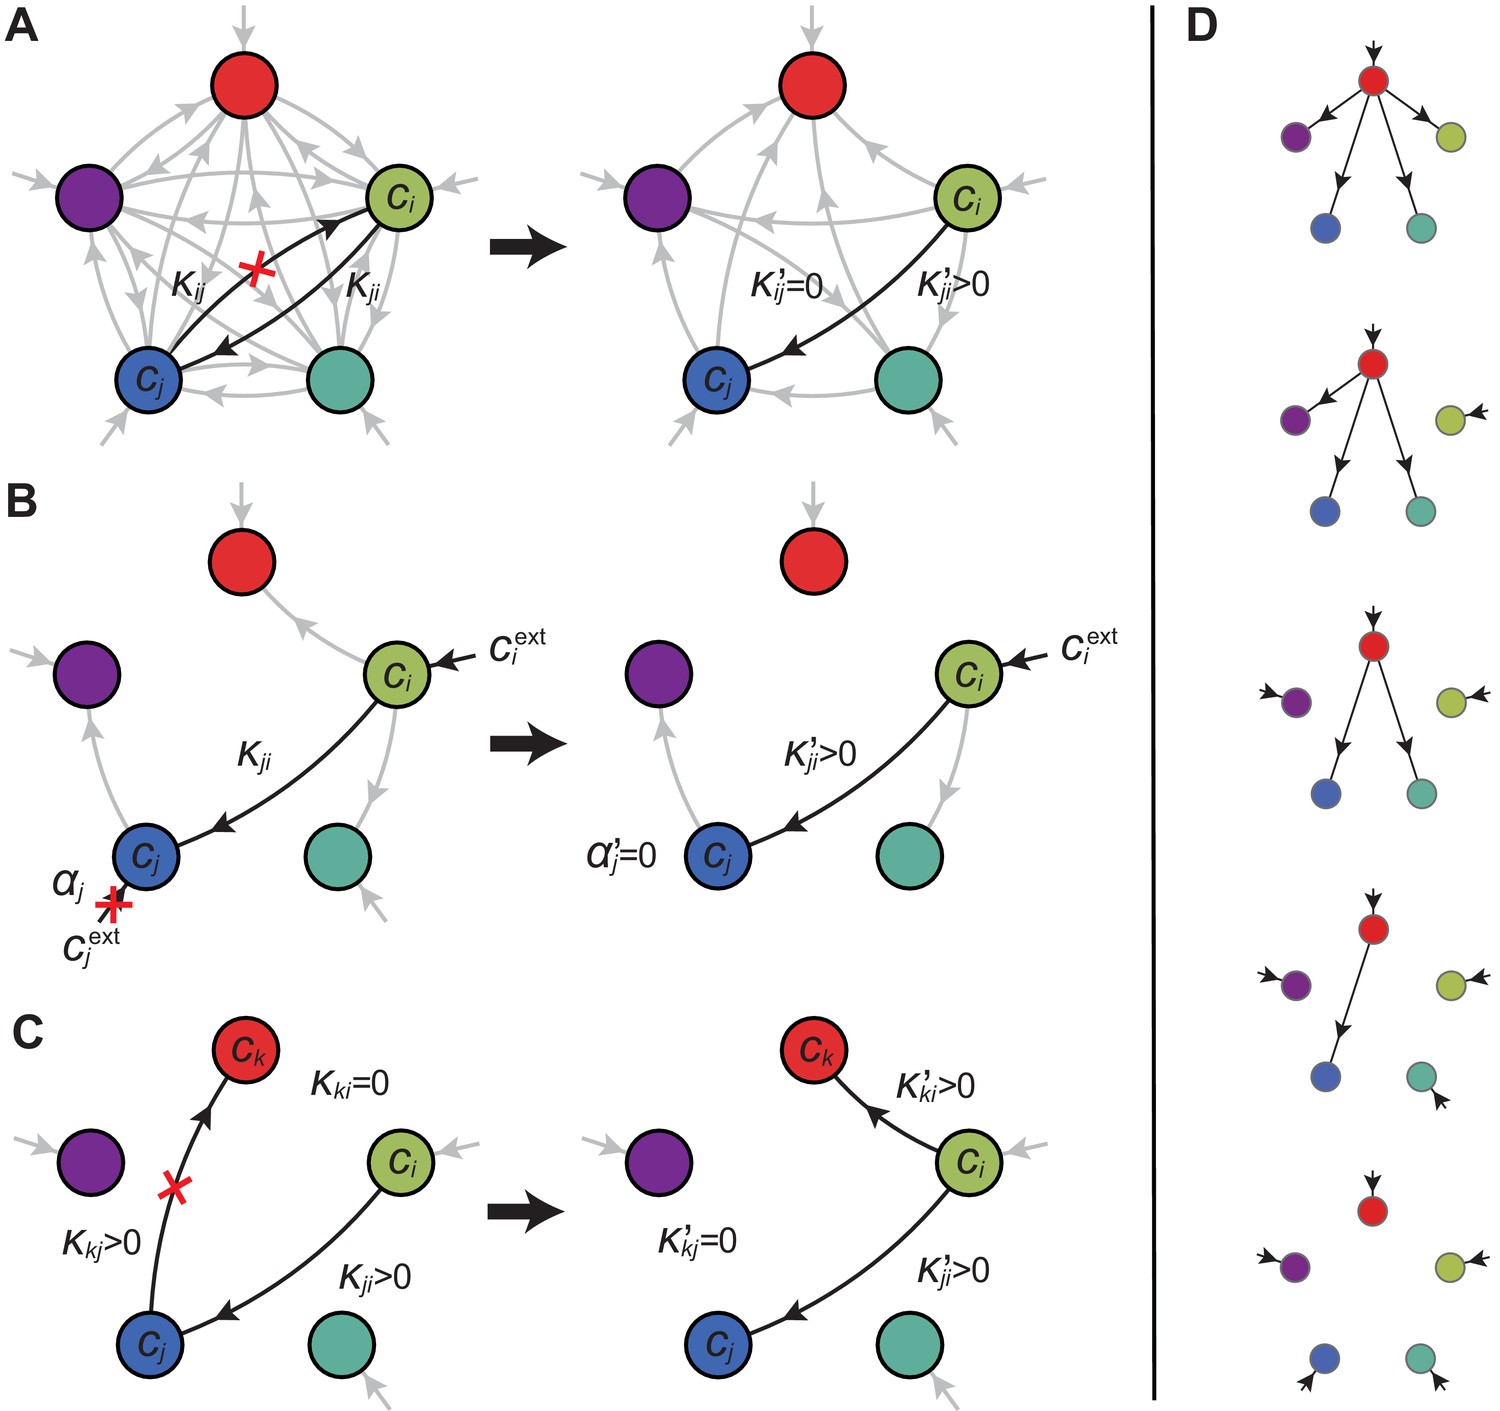
Optimal metabolic classes.
A metabolic class is defined by the set of enzymes for which and . If a metabolic class is optimal, i.e. achieves the fastest growth rate, no other metabolic class can achieve the same growth rate with a lower enzyme budget. (A) Optimal metabolic classes cannot have topological -cycles. If cell type (left) is such that the net conversion flux from block to block is positive, i.e. , a cell type (right) that only differs from by and achieves the same growth rate as but more economically. More generally, optimal metabolic classes have no topological cycles, i.e. the graphs of their metabolic networks have a tree structure. (B) Optimal metabolic classes use a single precursor for each converted building block. If cell type (left) accumulates block by import and by conversion from block , there is always a more economical strategy (right) for which either or . (C) Optimal metabolic classes convert building blocks in the minimum number of steps. If cell type (left) accumulates block via a -step conversion from block , there is always a more economical strategy (right) that converts block directly into block . (D) Optimal metabolic classes can only have a single tree of direct conversion(s).
Figure 6
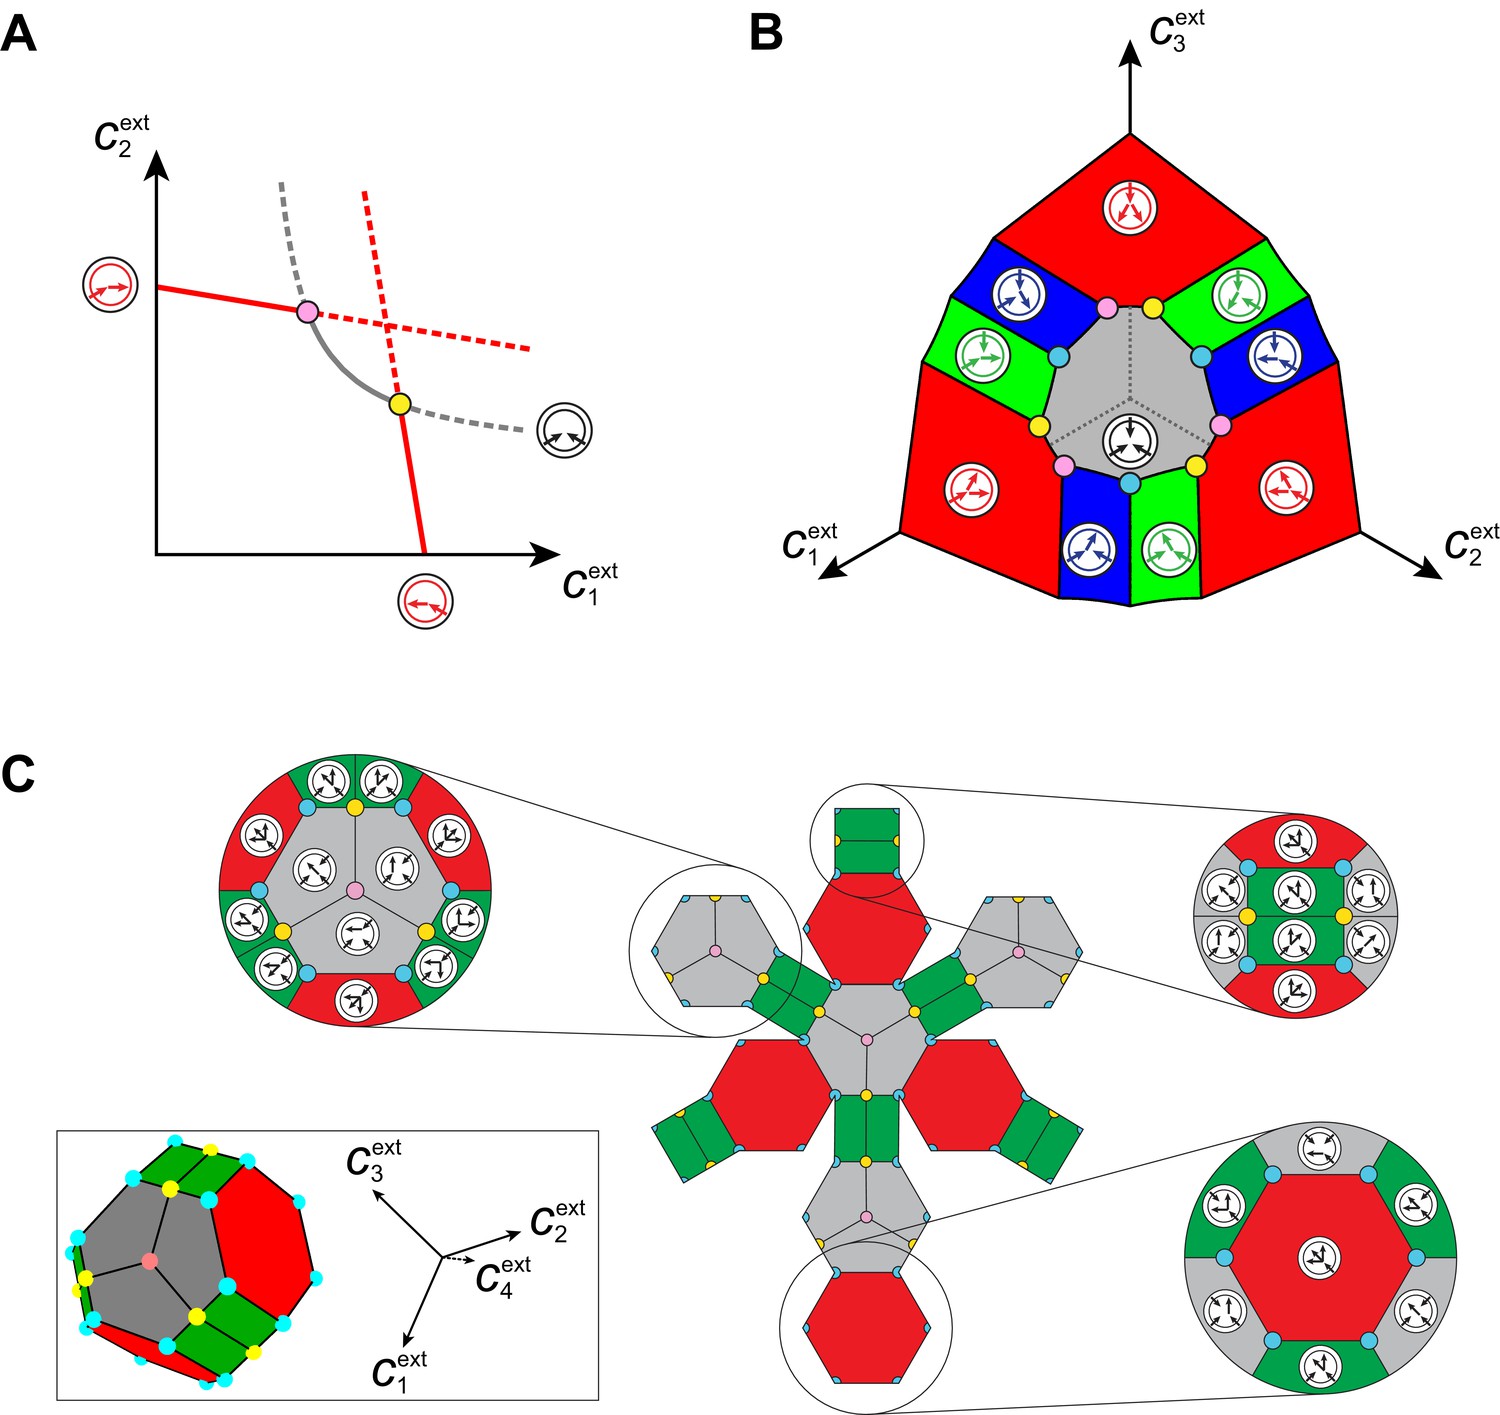
Emergence of microbial cartels at steady state.
For large enough supply rates, population dynamics drive the external building-block concentrations towards steady-state values that satisfy growth rate equals death rate, . Consortia emerge at concentrations for which distinct metabolic classes are jointly optimal. Cartels are consortia with at least distinct metabolic classes. (A) For , a pure-converter strategy is optimal on each of the red curves, while a pure-importer strategy is optimal on the grey curve. Cartels with two distinct cell types exist at the intersection of the grey curve and a red curve. (B) For , a pure-converter strategy is optimal on the red patches, mixed strategies are optimal on the blue and green patches, while a pure-importer strategy is optimal on the grey patch. There are two types of cartels at the intersection of patches: distinct cartels with well-ordered external concentrations (yellow and pink), e.g. , and distinct cartels with degenerate external concentration ordering (cyan), e.g. . (C) Graph structure of microbial cartels for building blocks. As cartels can be labelled by ordering of resource availability, their graph structure is closely related to permutohedron solids, such as the truncated octahedron for (inset: the interior of the truncated octahedron for corresponds to the grey patch shown in (B) for ) In addition to the metabolic types shown, each cartel includes a pure-importer strategy, so that blue and pink cartels have distinct types while yellow cartels have distinct types. In all panels, the circular arrow diagrams depict the metabolic strategies present.
Figure 7

Supply sectors associated with microbial cartels.
(A–B): For steady-state concentrations , only a converter strategy can survive (white dot in A). The corresponding set of supply rates and lie on a line (labelled by a white dot in B). Increasing the supply rate causes concentration to increase, until a pure-importer strategy can survive at and (pink dot in A). Any further increase of no longer affects and and is solely dedicated to biomass growth. (C–D): For steady-state concentrations , only a pure-importer strategy can survive (white dot in C). The corresponding set of supply rates and lie on a line (labelled by a white dot in D). Increasing the supply rate causes concentration to increase, until a converter strategy can survive at and (pink dot in C). Any further increase of no longer affects and and is solely dedicated to biomass growth. (E–F): Supply conditions compatible with the emergence of a cartel for (E) and (F) . The set of supply rates for which cartels can arise define non-overlapping polyhedral -dimensional cones, with parallel or diverging faces between neighboring cartels, i.e. cartels that share metabolic classes. For , the boundaries of the pink cartel supply sector correspond to the lines labelled by pink dots in (B) and (D). Outside of these cones, only fewer than strategies can survive.
Figure 8
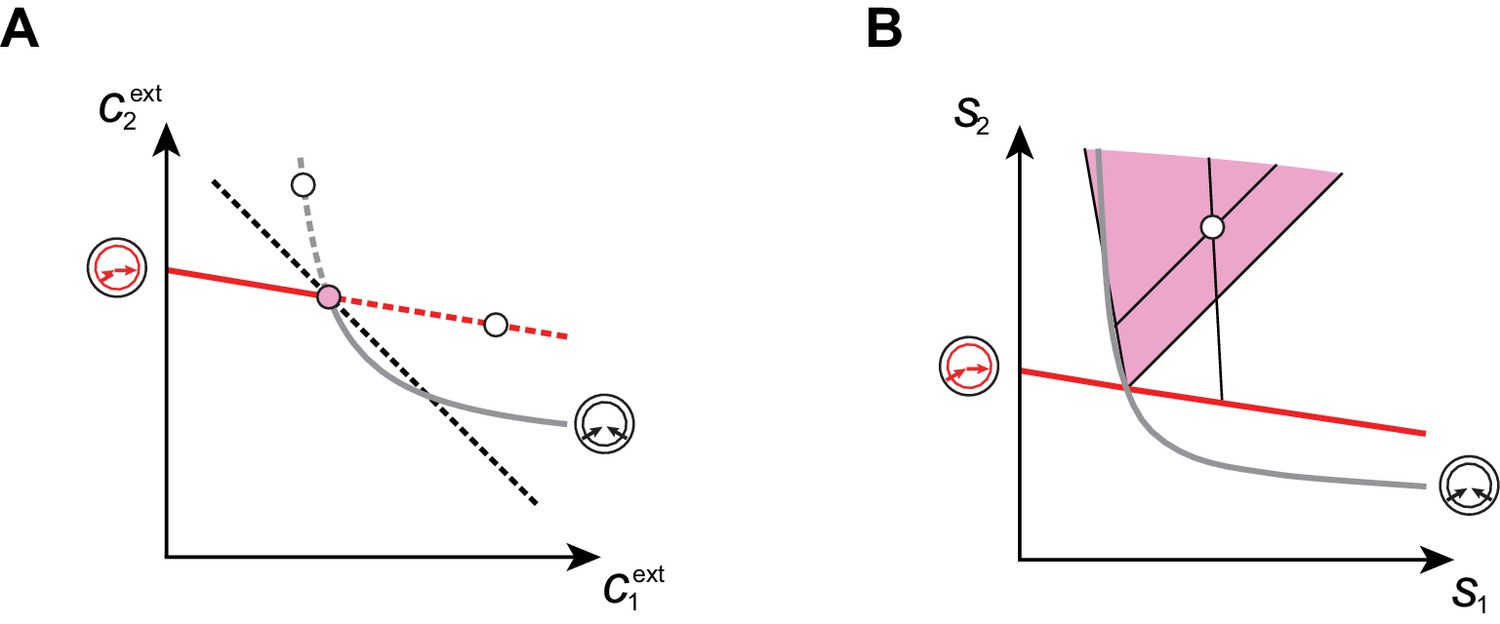
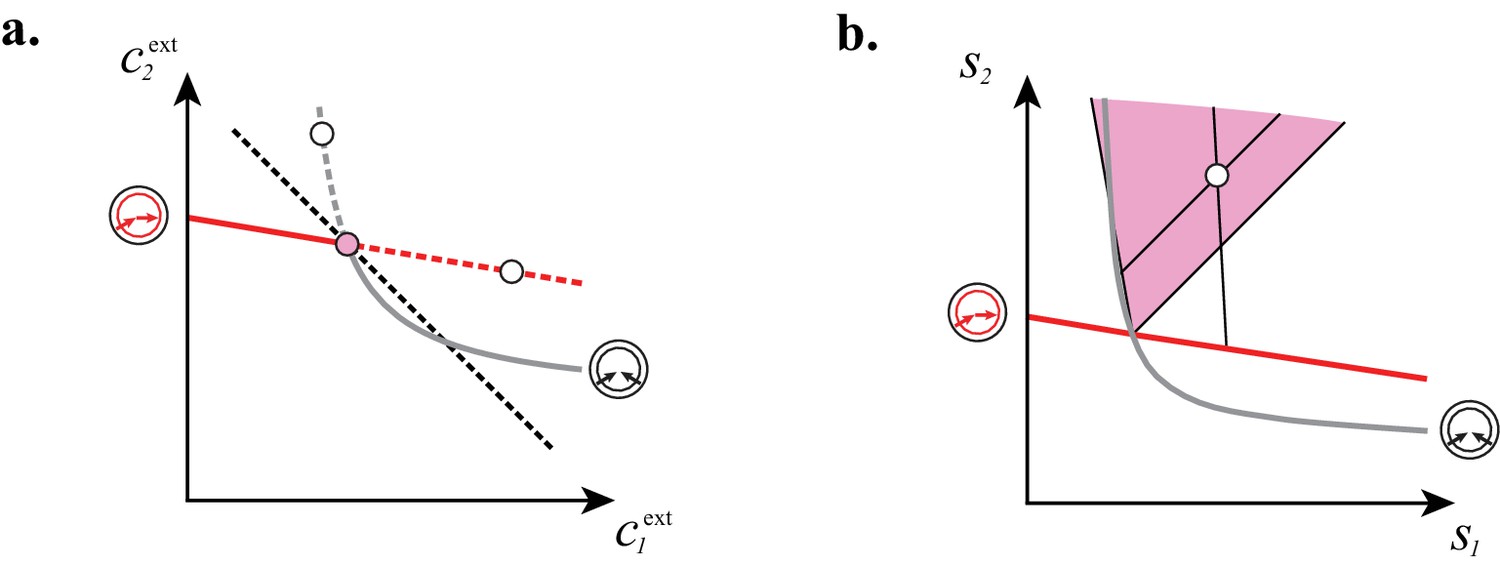
Cartels yield optimal biomass at steady supply.
Steady-state concentrations and that satisfy (above the dashed black line in A) imply smaller biomass yields than achieved by the microbial cartel that exists for and (pink dot in A). The supply sector associated with the cartel defines a cone (pink region in B). For given supply rates in the cartel supply sector (white dot in B), the black lines represent the supply sectors of the pure-importer strategy and of the pure-converter strategy that are optimal when present alone (as opposed to being in a cartel). The intersection of these non-cartel supply sectors (black lines in B) with the steady-state curves (red and grey curves in B) define concentrations and for which (white dots in A). This result is generic for any supply rates in the cartel supply sector; thus a pure-importer or a pure-converter strategy alone leads to steady-state concentrations with a smaller biomass yield than the cartel. We did not take into account the other converter strategy, belonging to the other cartel (yellow sector in Figure 7E), since this cartel can only be optimal for , which never happens for .
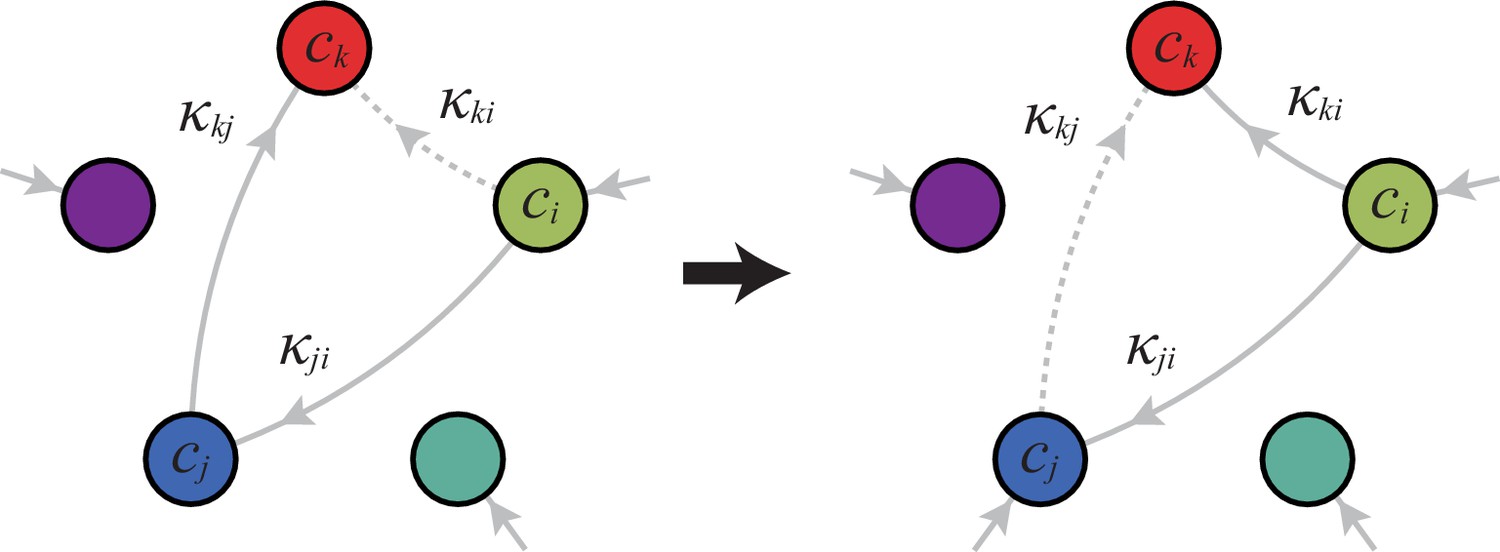
Appendix 3—figure 1
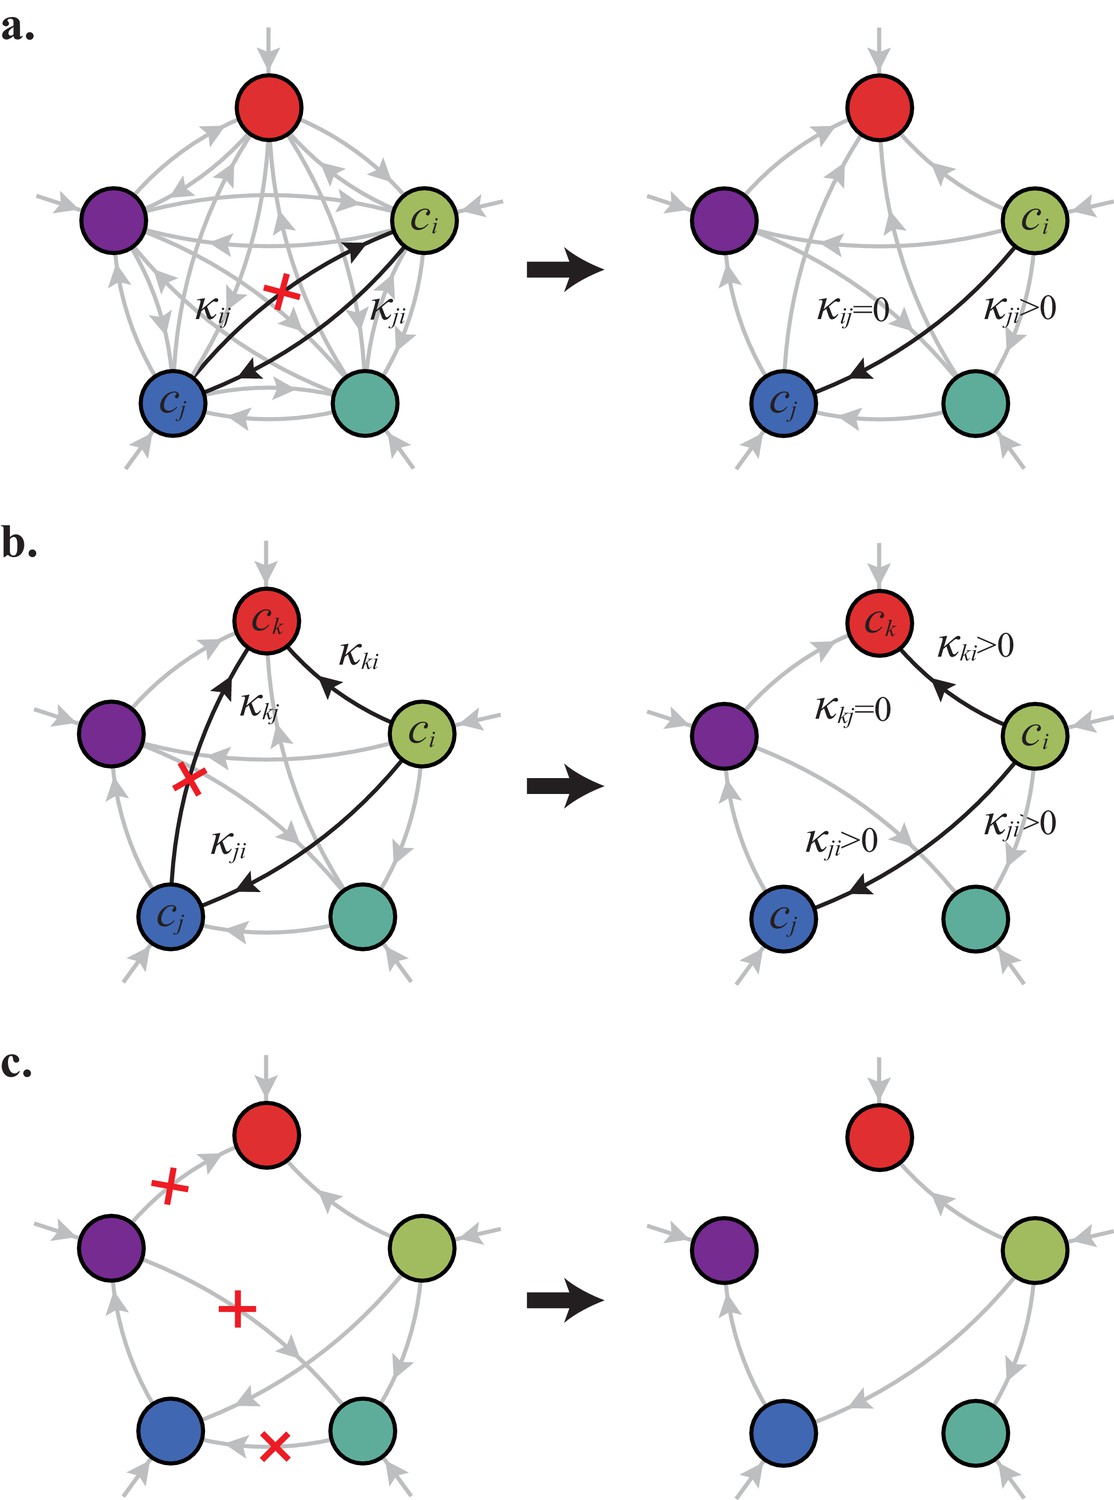
For fixed external concentrations, optimal networks are ‘forests of trees’.
(a) Optimal metabolic classes cannot have topological 2-cycles. If cell type (left) is such that the net conversion flux from block to block is positive, i.e. , a cell type (right) that only differs from by and achieves the same growth rate as but more economically. (b) Optimal metabolic classes cannot have topological -cycles. For cell type (left) with a topological -cycle, a cell type (right) that differs from by , and , achieves the same growth rate as but more economically. (c) More generally, optimal metabolic classes have no topological cycles, i.e. the graphs of their metabolic networks have a tree structure.
Appendix 3—figure 2
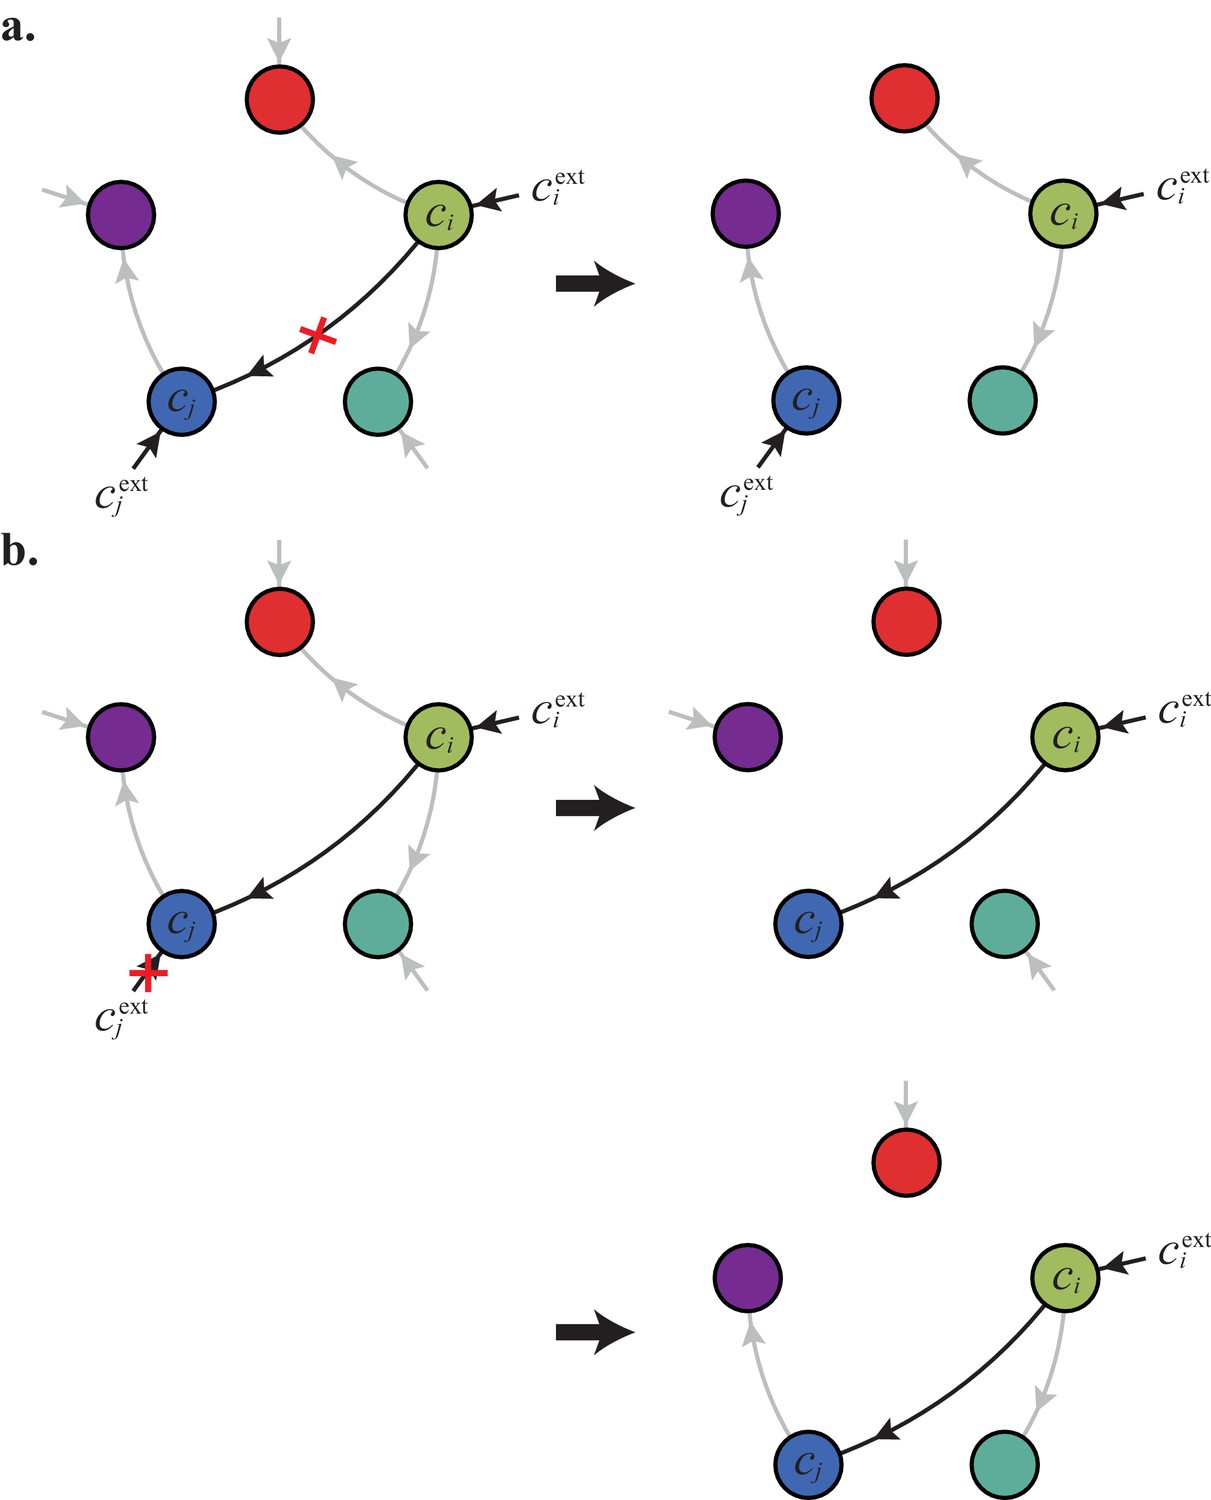
For fixed external concentrations, optimal metabolic classes use a single precursor for each converted building block.
If cell type (left) accumulates block by import and by conversion from , there is always a more economical strategy (right) for which either (a) or (b).
Appendix 3—figure 3
Optimal metabolic classes convert building blocks in the minimum number of steps.
If cell type (left) accumulates block via a -step conversion from block , there is always a more economical strategy (right) that converts block directly into block .
Appendix 3—figure 4

Optimal metabolic classes can only have a single tree of direct conversion(s).
For building block, there are such network topologies. Taking into account building-blocks permutations leads to metabolic types.
Appendix 4—figure 1
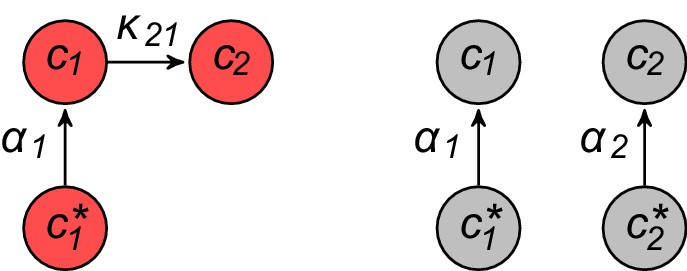
Microbial cartels for 2 building blocks.
https://doi.org/10.7554/eLife.22644.015
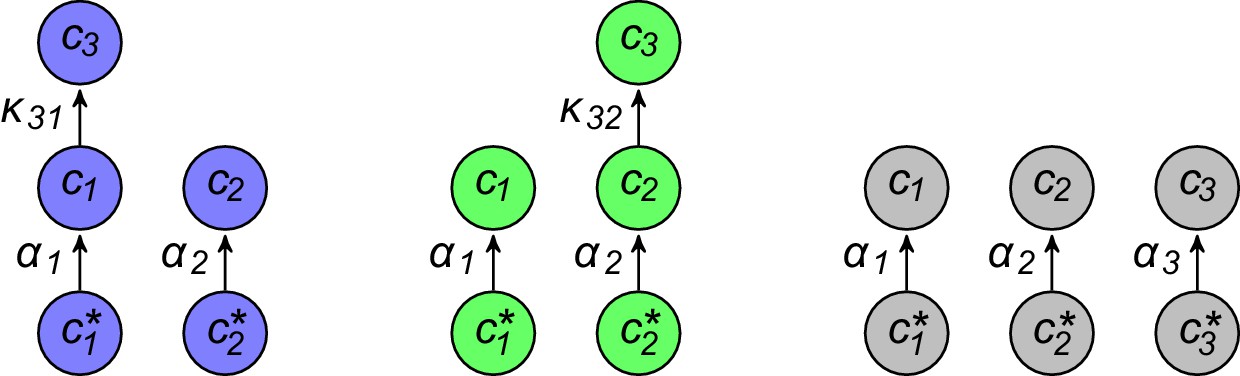
Appendix 4—figure 2
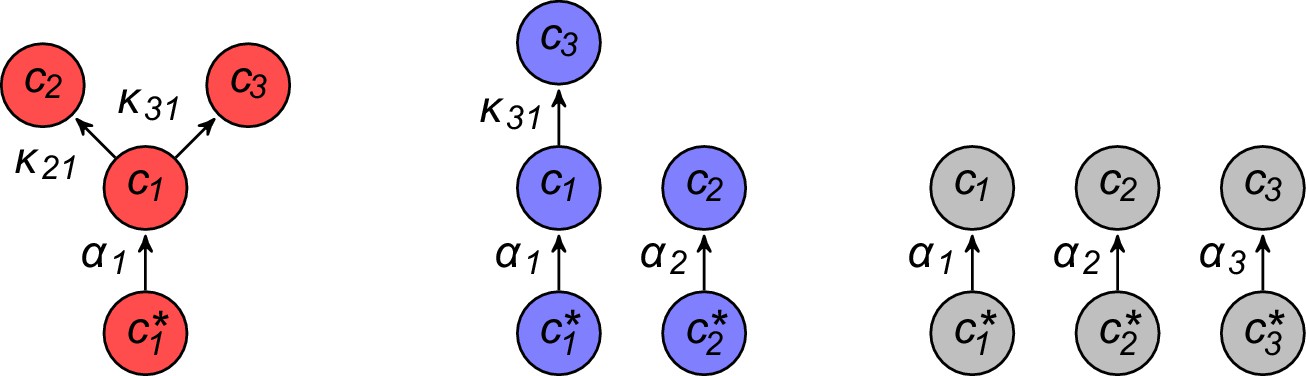
Microbial cartel for 3 building blocks with well-ordered concentrations.
https://doi.org/10.7554/eLife.22644.016
Appendix 4—figure 3
Microbial cartel for 3 building block with degenerate order among building-block concentrations.
https://doi.org/10.7554/eLife.22644.017
Appendix 4—figure 4
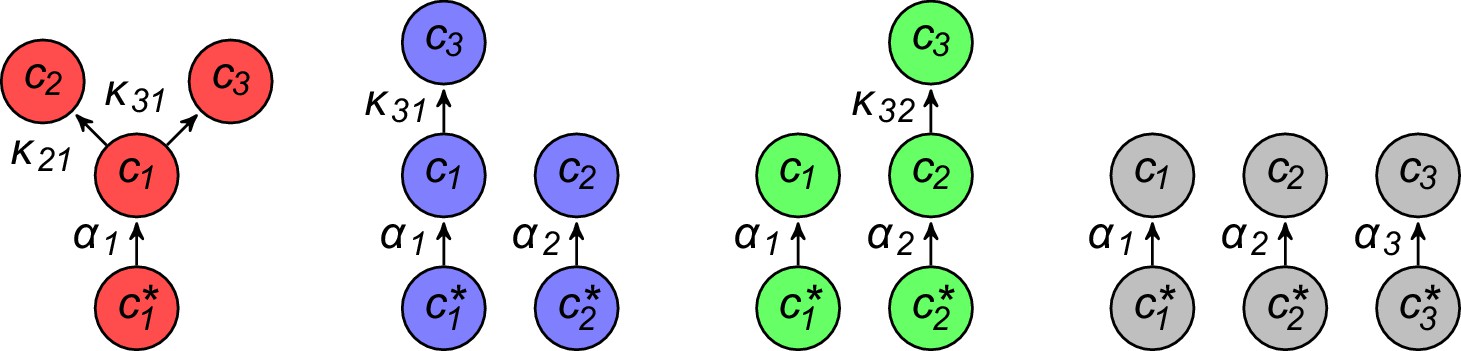
Merged microbial cartel for 3 building blocks.
https://doi.org/10.7554/eLife.22644.018
Appendix 4—figure 5
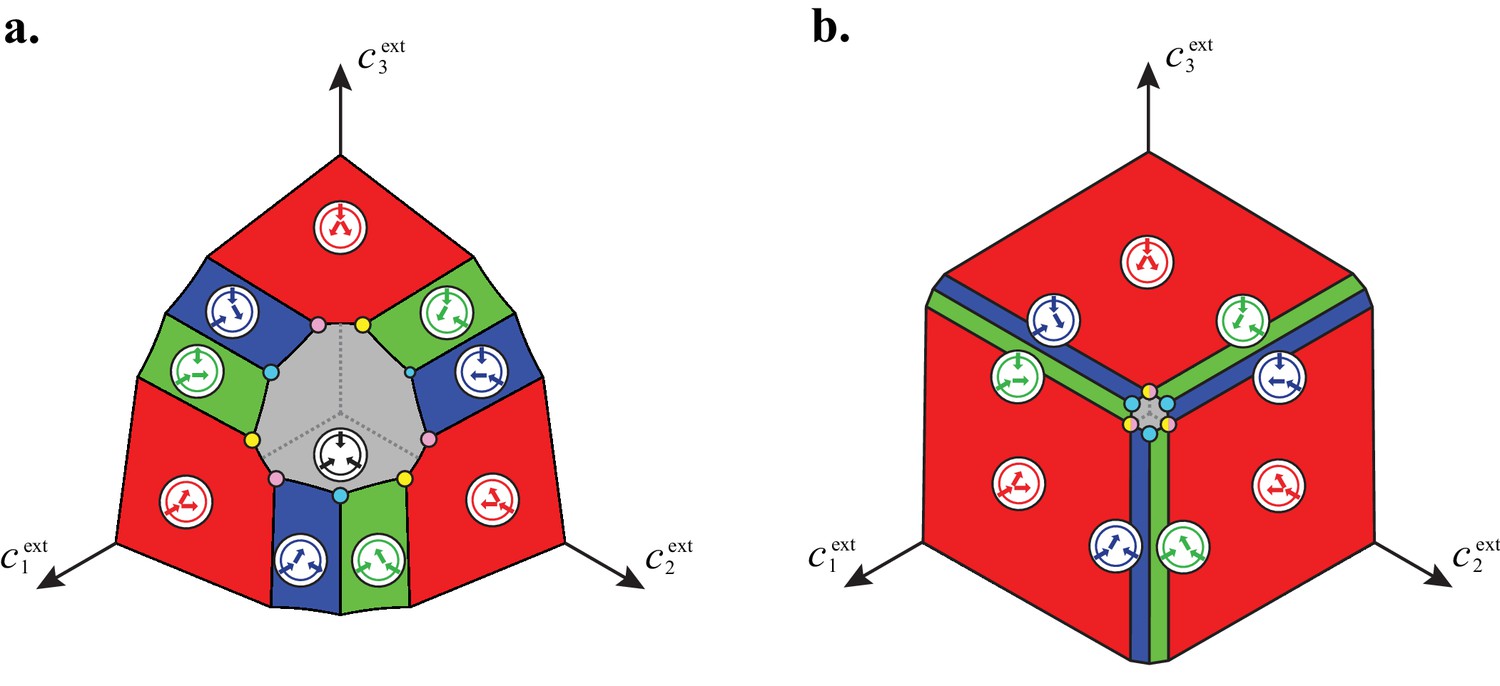
For large enough supply rates, population dynamics drive the external building-block concentrations towards steady-state values that satisfy growth rate equals death rate, .
Consortia emerge at concentrations for which distinct metabolic classes are jointly optimal. For , a pure-converter strategy is optimal on the red patches, mixed strategies are optimal on the blue and green patches, while a pure-importer strategy is optimal on the grey patch. There are two types of cartels at the intersection of patches: distinct cartels with well-ordered external concentrations (yellow and pink), e.g. , and distinct cartels with degenerate external concentration ordering (cyan), e.g. . For both panels, we take , , , . a. For a moderate enzyme budget , there are cartels of coexisting strategies. b. For a large enzyme budget , pairs of consortia merge, yielding cartels of coexisting strategies and cartels of coexisting strategies.
Appendix 7—figure 1
Cartels direct their resources toward biomass growth.
a and b: For steady-state concentrations , only a converter strategy can survive (white dot in a). The corresponding set of supply rates and lie on a line (labelled by a white dot in b). Increasing the supply rate causes concentration to increase at the expense of , until a pure-importer strategy can survive at and (pink dot in a). Any further increase of no longer affects and and is solely dedicated to biomass growth. c and d: For steady-state concentrations , only a pure-importer strategy can survive (white dot in c). The corresponding set of supply rates and lie on a line (labelled by a white dot in d). Increasing the supply rate causes concentration to increase at the expense of , until a converter strategy can survive at and (pink dot in c). Any further increase of no longer affects and and is solely dedicated to biomass growth.
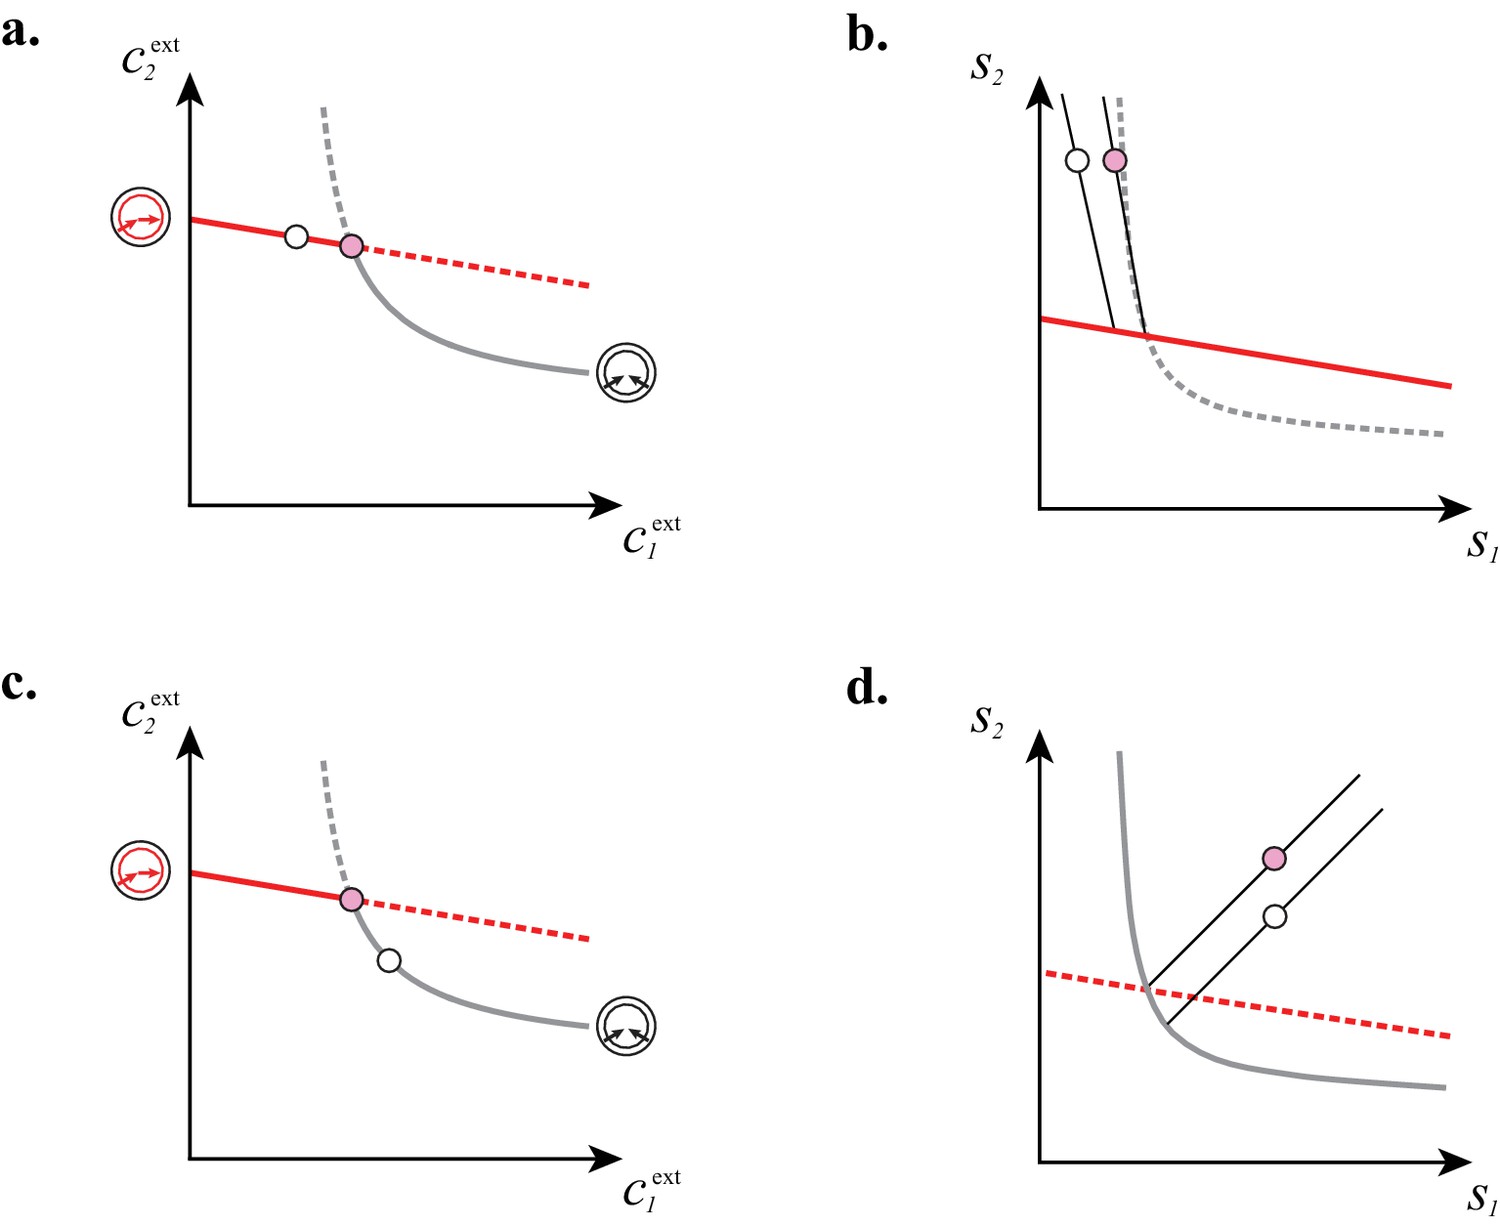
Appendix 7—figure 2
At fixed supply rates, microbial cartels achieve optimal biomass yield.
a and b: Steady-state concentrations and that satisfy (above the dashed black line in a imply smaller biomass yields than achieved by the microbial cartel that exists for and (pink dot in a). The supply sector associated with the cartel defines a cone (pink region in b). For given supply rates in the cartel supply sector (white dot in b), the black lines represent the supply sectors of the pure-importer strategy and of the pure-converter strategy that are optimal when present alone (as opposed to being in a cartel). The intersection of these non-cartel supply sectors (black lines in b) with the steady-state curves (red and grey curves in b) define concentrations and for which (white dots in a). This result is generic for any supply rates in the cartel supply sector; thus a pure-importer or a pure-converter strategy alone leads to steady-state concentrations with smaller biomass yield than the cartel. We did not take into account the other converter strategy, belonging to the other cartel, since this cartel can only be optimal for , which never happens for .
Download links
A two-part list of links to download the article, or parts of the article, in various formats.
Downloads (link to download the article as PDF)
Open citations (links to open the citations from this article in various online reference manager services)
Cite this article (links to download the citations from this article in formats compatible with various reference manager tools)
Microbial consortia at steady supply
eLife 6:e22644.
https://doi.org/10.7554/eLife.22644


