Global analysis of gene expression reveals mRNA superinduction is required for the inducible immune response to a bacterial pathogen
- University of California, Berkeley, United States
- Howard Hughes Medical Institute, University of California, Berkeley, United States
Abstract
The inducible innate immune response to infection requires a concerted process of gene expression that is regulated at multiple levels. Most global analyses of the innate immune response have focused on transcription induced by defined immunostimulatory ligands, such as lipopolysaccharide. However, the response to pathogens involves additional complexity, as pathogens interfere with virtually every step of gene expression. How cells respond to pathogen-mediated disruption of gene expression to nevertheless initiate protective responses remains unclear. We previously discovered that a pathogen-mediated blockade of host protein synthesis provokes the production of specific pro-inflammatory cytokines. It remains unclear how these cytokines are produced despite the global pathogen-induced block of translation. We addressed this question by using parallel RNAseq and ribosome profiling to characterize the response of macrophages to infection with the intracellular bacterial pathogen Legionella pneumophila. Our results reveal that mRNA superinduction is required for the inducible immune response to a bacterial pathogen.
https://doi.org/10.7554/eLife.22707.001eLife digest
We are constantly exposed to microbes that are capable of causing disease, but our immune system is generally able to protect us by producing specific proteins that help kill the microbes. In response, many infectious microbes have developed ways to obstruct the immune system of their host. For example, a bacterium called Legionella pneumophila – which can cause serious lung infections – blocks the ability of host immune cells to generate new proteins.
To make a new protein, genetic information in the form of DNA is first copied to make molecules called messenger ribonucleic acids (or mRNAs for short). These molecules are then used as templates to make the protein. Despite the fact that L. pneumophila is capable of interfering with this vital process, the host is still able to mount a protective immune response. It was not clear how this is possible.
To address this question, Barry et al. studied immune cells from mice that had been infected with L. pneumophila. The experiments show that these immune cells produce large amounts of mRNAs that correspond to proteins needed for the immune response. These mRNAs overwhelm the protein production block imposed by the bacteria, allowing the immune cells to produce these proteins and trigger an immune response.
The experiments suggest that, in response to microbes that block the production of proteins, changes in the amount of mRNA in a cell are the strongest indicators of how much protein the cells will be able to produce. These findings shed new light onto how the immune system can overcome interference by microbes to protect the host.
https://doi.org/10.7554/eLife.22707.002Introduction
Gene expression is a concerted process that is regulated at multiple steps, including transcription, mRNA degradation, translation, and protein degradation. Most global studies of gene expression have focused on the transcriptional response, but the relative importance of transcription in determining protein levels remains debated (Li et al., 2014; Schwanhäusser et al., 2011; Breker and Schuldiner, 2014; Maier et al., 2009; Vogel and Marcotte, 2012; de Sousa Abreu et al., 2009). One recent study analyzed the response of dendritic cells to lipopolysaccharide (LPS) and found that changes in mRNA levels accounted for ~90% of observed alterations in protein levels (Jovanovic et al., 2015). However, the response to infection with a virulent pathogen is certainly more complicated than the response to a purified immunostimulatory ligand such as LPS. Indeed, pathogens have evolved to disrupt or manipulate almost every cellular process involved in gene expression (Finlay and McFadden, 2006). An effective innate immune response to infection therefore requires that host cells be able to induce appropriate responses in the face of pathogen manipulation.
Inhibition of host protein synthesis is a common strategy used by many viral and bacterial pathogens to disrupt host gene expression (Mohr and Sonenberg, 2012; Lemaitre and Girardin, 2013). For example, the intracellular bacterial pathogen L. pneumophila uses its Dot/Icm type IV secretion system (T4SS) to translocate into host cells several effector proteins that block host protein synthesis, including at least four effectors that target the elongation factor eEF1A (Lemaitre and Girardin, 2013; Barry et al., 2013; Belyi et al., 2008; Fontana et al., 2011; Shen et al., 2009). Similarly, the bacterial pathogen Pseudomonas aeruginosa blocks host translation elongation by secretion of exotoxin A (Lemaitre and Girardin, 2013; Dunbar et al., 2012; Iglewski et al., 1977). Interestingly, we previously discovered that host cells respond to protein synthesis inhibition — whether by Legionella, exotoxin A, or by pharmacological agents that block translation initiation or elongation — by initiating a specific host response characterized by production of specific pro-inflammatory cytokines, including interleukin-23 (Il23a), granulocyte macrophage colony-stimulating factor (Csf2) and interleukin-1α (Il1a) (Barry et al., 2013; Fontana et al., 2011). The mechanism by which infected host cells are able to produce certain cytokines despite a global (>90%) block in protein synthesis remains unclear, but at least two distinct models have been proposed (Mohr and Sonenberg, 2012; Lemaitre and Girardin, 2013; Barry et al., 2013; Fontana et al., 2011; Dunbar et al., 2012; Fontana and Vance, 2011; McEwan et al., 2012; Chakrabarti et al., 2012). One model posits that the block in protein synthesis leads to superinduction of cytokine mRNAs that is sufficient to overcome the partial block in host protein synthesis (Barry et al., 2013; Fontana et al., 2011). Alternatively, it has been proposed that host cells may circumvent the global block in protein synthesis by selective translation of specific cytokine transcripts (Dunbar et al., 2012; Asrat et al., 2014).
To determine how host cells mount an inflammatory response when protein synthesis is disrupted, we performed parallel RNAseq and ribosome profiling (Ingolia et al., 2012, 2009, 2011) of Legionella-infected mouse primary bone-marrow-derived macrophages (BMMs). The results reveal the relative contributions of translational regulation and mRNA induction in controlling immune responses to pathogenic L. pneumophila, and support a model in which the majority of gene induction in response to pathogenic infections occurs at the level of mRNA induction. We were able to identify a subset of mRNAs that display higher-than-average ribosome occupancy, but the elevated occupancy of these mRNAs was observed in uninfected cells as well as in cells infected with L. pneumophila. We propose that mRNA superinduction provides a robust mechanism for host cells to initiate a response to infection despite pathogen-mediated disruption of host gene expression.
Results
mRNA superinduction mediates the host response to virulent L. pneumophila
The relative role of transcription versus translation in mediating the inducible response to an infection with a virulent bacterial pathogen remains unclear. Thus, we performed ribosome profiling (Ingolia et al., 2012, 2009, 2011) and total (rRNA-depleted) RNA sequencing of BMMs infected with L. pneumophila. BMMs were infected with a virulent ΔflaA strain, an avirulent T4SS-deficient ΔdotAΔflaA strain, or a Δ7ΔflaA strain that lacks the seven effectors associated with inhibition of host protein synthesis. RNA was isolated at 6 hr post-infection, which was the earliest we could detect significant L. pneumophila-induced translation inhibition without marked cytotoxicity (data not shown). L. pneumophila strains on the ΔflaA background were used to reduce cell cytotoxicity by avoiding the effects of NAIP5/NLRC4 inflammasome activation by flagellin (Molofsky et al., 2006; Ren et al., 2006) and we previously showed loss of flagellin does not affect blockade of host translation or the transcriptional induction of inflammatory cytokines (Barry et al., 2013). Control experiments demonstrated that ~90% of macrophages were infected with at least one bacterium under our infection conditions (Figure 1—figure supplement 1A–B).
Lysates from infected macrophages were split and used to generate ribosome profiling libraries and RNAseq libraries, thereby allowing us to compare directly the mRNA levels and ribosome occupancy of those mRNAs from the same cells. As a confirmation of the quality of the ribosome profiling libraries, ribosome footprints were found to map preferentially to the exonic regions of infection-induced genes (Figure 1), and showed a strong bias toward 27–28 nucleotide fragment lengths (Figure 1—figure supplement 2), consistent with the known size of ribosome-protected footprints. In accord with previous studies, induction of ribosome footprints on Gem, Csf2, and Il23a required the seven-bacterial effectors associated with the block in host protein synthesis, while induction of ribosome footprints corresponding to Il1a and Il1b required the bacterial T4SS (Figure 1A–F).
Figure 1 with 2 supplements see all
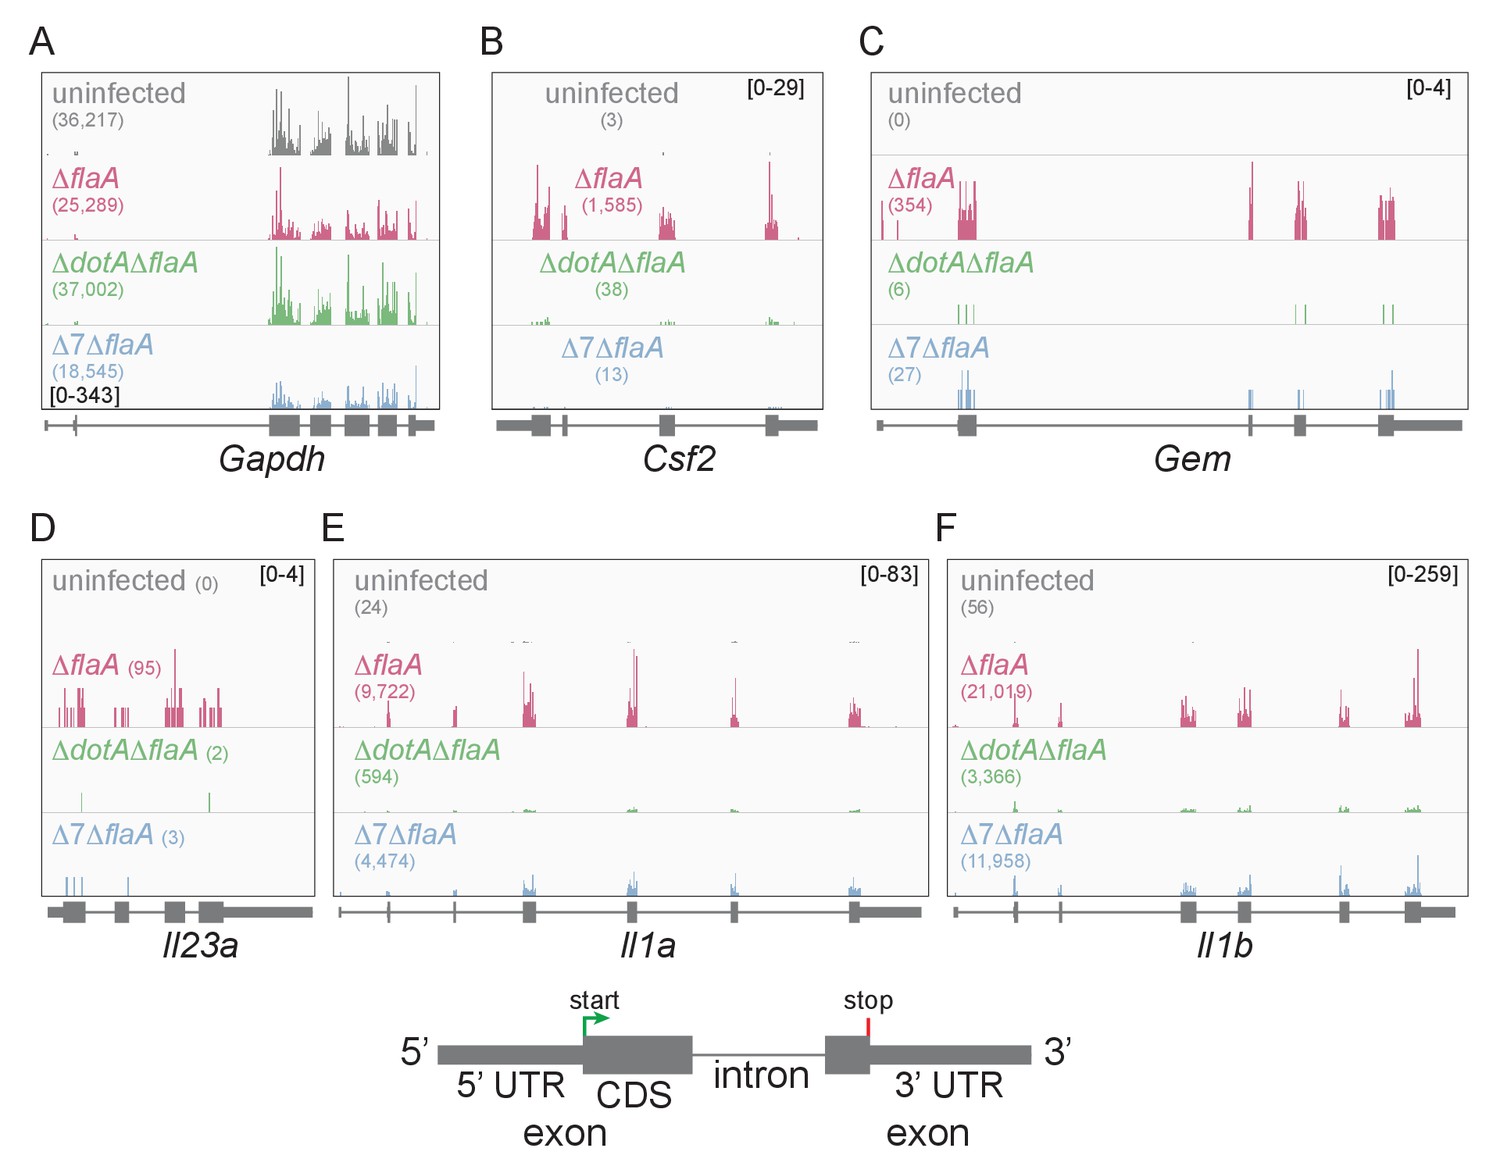
Mapping of ribosome profiling reads to the genomic sequence of specific L. pneumophila-induced genes of interest.
(A–F) Ribosome footprint reads were mapped to the genome and the number of footprints on the mRNAs for Gapdh (A), Csf2 (B), Gem (C), Il23a (D), Il1a (E), and Il1b (F) was visualized. Numbers in parentheses show the total read count of ribosome footprints found on the indicated transcript. Bracketed numbers represent read count data range. Gray, uninfected BMMs. Red, ΔflaA-infected BMMs. Green, ΔdotAΔflaA-infected BMMs. Blue, Δ7ΔflaA-infected BMMs.
We first analyzed WT BMMs for T4SS-dependent gene induction, defined as the ratio of normalized read counts in the virulent ΔflaA to avirulent ΔdotAΔflaA L. pneumophila-infected conditions (see Materials and methods). We found that the majority of T4SS-dependent increases in ribosome footprints could be explained at the level of mRNA induction, as there was nearly a perfect linear correlation between the extent of mRNA induction and ribosome footprints for all T4SS-induced genes (Figure 2A). This correlation held for numerous known pathogen-induced mRNAs, including Il23a, Gem, Csf2, Il6, Tnf, Cxcl1, Cxcl2, Dusp1, and Dusp2, as well as for the cytokines Il1a and Il1b that were previously proposed to be preferentially translated (Asrat et al., 2014). To confirm that cytokine protein levels correlate with mRNA levels, we infected BMMs with ΔflaA or ΔdotAΔflaA L. pneumophila and measured the levels of 42 cytokines or immune-related proteins in the supernatants or cell lysates of these BMMs at 6 hr, using commercially available bead arrays. Of the cytokines assayed, 18 cytokines/proteins were measured above the limit of detection in lysates, and 22 cytokines/proteins were measured above the limit of detection in supernatants. The T4SS-dependent fold-induction of these protein levels was plotted versus the T4SS-dependent fold-induction of mRNA levels (Figure 2B–C). We observed a robust correlation between the extent of mRNA induction and the extent of protein induction, particularly in lysates (Figure 2B). The correlation seems to apply for the most highly induced proteins/mRNAs (e.g. IL-10 (Il10) and GM-CSF (Csf2)) but also for more modestly induced cytokines (Il1a, Il1b, Cxcl10). The less robust correlation between mRNA levels and protein levels in the cell supernatant (Figure 2C) may reflect differing rates of secretion, accumulation in the supernatant over time, re-binding to cell surface receptors, and stability in the supernatant. Taken together, these results suggest that the inducible immune response to L. pneumophila is controlled primarily at the level of mRNA superinduction (Figure 2).
Figure 2
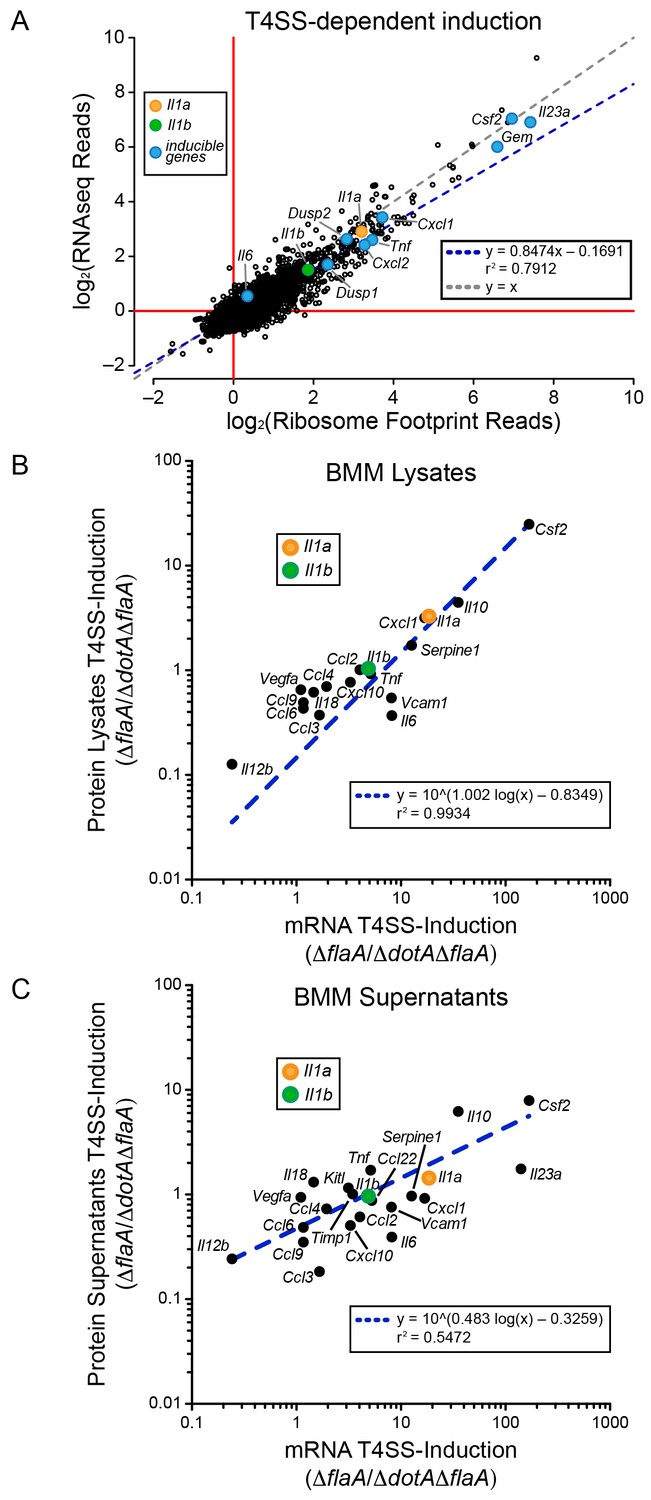
mRNA superinduction controls the T4SS-dependent induction of host gene expression in response to L. pneumophila.
(A) The ratio of ribosome footprint and RNAseq read counts for well-expressed transcripts (read count ≥100) in ΔflaA-infected versus ΔdotAΔflaA-infected B6 BMMs was calculated for each annotated transcript (open circles) in the dataset and plotted. (B–C) B6 BMMs were infected with ΔflaA or ΔdotAΔflaA L. pneumophila and at 6 hr post-infection proteins were measured in cell lysates (B) or supernatants (C) by bead array. The T4SS-induction (ΔflaA/ΔdotAΔflaA) of protein in supernatants (B) or lysates (C) and the T4SS-induction of mRNA (ΔflaA/ΔdotAΔflaA) was plotted. Proteins were normalized to total protein levels measured by BCA and RNAseq read counts was normalized to transcript length and the sum of their respective mitochondrial protein coding genes. Data are averaged from four (A) or two independent experiments (B–C). Orange circle, Il1a. Green circle, Il1b. Blue circle, subset of inducible genes. Grey dotted line, y = x. Blue dotted line, linear regression model. r2, coefficient of determination. See also Figure 2—source data 1.
-
Figure 2—source data 1
Source data from ribosome profiling, RNAseq, and bead array analysis used for Figure 2.
- https://doi.org/10.7554/eLife.22707.007
mRNA induction accounts for effector-induced gene expression
L. pneumophila uses multiple mechanisms to block host protein synthesis. It has been shown that up to seven bacterial effectors secreted into the host cytosol can block translation (Barry et al., 2013; Fontana et al., 2011). Interestingly, the ∆7 strain that lacks these effectors is still able to partially suppress host protein synthesis by a mechanism that remains to be fully characterized (Barry et al., 2013; Fontana et al., 2011; Ivanov and Roy, 2013). It has been proposed that T4SS-competent L. pneumophila damages host cell membranes, resulting in ubiquitylation-dependent downregulation of mTOR activity and a block in cap-dependent translation (Ivanov and Roy, 2013). Consistent with its ability to partially suppress protein synthesis, the ∆7 strain still provokes IL-1α production, although its ability to stimulate Il23a and Csf2 expression is diminished (Barry et al., 2013; Fontana et al., 2011).
To determine the mechanism of effector-triggered cytokine induction, we performed parallel RNAseq and ribosome profiling of BMMs infected either with ∆flaA or ∆7∆flaA L. pneumophila. As expected, induction of Gem, Il23a, and Csf2 is highly dependent on the seven bacterial effectors, but again, similar to the total T4SS-dependent gene induction (Figure 2), the seven effector-dependent induction of ribosome footprints on these genes could be explained at the level of mRNA induction (Figure 3A). While the seven effector-dependent induction of the genes Dusp1, Dusp2, Cxcl1, Cxcl2, Tnf, Il1a, Il1b, and Il6 was low, all changes in ribosome footprint reads could again be explained by changes in mRNA levels (Figure 3A). These data suggest that T4SS-dependent and seven bacterial effector-dependent induction of inflammatory cytokines occurs by the induction of mRNA transcripts rather than through a mechanism of selective ribosome loading of mRNAs.
Figure 3
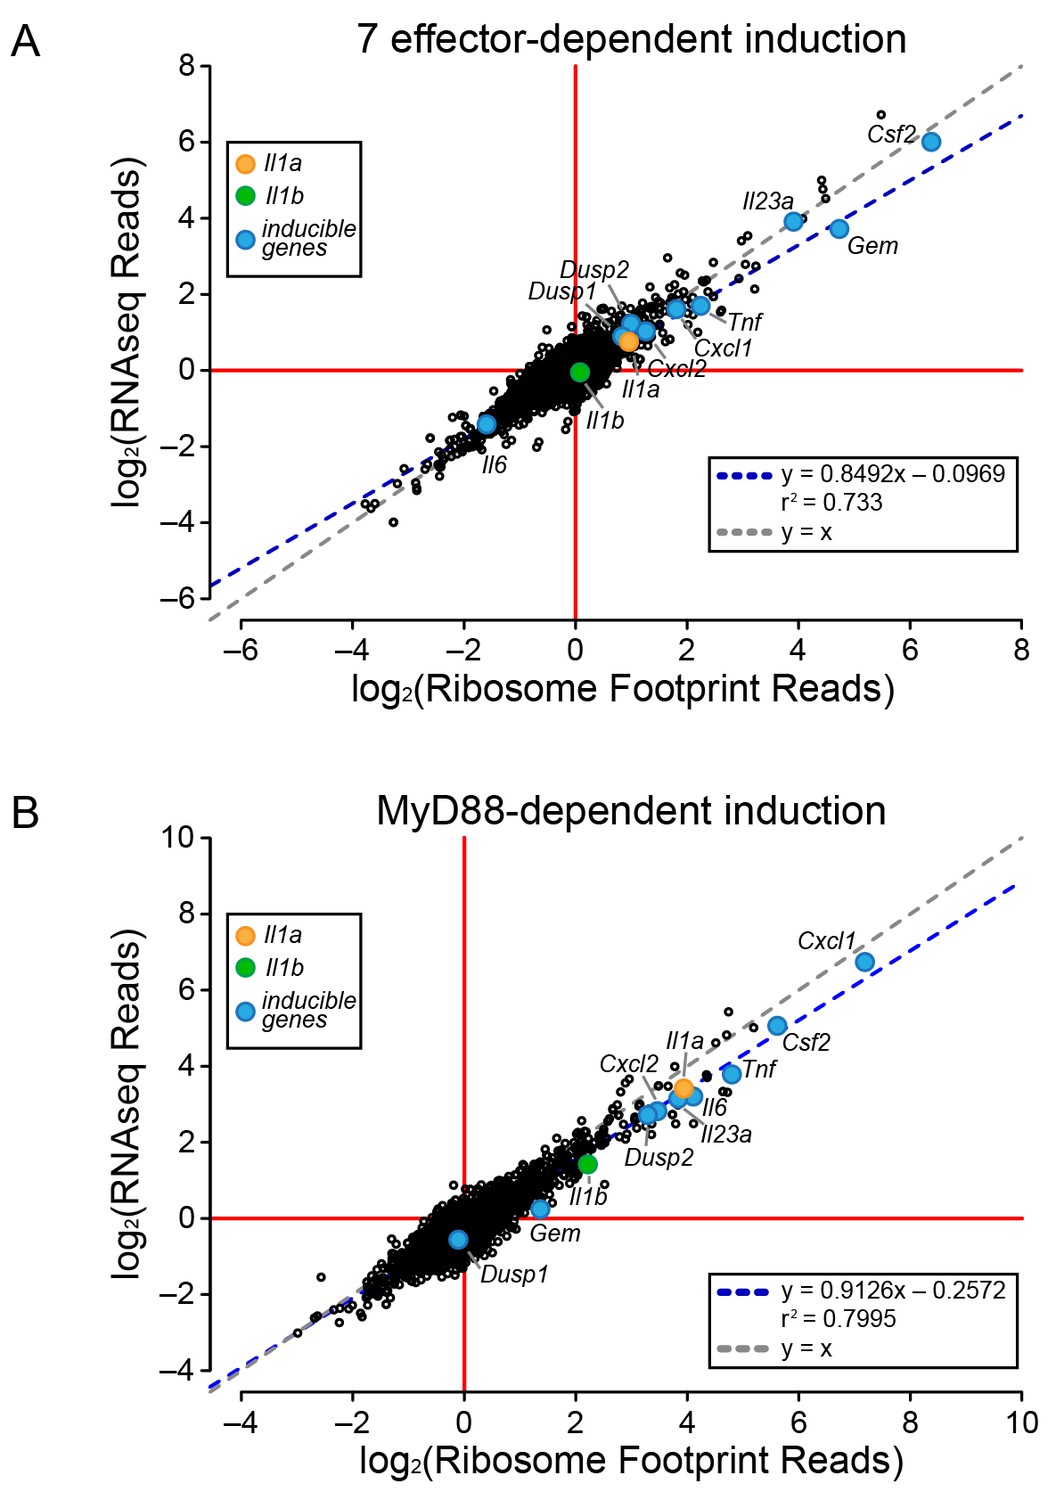
Global induction of mRNAs and ribosome footprints in response to L. pneumophila.
(A–B) Ribosome footprint and RNAseq read counts were sorted for well-expressed transcripts (read count ≥100) and normalized to the sum of their respective mitochondrial protein coding genes. The ratio of ribosome footprint and RNAseq read counts in (A) ΔflaA-infected and Δ7ΔflaA-infected B6 BMMs or (B) B6 or Myd88–/– BMMs infected with ΔflaA L. pneumophila was calculated for each annotated transcript (open circles) in the dataset and plotted. Data are averaged from two independent experiments. Orange circle, Il1a. Green circle, Il1b. Blue circle, subset of inducible genes. Grey dotted line, y = x. Blue dotted line, linear regression model. r2, coefficient of determination. See also Figure 3—source data 1.
-
Figure 3—source data 1
Source data from ribosome profiling and RNAseq analysis used for Figure 3.
- https://doi.org/10.7554/eLife.22707.009
MyD88 signaling in response to L. pneumophila is required for mRNA induction
It was previously proposed that specific transcripts, such as Il1a and Il1b, can be preferentially translated via a mechanism that requires signaling through the adaptor protein MyD88 (Asrat et al., 2014). Thus, we performed ribosome profiling and RNAseq on WT and Myd88–/– BMMs infected with ΔflaA L. pneumophila. For all MyD88-induced genes, including Il1a and Il1b, we observed a linear correlation between the induction of ribosome footprints and RNAseq reads (Figure 3B). This implies that MyD88-dependent induction of Il1a and Il1b ribosome footprints is controlled primarily at the level of mRNA induction, rather than at the level of selective ribosome loading of the mRNA. A similar pattern was also observed for other MyD88-induced genes, including Cxcl1, Csf2, Tnf, and Il6 (Figure 3B). Taken together, our results argue that the ability of host cells to overcome a pathogen-induced block in protein synthesis, and produce inflammatory cytokines such as IL-1α and IL-1β, requires a T4SS- and MyD88-dependent increase in mRNA levels rather than preferential loading of these cytokine mRNAs with ribosomes.
Ribosome occupancy of mRNAs varies but is independent of infection
The above analyses sought to determine whether T4SS-dependent or MyD88-dependent gene induction was due to increased mRNA levels or increased ribosome loading of mRNAs. However, the analyses did not reveal whether there is differential ribosome occupancy of constitutively expressed (i.e. non-induced) mRNAs. We thus analyzed the ratio of ribosome footprint reads to RNAseq reads for all (induced and non-induced) transcripts in uninfected BMMs, and in BMMs infected with ΔflaA, ΔdotAΔflaA, or Δ7ΔflaA L. pneumophila. This analysis revealed a wide range of ribosome occupancies across different transcripts (Figure 4A–D). As might be anticipated, many of the mRNAs with the highest ribosome occupancy encoded abundant ‘housekeeping’ proteins, including Acta1 and histone mRNAs (e.g. Hist1h2ba, H2afj, and Hist3h2ba) (Figure 4A; Table 1). Importantly, most mRNAs that exhibit increased ribosome occupancy in uninfected BMMs also exhibit increased ribosome occupancy in ΔflaA, ΔdotAΔflaA, or Δ7ΔflaA L. pneumophila-infected BMMs (Figure 4B–D; Table 1), implying that the increased ribosome occupancy of these mRNAs is constitutive and not induced in response to infection. A few mRNAs of immunological interest, namely Lyz1, S100a11, and Cxcl3 exhibited elevated ribosome occupancy in all infection conditions (Figure 4B–D; Table 1). In contrast, Ftl1 mRNA exhibited very low ribosome occupancy (Figure 4A), consistent with a previous report showing that Ftl1 translation can be strongly repressed (Cairo et al., 1989). Atf4 is another gene known to be regulated at the level of translation (Pavitt and Ron, 2012), and in ΔflaA and ΔdotAΔflaA L. pneumophila-infected BMMs, Atf4 exhibited low ribosome occupancy (Figure 4B–C). Atf4 was not expressed at high enough levels to be called as detected in uninfected or Δ7ΔflaA L. pneumophila-infected BMMs (Figure 4A and D). Taken together, our results reveal that several mRNAs exhibit constitutive increased or decreased ribosome occupancy, as expected. Despite this, ribosome occupancy of mRNAs was not markedly affected by L. pneumophila infection (Figure 4A–D).
Figure 4
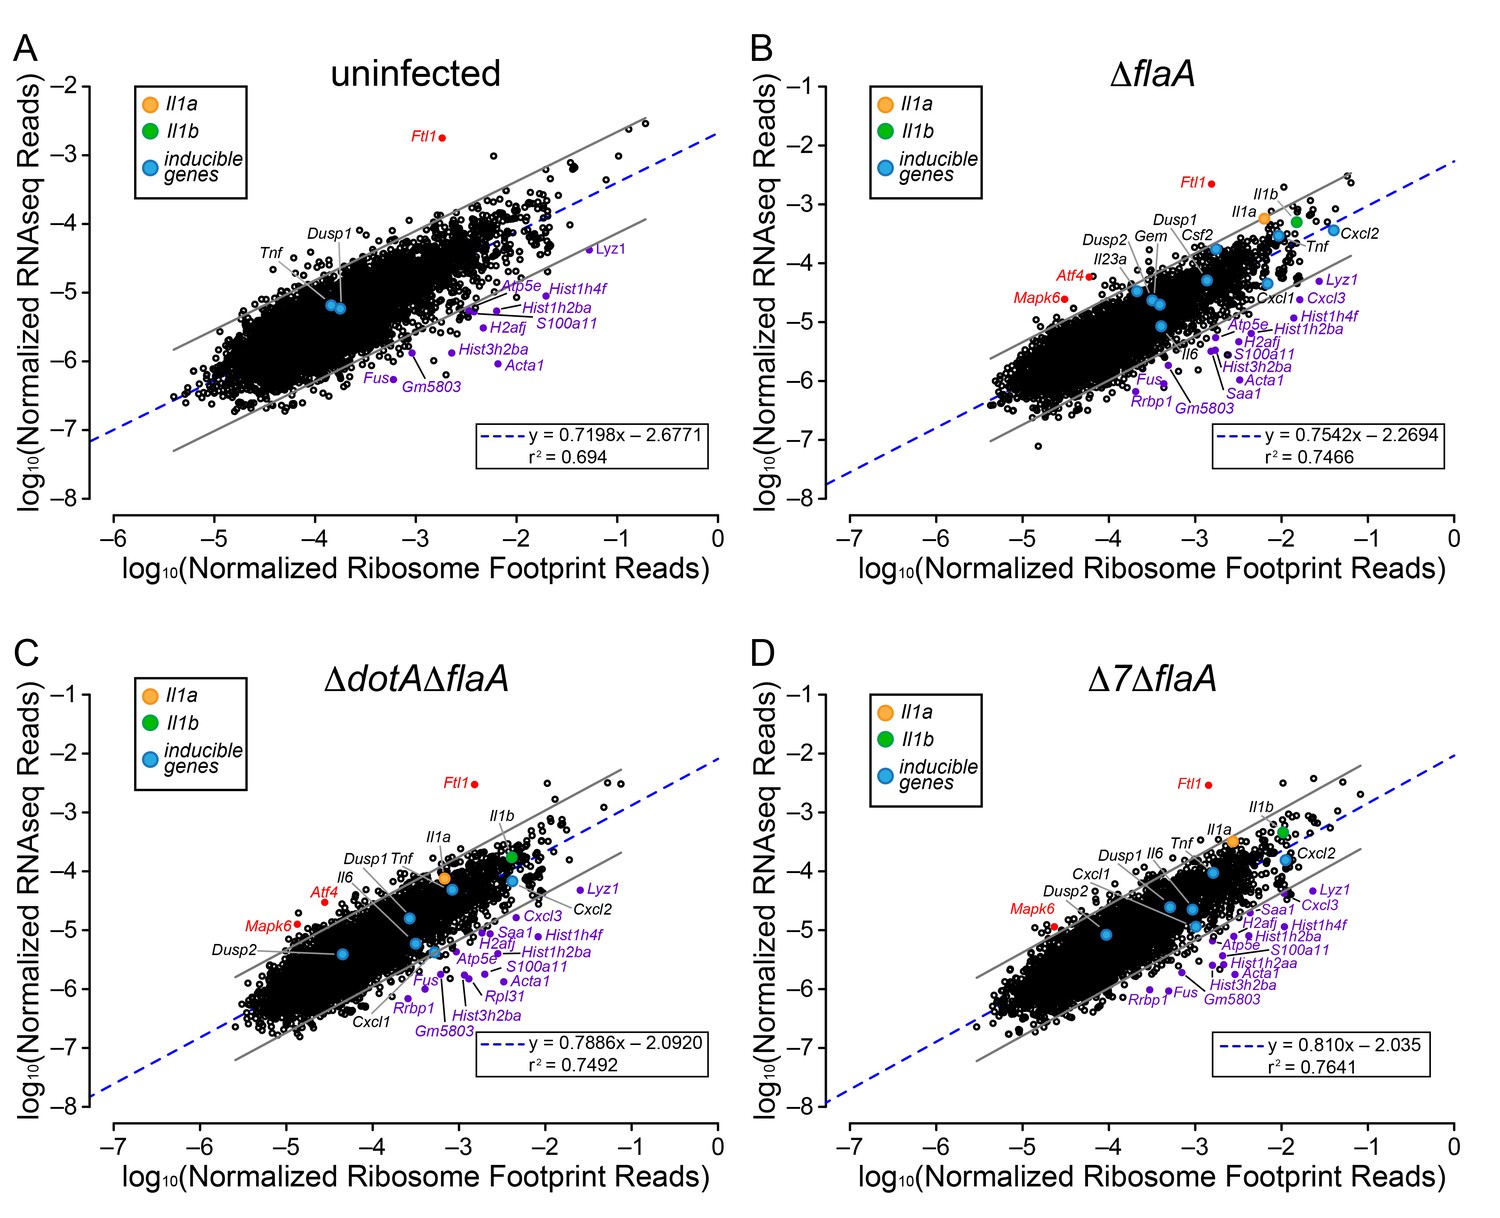
Ribosome occupancy does not explain the inducible innate immune response to L. pneumophila.
(A–D) Ribosome footprint and RNAseq read counts were sorted for well-expressed transcripts (read counts ≥ 100) and normalized to CDS length and the sum of their respective mitochondrial protein coding genes. The normalized read counts for ribosome footprints and RNAseq for all well-expressed annotated transcripts were plotted for (A) uninfected, (B) ΔflaA, (C) ΔdotAΔflaA, or (D) Δ7ΔflaA L. pneumophila-infected B6 BMMs. Red dots represent transcripts with low translation efficiency. Purple dots represent a number of transcripts common to all conditions that appear to have significantly higher ribosome occupancy. Data are averaged from three (A), four (B–C), or two independent experiments (D). Orange circle, Il1a. Green circle, Il1b. Blue circles, subset of inducible transcripts. Blue dotted line, linear regression model. Grey lines, 99% prediction interval. r2, coefficient of determination. See also Table 1 and Figure 4—source data 1.
-
Figure 4—source data 1
Source data from ribosome profiling and RNAseq analysis used for Figure 4.
- https://doi.org/10.7554/eLife.22707.011
Table 1
Transcripts with ribosome occupancy eight times greater than the condition average. Bolded, transcripts found in all conditions. Orange, transcripts found in three conditions. Purple, transcripts found in two conditions. Data are averaged from two independent experiments.
| Uninfected | ΔflaA | ΔdotAΔflaA | Δ7ΔflaA | ||||
|---|---|---|---|---|---|---|---|
| Gene | Riobosome occupancy | Gene | Riobosome occupancy | Gene | Riobosome occupancy | Gene | Riobosome occupancy |
| Acta1 | 7105.62 | Acta1 | 3137.40 | Acta1 | 2489.70 | Acta1 | 1633.44 |
| H2-Q7 | 3130.45 | Hist1h4f | 1177.90 | S100a11 | 1115.36 | Hist1h4f | 943.87 |
| Hist1h4f | 2195.70 | S100a11 | 870.51 | Hist1h4f | 1069.93 | Rpl31 | 893.93 |
| Hist3h2ba | 1715.98 | Hist1h2aa | 844.87 | Rpl31 | 873.61 | Hist1h2aa | 822.96 |
| H2afj | 1524.09 | Hist3h2bb-ps | 699.92 | Hist1h2ba | 707.62 | Hist3h2ba | 625.90 |
| Hist3h2bb-ps | 1470.88 | Hist1h2ba | 692.19 | Hist3h2ba | 670.32 | S100a11 | 565.91 |
| Lyz1 | 1260.16 | H2afj | 686.47 | Lyz1 | 533.22 | Fus | 532.18 |
| Hist1h2ba | 1174.16 | Cxcl3 | 675.23 | Hist3h2bb-ps | 524.22 | Hist1h2ba | 519.60 |
| Cd52 | 1170.22 | H2-T24 | 557.88 | Fus | 405.23 | Lyz1 | 498.70 |
| Fus | 1102.13 | Lyz1 | 551.76 | H2-T24 | 374.06 | H2-Q7 | 371.10 |
| H2-Q4 | 1022.17 | Hist3h2ba | 509.95 | Gm5803 | 345.78 | Gm5803 | 368.22 |
| Rpl38 | 1004.74 | Fus | 480.25 | H2-Q7 | 337.36 | H2afj | 356.99 |
| Hist2h2ab | 796.60 | Saa1 | 475.25 | Hist1h4i | 302.55 | Hist1h4i | 348.34 |
| H2-Q6 | 752.77 | Gm5803 | 436.48 | Cxcl3 | 281.86 | Hist1h4k | 318.08 |
| S100a11 | 717.99 | Hist1h4i | 333.72 | Saa1 | 265.08 | Rrbp1 | 306.19 |
| Gm5803 | 692.32 | Atp5e | 315.00 | Hist1h4n | 244.74 | Hist1h4j | 301.73 |
| Tmsb10 | 679.27 | Rrbp1 | 308.68 | Rrbp1 | 225.85 | Hist1h4a | 298.67 |
| H2-Q10 | 674.79 | Mt1 | 308.36 | Hist1h4j | 218.84 | Hist1h4h | 295.99 |
| Rpl36 | 672.43 | Hist1h4j | 304.87 | Hist1h4k | 217.89 | Hist1h4b | 288.98 |
| Mt1 | 672.29 | Hist1h4k | 303.19 | Atp5e | 217.08 | Hist1h4n | 272.04 |
| Hist2h2bb | 650.90 | Hist1h4h | 293.11 | H2-Q4 | 215.94 | BC094916 | 259.08 |
| H2-Q7 | 629.56 | Hist1h4a | 292.51 | Hist1h4h | 215.51 | Hist1h4c | 255.20 |
| H2-Q7 | 618.80 | Hist1h4b | 280.60 | H2afj | 206.14 | Cxcl3 | 252.49 |
| Atp5e | 606.27 | Gm11127 | 272.59 | Hist1h4a | 205.64 | Atp5e | 241.23 |
| H2-T24 | 601.41 | Hist1h4n | 265.41 | Hist1h4b | 197.15 | Saa1 | 220.10 |
| Rpl37 | 584.88 | Fkbp1a | 264.22 | Hist2h2bb | 191.90 | Myl12b | 210.72 |
| H2-T10 | 545.54 | Hist1h4c | Hist1h4c | Hist1h4c | 187.03 | Gm7030 | 206.93 |
| Hist1h4i | 529.15 | Gm7030 | 253.47 | Mt1 | 185.28 | ||
| Gm11127 | 512.74 | Myl12b | 247.71 | Cd52 | 184.14 | ||
| Uqcrq | 511.93 | Rps17 | 234.41 | Gm11127 | 183.08 | ||
| Emp1 | 494.39 | Cd52 | 231.77 | Hist1h2bj | 182.74 | ||
| Hist1h2bf | 484.53 | Sh3bgrl | 181.81 | ||||
| Gm7030 | 481.28 | ||||||
| Npc2 | 479.93 | ||||||
| Hist1h2bj | 478.33 | ||||||
| Usmg5 | 477.21 | ||||||
| Hmga2 | 468.10 | ||||||
Global analysis of translation inhibition by L. pneumophila
A benefit of ribosome profiling is that it permits the mapping of ribosome footprints with nucleotide resolution. Thus, to characterize the position of ribosomes on mRNAs after infection with L. pneumophila, we generated metagene ribosome footprint profiles from libraries generated from WT BMMs (Figure 5). Metagene profiles were generated by mapping the inferred A site position of ribosome footprint reads relative to the start (Figure 5A,C,E,G,I) or stop (Figure 5B,D,F,H,J) codon on a given transcript. Mapped reads were then summed to produce a global view of the distribution of ribosomes across all transcripts in our dataset. As expected from the known stepwise codon-by-codon movement of the ribosome, all metagene plots demonstrated a characteristic three-nucleotide periodicity (Figure 5). Interestingly, metagene ribosome profiles of uninfected (Figure 5A–B), ΔflaA (Figure 5C–D), ΔdotAΔflaA (Figure 5E–F), or Δ7ΔflaA (Figure 5G–H) infected BMMs appeared grossly similar to each other, even though global translation is blocked only in the ΔflaA and Δ7ΔflaA L. pneumophila-infected conditions (Barry et al., 2013; Fontana et al., 2011; Asrat et al., 2014). This result can be explained by the fact that ribosome metagene profiles do not distinguish whether ribosome footprints arise from stalled or translating ribosomes, unless the stall occurs at a characteristic distance from the start or stop codon. In fact, we did notice a slight increase in the number of ribosomes found at the start site of the transcript in Δ7ΔflaA L. pneumophila-infected BMMs as compared to other conditions (Figure 5I). This may reflect a selective block in translation initiation by this strain (see below). In addition, we noted that in all conditions, ribosomes accumulated at the stop codon, suggesting that, in BMMs, translation termination may be a limiting step in translation (Figure 5J).
Figure 5

Metagene profiles of L. pneumophila infected BMMs.
(A–J) Metagene profiles of uninfected (A–B), ΔflaA (C–D), ΔdotAΔflaA (E–F), Δ7ΔflaA (G–H) L. pneumophila-infected B6 BMMs and a merge (I–J). Metagene profiles are depicted relative to the translation start (A, C, E, G, I) and stop site (B, D, F, H, J). Metagene analyses show peaks at every three nucleotides, corresponding to the codon-to-codon shifts of the ribosome. Data are representative of two independent experiments (A–J). Black line, uninfected. Red line, ΔflaA-infected. Green line, ΔdotAΔflaA-infected. Blue line, Δ7ΔflaA-infected.
L. pneumophila blocks translation at the levels of initiation and elongation
To distinguish whether an observed ribosome footprint arises from a stalled or translating ribosome, we performed ribosome run-off experiments. In these experiments, new translation initiation was blocked by the drug harringtonine 120 s prior to cell lysis. Harringtonine inhibits the first rounds of peptide bond formation following ribosome subunit joining and results in accumulation of ribosomes at the translational start site and run-off of elongating (but not stalled) ribosomes that have already cleared the start codon (Ingolia et al., 2012, 2011; Huang and Harringtonine, 1975; Tscherne and Pestka, 1975; Fresno et al., 1977). Importantly, cells experiencing a block in translation elongation will exhibit less ribosome run-off after harringtonine treatment, and an increased number of reads at the 5ʹ end of mRNAs after drug treatment (Ingolia et al., 2011), compared to cells in which elongation is not blocked.
As expected, uninfected and ΔdotAΔflaA-infected BMMs show an increase in ribosome footprints at the translation start site and a preferential loss of ribosome footprints from the 5ʹ and 3ʹ end of mRNAs, consistent with the expected effects of harringtonine and demonstrating clear ribosome run-off (Figure 6A–B,E–F, Figure 6—figure supplement 1A–B). By contrast, ΔflaA L. pneumophila-infected BMMs treated with harringtonine exhibited little ribosome run-off (Figure 6C–D, Figure 6—figure supplement 1A–B), consistent with the expectation that ΔflaA L. pneumophila blocks host translation elongation. The Δ7ΔflaA L. pneumophila strain, lacking all known bacterial effectors that block host protein synthesis, nevertheless, shuts down host translation (Barry et al., 2013), yet we observed clear evidence of run-off of elongating ribosomes from the 5ʹ and 3ʹ end of mRNAs following harringtonine treatment (Figure 6G–H, Figure 6—figure supplement 1A–B). These data suggest that the residual block in host protein synthesis induced by Δ7ΔflaA L. pneumophila is at the level of translation initiation. Similar results can be seen when analyzing longer stretches of coding sequences (Figure 6—figure supplement 1C–F).
Figure 6 with 1 supplement see all

L. pneumophila-induced block of host protein synthesis occurs at the level of translation initiation and elongation.
(A–H) Metagene profiles of B6 BMMs uninfected (A–B) or infected with ΔflaA (C–D), ΔdotAΔflaA (E–F), or Δ7ΔflaA (G–H) L. pneumophila in the presence (solid line) or absence (dashed line) of the drug harringtonine to block translation initiation. Metagene profiles are depicted relative to the translation start (A, C, E, G) and stop site (B, D, F, H). Data are representative of two independent experiments (A–H). Solid line, no drug treatment. Dashed line, harringtonine treatment. Black line, uninfected. Red line, ΔflaA-infected. Green line, ΔdotAΔflaA-infected. Blue line, Δ7ΔflaA-infected.
It is important to note that there is a small proportion of uninfected bystander cells assayed in our experiments. However, it is unlikely that these uninfected cells are responsible for the ribosome run-off seen in Δ7ΔflaA L. pneumophila-infected BMMs because the conditions used in these experiments led to most (~90%) cells being infected with L. pneumophila (Figure 1—figure supplement 1A–B). Furthermore, if our infection conditions resulted in large numbers of uninfected cells, then a similar run-off should have been observed in the ∆flaA-infected sample, which it was not. Thus, these results suggest that the seven effectors are required to block translation elongation, and that the residual translation inhibition induced by Δ7ΔflaA L. pneumophila is at the level of translation initiation (Figure 6).
Cytokine transcripts do not escape the pathogen-induced translation block
Although the above results demonstrate a global block in translation elongation in ∆flaA-infected cells, it remains possible that specific transcripts escape this block. We therefore analyzed our translation run-off datasets to assess translation elongation on a per-mRNA basis. We plotted the number of ribosome footprint reads for each transcript in paired untreated and harringtonine treated samples (Figure 7A–D). In this analysis, we expect that an mRNA with actively elongating ribosomes would show a reduction in the number of 5ʹ reads in the harringtonine treated sample, as ribosomes will run off the transcript, compared to the untreated sample. In order to best measure run-off elongation and avoid the expected but confounding effects of harringtonine-induced accumulation of footprints at start codons (which were clearly observed; Figure 6), we excluded the first 25 codons and analyzed ribosome footprint occupancy over the next 300 codons. Consistent with our previous analysis, we find that uninfected, ΔdotAΔflaA, and Δ7ΔflaA-infected BMMs show a clear global signature of ribosome run-off, again suggesting that the block in host protein synthesis induced by Δ7ΔflaA L. pneumophila infection is occurring at the level of translation initiation (Figure 7A–D). Importantly, in ΔflaA-infected BMMs there is no evidence of ribosome run-off, consistent with ΔflaA L. pneumophila inducing a block in host translation elongation (Figure 7B). Interestingly, in all conditions tested, cytokine-related genes fell well within the average of ribosome retention across all transcripts, and if anything, were found to have reduced ribosome run-off compared to a typical gene (Figure 7A–D). A similar trend was seen when we further examined ribosome run-off for specific immune and housekeeping transcripts by plotting the cumulative read counts over the length of the mRNA (Figure 7—figure supplement 1). These results imply that at this time point, cytokine transcripts are not preferentially translated in response to pathogenic infection, but instead are controlled at the level of mRNA induction (Figure 7A–D).
Figure 7 with 1 supplement see all

Immune-related genes do not have increased translation rates in response to infection with L. pneumophila.
(A–D) Read counts from paired samples treated with harringtonine or left untreated were plotted for uninfected (A), ΔflaA (B), ΔdotAΔflaA (C), or Δ7ΔflaA-infected (D) BMMs showing where cytokine-related transcripts (pink circles; Csf1, Csf2, Cxcl1, Cxcl2, Dusp1, Dusp2, Ifnb1, Il10, Il12b, Il1a, Il1b, Il23a, Il6, Lyz1, and Tnf) and housekeeping transcripts (blue circles; Gapdh, Rpl31, Rps17, and Tuba1a) fall among all transcripts (black circles). Grey line, y=x. Data shown are representative of two independent experiments. See Figure 7—source data 1 for individual housekeeping and cytokine-related transcripts. Supporting Information Captions.
-
Figure 7—source data 1
Source data from ribosome profiling analysis used for Figure 7.
- https://doi.org/10.7554/eLife.22707.017
Discussion
Inducible gene expression is of central importance for the immune response to infection. A recent study showed that in response to innate immune stimulation with purified LPS, dendritic cells almost entirely control the induction of genes at the level of transcription (Jovanovic et al., 2015). However, this conclusion may not apply to cells infected with a virulent pathogen that manipulates gene expression. We thus investigated the relative contributions of mRNA induction and translation during infection with an intracellular bacterial pathogen, L. pneumophila, that blocks host protein synthesis.
Pathogen-induced blockade of host protein synthesis has been shown in a number of infection models to be sensed by the host and induce an inflammatory response (Barry et al., 2013; Fontana et al., 2011; Dunbar et al., 2012; McEwan et al., 2012; Chakrabarti et al., 2012; Fontana et al., 2012). We previously identified IL-1α as a key inflammatory cytokine induced preferentially in response to translation inhibition imposed by L. pneumophila (Barry et al., 2013). However, the mechanism by which cytokine proteins are induced despite a pathogen-induced translation blockade remains unclear. We previously provided evidence for a model in which translation inhibition results in a failure to synthesize negative feedback inhibitors of transcription, for example, IκB or A20 (Fontana et al., 2011). We proposed this results in a massive and sustained production of cytokine transcripts, termed mRNA superinduction, that is sufficient to overcome the partial (~95%) block in translation and allow for production of cytokine proteins (Barry et al., 2013; Fontana et al., 2011). Another report provided data suggesting that IL-1 production is mediated by MyD88-enhanced protein synthesis, although alternative explanations were also entertained (Asrat et al., 2014). A third study proposed that virulent L. pneumophila regulates cap-dependent translation initiation, via manipulation of the mTOR signaling pathway, to regulate the protein levels of highly abundant transcripts in infected macrophages (Ivanov and Roy, 2013). In our present study, we found that the induction of ribosome footprints by L. pneumophila could be explained by an underlying induction of mRNAs. We did not find evidence for selective ribosome loading of abundant cytokine mRNAs. In addition, ribosome run-off experiments confirmed that cytokine mRNAs are not selectively translated during infection (Figure 7). Furthermore, we find that the role of MyD88 signaling in gene expression appears to be primarily at the level of mRNA induction and not translational regulation (Figure 3). Thus, we conclude that preferential translation does not account for the majority of specific gene induction following infection by L. pneumophila.
It remains possible that selective translation initiation mechanisms, for example, via uORFs, might also contribute modestly to the inducible immune response to L. pneumophila, but these subtle effects were not evident in our global analysis. In any case, it is difficult to explain how regulation of translation initiation could overcome a downstream pathogen-induced block in translation elongation such as is observed during L. pneumophila infection. It is also possible that post-translational mechanisms, which are not addressable with the ribosomal profiling techniques used here, may regulate protein production by infected cells. Indeed, inflammasome-dependent caspase-1 processing is known to be an important post-translational regulatory mechanism controlling IL-1β production by infected cells (von Moltke et al., 2013). Lastly, our data do not specifically address the mechanism of mRNA induction, although our prior work suggested mRNA induction involves new transcription rather than increased mRNA stability (Fontana et al., 2011).
Although wild-type L. pneumophila blocks translation elongation via translocated effectors, we found that Δ7ΔflaA L. pneumophila lacking the effectors nevertheless blocks protein synthesis at the level of translation initiation (Figure 6). Thus, in contrast to a previous study that used virus-based translation reporter experiments in L. pneumophila-infected RAW macrophages (Ivanov and Roy, 2013), we were clearly able to dissociate the L. pneumophila-induced block in host protein synthesis into two components: (1) an elongation block that required the seven translocated effectors, and (2) an initiation block that did not require the seven effectors. In addition, our analysis represents an advance over prior studies because we were able to analyze the translation of all endogenous transcripts simultaneously as opposed to measuring translation only of a single exogenous reporter mRNA. Intriguingly, in contrast to the effector-dependent block in translation that we show occurs at the level of elongation, the majority of host-mediated regulation of translation occurs at the level of translation initiation (Hershey et al., 2012). Thus, while it is possible that a novel bacterial effector that directly targets translation initiation could explain the residual inhibition of translation by the Δ7ΔflaA L. pneumophila mutant, we favor the hypothesis that the residual block in host protein synthesis may be a result of the host stress response induced by pathogenic infection, consistent with numerous prior studies (Mohr and Sonenberg, 2012; Lemaitre and Girardin, 2013; Chakrabarti et al., 2012; Ivanov and Roy, 2013; Janssens et al., 2014; Tattoli et al., 2012). Indeed, T4SS-competent L. pneumophila has been suggested to induce membrane damage that inhibits the mTOR pathway and blocks translation initiation (Ivanov and Roy, 2013). Further studies will be required to identify the bacterial and host pathways required for the residual translation inhibition caused by the Δ7ΔflaA L. pneumophila mutant.
The results presented here further support a role for translation inhibition as a signal that the innate immune system uses to recognize and preferentially respond to pathogens (Fontana et al., 2011). Our work provides nucleotide-level analysis of the global block in host protein synthesis induced by L. pneumophila, and demonstrates that L. pneumophila infection results in inhibition of host protein synthesis both at the level of translation initiation and elongation. Importantly, our results also provide insights into the molecular mechanisms by which host cells are able to mount a protective immune response despite a pathogen-induced block in protein synthesis. Using ribosome run-off assays in combination with ribosome profiling and RNAseq, we find that mRNA superinduction, rather than selective mRNA translation, is the strategy by which host cells produce inflammatory cytokines in the face of pathogen-mediated translation inhibition. To be effective, the strategy of mRNA superinduction requires that the magnitude of mRNA superinduction exceeds the magnitude of the block in protein synthesis. Indeed, our data suggest this is the case, as we observe >1000 fold induction of certain mRNAs, whereas we previously estimated the block in protein synthesis to be ~95% (20-fold) (Fontana et al., 2011). One possible advantage of mRNA superinduction as a strategy for overcoming a pathogen-mediated block of protein synthesis is that it does not require specific translation factors, as was previously proposed might mediate selective mRNA translation in L. pneumophila-infected cells (Asrat et al., 2014). In addition, in mammalian cells, selective translation is usually regulated at the level of translation initiation, a strategy that would be easily defeated by pathogens such as L. pneumophila that block the downstream process of translation elongation. Importantly, since numerous viral and bacterial pathogens and toxins interfere with host protein synthesis, we propose that our results may provide general insight into the inducible innate immune response to infection.
Materials and methods
Ethics statement
Request a detailed protocolThese studies were carried out in strict accordance with the recommendations in the Guide for the Care and Use of Laboratory Animals of the National Institutes of Health under animal protocol AUP-2014-09-6665. The protocol was approved by the Animal Care and Use Committee at the University of California, Berkeley.
Access to high-throughput sequencing data
Request a detailed protocolThe data discussed in this publication have been deposited in NCBI's Gene Expression Omnibus (Edgar et al., 2002) and are accessible through GEO Series accession number GSE89184 (https://www.ncbi.nlm.nih.gov/geo/query/acc.cgi?acc=GSE89184).
Cell culture
Request a detailed protocolMacrophages were derived from the bone marrow of C57BL/6J (Jackson Laboratory, Bar Harbor, ME, USA) and Myd88 –/– (Hou et al., 2008) mice on the B6 background. Macrophages were derived by 8 days of culture in RPMI supplemented with 10% serum, 100 μM streptomycin, 100 U/mL penicillin, 2 mM L-glutamine and 10% supernatant from 3T3-macrophage-colony-stimulating factor cells, with feeding on day 5. Cells were re-plated in antibiotic free media 24 hr prior to infection with L. pneumophila.
Bacterial strains and infections
Request a detailed protocolAll L. pneumophila strains were derived from LP02, a streptomycin-resistant thymidine auxotroph derived from L. pneumophila LP01. The ΔdotAΔflaA, ΔflaA, and Δ7ΔflaA strains were generated on the LP02 background and have been described previously (Barry et al., 2013; Fontana et al., 2011; Ren et al., 2006; Fontana et al., 2012). Twofold dilutions of L. pneumophila strains used for infections were grown overnight in liquid buffered-yeast-extract culture and, at the time of infection, cultures with an optical density (600 nm) greater than 4.0 were selected. BMMs were plated at a density of 1.56 × 10⁵ cells per cm2 (1.5.x106 cells per well of a six-well plate) and infected at an MOI of 3 by centrifugation for 10 min at 400 xg. After 1 hr of infection media was changed. All in vitro L. pneumophila infections were performed in the absence of thymidine to prevent bacterial replication which would otherwise differ between the ∆dotA and Dot+ strains. The lack of thymidine can result in a loss of bacterial viability, although we attempted to mitigate this concern by examining host gene expression at a relatively early 6 hr time point.
Library preparation and sequencing for ribosome profiling
Request a detailed protocolRibosome profiling experiments were undertaken as previously described (Ingolia et al., 2012). BMMs were plated in tissue culture treated six-well plates (1.5 × 10⁶ BMMs/well) or 75 cm2 flasks (1.2 × 10⁷ BMMs per flask). At 6 hr post-infection BMMs were lysed by flash freezing and thawed in the presence of lysis buffer (Ingolia et al., 2012). When used, harringtonine (LKT Laboratories, Saint Paul, MN) was added at a final concentration of 2 μg/mL for 120 s at the end of the 6 hr infection. 100 μg/mL of cycloheximide (Sigma-Aldrich, St. Louis, MO) was added to freeze ribosomes after the 120 s harringtonine treatment. Following cycloheximide treatment cells were immediately lysed. Clarified lysates were split and some was used to generate ribosome footprints while some was used to isolate total RNA for RNA sequencing (described below). All RNA and DNA gel extractions were performed overnight as previously described (Ingolia et al., 2012). The Ribo-Zero Gold rRNA Removal Kit (Illumina, San Diego, CA) was used to remove rRNA from ribosome profiling samples before the dephosphorylation and linker ligation steps (Ingolia et al., 2012). Final ribosome profiling libraries were sequenced on a HiSeq2000 System (Illumina) with single read 50 (SR50) read lengths by the Vincent J. Coates Genomics Sequencing Laboratory at UC, Berkeley.
Generation of RNAseq libraries
Request a detailed protocolClarified lysate was isolated as described above and 300 μL of lysate was mixed with 900 μL of Trizol LS (Thermo Fisher Scientific, Waltham, MA) and RNA was isolated following the manufacturer’s guidelines. RNA integrity was measured utilizing the RNA Pico method on the Agilent 2100 Bioanalyzer at the University of California, Berkeley Functional Genomics Laboratory. High-quality RNA with a RNA integrity number (RIN) >8 (Agilent Technologies, Santa Clara, CA) was submitted to the QB3-Berkeley Functional Genomics Laboratory and single read 100 base pair read length (SR100) sequencing libraries were generated. Libraries were sequenced on a HiSeq2000 System (Illumina) by the Vincent J. Coates Genomics Sequencing Laboratory at UC, Berkeley.
Alignment of RNAseq reads and differential expression analysis
Request a detailed protocolRNA sequencing reads were preprocessed using tools from the FASTX-Toolkit (http://hannonlab.cshl.edu/fastx_toolkit/) by trimming the linker sequence from the 3ʹ end of each read and in some cases removing 10–15 nucleotides from the 5ʹ of each read to mitigate a region of overrepresented nucleotides. Alignment and differential expression analysis of RNAseq reads were undertaken as previously described (Trapnell et al., 2012). Briefly, high quality and preprocessed sequencing reads were aligned using the TopHat splicing-aware short-read alignment program to a library of transcripts derived from the UCSC Known Gene data set, and those with no acceptable transcript alignment were then aligned against the Mus musculus genome (mm10).
Alignment of ribosome footprint sequences
Request a detailed protocolSequences were processed as described previously (Ingolia et al., 2012). Sequences were preprocessed by trimming the linker sequence from the 3ʹ end of each sequencing read and removing the first nucleotide from the 5ʹ end of each read. Reads were then aligned to a rRNA reference using the Bowtie short-read alignment program. All sequences aligning the rRNA reference were discarded. All non-rRNA sequencing reads were aligned using the TopHat splicing-aware short-read alignment program to a library of transcripts derived from the UCSC Known Genes data set, and those with no acceptable transcript alignment were then aligned against the mouse genome (mm10). Perfect-match alignments were extracted, and these files were used for analyses. For most analyses, footprint alignments were assigned to specific A site nucleotides by using the position and total length of each alignment, calibrated from footprints at the beginning and the end of CDSes, as previously described (Ingolia et al., 2012, 2011).
Counting of ribosome profiling and RNAseq reads
Request a detailed protocolCounting of reads was performed as previously described (Ingolia et al., 2009, 2011). Reads were mapped to coding sequences and counted, excluding reads that mapped to the first 15 codons or the last 5 codons of a CDS due to accumulation of ribosomes (Ingolia et al., 2011). In order to analyze gene-specific ribosome run-off (Figure 7A–D), we counted reads mapping from codon 26 to codon 325, that is, a 300-codon window excluding the first 25 codons of a gene.
Ribosome occupancy analysis
Request a detailed protocolFor analyses of ribosome occupancy (Figure 4), ribosome footprint and mRNAseq read counts were calculated similarly. Read counts were normalized to CDS length, as longer transcripts inherently have increased read counts, generating a read density (read density = read count ÷ transcript length) for each gene. Read densities were further normalized to the sum of read counts of 12 mitochondrial protein-coding genes (see below) as an estimate of total cells in each condition, allowing for comparison among different conditions and libraries (Iwasaki et al., 2016). For each transcript in the dataset, the average raw ribosome footprint read counts for each infection conditions was calculated and transcripts with an average ribosome footprint or RNAseq read count less than 100 were discarded. Additionally, any transcript that had ribosome footprint reads but 0 RNAseq reads was also discarded. Discarded transcripts were defined as undetectable.
MyD88-dependent gene induction analysis
Request a detailed protocolTwo experiments were used to generate two independent libraries consisting of B6 and Myd88–/– BMMs infected with ΔflaA or ΔdotAΔflaA L. pneumophila. For each gene in the dataset, the average raw ribosome footprint read counts for ΔflaA L. pneumophila-infected B6 BMMs were sorted and genes with an average ribosome footprint or RNAseq read count less than 100 were discarded. Additionally, any gene that had ribosome footprint reads but no detectable RNAseq reads in B6 or Myd88–/– BMMs were discarded. The sorted read counts were then normalized to ribosome footprint or RNAseq read counts of 12 mitochondrial protein-coding genes (see below) as an estimate of total cells in each condition. MyD88-dependent gene induction was calculated using the equation: MyD88-dependent gene induction = average(normalized B6 read count) ÷ average(normalized Myd88–/– read count).
Type IV secretion system-dependent gene induction analysis
Request a detailed protocolFour independent experiments were used to generate four collections of sequencing libraries consisting of B6 BMMs infected with ΔflaA or ΔdotAΔflaA L. pneumophila. For each gene in the dataset, the average raw ribosome footprint read counts for ΔflaA L. pneumophila infected B6 BMMs were sorted and genes with an average ribosome footprint or RNAseq read count less than 100 were discarded. Additionally, any gene that had ribosome footprint reads but no detectable RNAseq reads in ΔflaA or ΔdotAΔflaA L. pneumophila-infected B6 BMMs were discarded. The sorted read counts were then normalized to ribosome footprint or RNAseq read counts of 12 mitochondrial protein-coding genes (see below) as an estimate of total cells in each condition. T4SS-dependent gene induction was calculated using the equation: T4SS-dependent gene induction = average(normalized ΔflaA-infected read count) ÷ average(normalized ΔdotAΔflaA-infected read count).
Analysis of cytokine and protein levels in infected BMM lysates and supernatants
Request a detailed protocolB6 BMMs were left uninfected or infected with ΔflaA or ΔdotAΔflaA L. pneumophila at an MOI of 3 in duplicate, as described above. Media was changed 1 hr following infection and at 6 hr post-infection supernatants were collected and BMMs washed with PBS. BMMs were lysed in 400 μL mammalian cell PE lysis buffer (G-Biosciences, St. Louis, MO) following the manufacturers instructions. Lysates and supernatants were cleared by spinning at 20,000 x g for 30 min at 4°C. Cytokine and protein levels were measured using a commercially available cytokine bead array (Rodent MAP 4.0-Mouse Sample Testing, Ampersand Biosciences, Saranac Lake, NY) and total protein levels were measured by bicinchoninic acid (BCA) assay (Ampersand Biosciences, Saranac Lake, NY). Protein and cytokine levels in each infection condition were normalized to total protein levels. Infectivity was confirmed by staining for L. pneumophila (see below). mRNA levels of cytokines were determined by counting (counting method described above) previously acquired RNAseq data of B6 BMMs infected with ΔflaA or ΔdotAΔflaA L. pneumophila at an MOI of 3 for 6 hr. RNAseq read counts were normalized to transcript length and the sum of RNAseq read counts of 12 mitochondrial protein-coding genes (see below) as an estimate of total cells in each condition (RNAseq normalization described above). T4SS-dependent induction was measured by taking the ratio of protein or mRNA levels in the ΔflaA infected condition to protein or mRNA levels in the ΔdotAΔflaA infected condition: T4SS-dependent induction = average(normalized ΔflaA mRNA or protein) divided by average(normalized ΔdotAΔflaA mRNA or protein). T4SS-induction was averaged from two independent experiments and plotted.
Seven-effector-dependent gene induction analysis
Request a detailed protocolTwo independent experiments were used to generate two collections of sequencing libraries consisting of B6 BMMs infected with ΔflaA or Δ7ΔflaA L. pneumophila. For each gene in the dataset the average raw ribosome footprint read counts for ΔflaA L. pneumophila-infected B6 BMMs were sorted and genes with an average ribosome footprint or RNAseq read count less than 100 were discarded. Additionally, any gene that had ribosome footprint reads but no detectable RNAseq reads in ΔflaA or Δ7ΔflaA L. pneumophila-infected B6 BMMs were discarded. The sorted read counts were then normalized to ribosome footprint or RNAseq read counts of 12 mitochondrial protein-coding genes (see below) as an estimate of total cells in each condition. Seven effector-dependent gene induction was calculated using the equation: seven effector-dependent gene induction = average(normalized ΔflaA-infected read count) ÷ average(normalized Δ7ΔflaA-infected read count).
Metagene profile analysis of ribosome profiling libraries
Request a detailed protocolMetagene profiles were generated as previously described (Ingolia et al., 2009, 2011). These metagene profiles indicate the total number of ribosome footprints whose A site falls at the indicated position relative to the start or stop codon of the coding sequence, and reflect a simple, unweighted sum of the footprint profiles around the beginning and the end of each protein-coding gene. The A site position was estimated for each footprint using a length-dependent offset from the 5ʹ end of the fragment. The distance from this A site position to the start or stop codon of the coding sequence was then computed, taking into account the fact that translation initiation occurs with the second codon in the A site.
Analysis of ribosome run-off of individual genes
Request a detailed protocolCumulative ribosome occupancy profiles (Figure 7—figure supplement 1) were computed by taking the cumulative sum of ribosome footprints mapping to each position in the gene, scaled by the normalization factor derived from mitochondrial translation in that sample.
Mitochondrial genes used for library normalization
Request a detailed protocol| Gene ID | Name | Size (bp) |
|---|---|---|
| ENSMUST00000082392 | mt-Nd1 | 299 |
| ENSMUST00000082396 | mt-Nd2 | 326 |
| ENSMUST00000082402 | mt-Co1 | 495 |
| ENSMUST00000082405 | mt-Co2 | 208 |
| ENSMUST00000082407 | mt-Atp8 | 48 |
| ENSMUST00000082408 | mt-Atp6 | 207 |
| ENSMUST00000082409 | mt-Co3 | 241 |
| ENSMUST00000082411 | mt-Nd3 | 96 |
| ENSMUST00000082414 | mt-Nd4 | 439 |
| ENSMUST00000082418 | mt-Nd5 | 588 |
| ENSMUST00000082419 | mt-Nd6 | 153 |
| ENSMUST00000082421 | mt-Cytb | 361 |
Quantification of infectivity
Request a detailed protocolWT BMMs were plated on a sterile #1.5 coverslip by placing the coverslip in a tissue-culture-treated six-well plates and adding 1.5 × 10⁶ BMMs/well in antibiotic-free media 24 hr prior to infection. Twofold dilutions of L. pneumophila strains used for infections were grown overnight in liquid buffered-yeast-extract culture and, at the time of infection, cultures with an optical density (600 nm) greater than 4.0 were selected. BMMs were infected at an MOI of 3 by centrifugation for 10 min at 400 xg. Media was changed after one hour of infection. At 6 hr post-infection coverslips were collected, washed in PBS, and placed in fixative solution (100 uM sodium periodate, 75 uM Lysine, 2.9 uM NaH2PO4, 3.2% sucrose, and 4% paraformaldehyde) for 1 hr at 37°C. Following fixation BMMs were blocked in 2% goat serum in PBS. To stain extracellular L. pneumophila, blocked BMMs were incubated with a rabbit anti-Legionella antibody (RRID: AB_231859; Fitzgerald Industries International, North Acton, MA, USA 20-LR45), washed in PBS, and stained with a goat-anti-rabbit IgG secondary antibody conjugated to Cascade Blue (RRID: AB_2536453; ThermoFisher Scientific, Waltham, MA, USA, C-2764). In some experiments, mammalian cell membrane was labeled with FITC-labeled wheat germ agglutinin (Sigma-Aldrich, St. Louis, MO, L4895) prior to permeabilization. BMMs were permeabilized by dipping coverslips into ice-cold methanol. Permeabilized BMMs were blocked with 2% goat serum and stained with a rabbit anti-Legionella antibody (Fitzgerald Industries International, North Acton, MA, 20-LR45) followed by incubation with a goat-anti-rabbit IgG secondary antibody conjugated to TexasRed (RRID: AB_2556776; ThermoFisher Scientific, Waltham, MA, T-2767) to mark all (intracellular and extracellular) L. pneumophila. Coverslips were mounted in vectashield antifade mounting medium (Vector Laboratories, Burlingame, CA, H-1000) and visualized on a Nikon TE2000 inverted microscope. All antibody stains were incubated for 30 min at 37°C and all blocking steps were incubated for 60 min at 37°C.
Importantly, the staining method described above results in intracellular bacteria staining positive for TexasRed while extracellular bacteria are double positive for Cascade Blue and TexasRed. Quantification of infectivity was undertaken by two methods using the differential staining of intracellular and extracellular L pneumophila. In experiments where differential contrast (DIC) microscopy, Cascade Blue, and TexasRed were visualized counting of intracellular bacteria in BMMs was done by hand using the image analysis software ImageJ (RRID:SCR_003070; Rasband, W.S., ImageJ, U. S. National Institutes of Health, Bethesda, Maryland, USA, http://imagej.nih.gov/ij/, 1997–2016) and the Cell Counter plugin (https://imagej.nih.gov/ij/plugins/cell-counter.html). Uninfected BMMs were classified as BMMs that were not associated with L. pneumophila or only associated with extracellular (Cascade Blue + TexasRed double positive) bacteria. Infected BMMs were classified as macrophages containing at least one intracellular L. pneumophila (Texas Red only), independent of the number of extracellular bacteria associated with the BMM. In experiments where the cell membrane of BMMs was labeled with FITC-conjugated wheat germ agglutinin along with DIC, Cascade Blue, and TexasRed, analysis of infectivity was undertaken using the imaging software Imaris (RRID:SCR_007370; Bitplane, Zurich, Switzerland). Using Imaris, surfaces of BMMs were drawn on the FITC-conjugated wheat germ agglutinin channel to mark individual BMMs. All extracellular bacteria were removed from analysis by generating a new channel that subtracted the Cascade Blue channel from the TexasRed channel, for example Intracellular Channel = TexasRed Channel – (Scaling Value x Cascade Blue Channel). The scaling value was calculated by measuring the average pixel intensities in each channel for double positive bacteria. As an example, if the TexasRed channel had an average pixel intensity of 350 and the Cascade Blue channel was 3500 then the equation would be: Intracellular Channel = TexasRed Channel – (0.1 x Cascade Blue Channel). The outcome of this calculation is the generation of a channel that removes the TexasRed signal of extracellular bacteria, thus allowing for analysis of bacteria that are only intracellular. Lastly, using the Sortomato utility (http://open.bitplane.com/tabid/235/Default.aspx?id=90) in Imaris, new cell surfaces were drawn for cells that contained a signal in the new Intracellular channel (with double positive bacteria removed), marking cells infected with an intracellular bacterium. Surfaces were also drawn for cells that did not have a signal in the Intracellular channel, marking uninfected BMMs or BMMs only associated with extracellular L. pneumophila. Results were checked by eye to confirm that all surfaces accurately marked uninfected and infected BMMs; the surfaces generated by Sortomato were used to quantify infectivity.
Data availability
-
Global analysis of gene expression reveals mRNA superinduction is required for the inducible immune response to a bacterial pathogenPublicly available at the NCBI Gene Expression Omnibus (accession no: GSE89184).
References
-
IL-1α signaling initiates the inflammatory response to virulent Legionella pneumophila in vivoThe Journal of Immunology 190:6329–6339.https://doi.org/10.4049/jimmunol.1300100
-
Lgt: a family of cytotoxic glucosyltransferases produced by Legionella pneumophilaJournal of Bacteriology 190:3026–3035.https://doi.org/10.1128/JB.01798-07
-
The emergence of proteome-wide technologies: systematic analysis of proteins comes of ageNature Reviews Molecular Cell Biology 15:453–464.https://doi.org/10.1038/nrm3821
-
Global signatures of protein and mRNA expression levelsMolecular BioSystems 5:1512–1526.https://doi.org/10.1039/b908315d
-
Gene expression Omnibus: ncbi gene expression and hybridization array data RepositoryNucleic Acids Research 30:207–210.https://doi.org/10.1093/nar/30.1.207
-
Two signal models in innate immunityImmunological Reviews 243:26–39.https://doi.org/10.1111/j.1600-065X.2011.01037.x
-
Inhibition of translation in eukaryotic systems by harringtonineEuropean Journal of Biochemistry 72:323–330.https://doi.org/10.1111/j.1432-1033.1977.tb11256.x
-
Principles of translational control: an overviewCold Spring Harbor Perspectives in Biology 4:a011528.https://doi.org/10.1101/cshperspect.a011528
-
Harringtonine, an inhibitor of initiation of protein biosynthesisMolecular Pharmacology 11:511–519.
-
Mechanism of action of Pseudomonas aeruginosa exotoxin aiadenosine diphosphate-ribosylation of mammalian elongation factor 2 in vitro and in vivoInfection and Immunity 15:138–144.
-
Emerging functions of the unfolded protein response in immunityNature Immunology 15:910–919.https://doi.org/10.1038/ni.2991
-
Translation inhibition and metabolic stress pathways in the host response to bacterial pathogensNature Reviews Microbiology 11:365–369.https://doi.org/10.1038/nrmicro3029
-
Host translation at the nexus of infection and immunityCell Host & Microbe 12:470–483.https://doi.org/10.1016/j.chom.2012.09.006
-
Cytosolic recognition of flagellin by mouse macrophages restricts Legionella pneumophila infectionThe Journal of Experimental Medicine 203:1093–1104.https://doi.org/10.1084/jem.20051659
-
New insights into translational regulation in the endoplasmic reticulum unfolded protein responseCold Spring Harbor Perspectives in Biology 4:a012278.https://doi.org/10.1101/cshperspect.a012278
-
Inhibition of protein synthesis in intact HeLa cellsAntimicrobial Agents and Chemotherapy 8:479–487.https://doi.org/10.1128/AAC.8.4.479
-
Insights into the regulation of protein abundance from proteomic and transcriptomic analysesNature Reviews Genetics 13:227–232.https://doi.org/10.1038/nrg3185
-
Recognition of bacteria by inflammasomesAnnual Review of Immunology 31:73–106.https://doi.org/10.1146/annurev-immunol-032712-095944
Article and author information
Author details
Nicholas T Ingolia

Funding
Cancer Research Institute
- Kevin C Barry
- Russell E Vance
Fibrolamellar Cancer Foundation
- Kevin C Barry
National Institutes of Health (CA195768)
- Nicholas T Ingolia
Howard Hughes Medical Institute
- Russell E Vance
Burroughs Wellcome Fund
- Russell E Vance
National Institutes of Health (AI075039)
- Russell E Vance
National Institutes of Health (AI063302)
- Russell E Vance
The funders had no role in study design, data collection and interpretation, or the decision to submit the work for publication.
Acknowledgements
We thank members of the Vance and Barton Laboratories for discussion and Justin De Leon, Edward Roberts, and Matthew Krummel for technical assistance. We also thank Justin De Leon, Mary Fontana, Shelley Starck, and Jeannette Tenthorey for critical reading and discussion of the manuscript. This work was supported by the HHMI and National Institutes of Health Grants AI063302, AI075039, AI080749, and CA195768. The Vincent J. Coates Genomics Sequencing Laboratory at UC Berkeley is supported by NIH S10 instrumentation Grants S10RR029667 and S10RR027303. REV is an HHMI Investigator, and research in the Vance Laboratory was supported by investigatorships from the Burroughs Wellcome Fund and the Cancer Research Institute.
Ethics
Animal experimentation: These studies were carried out in strict accordance with the recommendations in the Guide for the Care and Use of Laboratory Animals of the National Institutes of Health. The protocol was approved by the Animal Care and Use Committee at the University of California, Berkeley.
Version history
- Received: October 26, 2016
- Accepted: March 27, 2017
- Accepted Manuscript published: April 6, 2017 (version 1)
- Version of Record published: April 27, 2017 (version 2)
Copyright
© 2017, Barry et al.
This article is distributed under the terms of the Creative Commons Attribution License, which permits unrestricted use and redistribution provided that the original author and source are credited.
Metrics
-
- 3,106
- views
-
- 699
- downloads
-
- 39
- citations
Views, downloads and citations are aggregated across all versions of this paper published by eLife.
Download links
A two-part list of links to download the article, or parts of the article, in various formats.
Downloads (link to download the article as PDF)
Open citations (links to open the citations from this article in various online reference manager services)
Cite this article (links to download the citations from this article in formats compatible with various reference manager tools)
Global analysis of gene expression reveals mRNA superinduction is required for the inducible immune response to a bacterial pathogen
eLife 6:e22707.
https://doi.org/10.7554/eLife.22707
Further reading
-
- Evolutionary Biology
- Immunology and Inflammation
CD4+ T cell activation is driven by five-module receptor complexes. The T cell receptor (TCR) is the receptor module that binds composite surfaces of peptide antigens embedded within MHCII molecules (pMHCII). It associates with three signaling modules (CD3γε, CD3δε, and CD3ζζ) to form TCR-CD3 complexes. CD4 is the coreceptor module. It reciprocally associates with TCR-CD3-pMHCII assemblies on the outside of a CD4+ T cells and with the Src kinase, LCK, on the inside. Previously, we reported that the CD4 transmembrane GGXXG and cytoplasmic juxtamembrane (C/F)CV+C motifs found in eutherian (placental mammal) CD4 have constituent residues that evolved under purifying selection (Lee et al., 2022). Expressing mutants of these motifs together in T cell hybridomas increased CD4-LCK association but reduced CD3ζ, ZAP70, and PLCγ1 phosphorylation levels, as well as IL-2 production, in response to agonist pMHCII. Because these mutants preferentially localized CD4-LCK pairs to non-raft membrane fractions, one explanation for our results was that they impaired proximal signaling by sequestering LCK away from TCR-CD3. An alternative hypothesis is that the mutations directly impacted signaling because the motifs normally play an LCK-independent role in signaling. The goal of this study was to discriminate between these possibilities. Using T cell hybridomas, our results indicate that: intracellular CD4-LCK interactions are not necessary for pMHCII-specific signal initiation; the GGXXG and (C/F)CV+C motifs are key determinants of CD4-mediated pMHCII-specific signal amplification; the GGXXG and (C/F)CV+C motifs exert their functions independently of direct CD4-LCK association. These data provide a mechanistic explanation for why residues within these motifs are under purifying selection in jawed vertebrates. The results are also important to consider for biomimetic engineering of synthetic receptors.
-
- Genetics and Genomics
- Immunology and Inflammation
Transposable elements (TEs) are repetitive sequences representing ~45% of the human and mouse genomes and are highly expressed by medullary thymic epithelial cells (mTECs). In this study, we investigated the role of TEs on T-cell development in the thymus. We performed multiomic analyses of TEs in human and mouse thymic cells to elucidate their role in T-cell development. We report that TE expression in the human thymus is high and shows extensive age- and cell lineage-related variations. TE expression correlates with multiple transcription factors in all cell types of the human thymus. Two cell types express particularly broad TE repertoires: mTECs and plasmacytoid dendritic cells (pDCs). In mTECs, transcriptomic data suggest that TEs interact with transcription factors essential for mTEC development and function (e.g., PAX1 and REL), and immunopeptidomic data showed that TEs generate MHC-I-associated peptides implicated in thymocyte education. Notably, AIRE, FEZF2, and CHD4 regulate small yet non-redundant sets of TEs in murine mTECs. Human thymic pDCs homogenously express large numbers of TEs that likely form dsRNA, which can activate innate immune receptors, potentially explaining why thymic pDCs constitutively secrete IFN ɑ/β. This study highlights the diversity of interactions between TEs and the adaptive immune system. TEs are genetic parasites, and the two thymic cell types most affected by TEs (mTEcs and pDCs) are essential to establishing central T-cell tolerance. Therefore, we propose that orchestrating TE expression in thymic cells is critical to prevent autoimmunity in vertebrates.


