Novel mechanism of metabolic co-regulation coordinates the biosynthesis of secondary metabolites in Pseudomonas protegens
- Oregon State University, United States
- Agricultural Research Service, Horticultural Crops Research Laboratory, United States
Figures
Figure 1

Biosynthetic gene clusters for 2,4-diacetylphloroglucinol (DAPG) (A), and pyoluteorin (C), the proposed biosynthetic pathways of DAPG (B) and pyoluteorin (D) of P. protegens Pf-5, and the GFP reporter constructs (E, F, G) used in this work.
Arrows represent gene location and orientation in the biosynthetic gene clusters, and are colored according to their functions. The open arrow in (E) indicates that pltR is not included in the pL-gfp construct.
Figure 2

Effect of phloroglucinol (PG) and pyoluteorin on expression of pltL::gfp in P. protegens Pf-5.
Pf-5 wild-type and derivatives containing pL-gfp were treated with PG (10 nM) and/or pyoluteorin (100 nM), as indicated. Expression levels of pltL::gfp were measured and recorded as relative GFP (fluorescence of GFP divided by OD600). Letters above columns indicate treatments significantly different from one another, as determined by ANOVA analysis (p<0.05). Data are means of at least three biological replicates from a representative experiment repeated three times with similar results, and error bars represent the standard deviation of the mean.
-
Figure 2—source data 1
Expression of pltL::gfp by Pf-5 wild-type (WT) and its derivatives in response to PG and/or pyoluteorin.
- https://doi.org/10.7554/eLife.22835.005
Figure 3 with 2 supplements
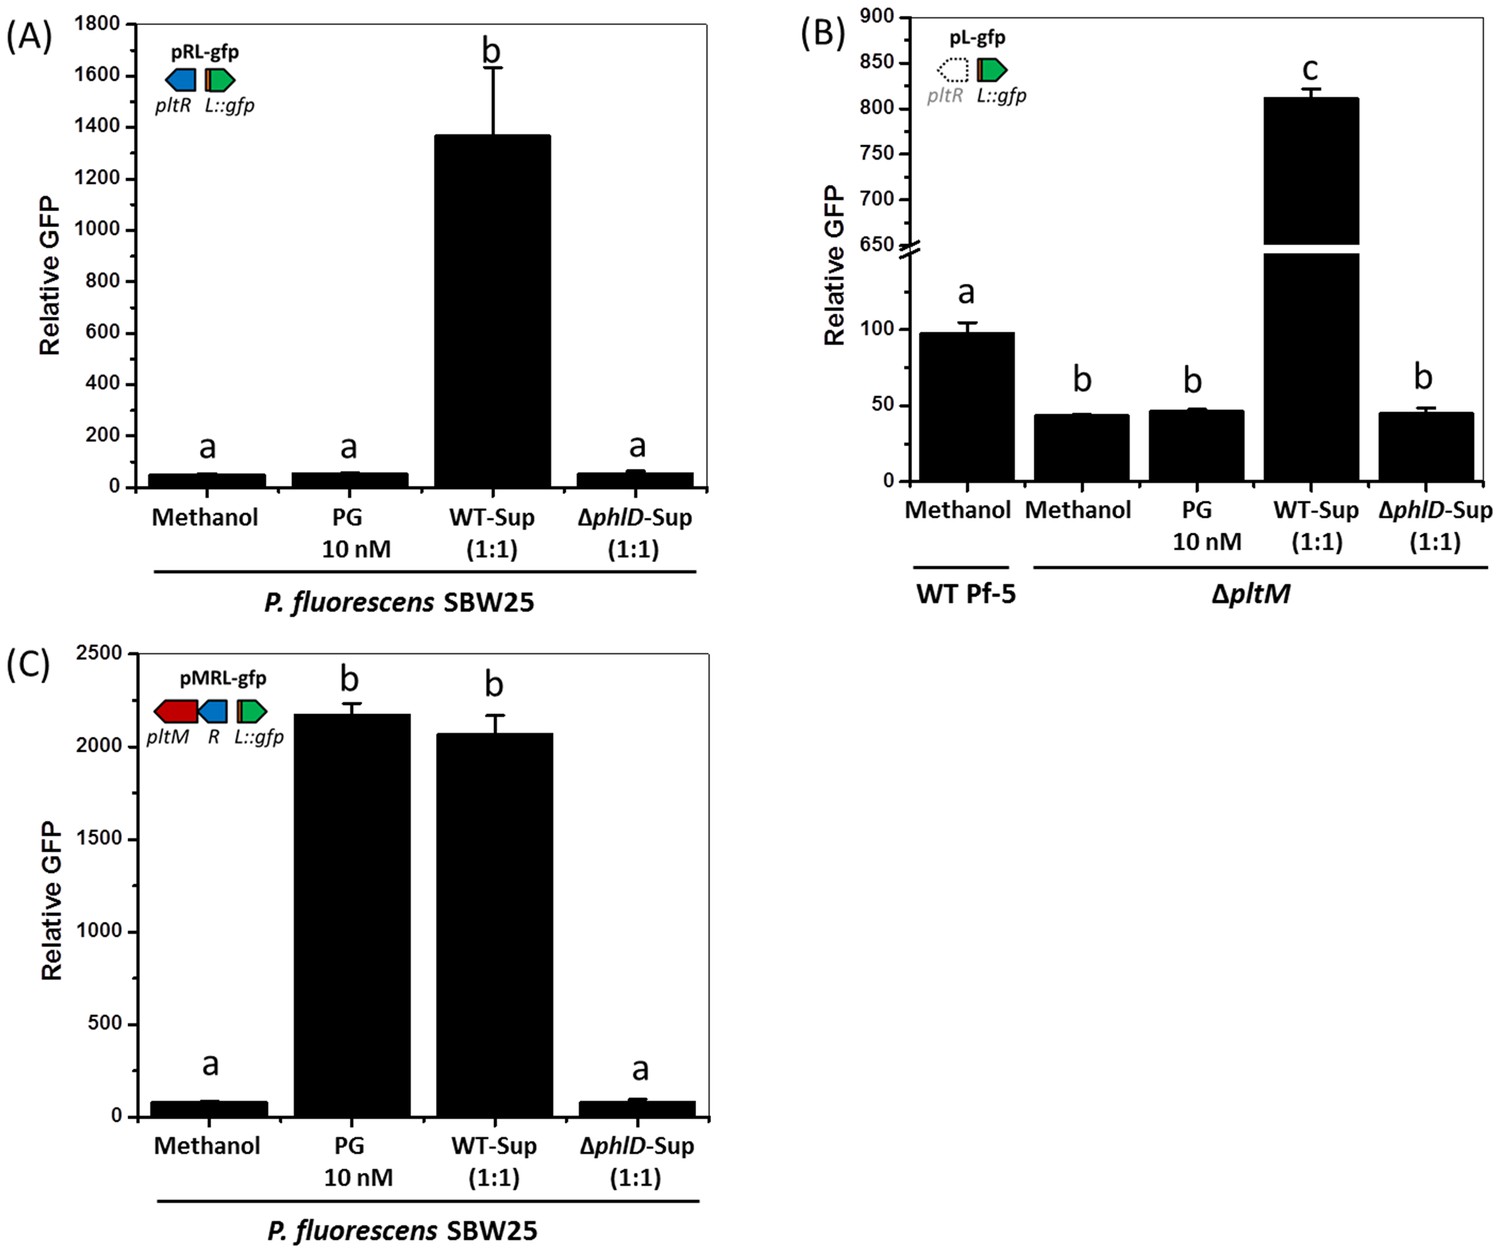
Effect of phloroglucinol (PG) and Pf-5 culture supernatants on expression of pltL::gfp in P. fluorescens SBW25 (A, C), and P. protegens Pf-5 (B).
(A) Expression of pltL::gfp in SBW25 containing pRL-gfp. (B) Expression of pltL::gfp in wild-type (WT) Pf-5 and the ΔphlM mutant containing pL-gfp. (C) Expression of pltL::gfp in SBW25 containing pMRL-gfp. In each experiment, the concentration of PG is 10 nM, and the same volume of methanol was added to the bacterial cultures as a control. The supernatants of bacterial cultures were mixed with the fresh bacterial cultures at a 1:1 vol ratio to test their effects on pltL::gfp expression; WT-Sup, the culture supernatants of wild-type Pf-5; ΔphlD-Sup, the culture supernatants of a ΔphlD mutant. The expression levels of pltL::gfp were measured and recorded as relative GFP (fluorescence of GFP divided by OD600). Letters above columns indicate treatments significantly different from one another, as determined by ANOVA analysis (p<0.05). Data are means of at least three biological replicates from a representative experiment repeated three times with similar results, and error bars represent the standard deviation of the mean.
-
Figure 3—source data 1
Expression of pltL::gfp by SBW25 and Pf-5 in response to phloroglucinol (PG) and Pf-5 culture supernatants.
(A) Expression of pltL::gfp by SBW25 containing pRL-gfp. (B) Expression of pltL::gfp by Pf-5 wild-type (WT) and the ΔpltM mutant that contains pL-gfp. (C) Expression of pltL::gfp by SBW25 containing pMRL-gfp.
- https://doi.org/10.7554/eLife.22835.007
Figure 3—figure supplement 1
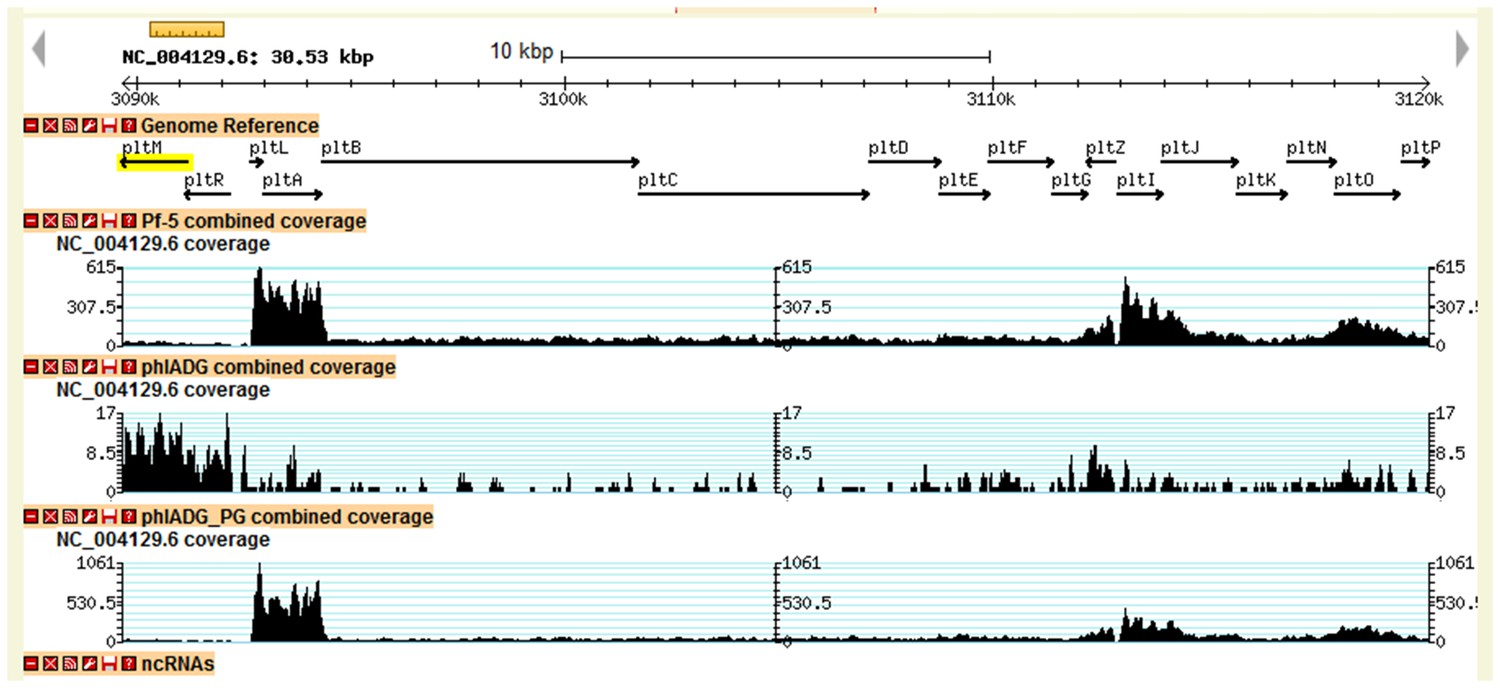
Transcriptional profiles of pltM, pltR and the other genes in the pyoluteorin gene cluster of Pf-5.
Data were generated from our previous transcriptomic study (Clifford et al., 2016). The height of the black peaks indicates the expression levels of genes in the pyoluteorin gene cluster of the wild-type Pf-5 (Pf-5 combined coverage), the ΔphlAΔphlDΔphlG three-fold mutant (phlADG combined coverage), and the ΔphlAΔphlDΔphlG three-fold mutant grown in a medium containing 100 nM PG (phlADG_PG combined coverage). For the three strains/treatments, expression levels of genes are indicated in different scales to show the general expression profile of the whole gene cluster.
Figure 3—figure supplement 2
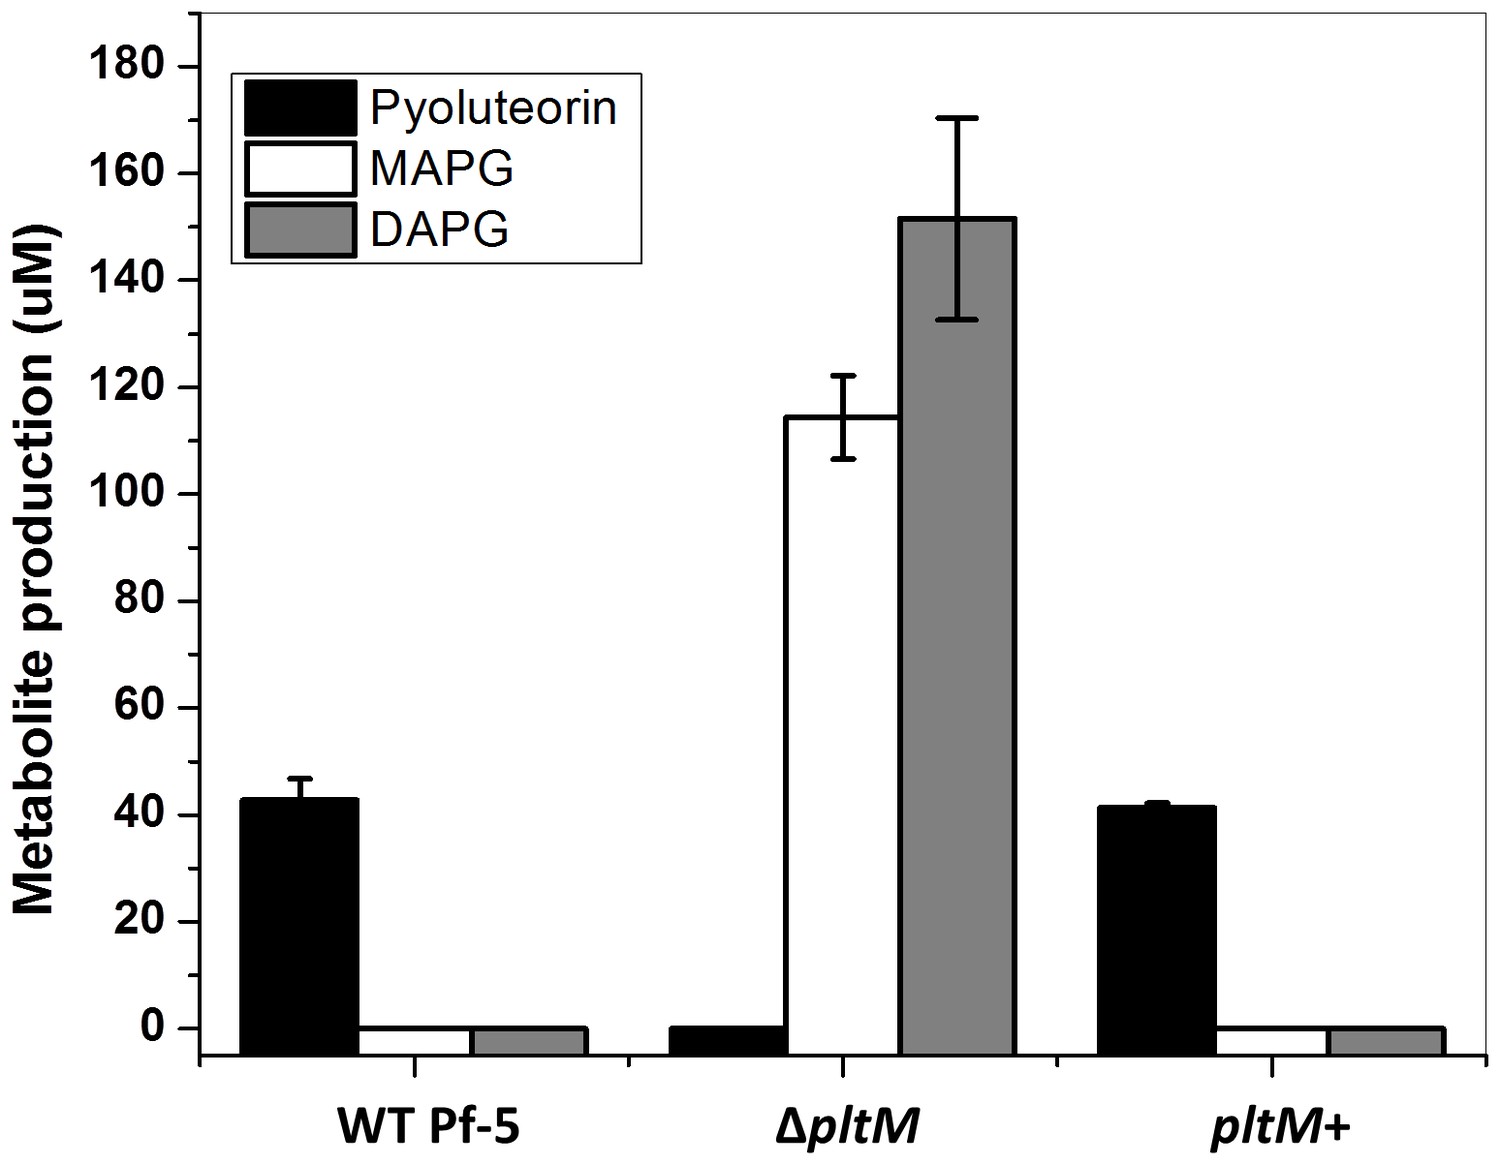
Production of pyoluteorin, DAPG and MAPG by P. protegens Pf-5 wild-type (WT), a ΔpltM mutant, and a pltM+ complemented strain.
Secondary metabolites were extracted from bacterial cultures incubated for 24 hr in NBGly. Data are means of three biological replicates from a representative experiment repeated twice with similar results, and error bars represent the standard deviation of the mean.
-
Figure 3—figure supplement 2—source data 1
Concentration of pyoluteorin, MAPG and DAPG (µM) in cultures of Pf-5 wild-type (WT) and its derivatives.
- https://doi.org/10.7554/eLife.22835.010
Figure 4 with 1 supplement
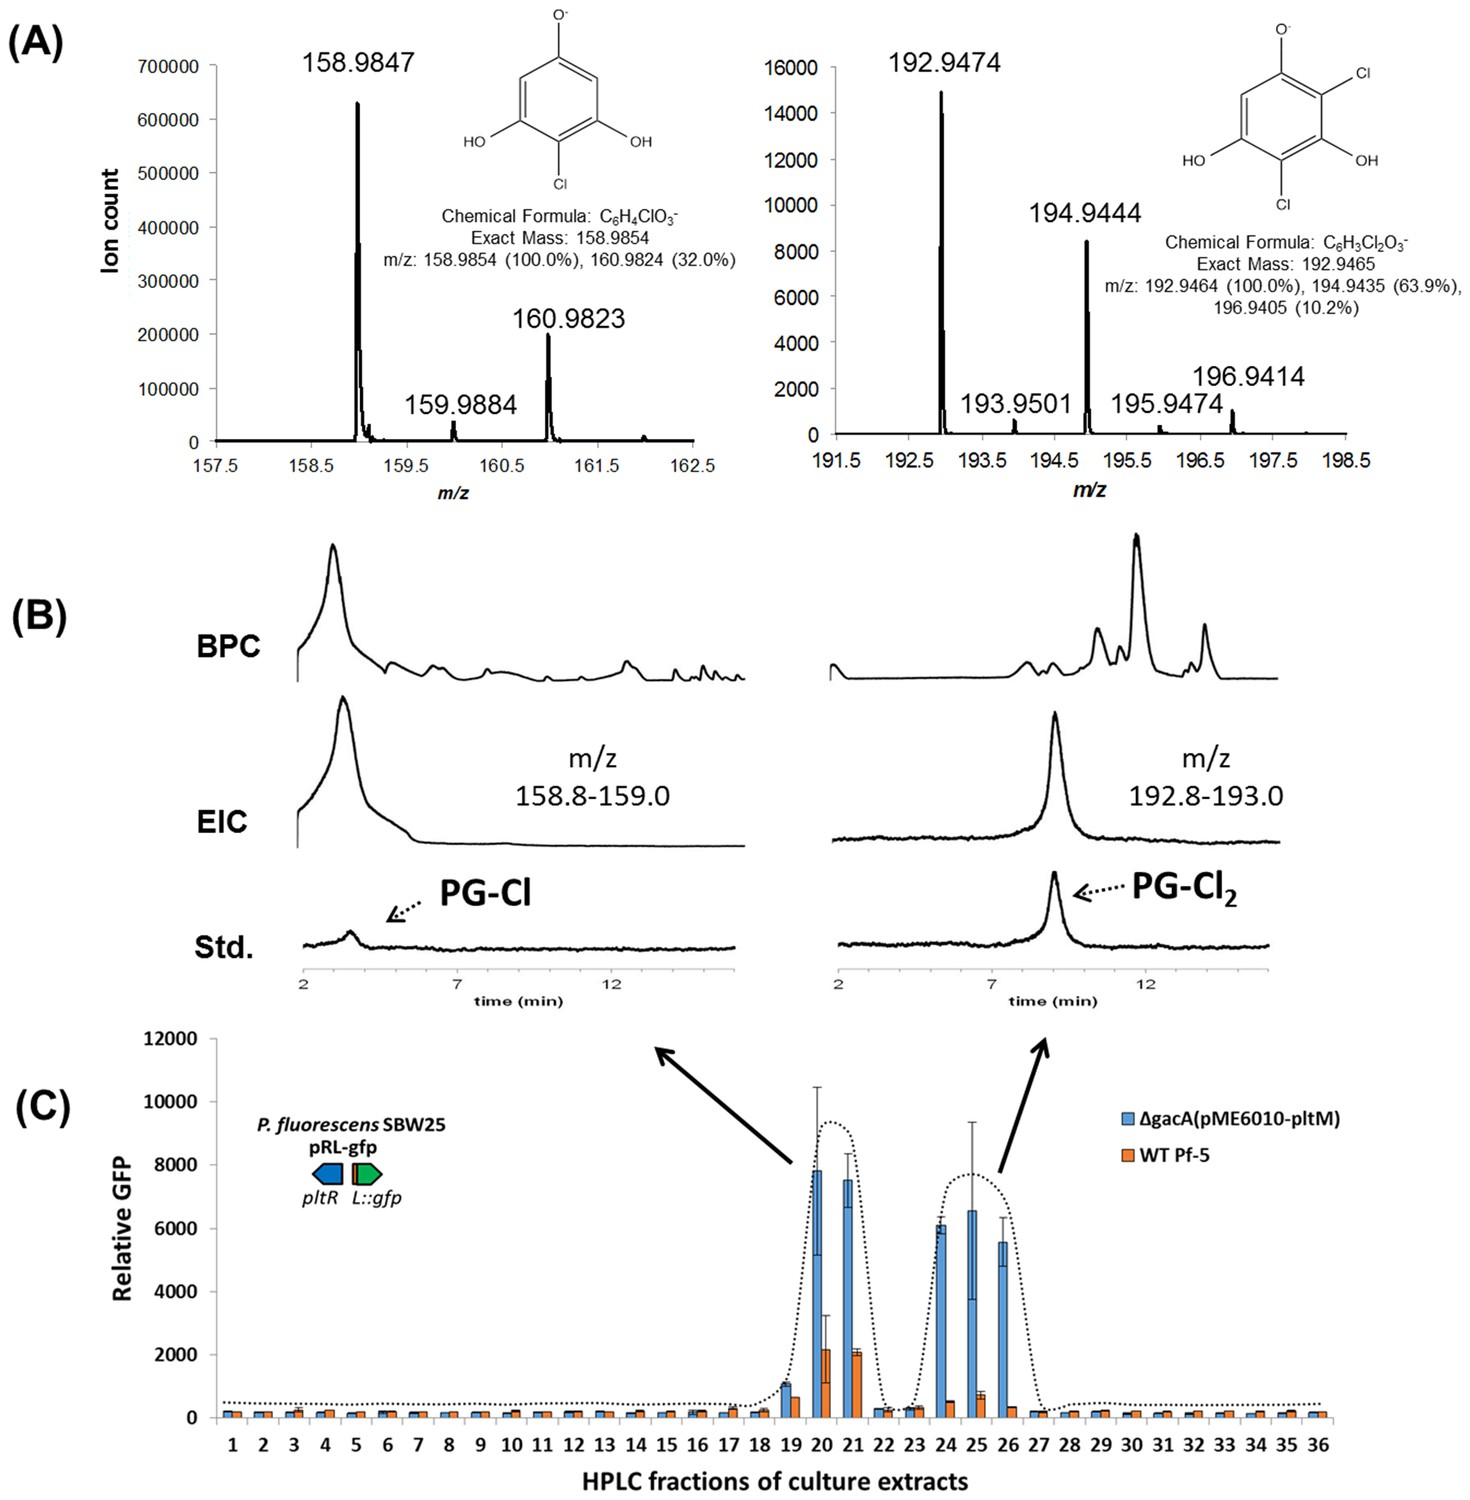
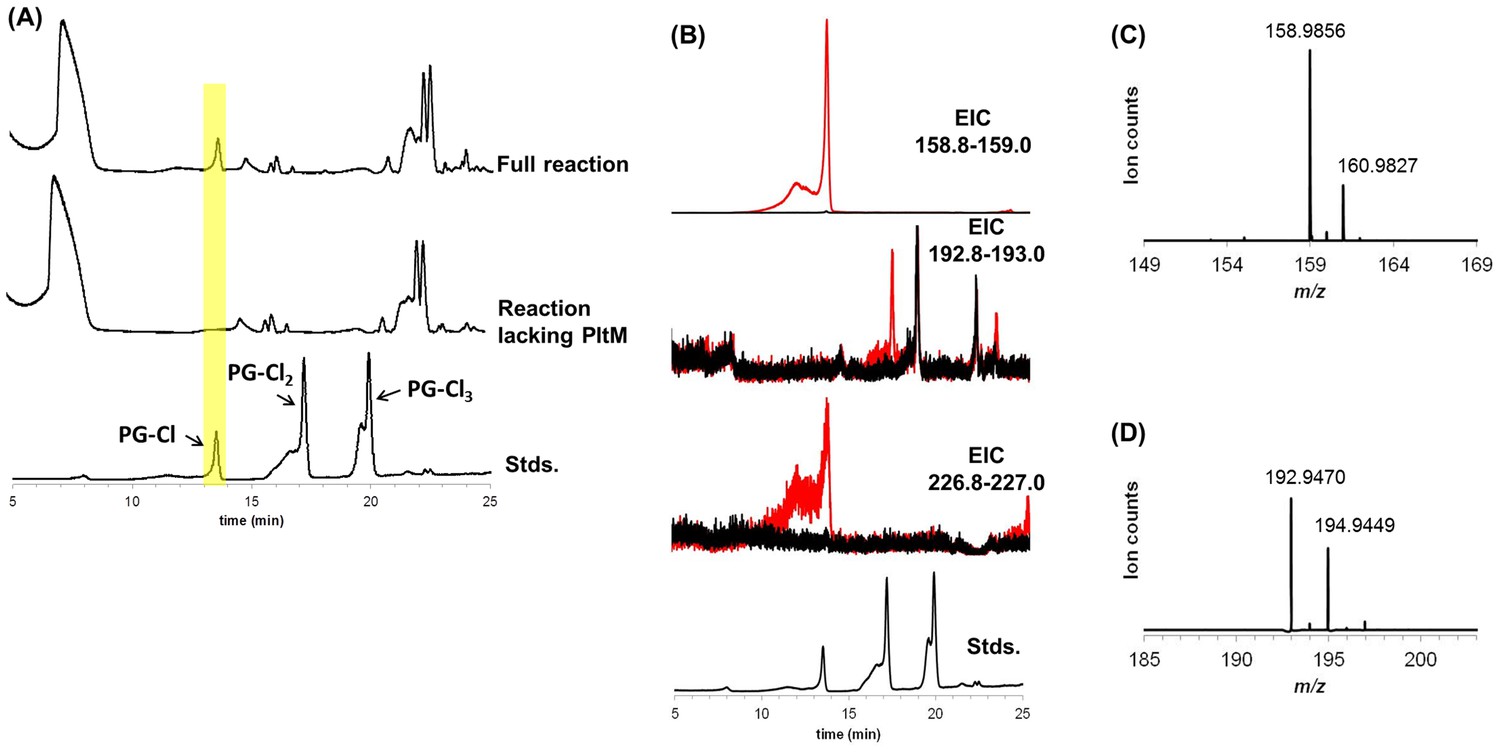
Identification of the signaling metabolites from Pf-5 that induce expression of pltL::gfp in P. fluorescens SBW25 (pRL-gfp).
Metabolites were extracted from wild-type (WT) Pf-5, and a phloroglucinol (PG)-fed ΔgacA mutant of Pf-5 carrying a plasmid that constitutively expresses pltM (pME6010-pltM). The extracts were fractioned into 48 fractions using semi-preparatory HPLC (no observable signal activity was detected from the last 12 fractions, data not shown). The signal activity of the fractions from both strains was tested using strain P. fluorescens SBW25 containing pRL-gfp (C). Data are means of three biological replicates, and error bars represent the standard deviation of the mean. (A) Mass spectra of compound eluting at 3.3 min in Fraction 21 (left) and 9 min in Fraction 26 (right) from the ΔgacA (pME6010-pltM) culture extracts. (B) Comparisons between the signal compounds identified in Pf-5 cultures to synthesized PG-Cl and PG-Cl2, which elute at 3.3 and 9 min, respectively, as indicated by the dashed arrows. BPC, base peak chromatogram; EIC, extracted ion chromatogram; Std, synthesized standards. The m/z used for EIC analysis of PG-Cl and PG-Cl2 are also shown.
Figure 4—figure supplement 1
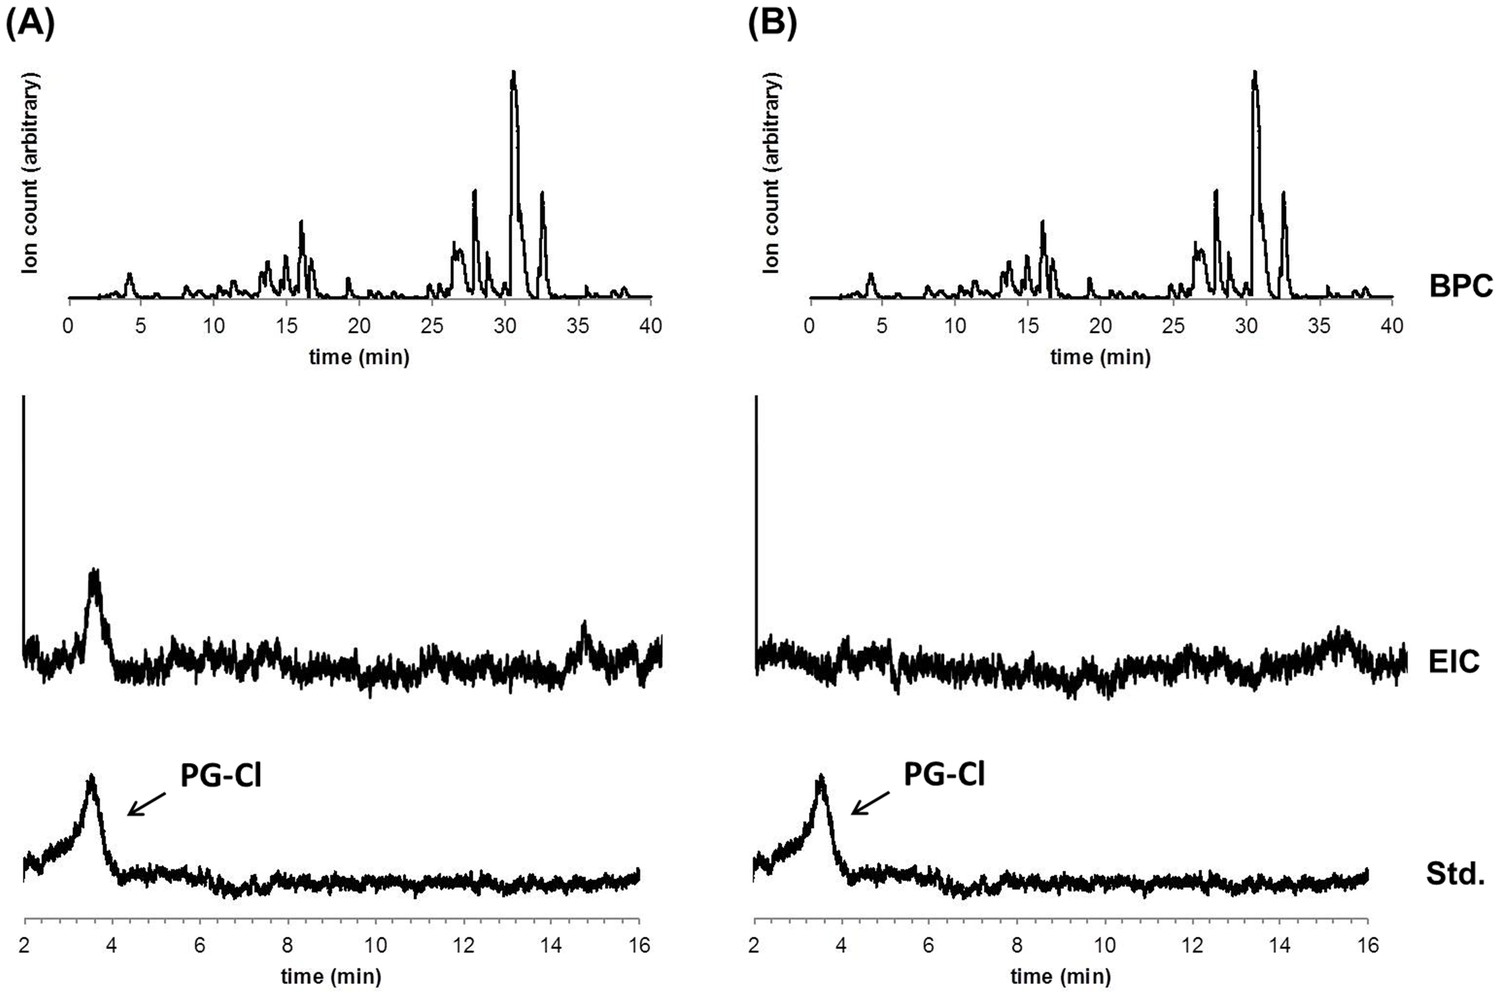
LCMS analysis of crude extracts of bacterial metabolites from cultures of wild-type Pf-5 (A) and ΔpltM mutant (B).
BPC, base peak chromatogram (top); EIC, extracted ion chromatogram (158.8–159.0 m/z, middle); Std, PG-Cl standard (bottom).
Figure 5 with 2 supplements
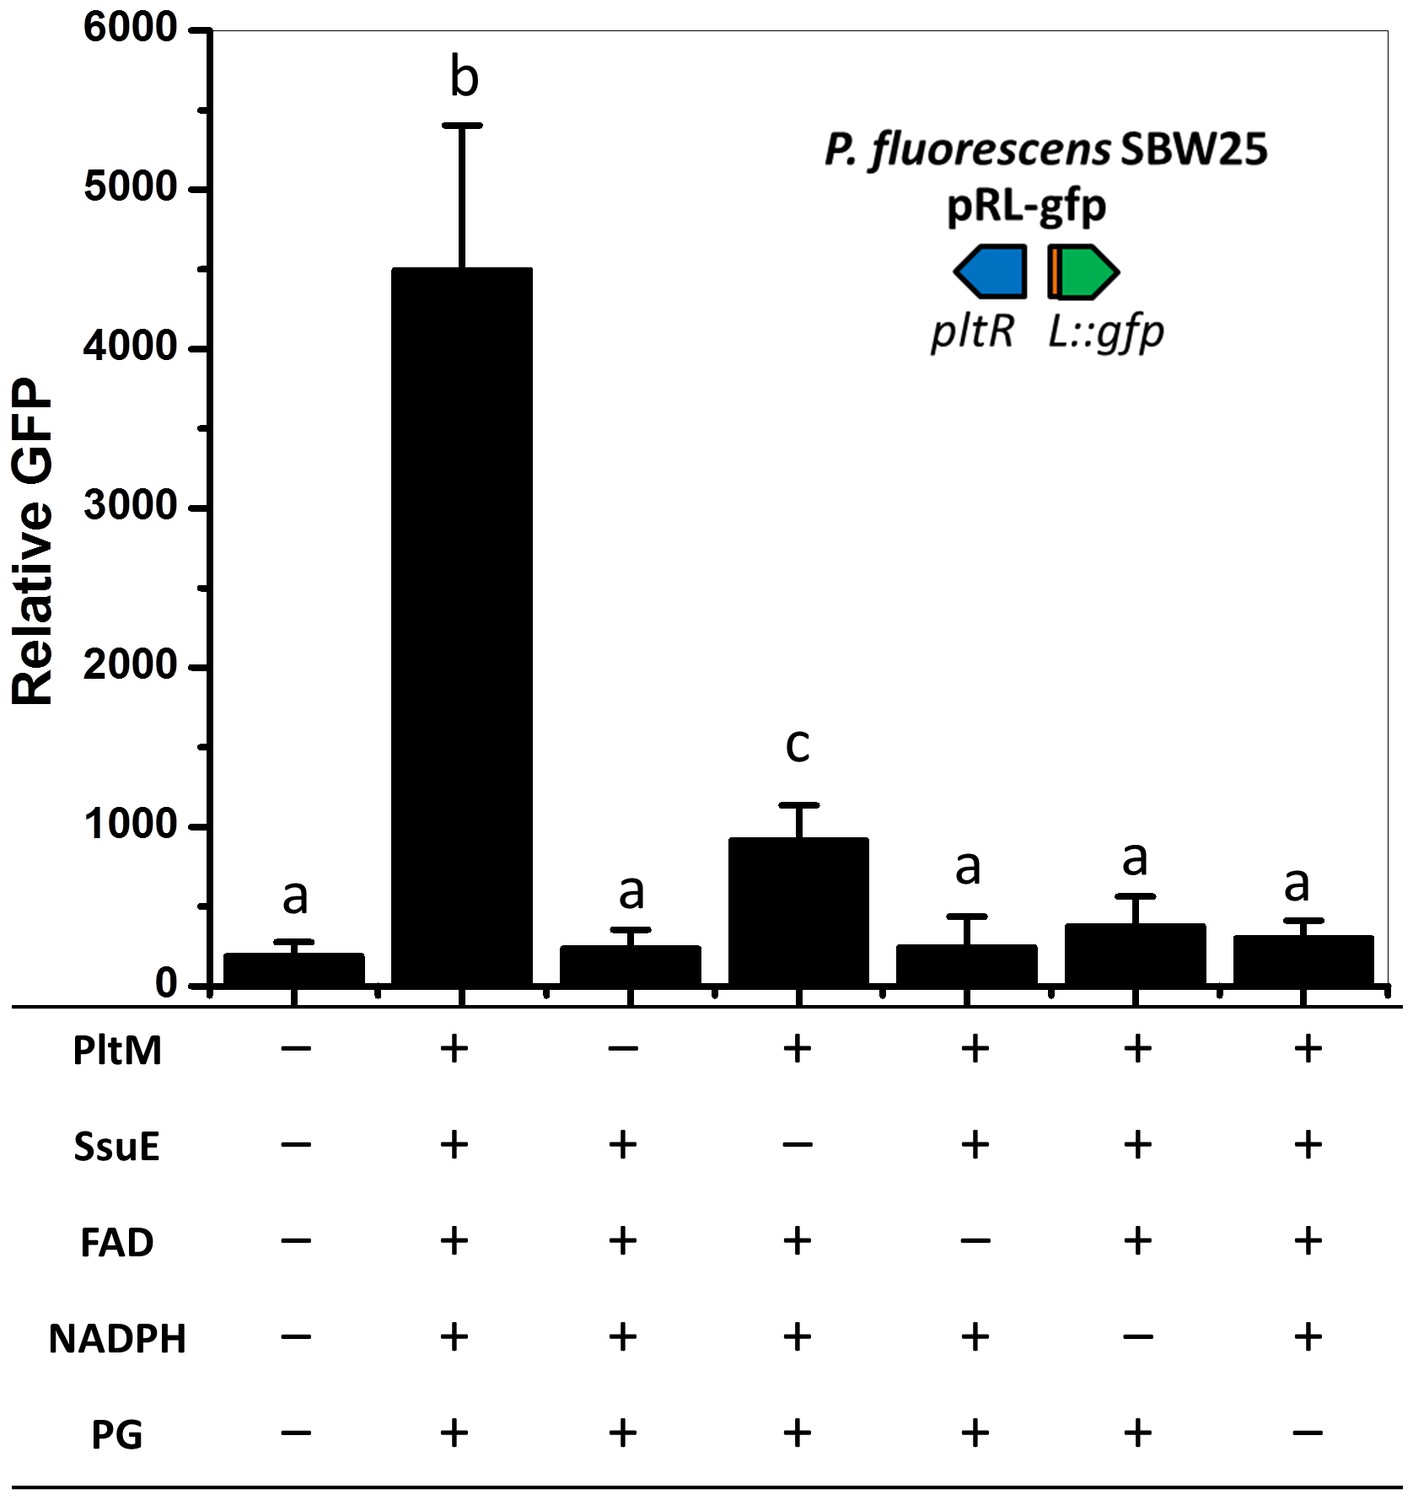
Effect of extracts from in vitro catalyzed reactions on expression of pltL::gfp in P. fluorescens SBW25.
PltM was purified from E. coli and incubated with a mixture of flavin reductase SsuE, substrate PG, and co-factors FAD and NADPH. The effect of extracted compounds from the reactions was tested using P. fluorescens SBW25 containing pRL-gfp. "+” and "–” indicate the presence or absence of the component in the reactions, respectively. The expression level of pltL::gfp was measured and recorded as relative GFP (fluorescence of GFP divided by OD600). Letters above columns indicate treatments significantly different from one another, as determined by ANOVA analysis (p<0.05). Data are means of at least three biological replicates from a representative experiment repeated twice with similar results, and error bars represent the standard deviation of the mean.
-
Figure 5—source data 1
Expression of pltL::gfp by SBW25 containing pRL-gfp in response to extracts from in vitro reactions.
EM-1# to −6# refers to extracts from each in vitro reaction with the components shown.
- https://doi.org/10.7554/eLife.22835.014
Figure 5—figure supplement 1
LCMS analysis of PltM reaction mixtures.
(A) Base peak chromatogram (BPC) for the complete reaction mixture containing PG, FAD, NADH, SsuE, and PltM in Tris buffer (top); BPC for the reaction mixture lacking PltM (containing PG, FADH, NADH, and SsuE in Tris buffer) (middle); BPC for chlorinated phloroglucinol standards, PG-Cl, PG-Cl2, and PG-Cl3 elute at 12.5, 17.2, and 18.8 min, respectively. A peak observed only in the complete reaction mixture is highlighted in yellow and has an identical retention time to that of the PG-Cl standard. (B) Extracted ion chromatograms (EIC) for the complete reaction mixture (red) or the reaction mixture lacking PltM (black). Top panel, EIC 158.8–159.0 (PG-Cl); second panel, EIC 192.8–193.0 (PG-Cl2); third panel, EIC 226.8–227.0 (PG-Cl3). Bottom panel, BPC for PG-Cl, PG-Cl2, and PG-Cl3 standards, which elute at 12.5, 17.2, and 18.8 min, respectively. (C) Mass spectrum generated by the peak observed in the EIC 158.8–159.0 of the complete PltM reaction eluting at 12.5 min (PG-Cl calc. [M-H]− 158.9854, 1.3 ppm error). (D) Mass spectrum generated by the peak observed in the EIC 192.8–193.0 of the complete PltM reaction eluting at 17.2 min (PG-Cl2 calc. [M-H]− 192.9465, 2.6 ppm error).
Figure 5—figure supplement 2
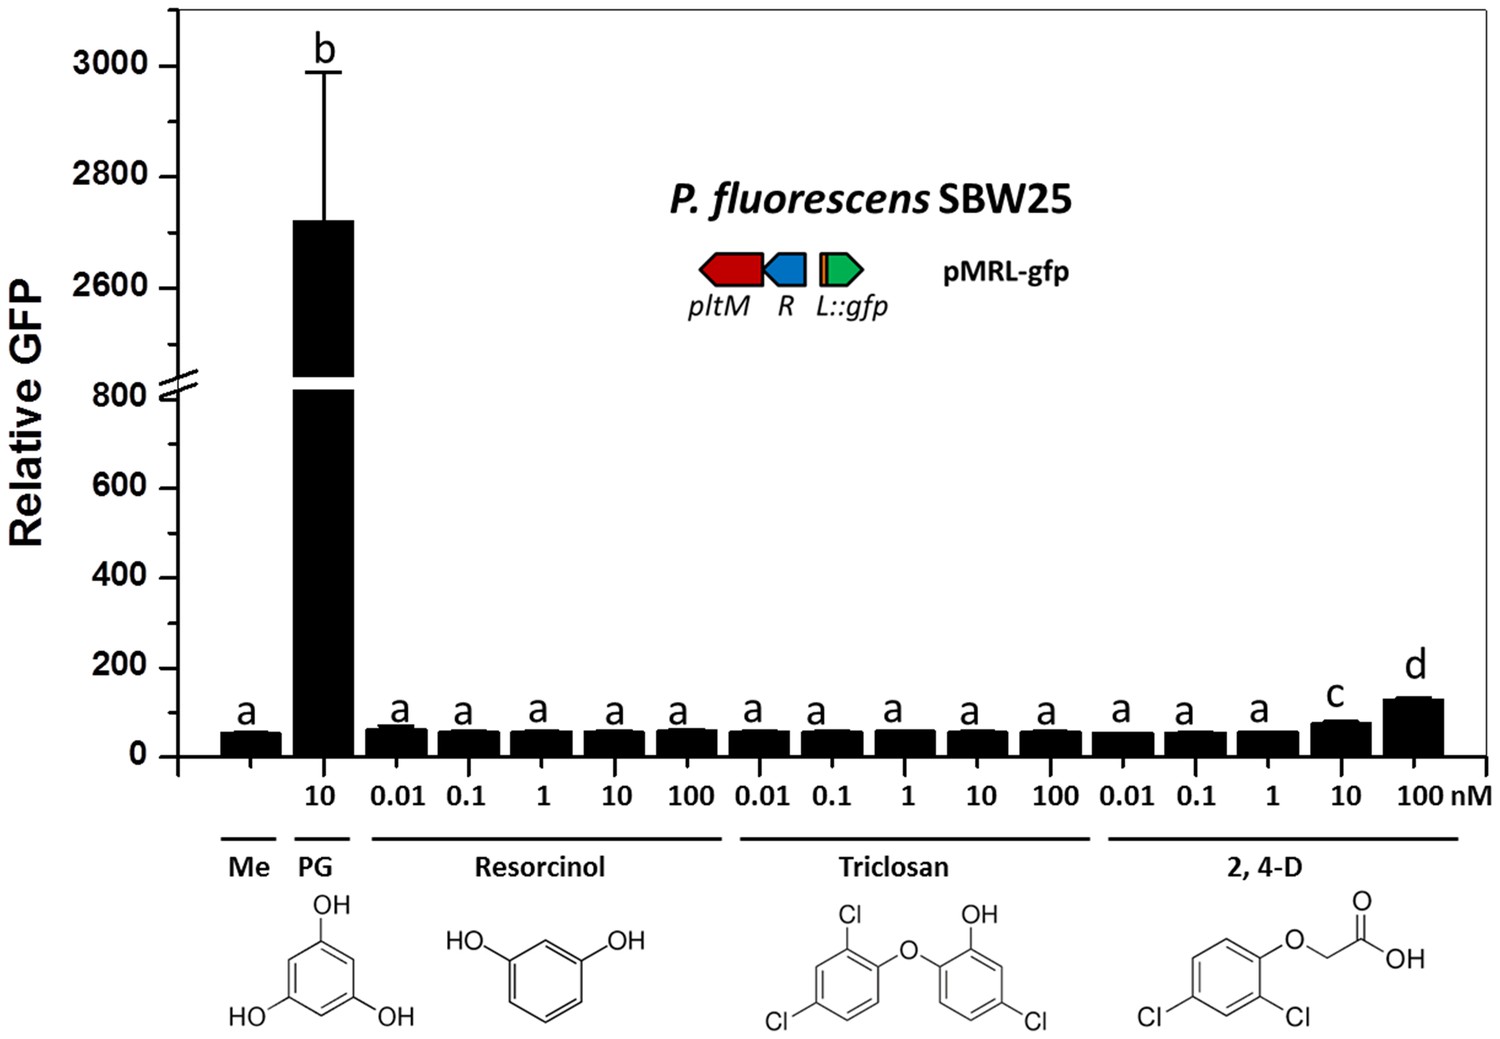
Effect of different compounds that have structures similar to phloroglucinol (PG) on the expression of pltL::gfp in P. fluorescens SBW25.
Resorcinol, triclosan, and 2,4-D (2,4-Dichlorophenoxyacetic acid), which have structures similar to PG, were used to test the substrate specificity of PltM. Different concentrations of these compounds were added to cultures of SBW25 containing reporter plasmid pMRL-gfp in NBGly broth. PG was used as a positive control in this experiment. The same volume of methanol was added to the cultures (Me) as a negative control. The expression level of pltL::gfp was monitored and recorded as relative GFP, which was calculated by GFP divided by OD600. Differing letters above the columns indicate treatments significantly different from one another, as determined by ANOVA analysis (p<0.05). Compared with PG, no comparable signaling effects of the tested compounds were observed. Data are means of three biological replicates from a representative experiment repeated two times with similar results, and error bars represent the standard deviation of the mean.
-
Figure 5—figure supplement 2—source data 1
Expression of pltL::gfp by SBW25 containing pMRL-gfp in response to PG and compounds with similar structures to PG.
- https://doi.org/10.7554/eLife.22835.017
Figure 6 with 3 supplements
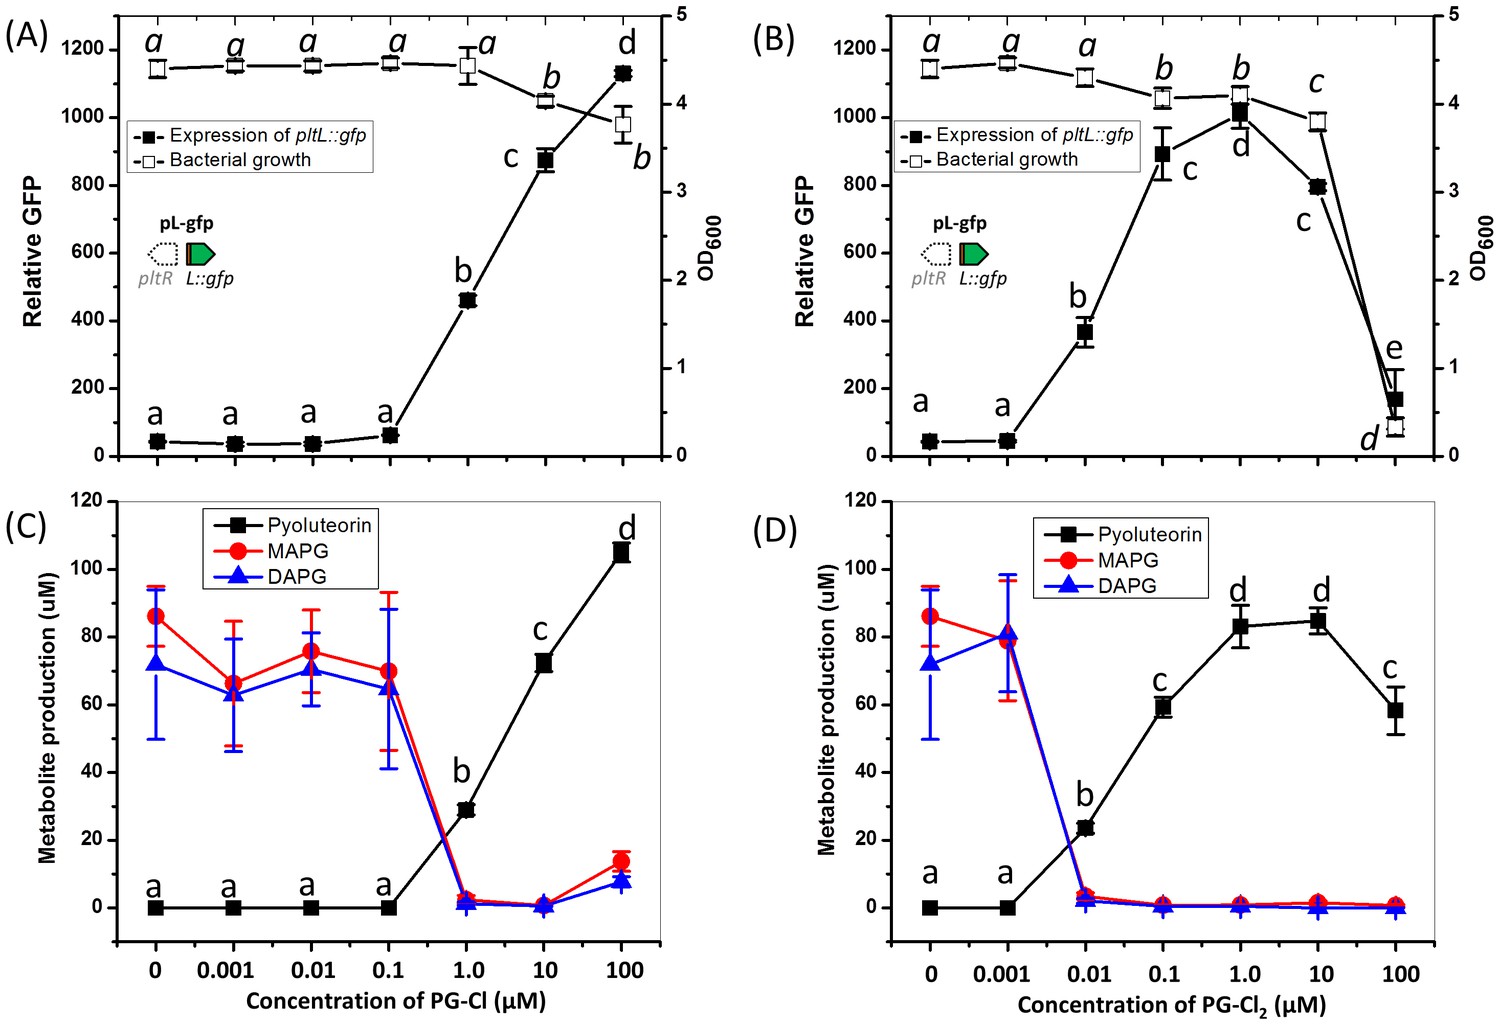
Influence of PG-Cl (left) and PG-Cl2 (right) on expression of pltL::gfp (A, B) and production of pyoluteorin (C, D) in the ΔpltM mutant of P. protegens Pf-5.
The ΔpltM mutant was cultured in NBGly amended with increasing concentrations of PG-Cl and PG-Cl2. To test the regulatory effects of PG-Cl and PG-Cl2 on expression of pyoluteorin biosynthetic genes, GFP activity was determined from the ΔpltM mutant containing pL-gfp 20 hr after inoculation (A, B). The OD600 value of bacterial cultures (24 hr after inoculation) was measured to show the influence of PG-Cl and PG-Cl2 on the bacterial growth (A, B). The bacterial cultures were extracted 24 hr after inoculation and production of pyoluteorin, MAPG and DAPG were quantified (C, D). Letters above the symbols indicate treatments significantly different from one another, as determined by ANOVA analysis (p<0.05). Data are means of at least three biological replicates from a representative experiment repeated twice with similar results, and error bars represent the standard deviation of the mean.
-
Figure 6—source data 1
Expression of pltL::gfp and production of pyoluteorin by the ΔpltM mutant of Pf-5 in response to chlorinated phloroglucinols.
The production of MAPG and DAPG is also shown.
- https://doi.org/10.7554/eLife.22835.019
Figure 6—figure supplement 1
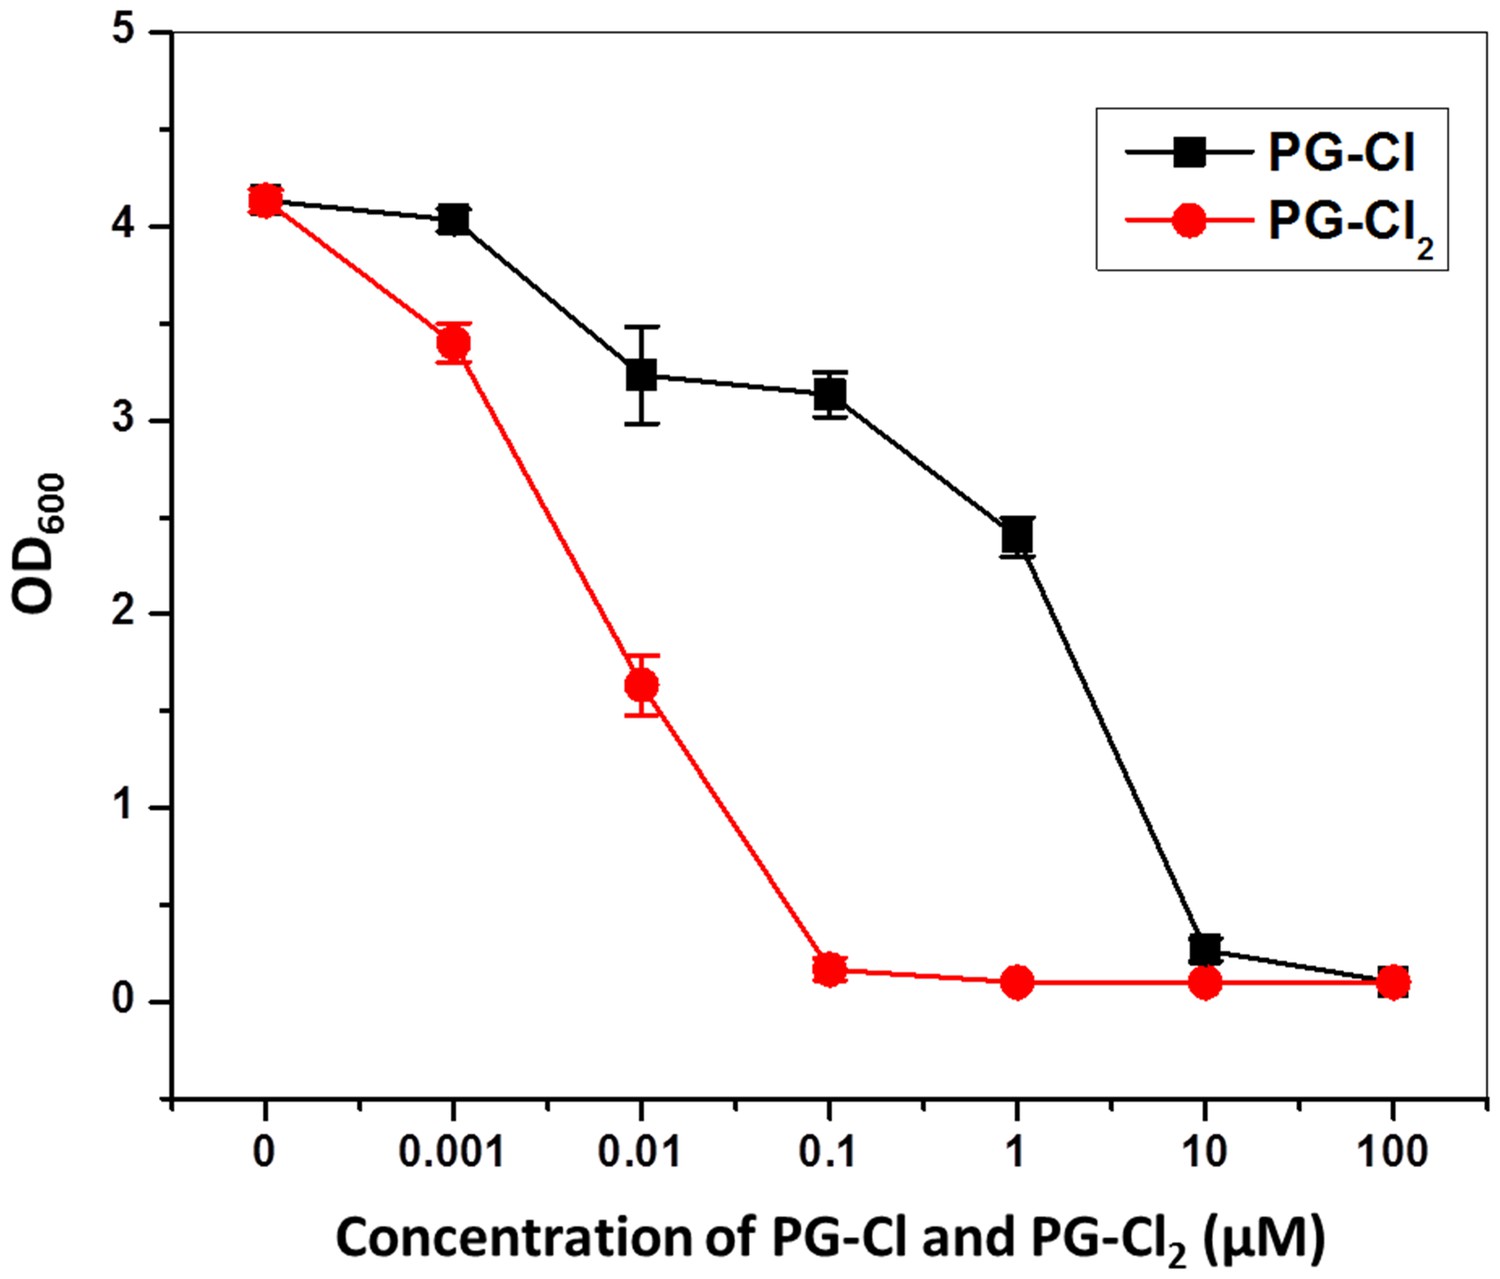
Effect of PG-Cl and PG-Cl2 on growth of P. fluorescens SBW25.
Strain SBW25 was cultured in NBGly amended with PG-Cl and PG-Cl2. The final concentrations of the compounds used in the cultures are indicated. Bacterial growth was recorded by measuring OD600 value of the cultures at 20 hr. Data are means of three biological replicates, and error bars represent the standard deviation of the mean. The experiment was done at least twice with similar results and results from one experiment are shown.
-
Figure 6—figure supplement 1—source data 1
Toxicity of PG-Cl and PG-Cl2 to P. fluorescens SBW25.
PG-Cl and PG-Cl2 were tested at different concentrations as indicated. 0 means methanol was added to the cultures as a control.
- https://doi.org/10.7554/eLife.22835.021
Figure 6—figure supplement 2
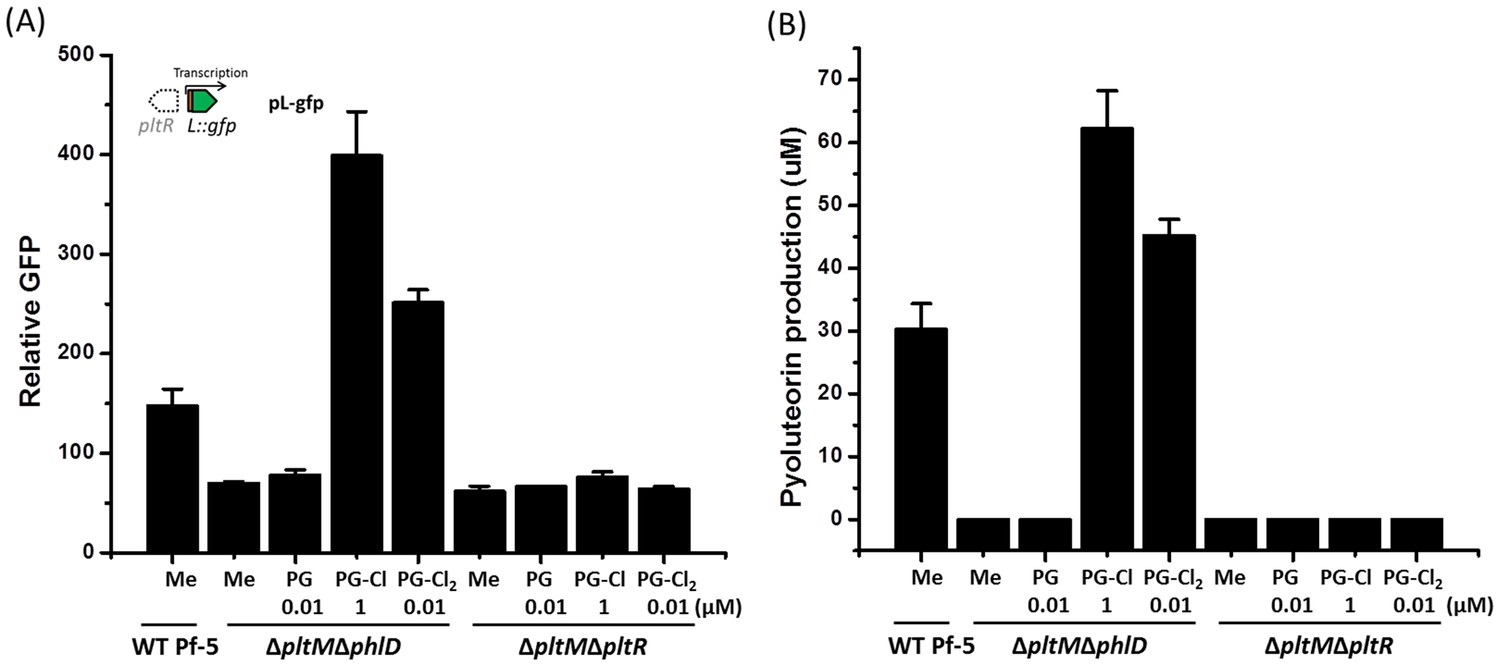
Effect of PG-Cl and PG-Cl2 on expression of pltL::gfp (A) and production of pyoluteorin (B) in the ΔpltMΔphlD mutant and the ΔpltMΔpltR mutant of P. protegens Pf-5.
The ΔpltMΔphlD mutant and the ΔpltMΔpltR mutant were cultured in NBGly broth with addition of PG-Cl and PG-Cl2. The final concentrations of the compounds (µM) used in the cultures are shown. (A) To test the regulatory effects of PG-Cl and PG-Cl2 on expression of pyoluteorin biosynthetic genes, the mutants containing pL-gfp were used. The expression level of pltL::gfp was monitored and recorded as relative GFP, which was calculated as GFP divided by OD600. (B) To test the regulatory effect of PG-Cl and PG-Cl2 on the production of pyoluteorin, secondary metabolites were extracted from the cultures and analyzed by HPLC. Data are means of three biological replicates from a representative experiment repeated two times with similar results, and error bars represent the standard deviation of the mean.
-
Figure 6—figure supplement 2—source data 1
Expression of pltL::gfp and the production of pyoluteorin by Pf-5 wild-type (WT) and its derivatives in response to chlorinated phloroglucinols.
- https://doi.org/10.7554/eLife.22835.023
Figure 6—figure supplement 3
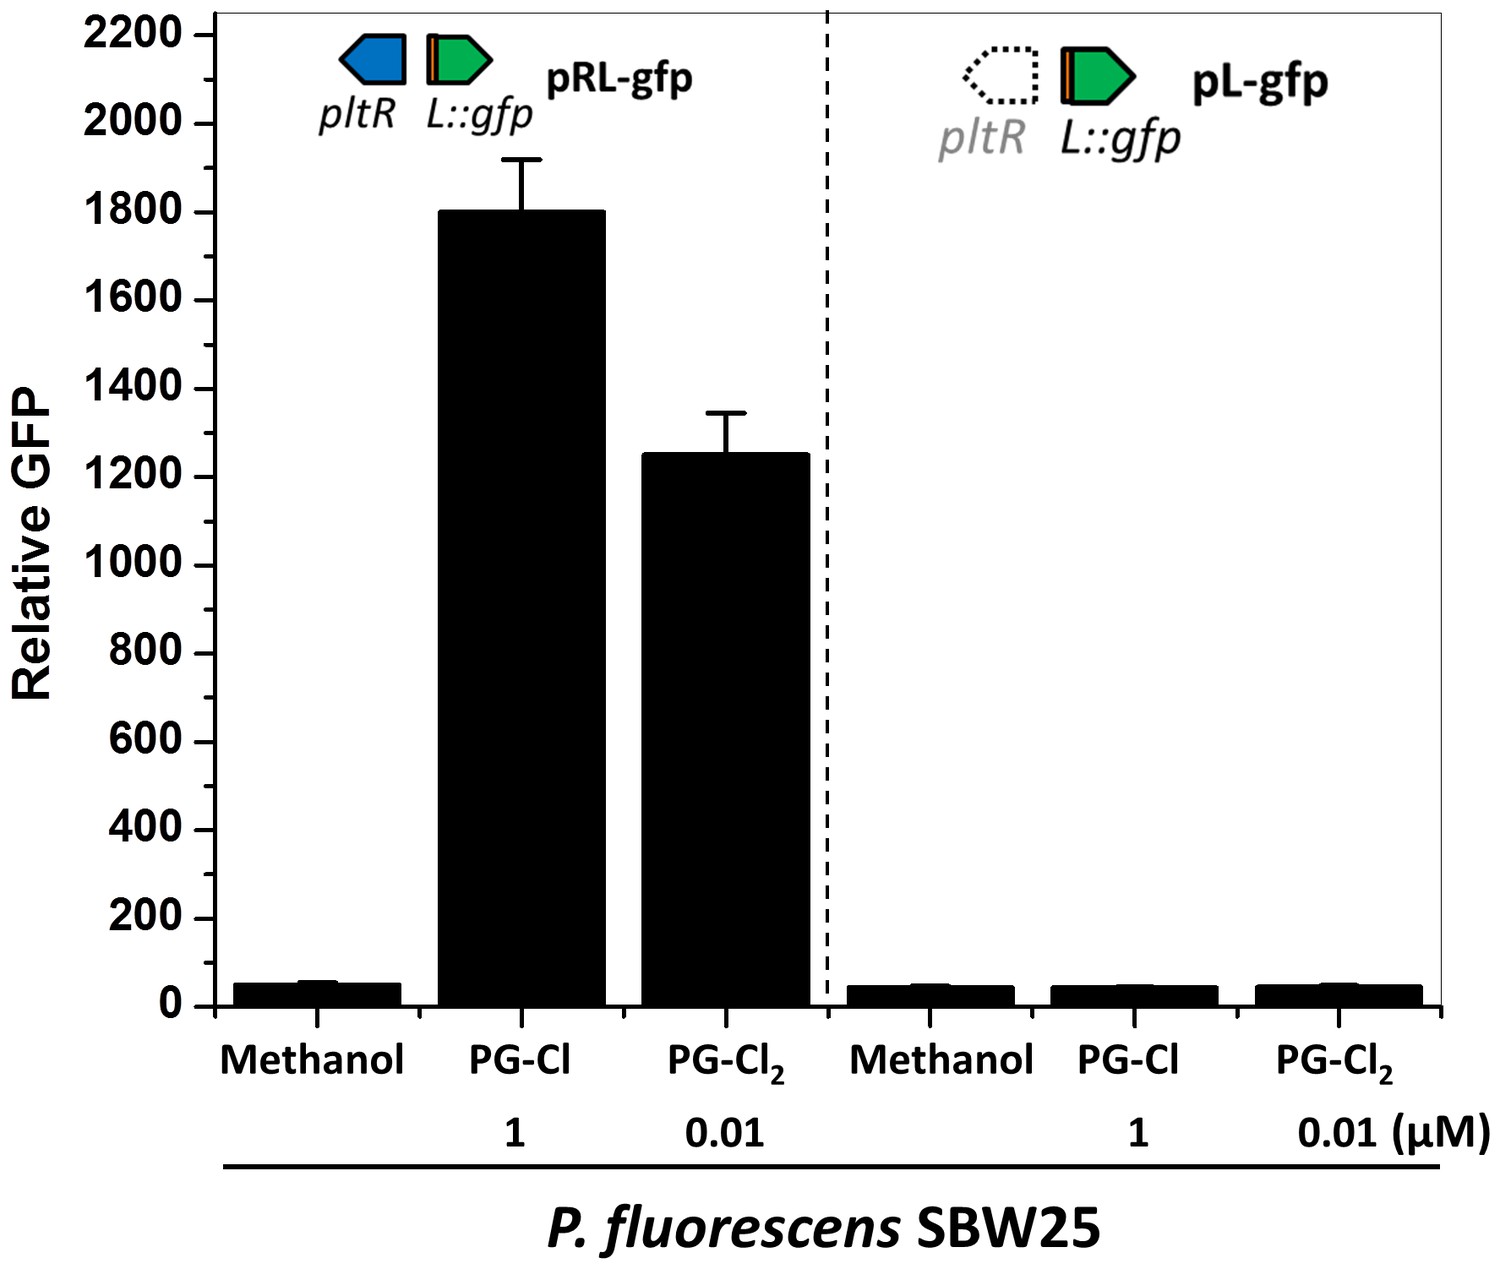
Effect of PG-Cl and PG-Cl2 on the expression of pltL::gfp in P. fluorescens SBW25.
SBW25 strains containing reporter construct pRL-gfp (left of dotted line) and pL-gfp (right of dotted line) were cultured in NBGly amended with PG-Cl and PG-Cl2. The final concentrations of the compounds (µM) used in the cultures are indicated. The same volume of methanol was added to the cultures serving as negative controls (Methanol). The expression level of pltL::gfp was monitored and recorded as relative GFP, which was calculated as GFP divided by OD600. Data are means of three biological replicates from a representative experiment repeated three times with similar results, and error bars represent the standard deviation of the mean.
-
Figure 6—figure supplement 3—source data 1
Expression of pltL::gfp by SBW25 containing pL-gfp or pRL-gfp in response to chlorinated phloroglucinols.
- https://doi.org/10.7554/eLife.22835.025
Figure 7 with 2 supplements
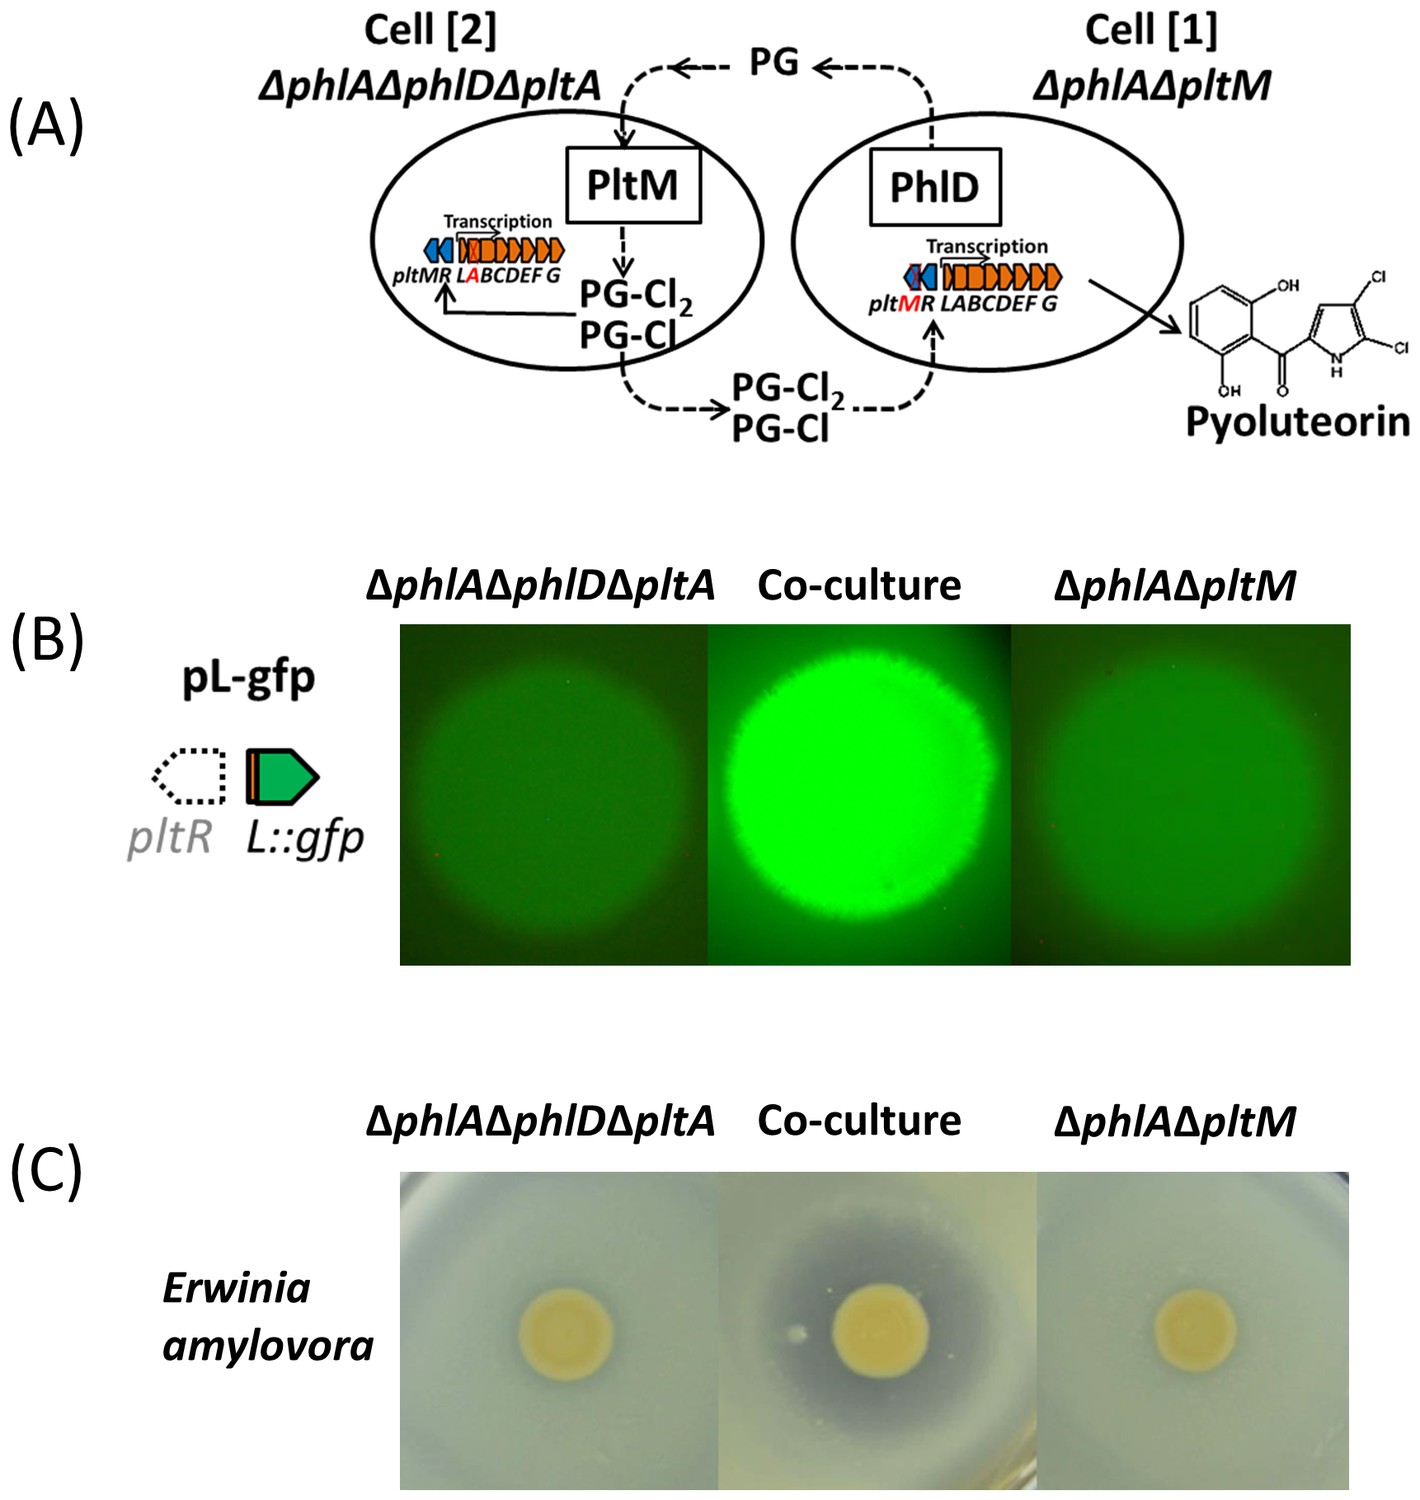
PG-Cl and PG-Cl2 function as cell-cell communication signals of P. protegens Pf-5.
(A) Proposed cell-cell communication model. Cell [1] (ΔphlAΔpltM) produces phloroglucinol (PG) and releases it into the environment. PG is taken up by cell [2] (ΔphlAΔphlDΔpltA) and converted into PG-Cl and PG-Cl2, which are secreted into the environment. PG-Cl and PG-Cl2 are taken up by cell [1] and induce expression of pyoluteorin biosynthetic genes and production of pyoluteorin by cell [1]. The plt gene cluster is shown. Red font indicates that the gene was deleted. (B) GFP expression from the pure- and co-culture of the ΔphlAΔpltM mutant containing pL-gfp and the ΔphlAΔphlDΔpltA mutant containing pL-gfp on NAGly plate. (C) Antibiosis of the pure- and co-culture of the ΔphlAΔpltM mutant and ΔphlAΔphlDΔpltA mutant against growth of Erwinia amylovora on a NAGly plate. The co-culture was prepared by mixing the two mutants 1:1 and spotting on the plate. The experiment was repeated at least twice, with similar results.
Figure 7—figure supplement 1
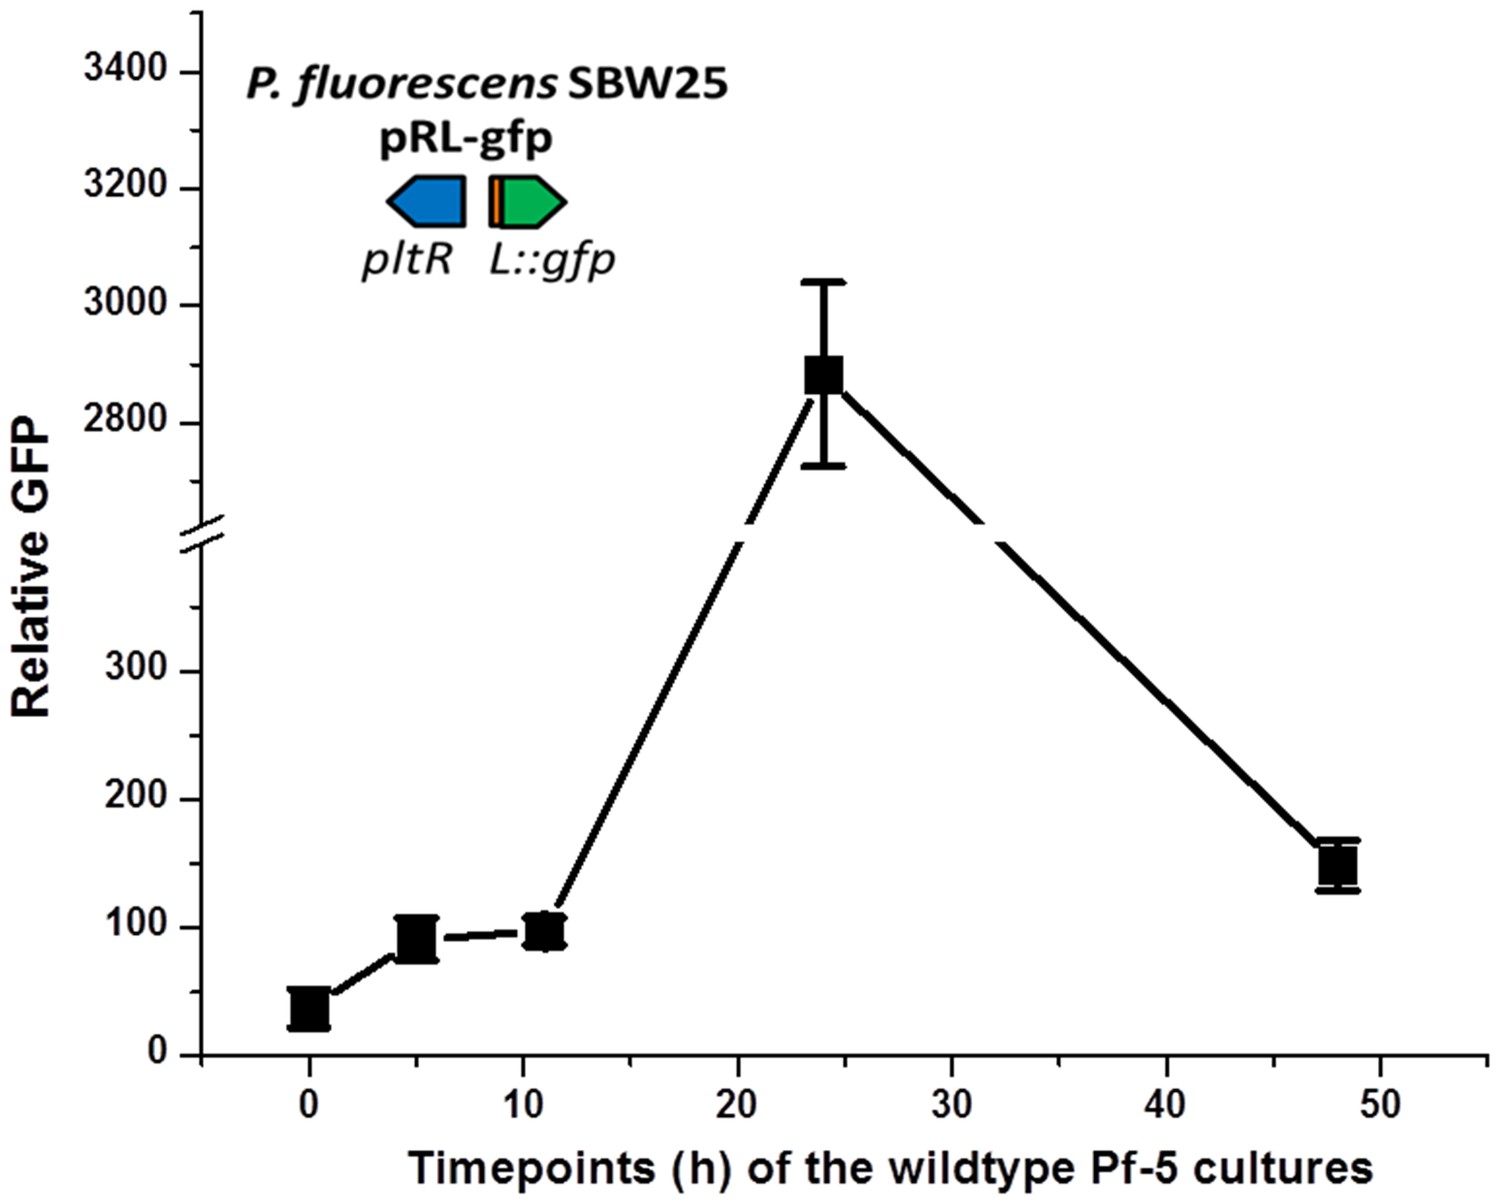
Levels of signaling compounds in cultures of P. protegens Pf-5 of different ages.
Relative levels of signaling compounds that induce pltL expression were determined from extracts of Pf-5 culture supernatants by assessing GFP expressed by P. fluorescens SBW25 containing the reporter construct pRL-gfp. Cultures of wild-type Pf-5 were grown in 5 ml NBGly for different times, as indicated. Data are means of three biological replicates from a representative experiment repeated three times with similar results, and error bars represent the standard deviation of the mean.
-
Figure 7—figure supplement 1—source data 1
Expression of pltL::gfp by SBW25 in response to extracts of wild-type Pf-5 cultures.
Pf-5 wild-type was cultured for different times, as indicated. The culture extracts were tested by SBW25 containing pRL-gfp.
- https://doi.org/10.7554/eLife.22835.028
Figure 7—figure supplement 2
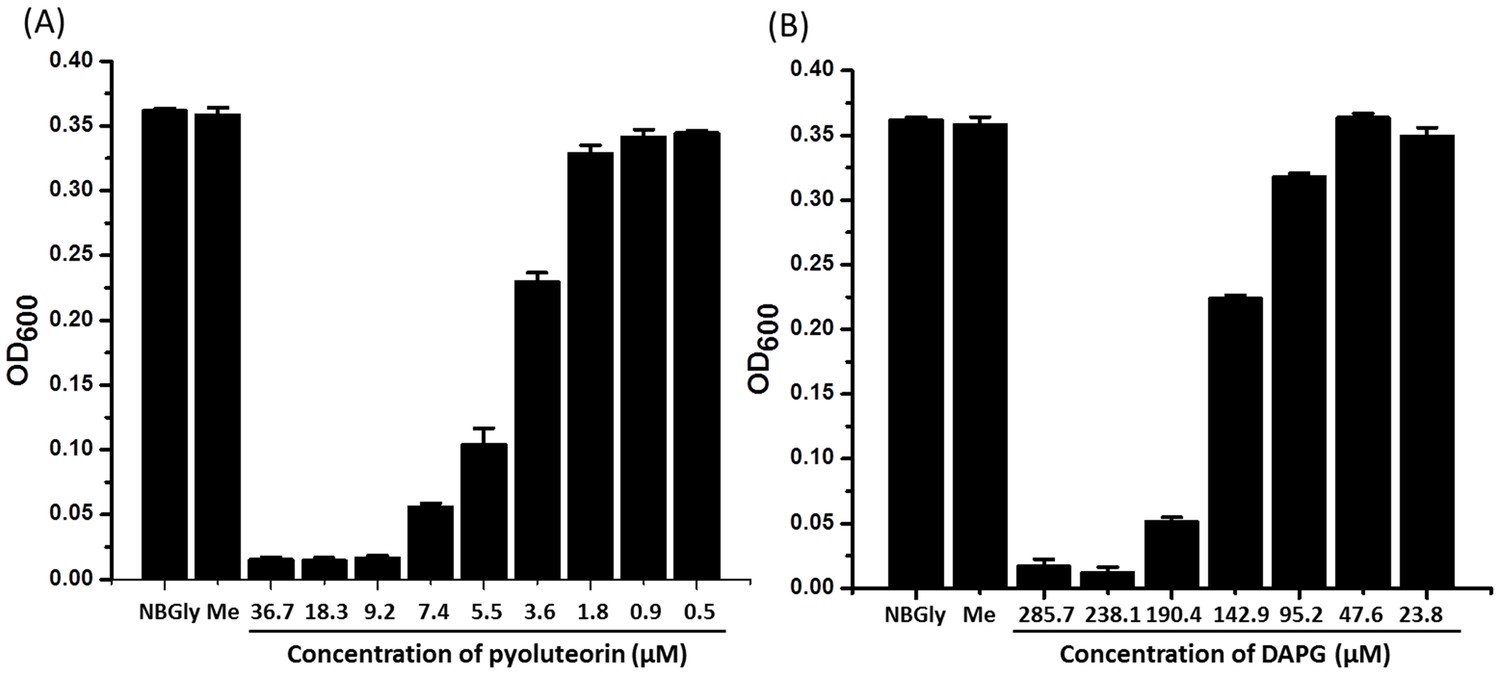
Toxicity of pyoluteorin (A) and DAPG (B) to the plant pathogen Erwinia amylovora.
Erwinia amylovora was cultured in NBGly broth for 24 hr in a 96-well plate with or without the tested compounds. The final concentrations of the tested compounds are indicated. The growth of the bacteria was monitored by measuring the value of OD600 of the bacterial cultures. Me, negative control composed of a culture amended with the same volume of methanol used in cultures amended with pyoluteorin or DAPG. Data are means of three biological replicates from a representative experiment repeated two times with similar results, and error bars represent the standard deviation of the mean.
-
Figure 7—figure supplement 2—source data 1
Growth of Erwinia amylovora in response to pyoluteorin and DAPG.
- https://doi.org/10.7554/eLife.22835.030
Figure 8
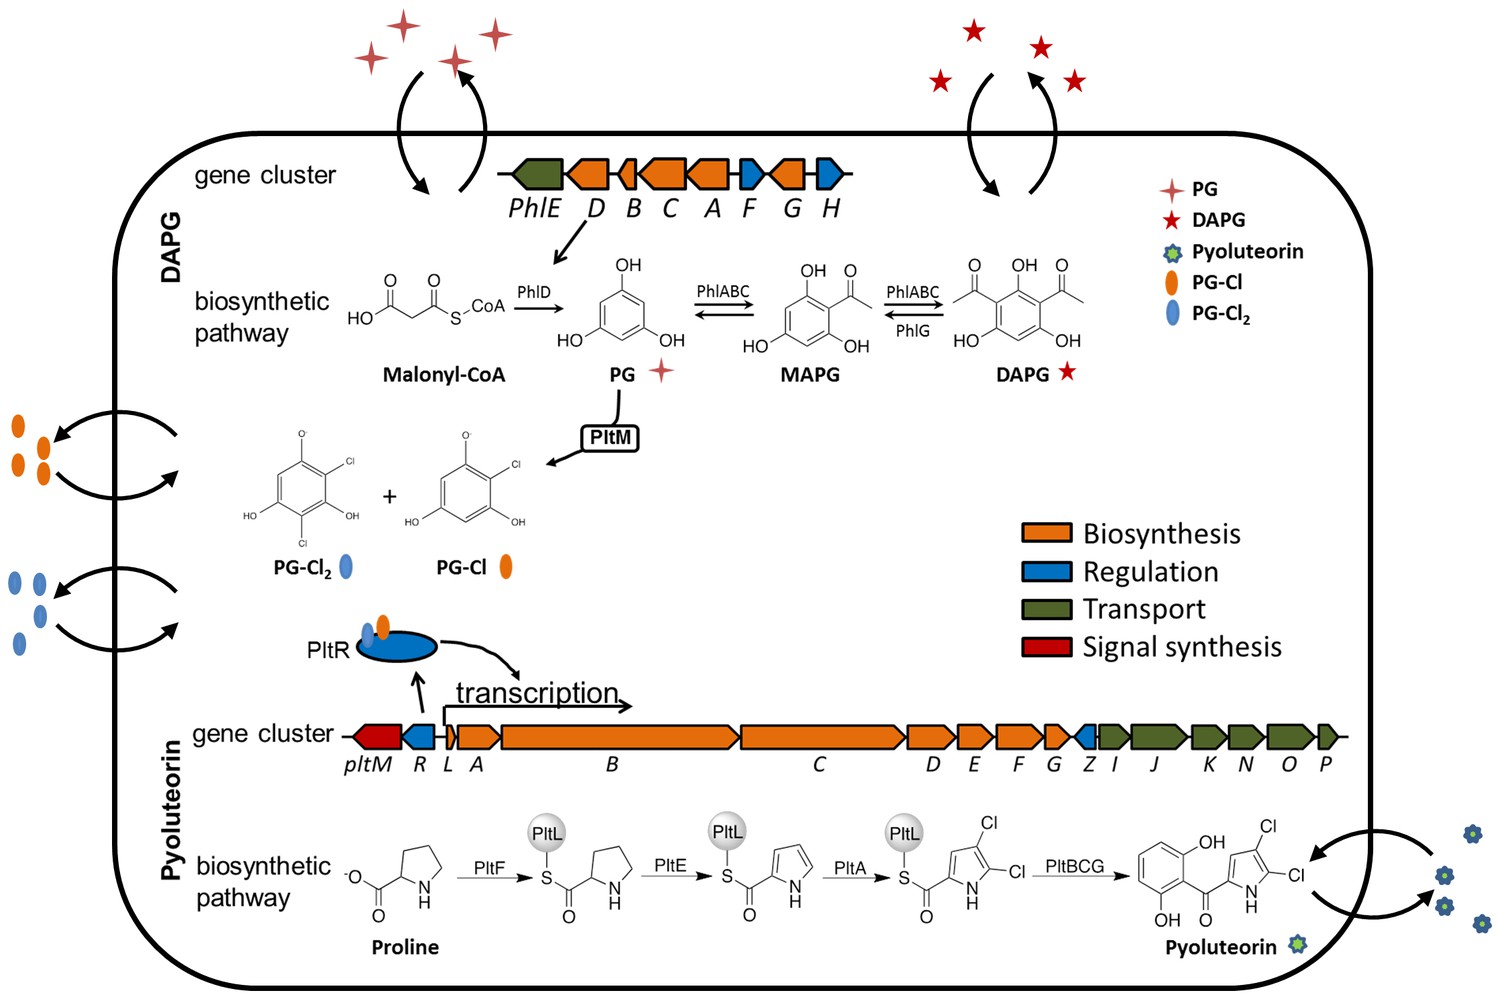
Proposed model of metabolic co-regulation between DAPG and pyoluteorin biosynthetic pathways in P. protegens.
Phloroglucinol (PG) is synthesized by the type III polyketide synthase PhlD in the DAPG biosynthetic pathway, and processed into PG-Cl and PG-Cl2 by the halogenase PltM encoded in the pyoluteorin gene cluster. The PG-Cl and PG-Cl2 putatively bind to regulator PltR and induce transcription of pyoluteorin biosynthetic genes and prompt production of pyoluteorin. In these two pathways, the final products (DAPG and pyoluteorin), the biosynthesis intermediate (PG) and its derivatives (PG-CL, PG-Cl2) can be released and used by bacteria and function as cell-cell communication signals.
Tables
Table 1
Concentrations of DAPG, pyoluteorin, and expression of pltL::gfp in pure cultures and co-culture of the ΔphlAΔpltM mutant and the ΔphlAΔphlDΔpltA mutant of P. protegens Pf-5.
| Product/expression* | Amendment† | Bacterial cultures‡ | ||
|---|---|---|---|---|
| ΔphlAΔpltM | ΔphlAΔpltM + ΔphlAΔphlDΔpltA | ΔphlAΔphlDΔpltA | ||
| Pyoluteorin | None | BD | 6.2 ± 1.8 nmol/g | BD |
| DAPG | None | BD | BD | BD |
| Relative GFP | None | 34.6 ± 2.3 | 137.4 ± 3.4§; 214.7 ± 11.2¶ | 27.6 ± 1.9 |
| PG (10 nM) | 37.6 ± 3.1 | NT | 133.3 ± 6.4 | |
| PG-Cl (1 µM) | 261.0 ± 13.3 | NT | 308.6 ± 21.8 | |
| PG-Cl2 (10 nM) | 128.2 ± 10.7 | NT | 268.4 ± 16.2 | |
-
*The mutants were cultured for 3 d on a NAGly plate to determine production of secondary metabolites, and for 20 hr in NBGly broth to determine expression of pltL::gfp from the reporter construct pL-gfp (Figure 1E). The co-culture was prepared by mixing the two mutants at a 1:1 ratio.
-
†PG, PG-Cl or PG-Cl2 was amended in the mutant cultures to test their influences on the expression of pltL::gfp. The concentrations of the tested compounds are shown in parenthesis.
-
‡Secondary metabolites were extracted from the agar plate and the concentrations of DAPG and pyoluteorin were determined by HPLC. Expression of pltL::gfp was monitored and recorded as relative GFP (fluorescence of GFP divided by OD600). §The ΔphlAΔpltM mutant, but not the ΔphlAΔphlDΔpltA mutant, contains pL-gfp in the co-culture. ¶The ΔphlAΔphlDΔpltA mutant, but not the ΔphlAΔpltM mutant, contains pL-gfp in the co-culture. Data are presented as mean ± standard derivation. Mean values are calculated from three biological replicates. BD = below detection. NT = not tested.
Table 2
Bacterial strains and plasmids used in this study.
| Strains and plasmids | Genotype and relevant characteristics* | Reference or source |
|---|---|---|
| Strains | ||
| P. protegens | ||
| LK099 | Wild-type Pf-5 | (Howell and Stipanovic, 1979) |
| JL4928 | ΔpltAΔphlD | This study |
| LK269 | ΔpltAΔphlDΔpltR | This study |
| LK270 | ΔpltM | This study |
| LK024 | ΔphlD | (Kidarsa et al., 2011) |
| LK293 | ΔpltMΔpltR | This study |
| LK397 | ΔphlDΔpltM | This study |
| LK096 | ΔpltAΔphlA | (Henkels et al., 2014) |
| LK403 | ΔphlAΔpltM | This study |
| LK413 | ΔphlAΔphlDΔpltA | This study |
| P. fluorescens SBW25 | SBW25 is a member of the P. fluorescens group but does not contain the phl or plt gene clusters | (Silby et al., 2009) |
| E. coli | ||
| BL21(DE3) | ompT hsdSB (rB−mB−) gal dcm | NEB |
| S17-1 | recA pro hsdR-M+ RP4 2-Tc::Mu-Km::Tn7 Smr Tpr | (Simon et al., 1983) |
| Plasmids | ||
| pEX18Tc | Gene replacement vector with MCS from pUC18, sacB+ Tcr | (Hoang et al., 1998) |
| p18Tc-ΔpltM | pEX18Tc containing pltM with an internal deletion of 1345 bp | This study |
| pPROBE-NT | pBBR1 containing promoterless gfp, Kmr | (Miller et al., 2000) |
| pRL-gfp | pPROBE-NT containing pltR as well as the intergenic region between pltR and pltL including the promoter of pltL fused with a promoterless gfp | This study |
| pMRL-gfp | pPROBE-NT containing pltM and pltR as well as the intergenic region between pltR and pltL including the promoter of pltL fused with a promoterless gfp | This study |
| pL-gfp | Called ppltL-gfp previously. Contains the intergenic region between pltR and pltL including the promoter of pltL fused with a promoterless gfp | (Yan et al., 2016) |
| pME6010 | pACYC177-pVS1 shuttle vector, Tcr | (Heeb et al., 2000) |
| pME6010-pltM | pME6010 containing pltM, which is expressed from the constitutive promoter Pk | This study |
| pET28a(+) | Protein overexpression vector | Novagen |
| pET28a-PltM | pET28a containing pltM, used for overexpression of the PltM protein | This study |
| pET28a-SsuE | pET28a containing ssuE, used for overexpression of the SsuE protein | This study |
-
*Smr, streptomycin resistance; Tpr, trimethoprim resistance; Tcr, tetracycline resistance; Kmr, kanamycin resistance.
Table 3
Sequences of oligonucleotides used in this study
| Oligonucleotides | DNA sequences* |
|---|---|
| pltR UpF-Xba | GAGAGGTCTAGAAGTGGAGTCTGGTCATCAAG |
| pltR UpR | GCTCTTGTCTTGTAGTCTTCCTGTTTCGGAGAA |
| pltR DnF | AACAGGAAGACTACAAGACAAGAGCCAGACATC |
| pltR DnR-Xba | GGTGTGTCTAGAGTGAAGAATGAGCAGGTGTC |
| pltM-F1 | ATGGTACCCTGCATTTCGATACCGC |
| pltM-R1 | ATAGAATTCGGCGGACGGGTGGATC |
| pltMRL-F1 | AGCGATTTCGATCTTCATCCCC |
| pltM-up-ovlp | GAAGCGGCGACACCGGATCCAATCGTTTCATCC |
| pltM-dn-ovlp | GGATGAAACGATTGGATCCGGTGTCGCCGCTTC |
| pltRf | ATGGTACCAAGGATTTAGGAATGAAGGC |
| pltM 5'primer | GTCATACATATGAATCAGTACGACGTCATTATC |
| pltM 3' primer | CAGTGCCTCGAGTCAGACTTTGAGGATGAAACG |
| ssuE 5' primer | GGAGAGCATATGCGTGTCATCACC |
| ssuE 3' primer | GTAAAGCTTTTACGCATGGGCATT |
| pltM 3' primer3 | ATAGGATCCGGCCCCGGGCATCACTCAG |
| pltRr | TATAAGCTTTTCAGCCCGGACTTCGCGAGG |
| gfp-plt-r1 | ATGGTACCATAGACGTACGCTCCTGC |
-
*Restriction sites used for cloning are underlined in oligonucleotides.
Download links
A two-part list of links to download the article, or parts of the article, in various formats.
Downloads (link to download the article as PDF)
Open citations (links to open the citations from this article in various online reference manager services)
Cite this article (links to download the citations from this article in formats compatible with various reference manager tools)
Novel mechanism of metabolic co-regulation coordinates the biosynthesis of secondary metabolites in Pseudomonas protegens
eLife 6:e22835.
https://doi.org/10.7554/eLife.22835


