Synthekines are surrogate cytokine and growth factor agonists that compel signaling through non-natural receptor dimers
- Howard Hughes Medical Institute, Stanford University School of Medicine, United States
- Stanford University School of Medicine, United States
- Primity Bio, United States
Figures
Figure 1
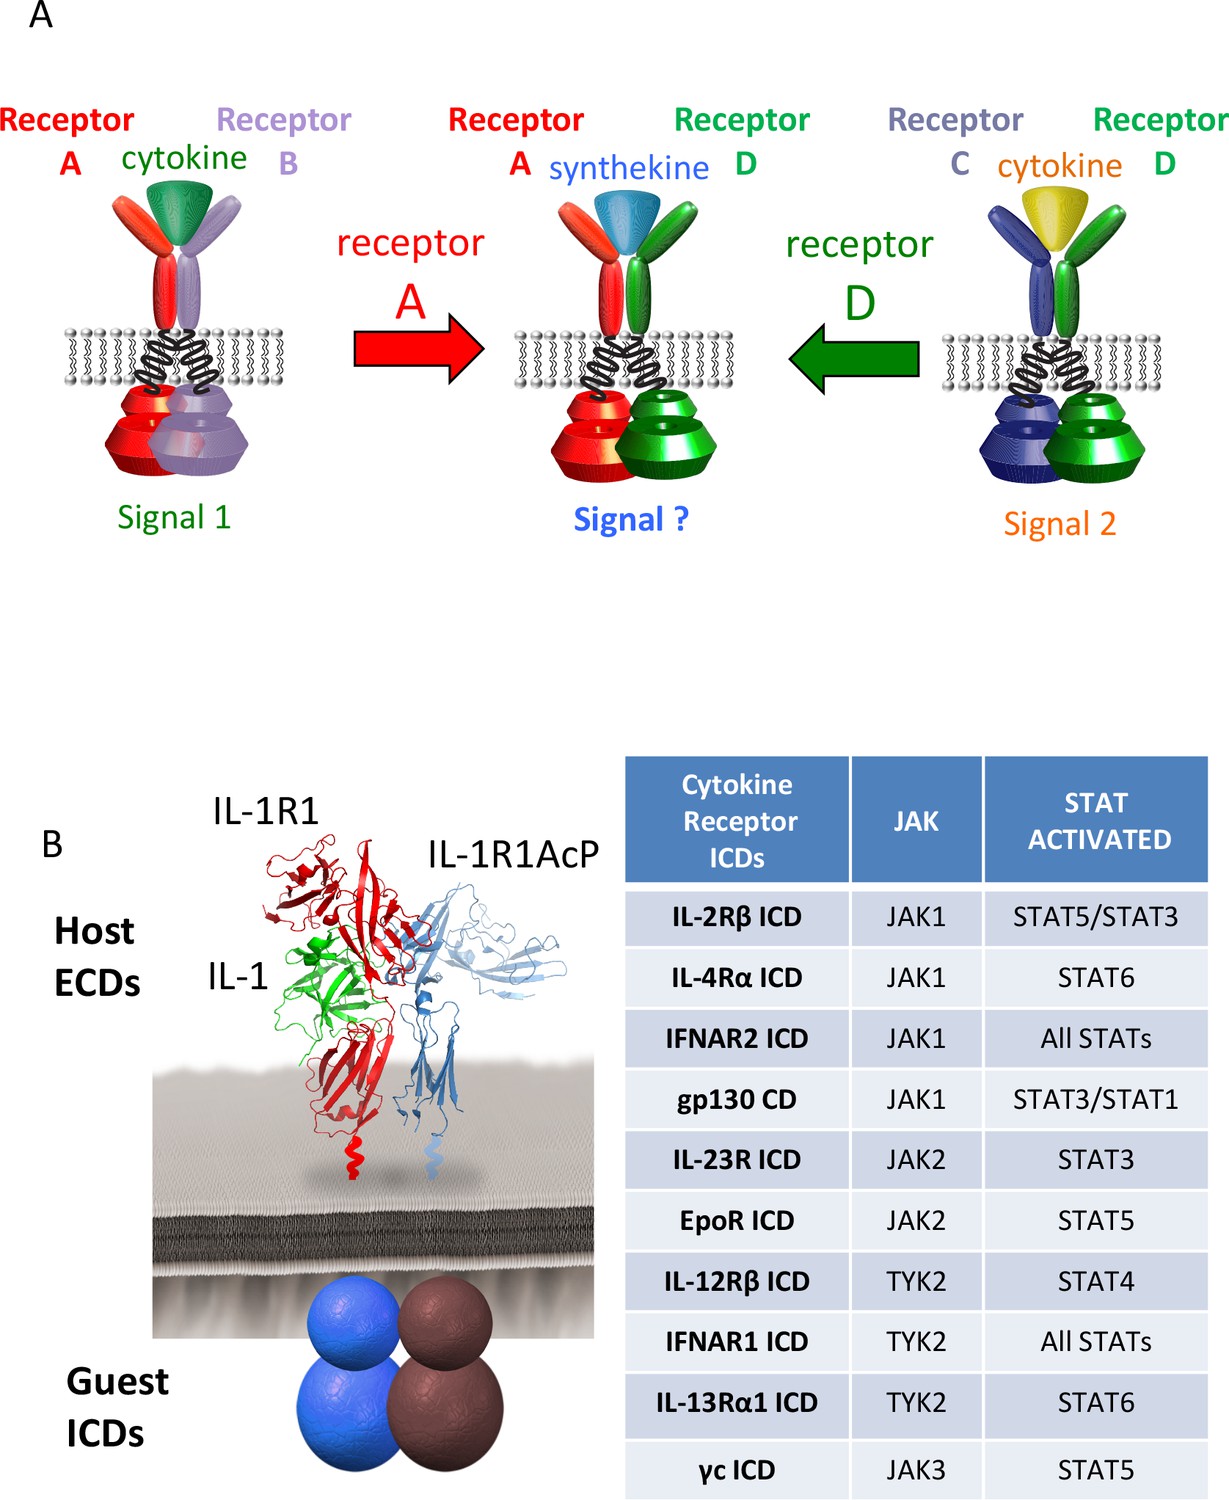
Dimerization of non-natural receptor pairs by engineered surrogate ligands.
(A) Schematic detailing the dimerization of new cytokine receptor pairs by synthekines. A hypothetical synthekine recruits receptors A and D to form a new ternary complex distinct from that formed by each of the cytokines. (B) Schematic representation of the IL-1-mediated complexation of IL-1R1 and IL-1R1AcP chimeric receptors. The intracellular domains of the cytokine receptors indicated in the right table were grafted onto the IL-1R1 or IL-1R1AcP extracellular domains. JAKs and STATs activated by each receptor are indicated in the table.
Figure 2 with 4 supplements
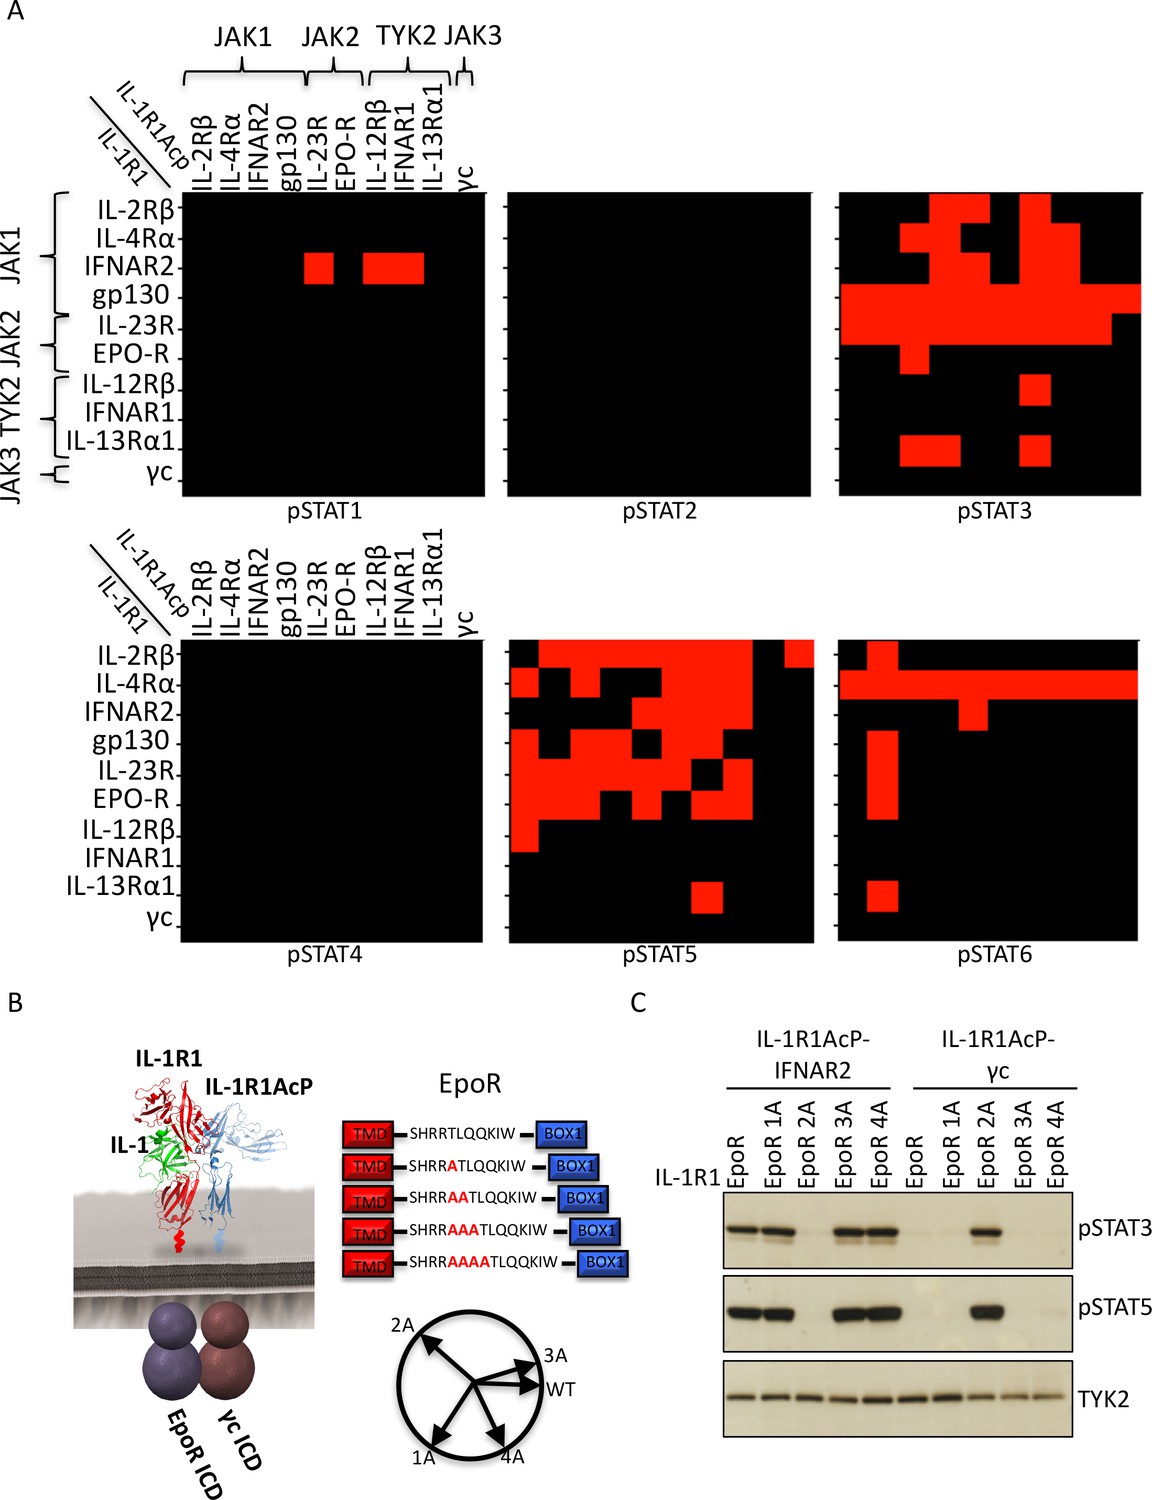
Non-natural cytokine receptor pairs activate signaling.
(A) Heatmap representation of STAT molecules activated by the 100 different cytokine receptor pair combinations generated from the chimeric receptor matrix described in Figure 1B. Results were binary coded to 1, presence of band, or 0, absence of band, in western blot analysis. (B) Schematic representation of the designed IL-1-inducible chimeric receptors (left). Alanine insertion mutagenesis of the EpoR juxtamembrane domain is detailed in the center. Alanine residues (1A, 2A, 3A, or 4A) were inserted after R251. Alpha-helical wheel projections of the register twists introduced by alanine residue addition are presented at right bottom. Each residue adds a 109° rotation, with insertion of 3A residues bringing the register close to the original position. (C) Phospho-STAT3 (pSTAT3) and pSTAT5 levels measured by western blot in IL-1-activated Jurkat cells expressing the indicated chimeric receptor pairs. Insertion of two alanines recovers signaling by the IL-1R1-EpoR/IL-1R1AcP-γc receptor pair. Total levels of TYK2 are presented as a loading control. The western blot presented is a representative example of two independent experiments.
Figure 2—figure supplement 1

Cell surface expression of chimeric receptors in Jurkat cells.
Flow cytometry dot plots of IL-1R1 and IL-1R1Acp chimeric receptors surface expression levels in Jurkat cells 24 hr after transfection.
Figure 2—figure supplement 2

Signaling profiles activated by chimeric receptors in Jurkat cells.
pSTAT1, pSTAT2, pSTAT3, pSTAT4, pSTAT5 and pSTAT6 levels measured by western blot in IL-1-activated Jurkat cells expressing the indicated chimeric receptor pairs. Total levels of TYK2 are presented as a loading control.
Figure 2—figure supplement 3
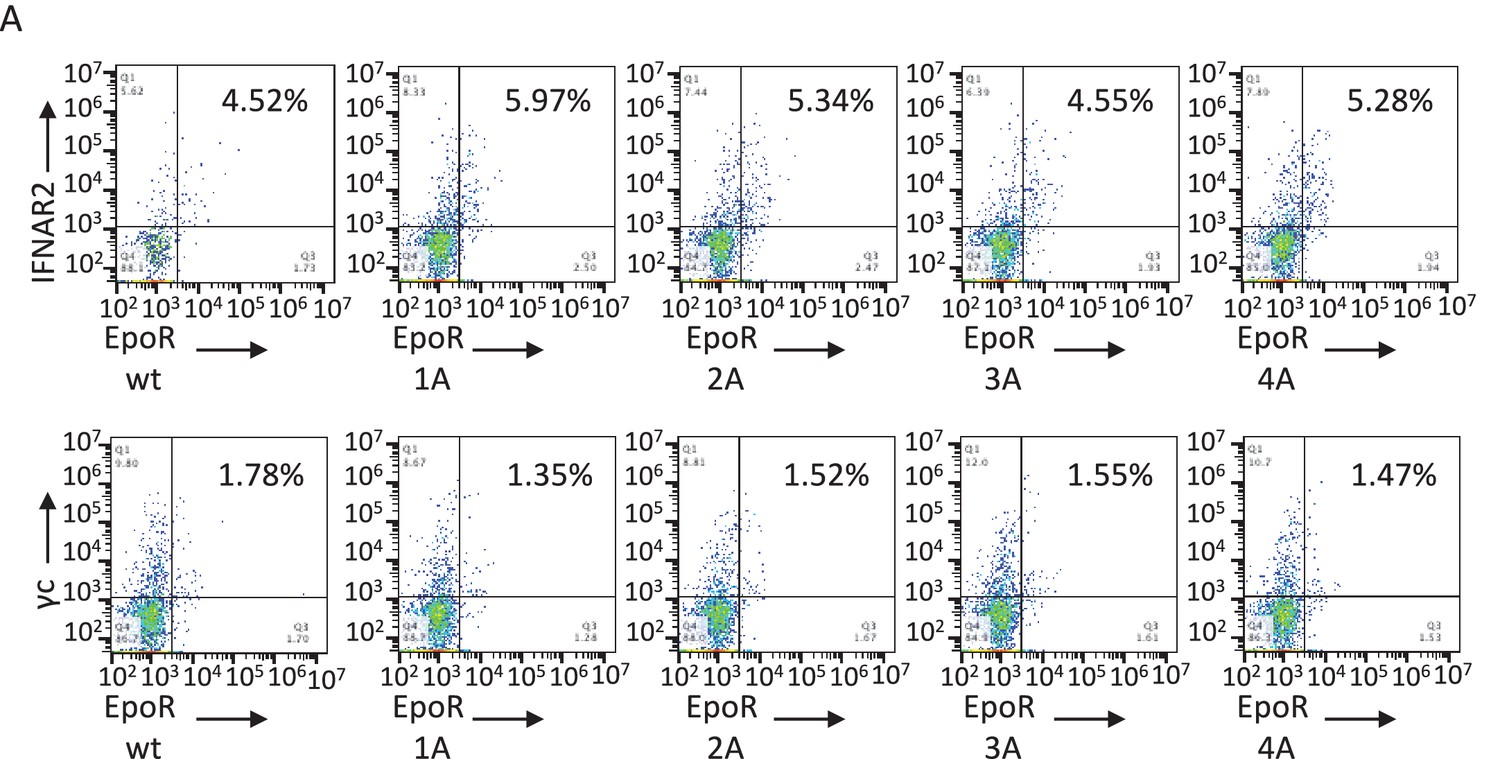
Cell surface expression of EpoR chimeric receptors in Jurkat cells.
Flow cytometry dot plot representation of the cell surface levels of the indicated chimeric receptors in Jurkat cells 24 hr post-transfection.
Figure 2—figure supplement 4
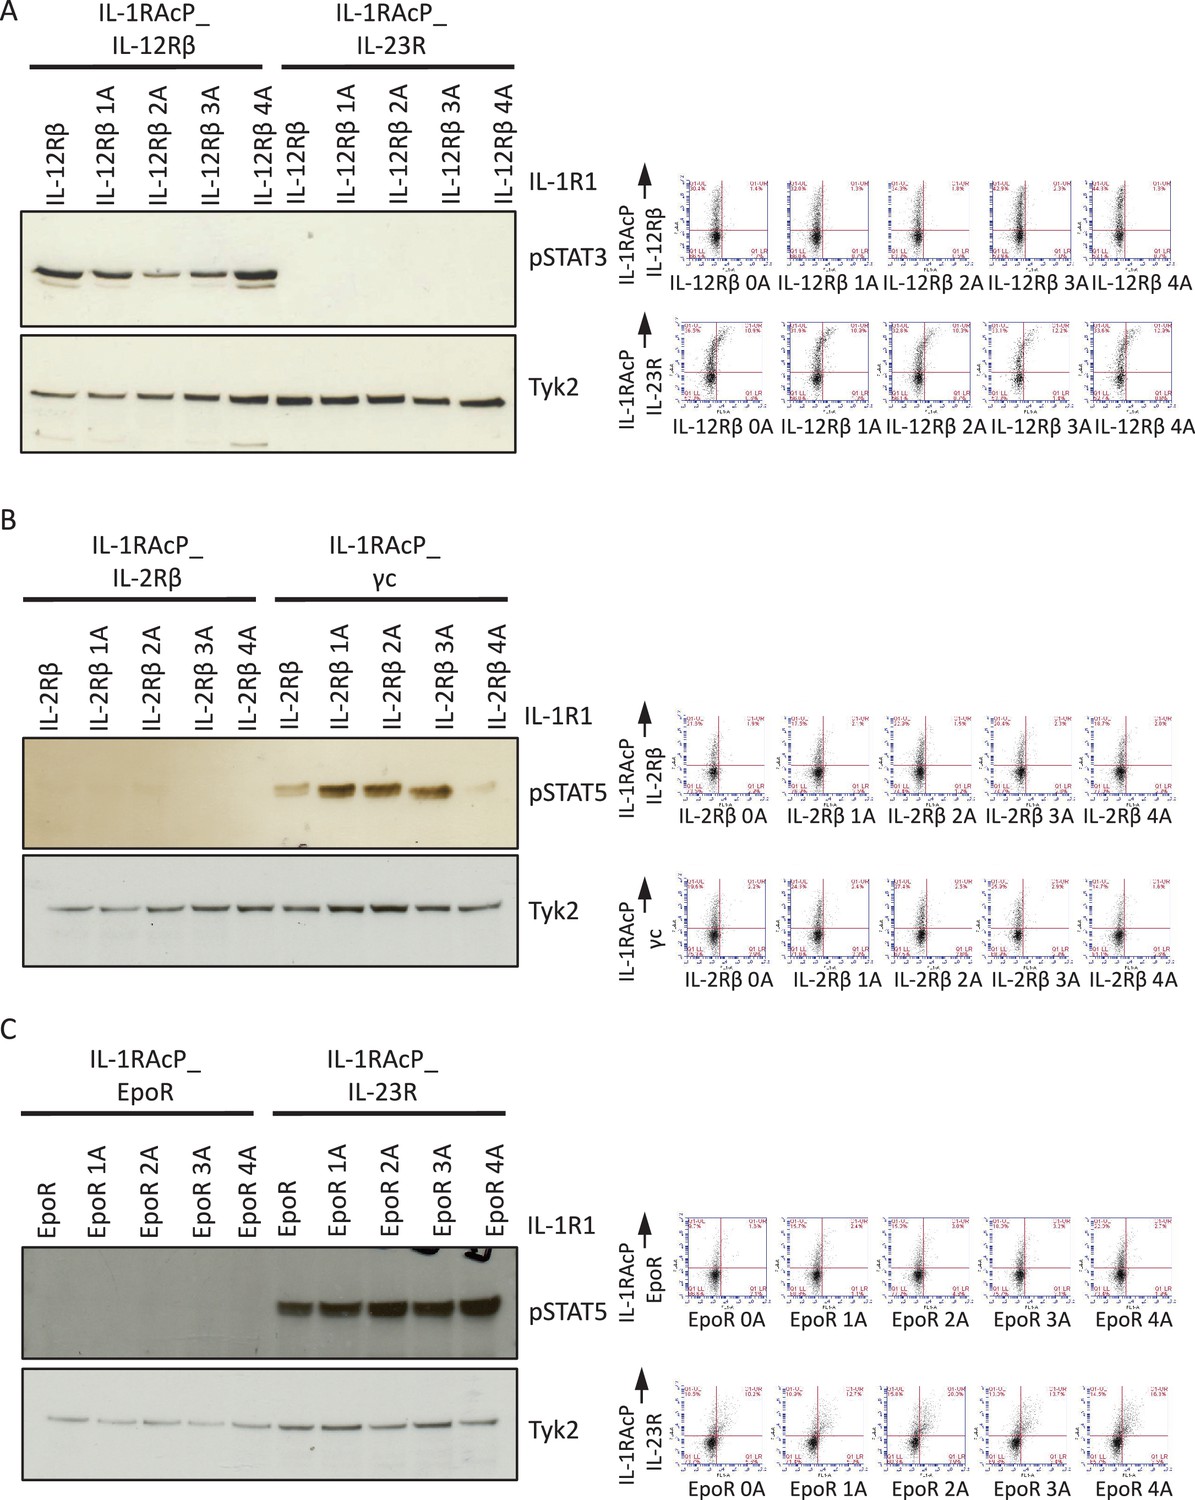
Alanine insertions do not recover signaling by the IL-23R-IL-12Rβ, IL-2Rβ-IL2Rβ and EpoR-EpoR chimeric receptors.
(A to C) STAT activation upon IL-1 stimulation measured by western blot (left panel) and cell surface expression in Jurkat cells measured by flow cytometry (right panel) for chimeric receptors with the indicated alanine insertions.
Figure 3 with 1 supplement
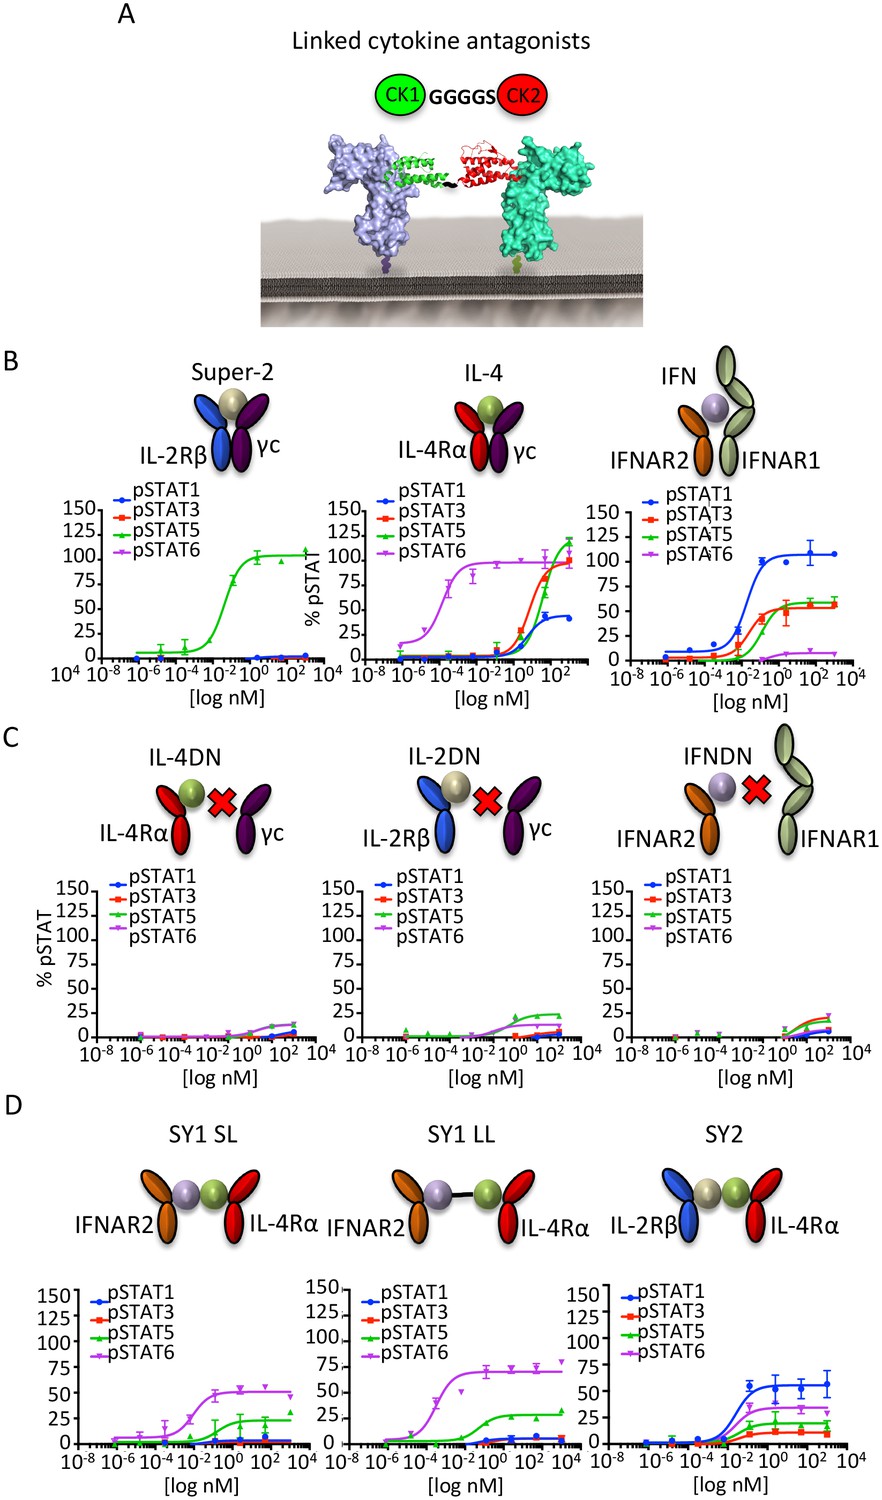
Synthekines dimerizing non-natural cytokine receptor pairs activate signaling.
(A) Layout and complex formation by a synthekine. Two dominant negative cytokine variants are genetically fused by a Gly4/Ser linker, resulting in a new molecule that induces formation of a non-natural cytokine receptor heterodimer. (B)-(D) pSTAT1, pSTAT3, pSTAT5 and pSTAT6 levels activated by the IL-4, Super-2 (affinity-matured variant of IL-2), and IFNω cytokines (B), the dominant negative cytokine variants IL-4DN, IL-2DN, and IFNDN (C), or the SY1 SL, SY1 LL, and SY2 synthekines (D) in the Hut78 T cell, as measured by flow cytometry. Data (mean ± SD) are from two independent replicates.
Figure 3—figure supplement 1
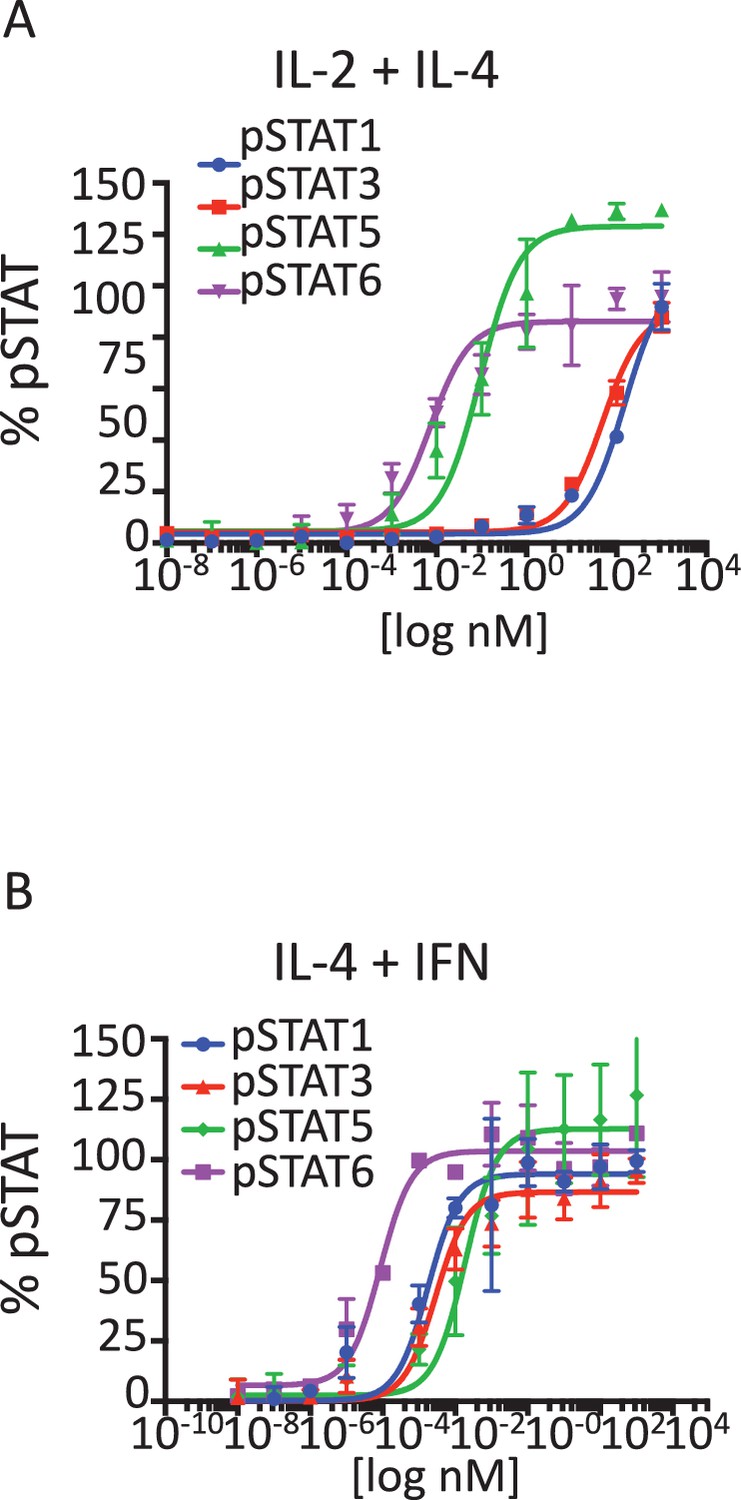
Signaling profiles activated by stimulation with Super-2/IL-4 and IL-4/IFN cytokine combinations.
(A-B) pSTAT1, pSTAT3, pSTAT5 and pSTAT6 activation levels induced by 15 min stimulation with the indicated concentrations of the Super-2/IL-4 (A) and IL-4/IFN cytokine combinations in Hut78 cells, as measured by flow cytometry. Data (mean ± SD) are from three independent experiments.
Figure 4 with 1 supplement

Synthekines activate different signaling programs than genome-encoded cytokines.
(A) Bubble plot representation of the signaling pathways activated by the indicated ligands after stimulation for 15, 60 or 120 min in Hut78 T cells. The size of the bubble represents the intensity of the signal activated. (B) Filled radar representation of the signaling molecules activated by the genome-encoded cytokines and synthekines following 15 min stimulation in Hut78 cells. The signaling molecules activated by the ligands are shown on the perimeter of the circle and their respective activation potencies are denoted by the radius of the circle. The different shapes of the filled radar exhibited by the different ligands define their distinct signaling signatures. (C) Ratio of STAT activation by cytokines and synthekines after 15 min stimulation on Hut78 cells. Each column represents the total STAT activation by each ligand normalized to 100%. The relative activation potency of each STAT is corrected accordingly. The different distribution of STAT activation by the various ligands suggest differential STAT usages between genome-encoded cytokines and synthekines. Data (mean) are from two independent replicates.
Figure 4—figure supplement 1
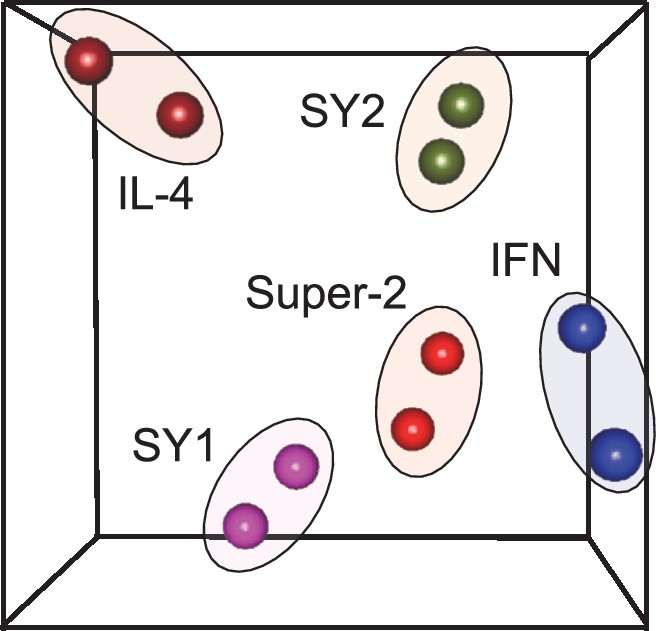
Unsupervised clustering of signaling programs engaged by cytokines and synthekines.
Principal Component Analsysis (PCA) of signaling programs engaged by genome-encoded cytokines and synthekines after 15 and 60 min stimulation in Hut78 cells. Genome-encoded cytokines and synthekines signatures are seprated in the space by equivalent distances, indicating that synthekines signaling programs are as different from the parental cytokines as they are from each other.
Figure 5 with 1 supplement
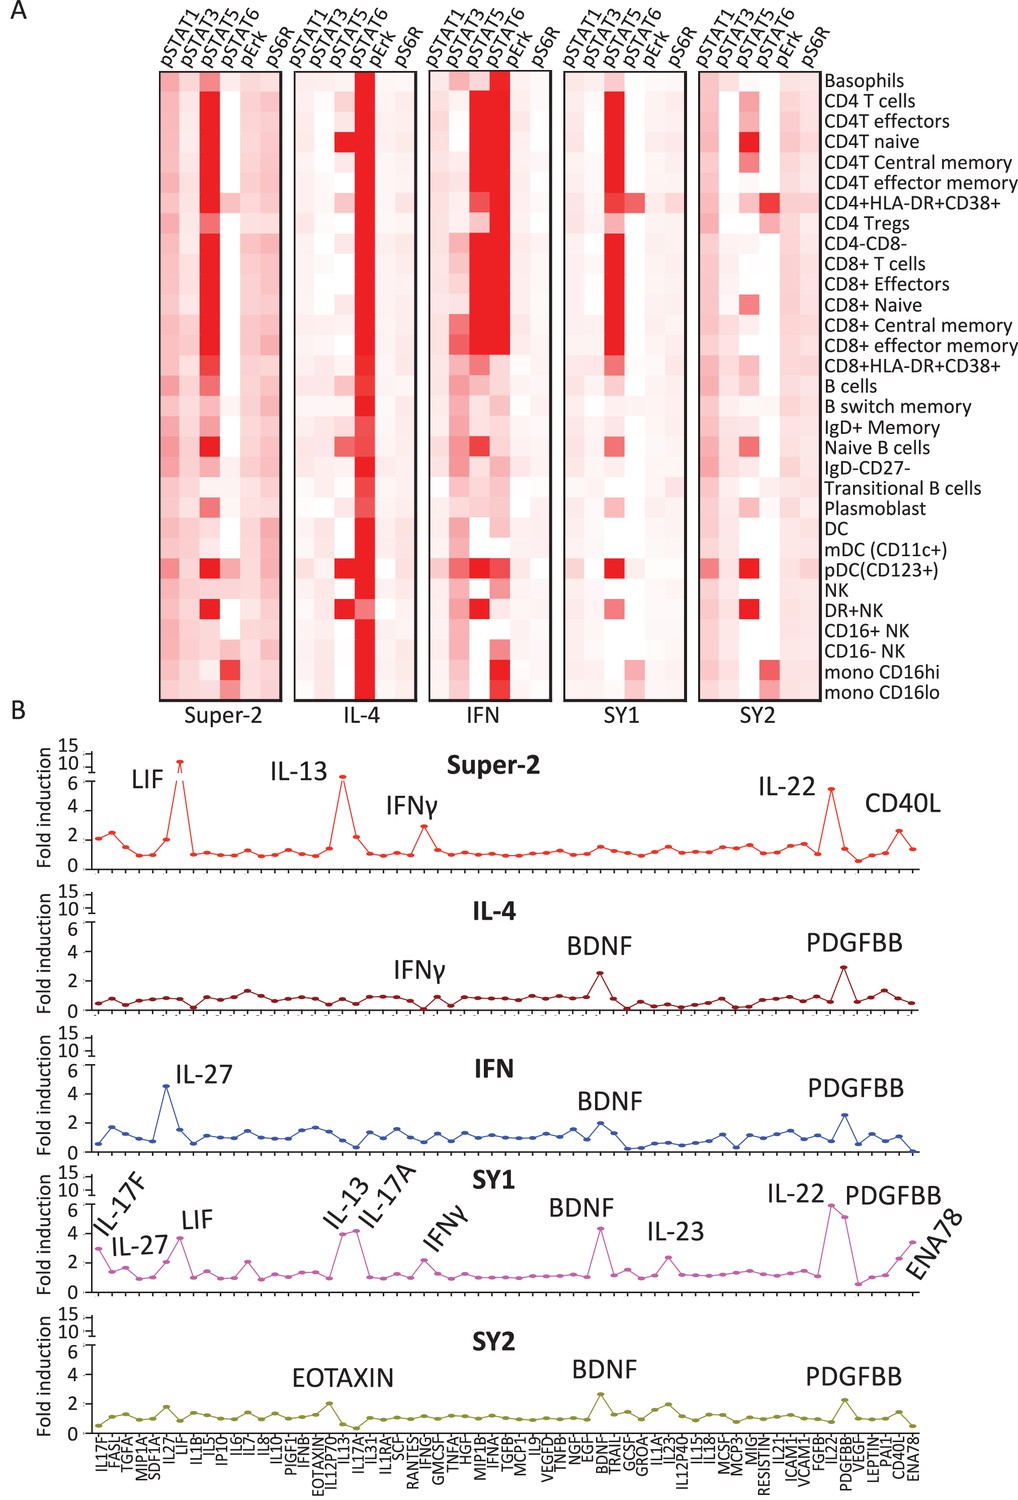
Synthekines elicit different cellular signatures and immune activities than genome-encoded cytokines.
(A) Heat map representations of the activation levels of six signal effectors induced by saturating doses of the indicated ligands in 29 immune cell types profiled from PBMCs, as measured by mass cytometry (CyTOF). Data (mean) are from two independent replicates. (B) Detailed analysis of the secretion profiles of 63 cytokines from PBMCs stimulated with the indicated ligands. Cytokines that were secreted more than two fold above background are labeled. Data (mean ± SD) are from two independent replicates.
Figure 5—figure supplement 1
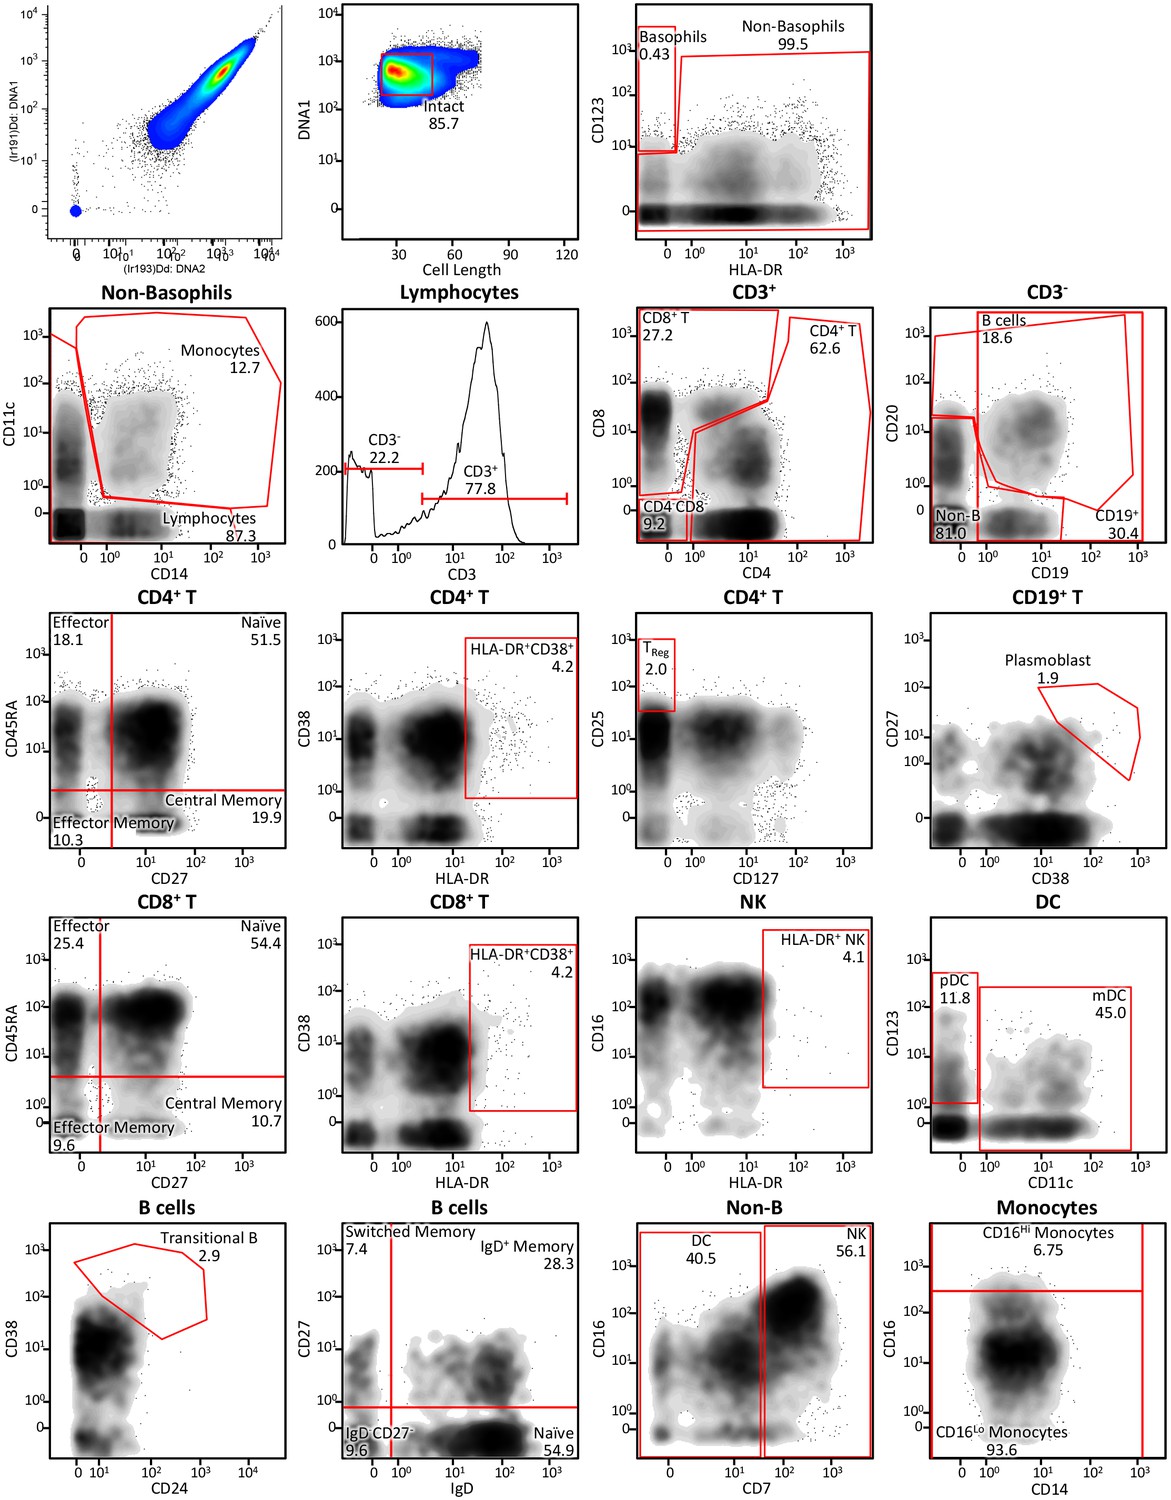
Immune cell profiling to identify signaling signatures activated by cytokines versus synthekines.
Gating scheme for the mass cytometry-mediated identification of the 29 distinct immune cell subsets within peripheral blood mononuclear cells (PBMCs) isolated from whole blood that were used to assess signal effector activation responses to cytokine versus synthekine treatment.
Figure 6 with 1 supplement
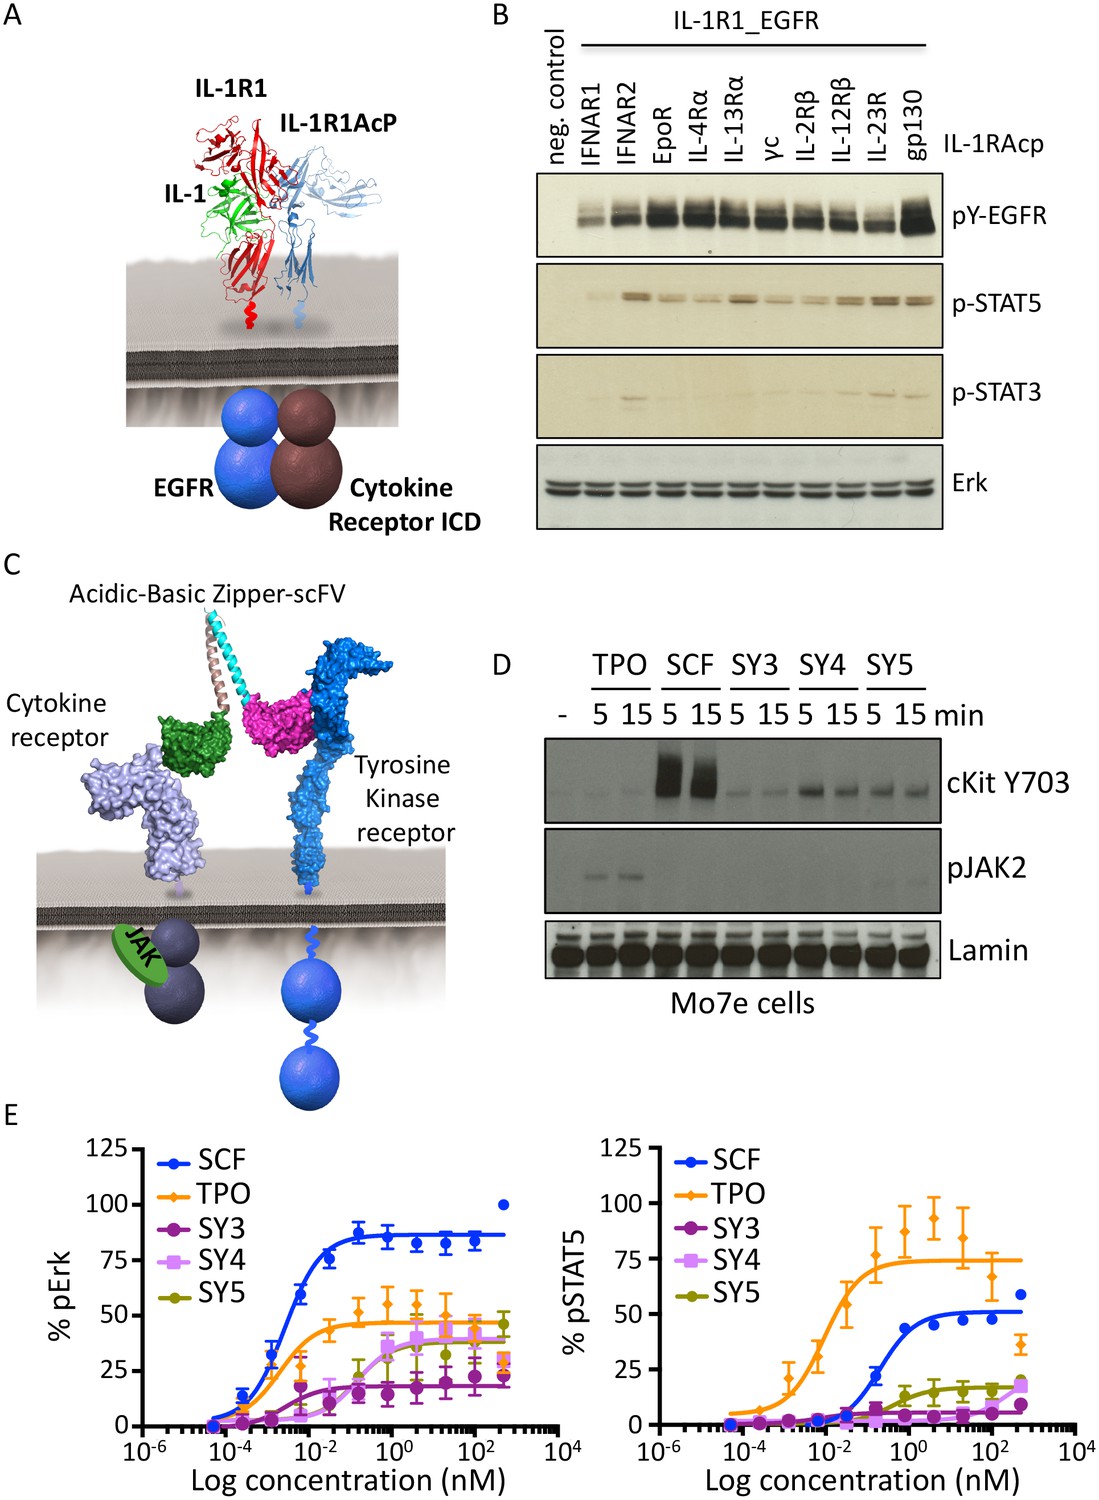
Synthekines dimerizing a cytokine receptor and a tyrosine kinase receptor activate signaling.
(A) Schematic representation of the IL-1-mediated complexation of IL1-R1-EGFR and IL-1R1AcP-cytokine receptor chimeras. (B) Phospho-EGFR (pY EGFR), pSTAT3 and pSTAT5 levels measured by western blot analysis in IL-1-activated Jurkat cells expressing the indicated chimeric receptor pairs. Total levels of Erk are presented as a loading control. The western blot presented is a representative example of two independent experiments. (C) Layout and complex formation by a synthekine dimerizing a cytokine receptor and a tyrosine kinase receptor. Two scFvs binding a cytokine receptor and a tyrosine kinase receptor respectively are genetically fused to acidic or basic leucine zippers, resulting in a new molecule able to form a heterodimeric receptor complex that does not exist in nature. (D) Phospho cKit Y703 and pJAK2 levels measured by western blot in Mo7E cells after stimulation with synthekines that dimerize TpoR and cKit (SY3, SY4 and SY5) for the indicated time periods. Total levels of Lamin are presented as a loading control. The western blot presented is a representative example of two independent experiments. (E) Erk (left panel) and STAT5 (right panel) phosphorylation activated by 10 min stimulation with the indicated doses of SCF, TPO, or the indicated synthekines in Mo7e cells, as measured by flow cytometry. Data (mean ± SD) are from three independent replicates.
Figure 6—figure supplement 1
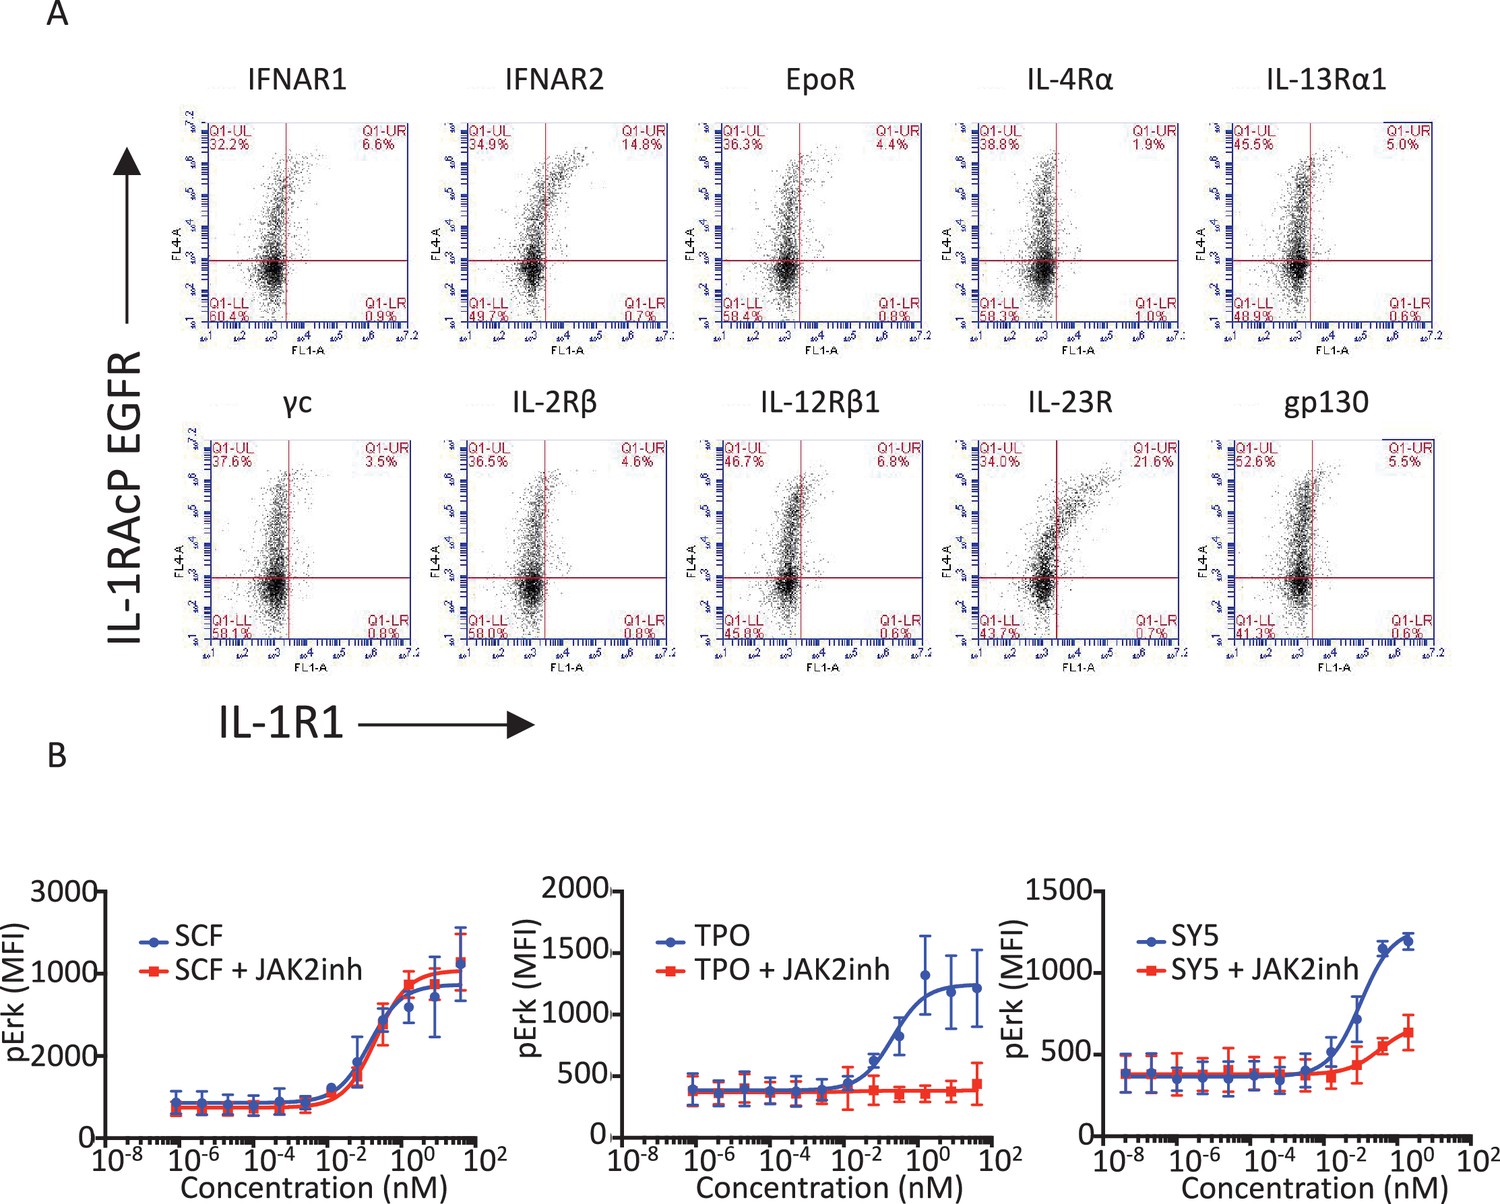
Functional characterization of tyrosine kinase receptor/cytokine receptor dimerizing synthekines.
(A) Flow cytometry plots representing the surface expression levels of the indicated chimeric receptors in Jurkat cells 24 hr post-transfection. (B) Erk activation response to 10 min stimulation with the indicated doses of SCF, TPO, and SY5 +/- JAK2 inhibitor in Mo7e cells, as measured by flow cytometry. Data (mean ± SD) are from three independent experiments.
Figure 7
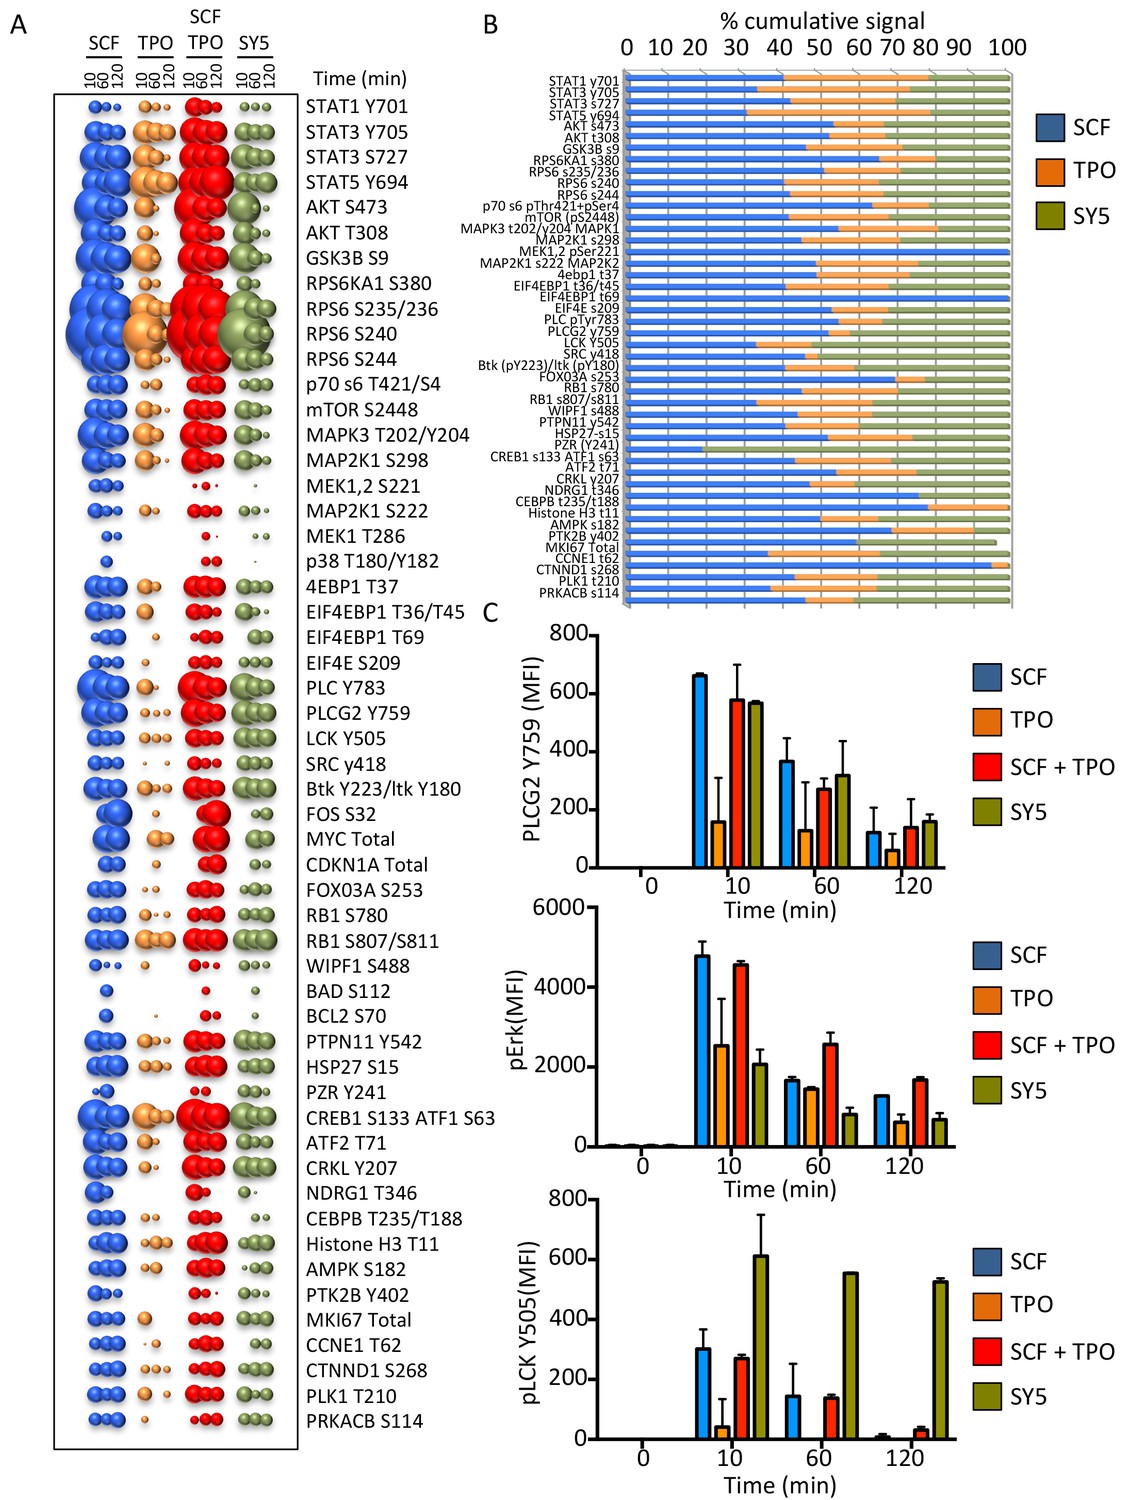
Synthekines dimerizing a cytokine receptor and a tyrosine kinase receptor activate different signaling programs than their natural ligands.
(A) Bubble plot representation of the signaling pathways activated by the indicated ligands after stimulation for 10, 60 and 120 min in Mo7e cells. The size of the bubble represents the intensity of the signal activated. (B) Stack column representation of the signaling molecules engaged by SCF, TPO and SY5 after 10 min stimulation in Mo7e cells. For each molecule, the combined activation of the three ligands was normalized to 100% and the relative contribution of each ligand was corrected accordingly. Some molecules were better activated by SCF, others were better activated by TPO, and yet others were better activated by SY5. Data presented in panel A and B represents the mean value of two independent experiments performed in triplicate. (C) pPLCG2, pErk, and pLCK levels induced by the indicated ligands in Mo7e cells after 10, 60 and 120 min stimulation. Data (mean ± SD) are from three independent replicates.
Author response image 1

CD14+ monocytes were isolated (>97% purity) from PBMCs obtained from healthy blood donors by density centrifugation and CD14 magnetic microbeads separation.
O.5-1 x 10⁶ CD14+ monocytes were cultured with GM-CSF alone or with the indicated cytokines and synthekines for seven days. Fresh ligands were added on days 2 and 4. On day 7 cells were processed and stained for the indicated dendritic cell surface markers.
Download links
A two-part list of links to download the article, or parts of the article, in various formats.
Downloads (link to download the article as PDF)
Open citations (links to open the citations from this article in various online reference manager services)
Cite this article (links to download the citations from this article in formats compatible with various reference manager tools)
Synthekines are surrogate cytokine and growth factor agonists that compel signaling through non-natural receptor dimers
eLife 6:e22882.
https://doi.org/10.7554/eLife.22882


