Probing protein flexibility reveals a mechanism for selective promiscuity
- University of Pittsburgh, United States
Figures
Figure 1
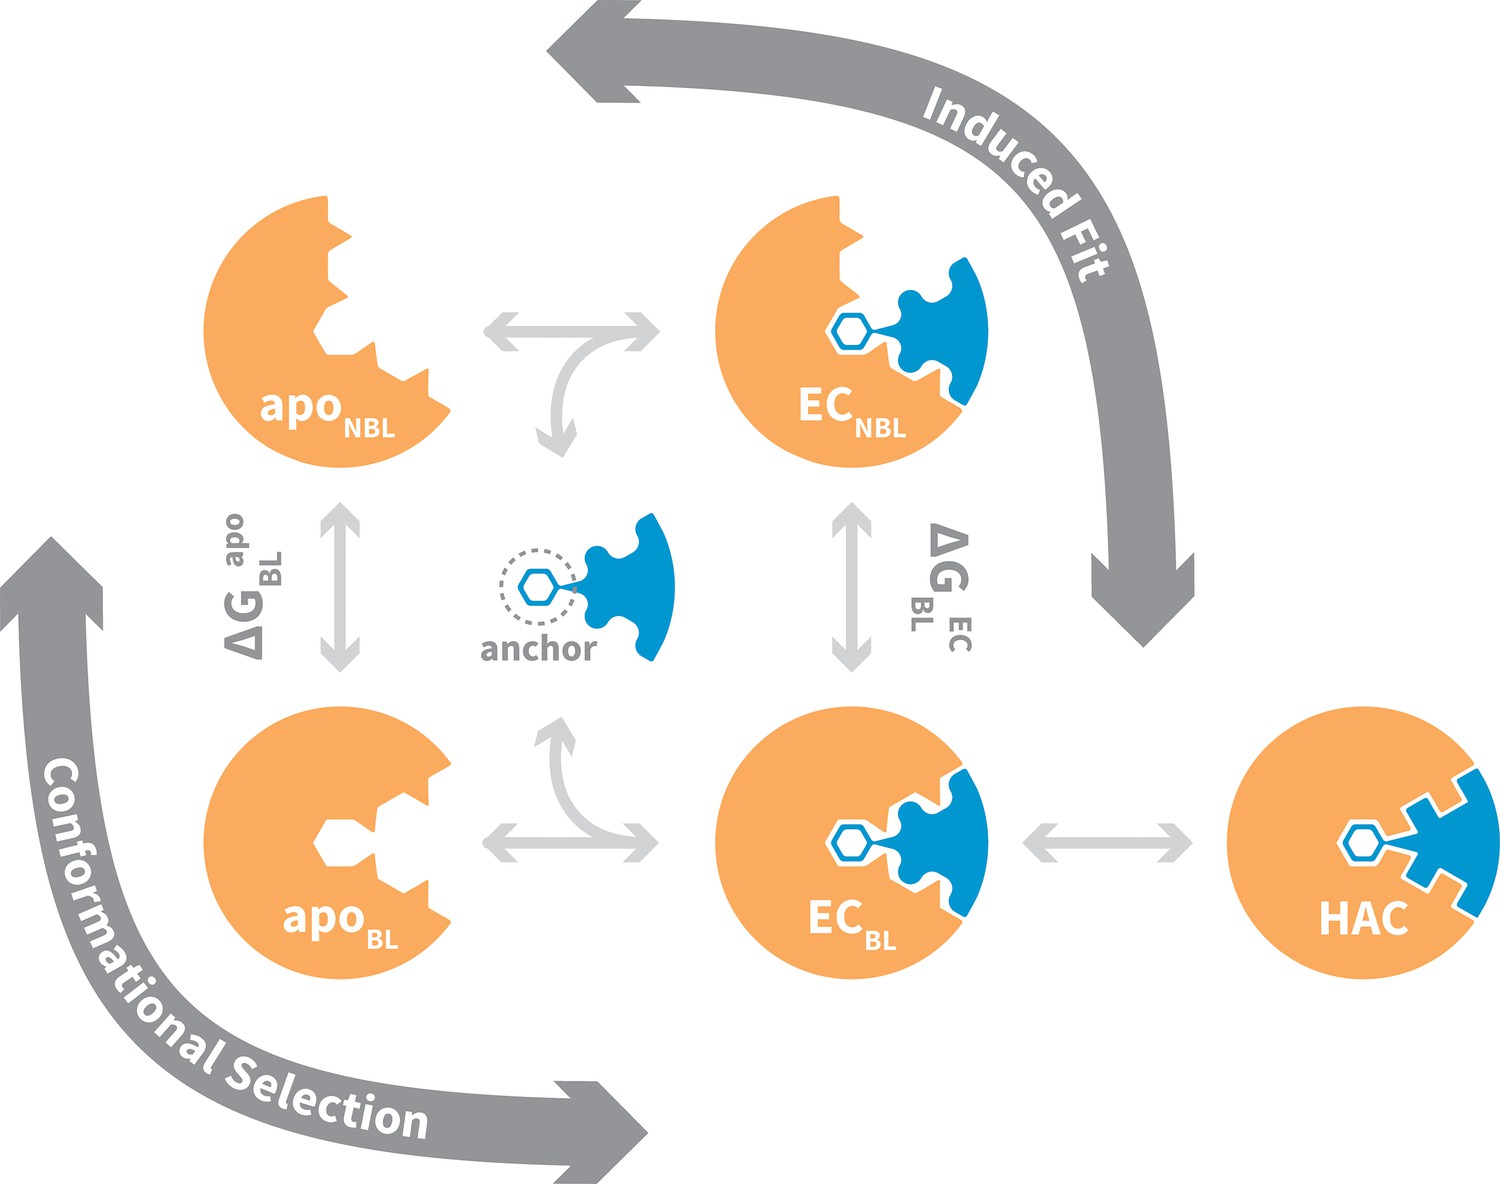
General mechanism for ligand binding to flexible receptor.
In the conformational selection pathway, the ligand docks to the bound-like (BL) form of the apo receptor (apoBL) to form the bound-like encounter complex (ECBL). In the induced fit pathway, the ligand docks to the non-bound-like (NBL) form of the apo receptor (apoNBL) to form the non-bound-like encounter complex (ECNBL). Intermolecular interactions then drive structural transitions to the ECBL. Both pathways end with a final induced fit step that optimizes interface side chains, transitioning to the high-affinity complex (HAC). The binding mechanism also highlights an anchor residue often found to be important in molecular recognition (Rajamani et al., 2004).
Figure 2 with 2 supplements
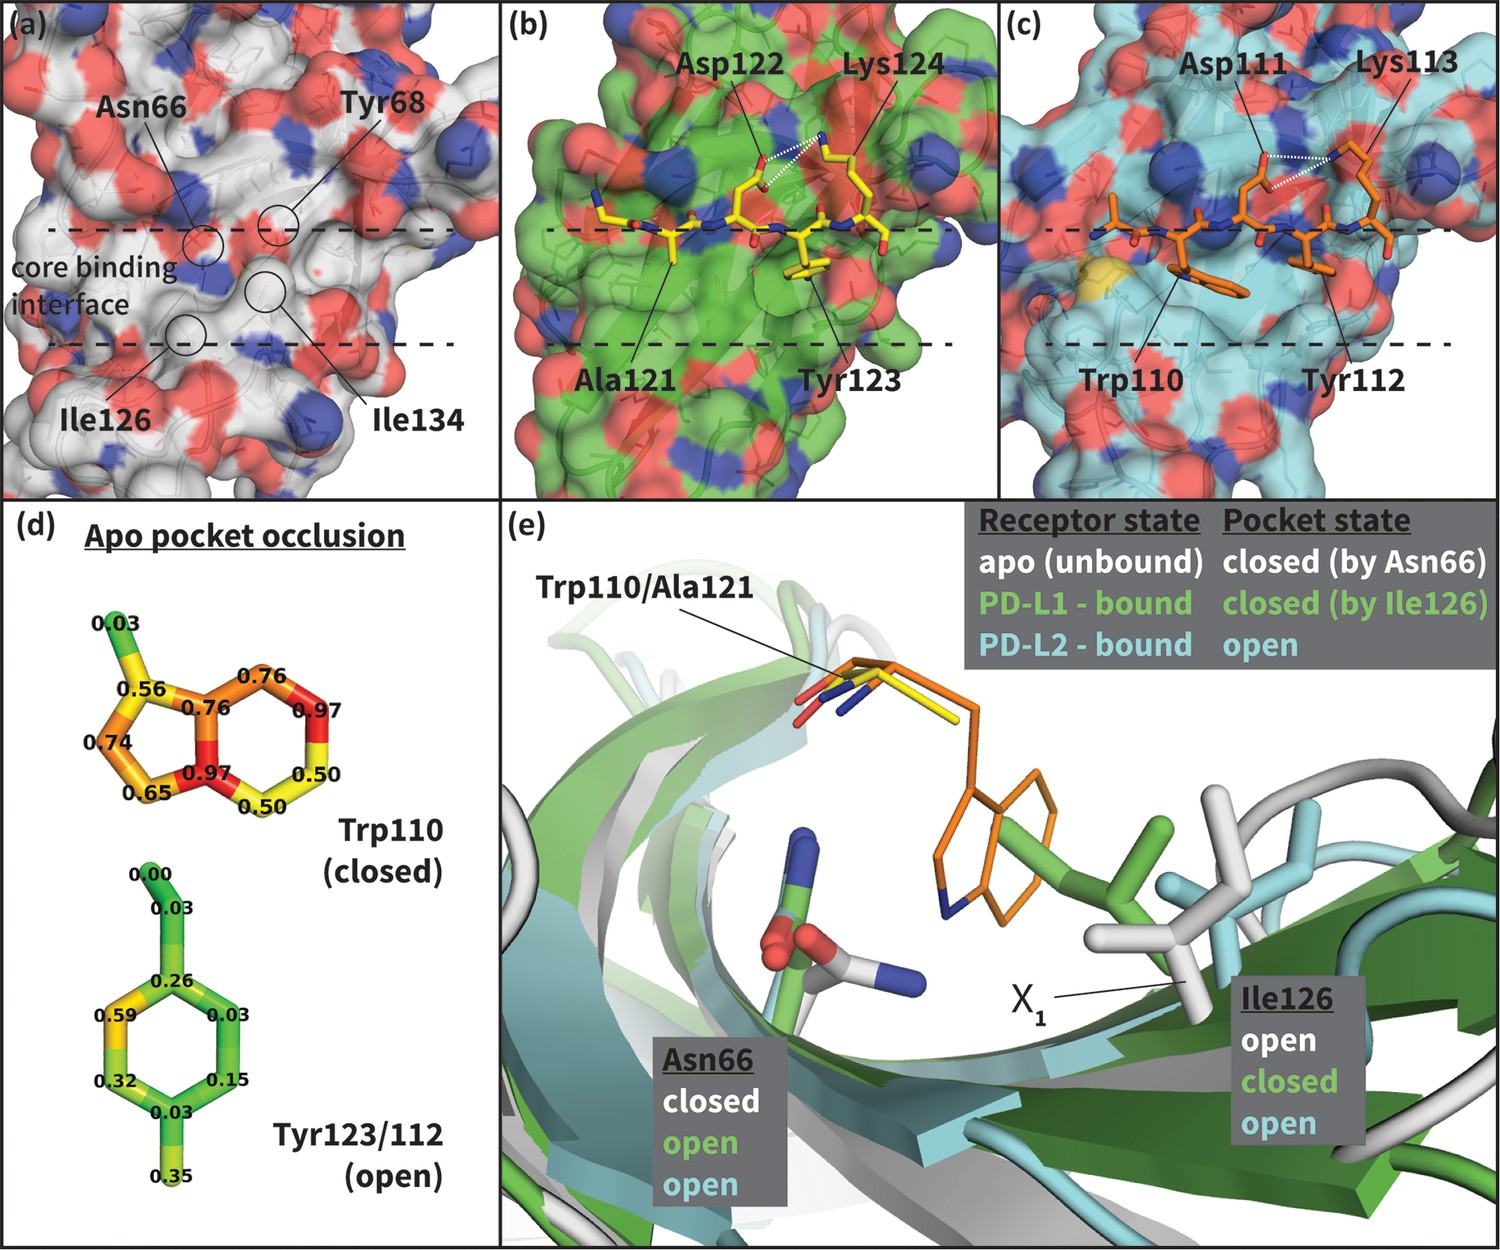
Flexibility of the PD-1 binding interface.
(a) The apo PD-1 binding interface (Cheng et al., 2013), showing a flat, polar, core binding interface. Surface residues that shape the core binding interface are labelled. (b) The core PD-1 (green) - PD-L1 (yellow) binding interface, showing a flat hydrophobic receptor surface (Zak et al., 2015). White dashed lines indicate hydrogen bonds between PD-L1 side chains. (c) The core PD-1 (cyan) – PD-L2 (orange) binding interface, showing a large hydrophobic receptor cavity (Lázár-Molnár et al., 2008). White dashed lines indicate hydrogen bonds between PD-L2 side chains. Note that the conserved anchor residue Tyr123/112 is present in both (b) and (c). (d) Fractional occlusion of each bound-like Trp110 and Tyr123/112 atom position in the NMR ensemble of apo PD-1. Numerical values at each atom position denote the fraction of NMR frames that overlap, or ‘occlude’, that position (see Materials and methods for full details of how fractional occlusion is calculated). Aside from the Cβ, the Trp110 pocket is mostly occluded in the apo PD-1 ensemble, whereas the Tyr123/112 anchor pocket is largely open. (e) Overlay of apo, PD-L1–bound, and PD-L2–bound structures of PD-1 defining the ‘open’ and ‘closed’ states of PD-1 residues Asn66 and Ile126 in relation to the open and closed states of the Trp110 binding pocket.
Figure 2—figure supplement 1

The cognate ligands of PD-1.
Cocrystal structures of the extracellular domain of PD-1 bound to the Ig-like V-type domains of its two cognate ligands: (a) PD-L1 (Zak et al., 2015), and (b) PD-L2 (Lázár-Molnár et al., 2008). Dashed lines indicate hydrogen bonds between the PD-L1/2 anchor and PD-1 residue Glu136.
Figure 2—figure supplement 2
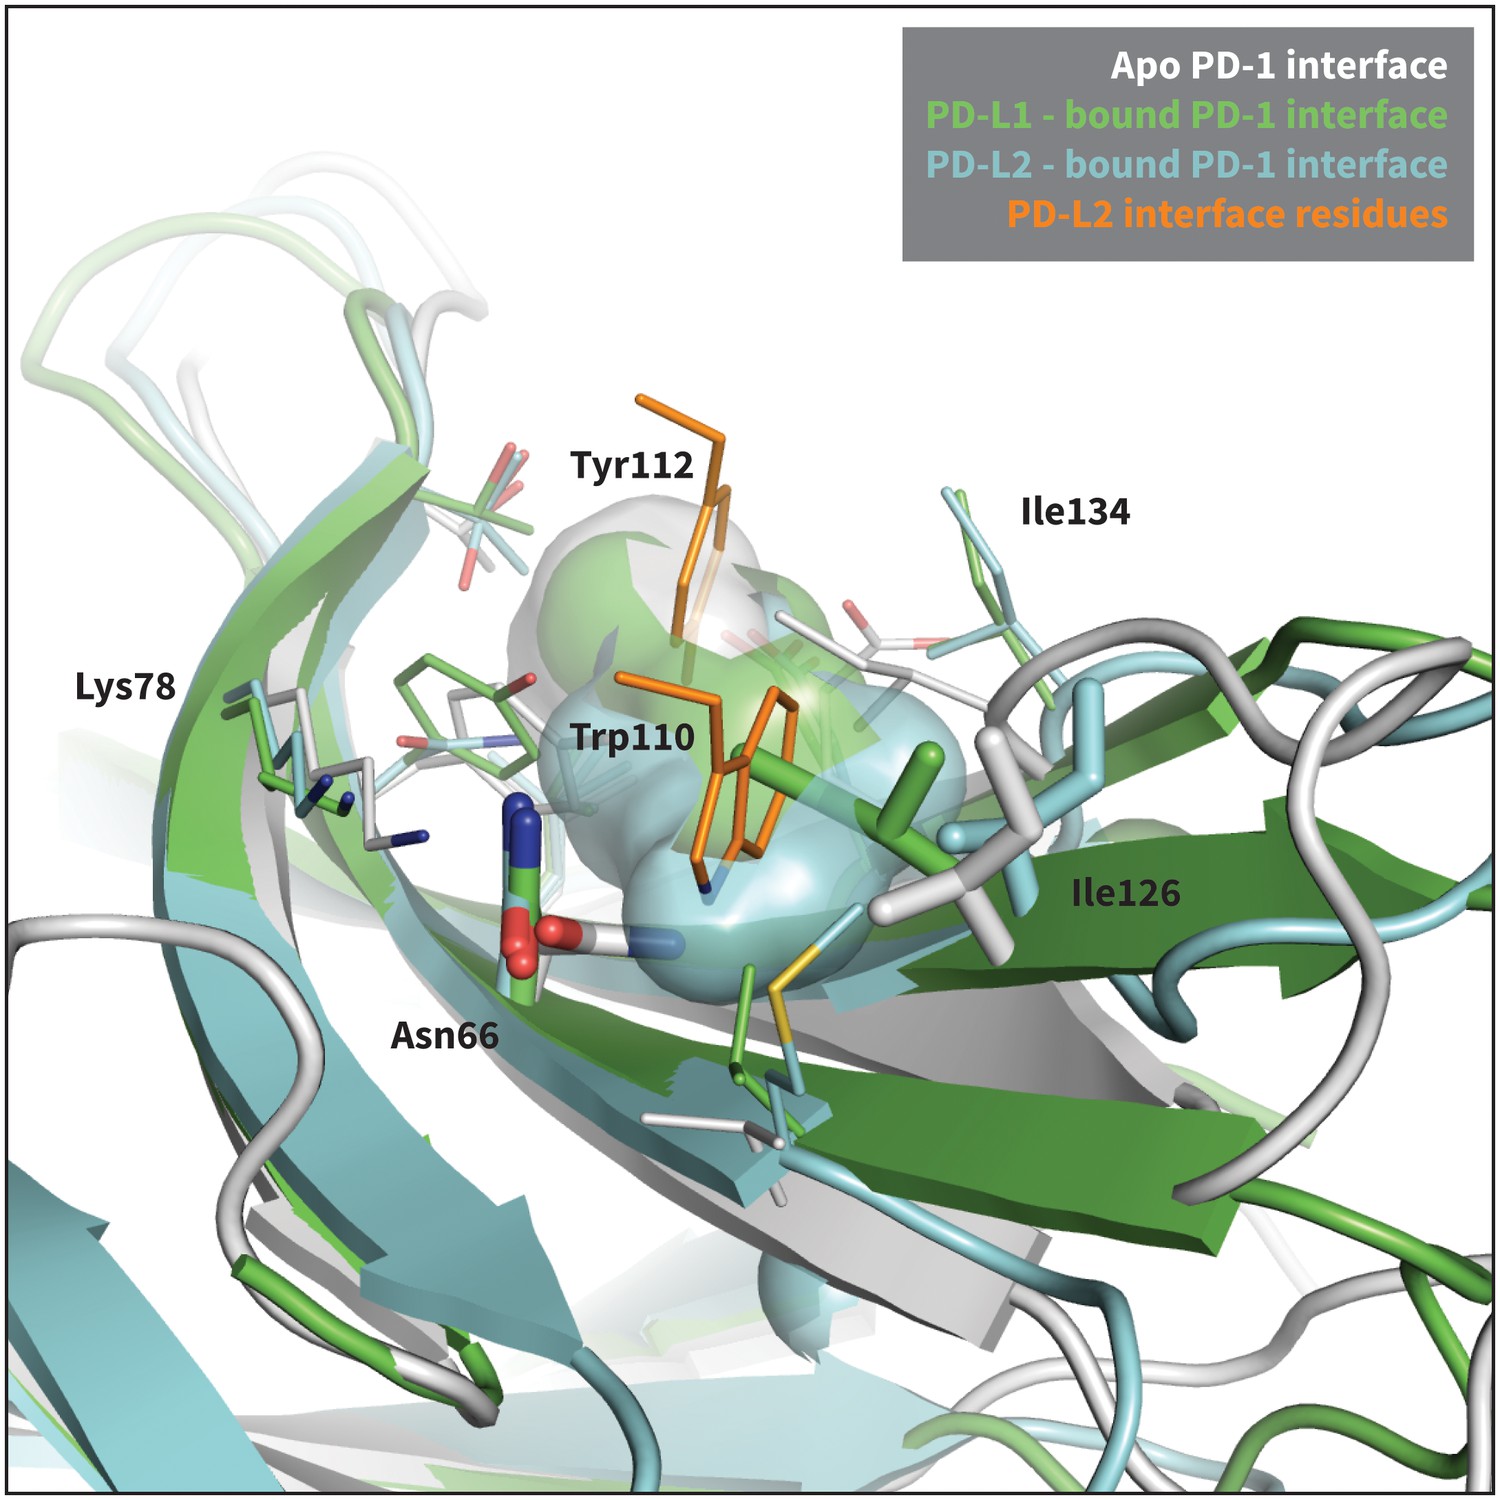
Modulation of PD-1’s flexible interface cavity.
Aligned structures of the apo (white) (Cheng et al., 2013), PD-L1–bound (green) (Zak et al., 2015), and PD-L2–bound (cyan) (Lázár-Molnár et al., 2008) PD-1 interfaces. Key PD-1 interface residues that line the cavity are shown as small sticks and labelled, with Asn66 and Ile126 shown as large sticks as in Figure 2c. The interface cavity volume of each structure is indicated by the transparent surface of matching color. PD-L2 interface residues Trp110 and the conserved Tyr112 anchor are shown as small orange sticks, for reference. The anchor pocket is unstructured in all three receptor states, but only the PD-L2 bound state accommodates Trp110.
Figure 3
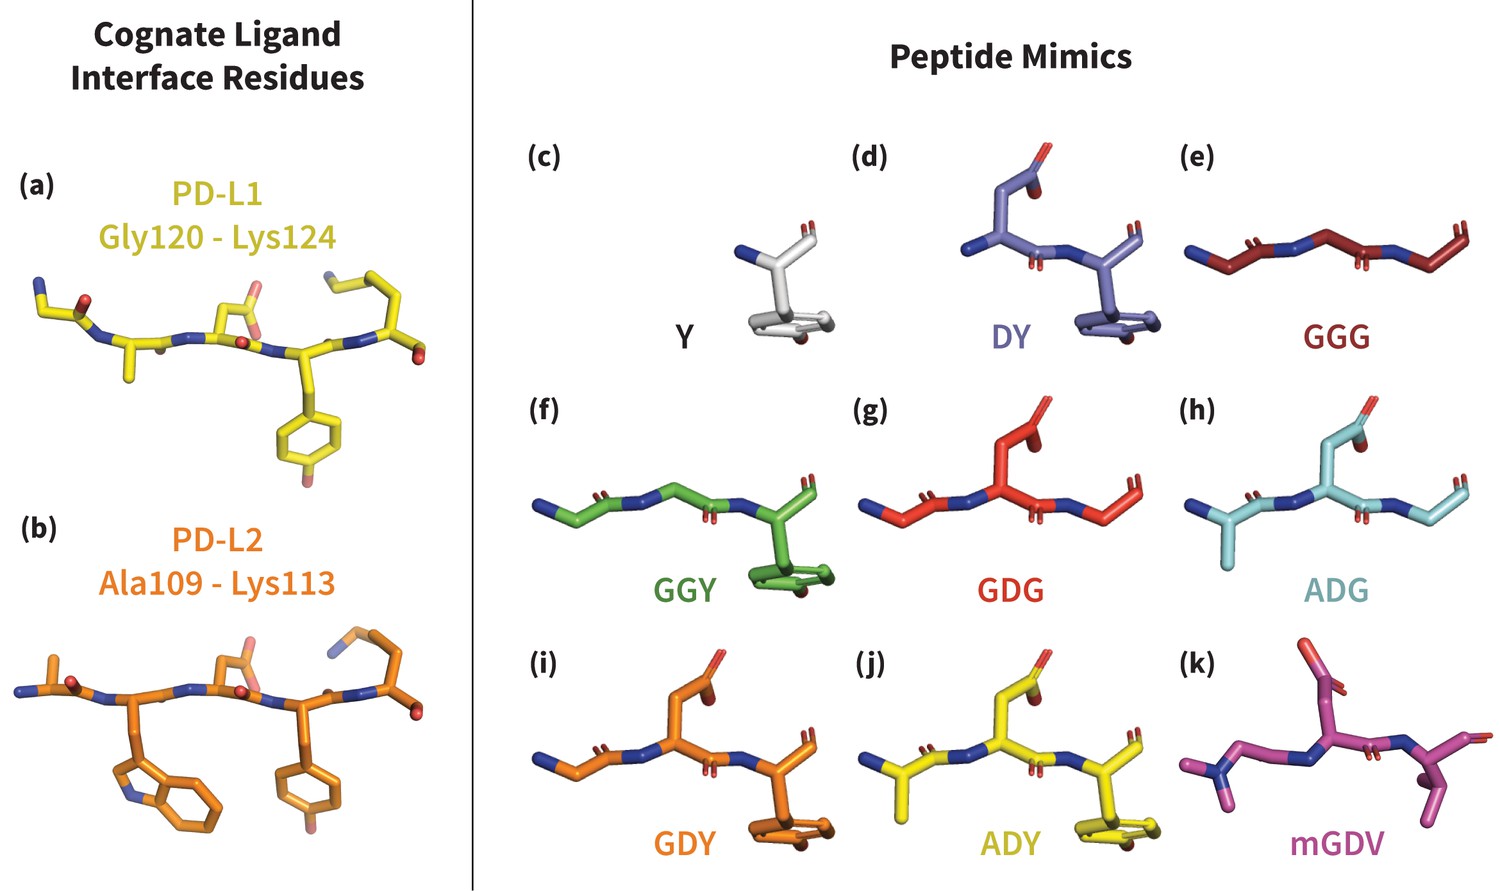
Structures of PD-L1/2 – mimicking peptides used to probe PD-1 interface dynamics.
Left: core interface binding residues of (a) PD-L1 and (b) PD-L2 in their bound-like conformations. Right: peptides that were simulated in the presence of apo PD-1 in order to identify the triggers of induced fit interface deformations: (c) Y, (d) DY, (e) GGG, (f) GGY, (g) GDG, (h) ADG, (i) GDY, (j) ADY, and (k) mGDV.
Figure 4 with 3 supplements
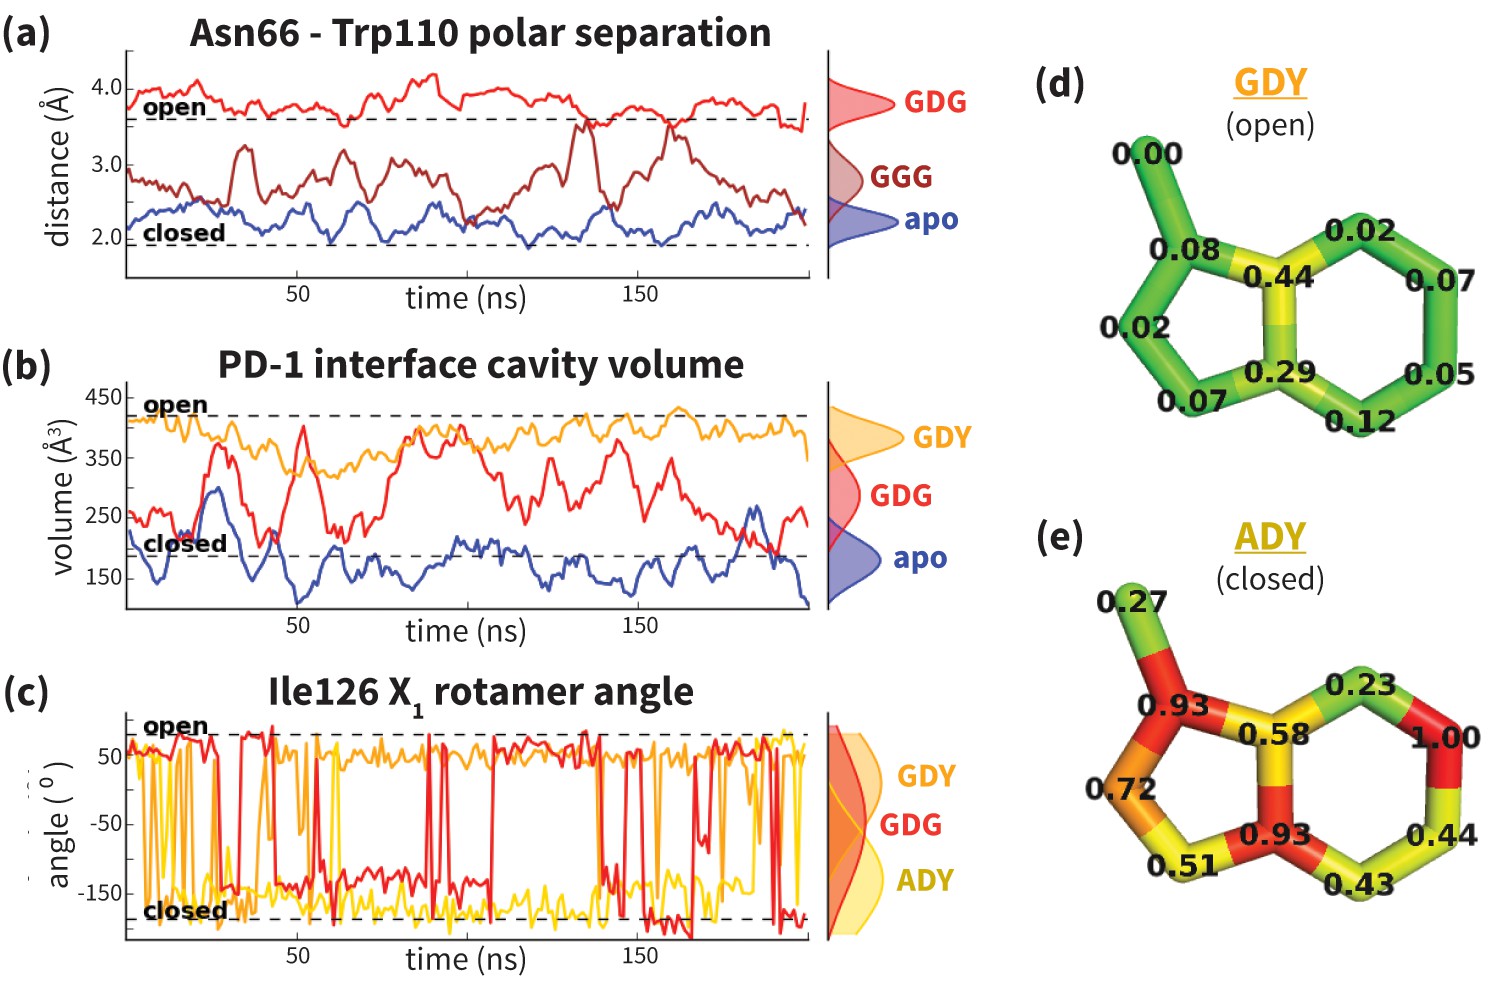
Dynamics of PD-1 binding interface in the presence of different ligands.
(a) Rolling averages of distance between Trp110_NE1 (from bound PD-L2) and Asn66_ND2 from MDs of apo PD-1 (blue) alone and interacting with GGG (maroon) and GDG (red) peptides. Only GDG peptide sequesters Asn66 away from Trp110 binding pocket. (b) Rolling averages of PD-1 binding cavity volume from simulations of apo PD-1 alone (blue) and interacting with GDG (red) and GDY (orange) peptides shows that only GDY stabilizes an open cavity. (c) Ile126 X1 rotamer angle from MDs of apo PD-1 interacting with GDG (red), GDY (orange), and ADY (yellow) peptides. Peptide ADY and GDY position Ile126 in the closed and open states, respectively (as in Figure 2e). Replicate trajectories for panels a, b, and c are shown in Figure 4—figure supplement 2. (d) Fractional occlusion of each bound-like Trp110 atom position in simulations of PD-1 interacting with the GDY peptide show an open Trp110-binding pocket. The fractional occlusion of a Trp110 atom position is defined as the percentage of simulation frames in which a PD-1 atom overlaps, or ‘occludes’, that position (see Materials and methods for full details of how fractional occlusion is calculated). (e) Fractional occlusion of each bound-like Trp110 atom position in simulations of PD-1 interacting with the ADY peptide show a closed Trp110-binding pocket.
-
Figure 4—source data 1
Excel workbook containing all the simulation trajectory data plotted in Figure 4, Figure 4—figure supplement 2, and Figure 4—figure supplement 3.
The first three sheets of the workbook, titled ‘Asn66 position,’ ‘cavity volume,’ and ‘Ile126 dihedral’ contain the time-series data plotted in Figure 4a,b and c, respectively. They also contain the data for the replicate simulations shown in Figure 4—figure supplement 2. The columns labeled with a ‘1’ (apo1, GDY1, etc…) correspond to the data from the first replicate simulation, i.e. the data shown directly in Figure 4. Columns labeled with ‘2’ and ‘3’ correspond to data plotted in Figure 4—figure supplement 2. The final sheet of the workbook is titled ‘alternate anchors,’ and contains the time series data plotted in Figure 4—figure supplement 3.
- https://doi.org/10.7554/eLife.22889.009
Figure 4—figure supplement 1
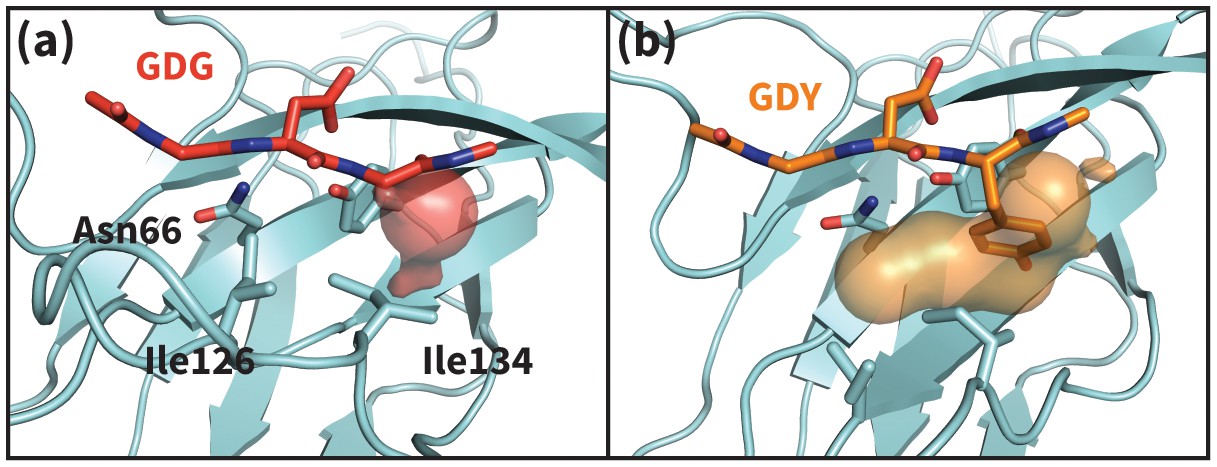
Apo PD-1 interactions with GDY peptide opens a hydrophobic cavity.
Panels (a) and (b) illustrate the PD-1 interface cavity volume which is plotted in Figure 4b. (a) Snapshot from simulation of human PD-1 interacting with the GDG peptide. The PD-1 interface cavity volume is shown in red surface. Although Asn66 is in the open state, the cavity is closed by the closed state of I126. (b) Snapshot from simulation of human PD-1 interacting with the GDY peptide. The PD-1 interface cavity volume is shown in orange surface. The Y anchor side chain positions Ile134 to pull Ile126 out of the pocket via hydrophobic interaction, leaving a large open cavity.
Figure 4—figure supplement 2
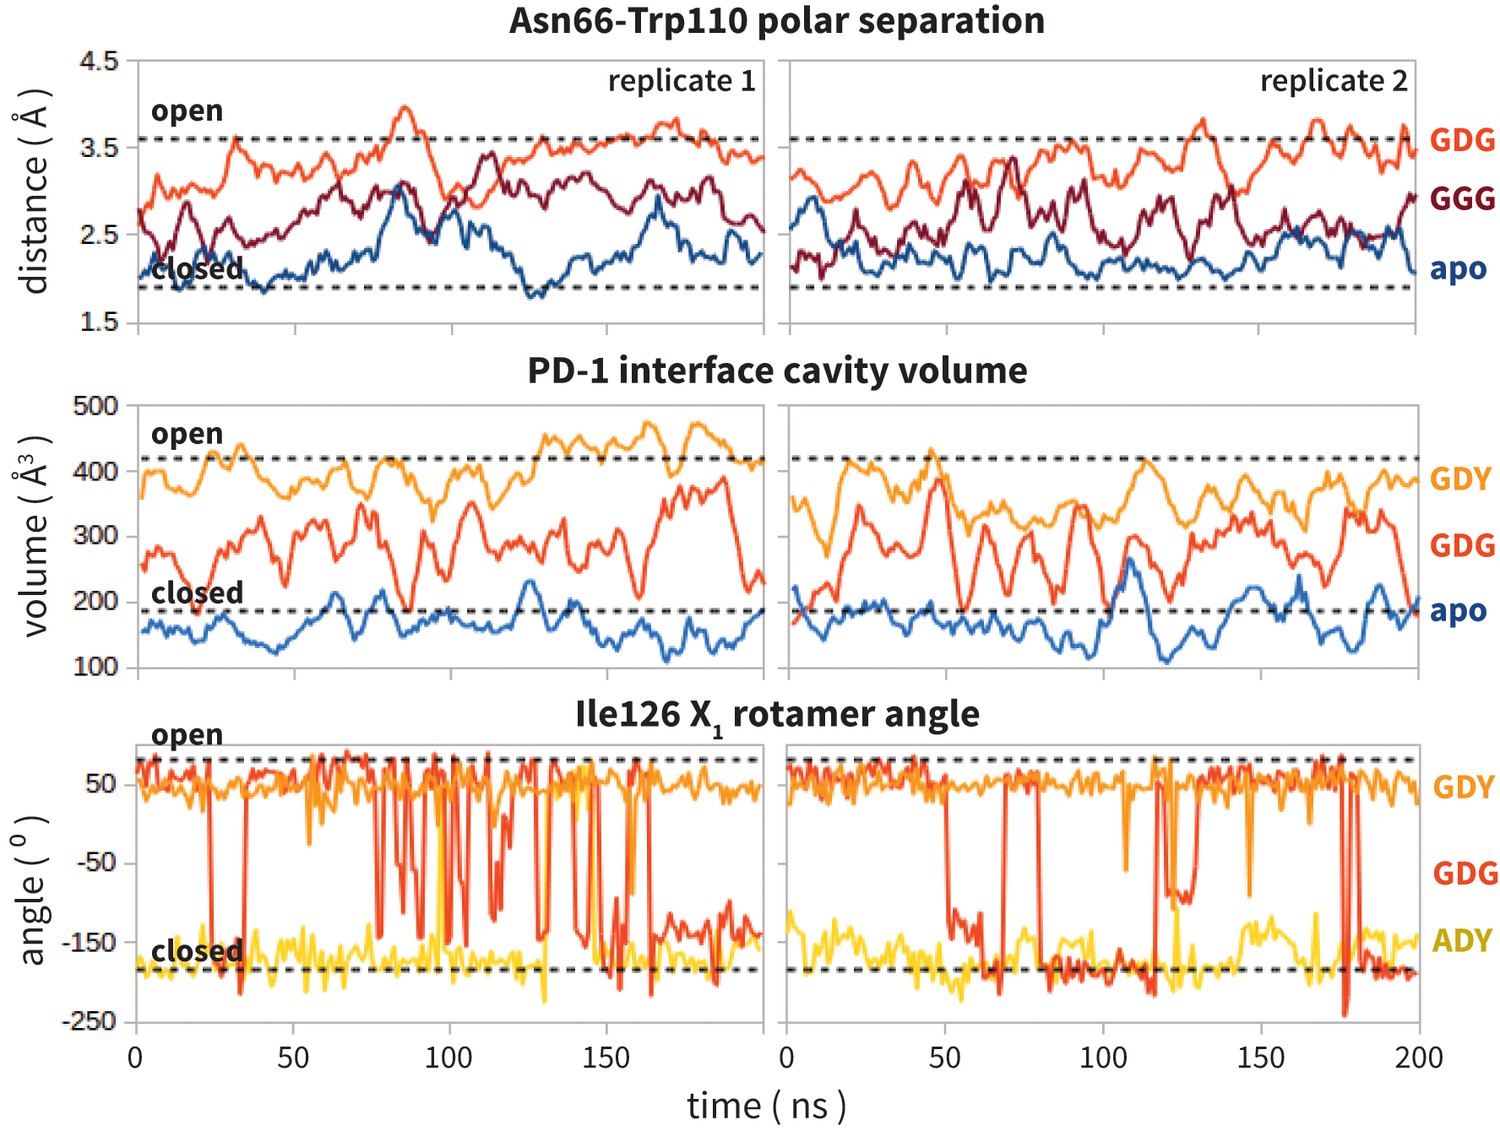
Replicate trajectories from Figure 4a,b,c.
Top: Rolling averages of distance between Trp110_NE1 (from bound PD-L2) and Asn66_ND2 from MDS of apo PD-1 (blue) alone and interacting with GGG (maroon) and GDG (red) peptides. Middle: Rolling averages of PD-1 binding cavity volume from simulations of apo PD-1 alone (blue) and interacting with GDG (red) and GDY (orange) peptides. Bottom: (f) Ile126 X1 rotamer angle from MDS of apo PD-1 interacting with GDG(red), GDY (orange), and ADY (yellow) peptides.
Figure 4—figure supplement 3

Dynamics of PD-1 binding cavity in the presence of different anchor substitutes.
Ile126 X1 rotamer angle from MDs of apo PD-1 interacting with GDF (orange), GDK (grey), and GDH (blue) peptides. GDF produces a mostly open interface cavity, while GDK and GDH stabilize the closed surface.
Figure 5
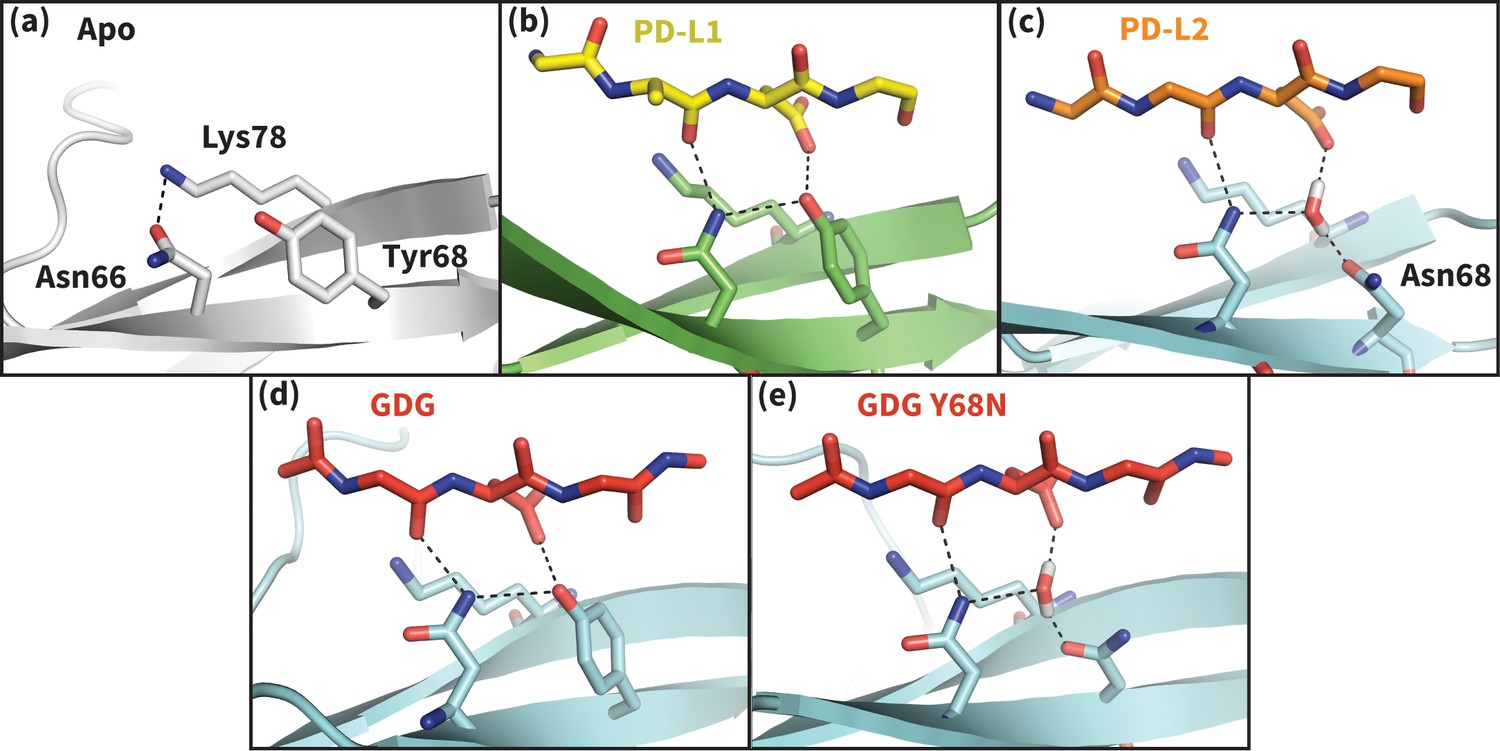
Hydrogen bond network of PD-1 Asn66 in different contexts.
(a) NMR structure of the dominant apo, non-bound-like state of the human PD-1 interface (Cheng et al., 2013). Asn66 is in the closed state, forming a single hydrogen bond with Lys78. (b) Cocrystal structure of the human PD-1 – PD-L1 complex (Zak et al., 2015). PD-1 bound-like interface shows Asn66 in the open state, forming two hydrogen bonds with the ligand Ala121 backbone and the neighboring Tyr68. For clarity, only relevant ligand atoms are shown. (c) Cocrystal structure of the murine PD-1–PD-L2 complex (Lázár-Molnár et al., 2008). PD-1 bound-like interface shows Asn66 is in the open state, forming two hydrogen bonds with the ligand Trp110 backbone and a crystal water stabilized by neighboring residue Asn68. (d) Simulation snapshot of human PD-1 interacting with the GDG peptide, showing the same hydrogen bond network as in (b). (e) Simulation snapshot of human PD-1 Y68N mutant interacting with the GDG peptide, showing the same water-mediated hydrogen bond network as in (c).
Figure 6
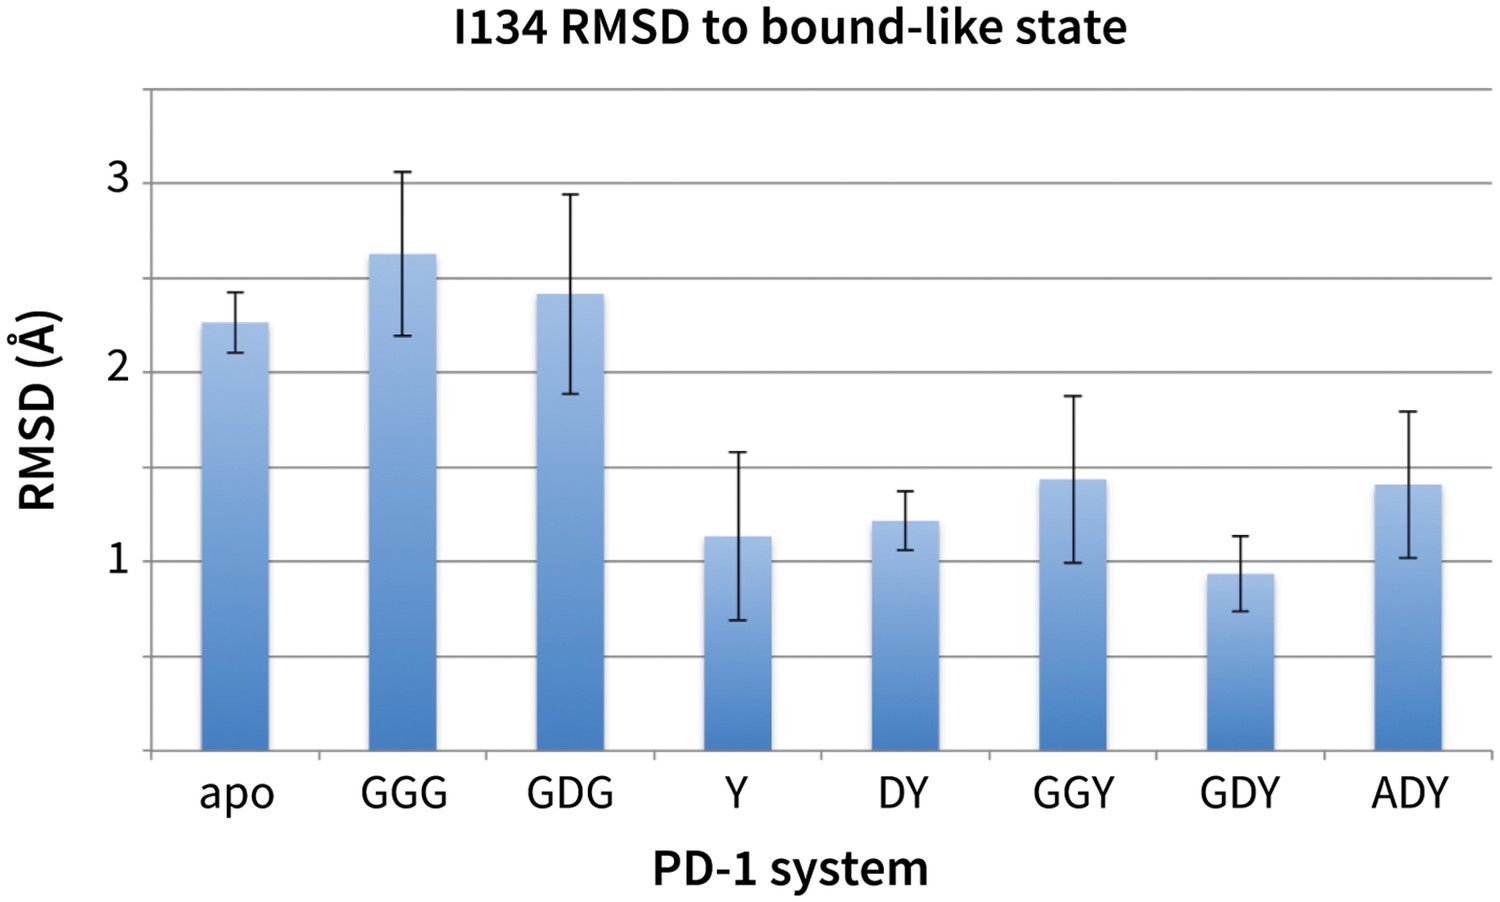
Stabilization of bound-like Ile134 by conserved tyrosine (Y) anchor.
Average and standard deviation heavy atom RMSD of PD-1 Ile134 to the PD-L1/2 bound-like state (measured from human PD-1 – PD-L1 cocrystal, 4ZQK; Ile134 has <0.2 Å heavy atom RMSD between 4ZQK and the PD-L2 cocrystal 3BP5). Data are shown for three 200ns replicate simulations for each system, including apo human PD-1 and PD-1 interacting with various peptides.
-
Figure 6—source data 1
Excel workbook with a single sheet containing the numerical RMSD data shown in the Figure 6 bar chart.
- https://doi.org/10.7554/eLife.22889.016
Figure 7
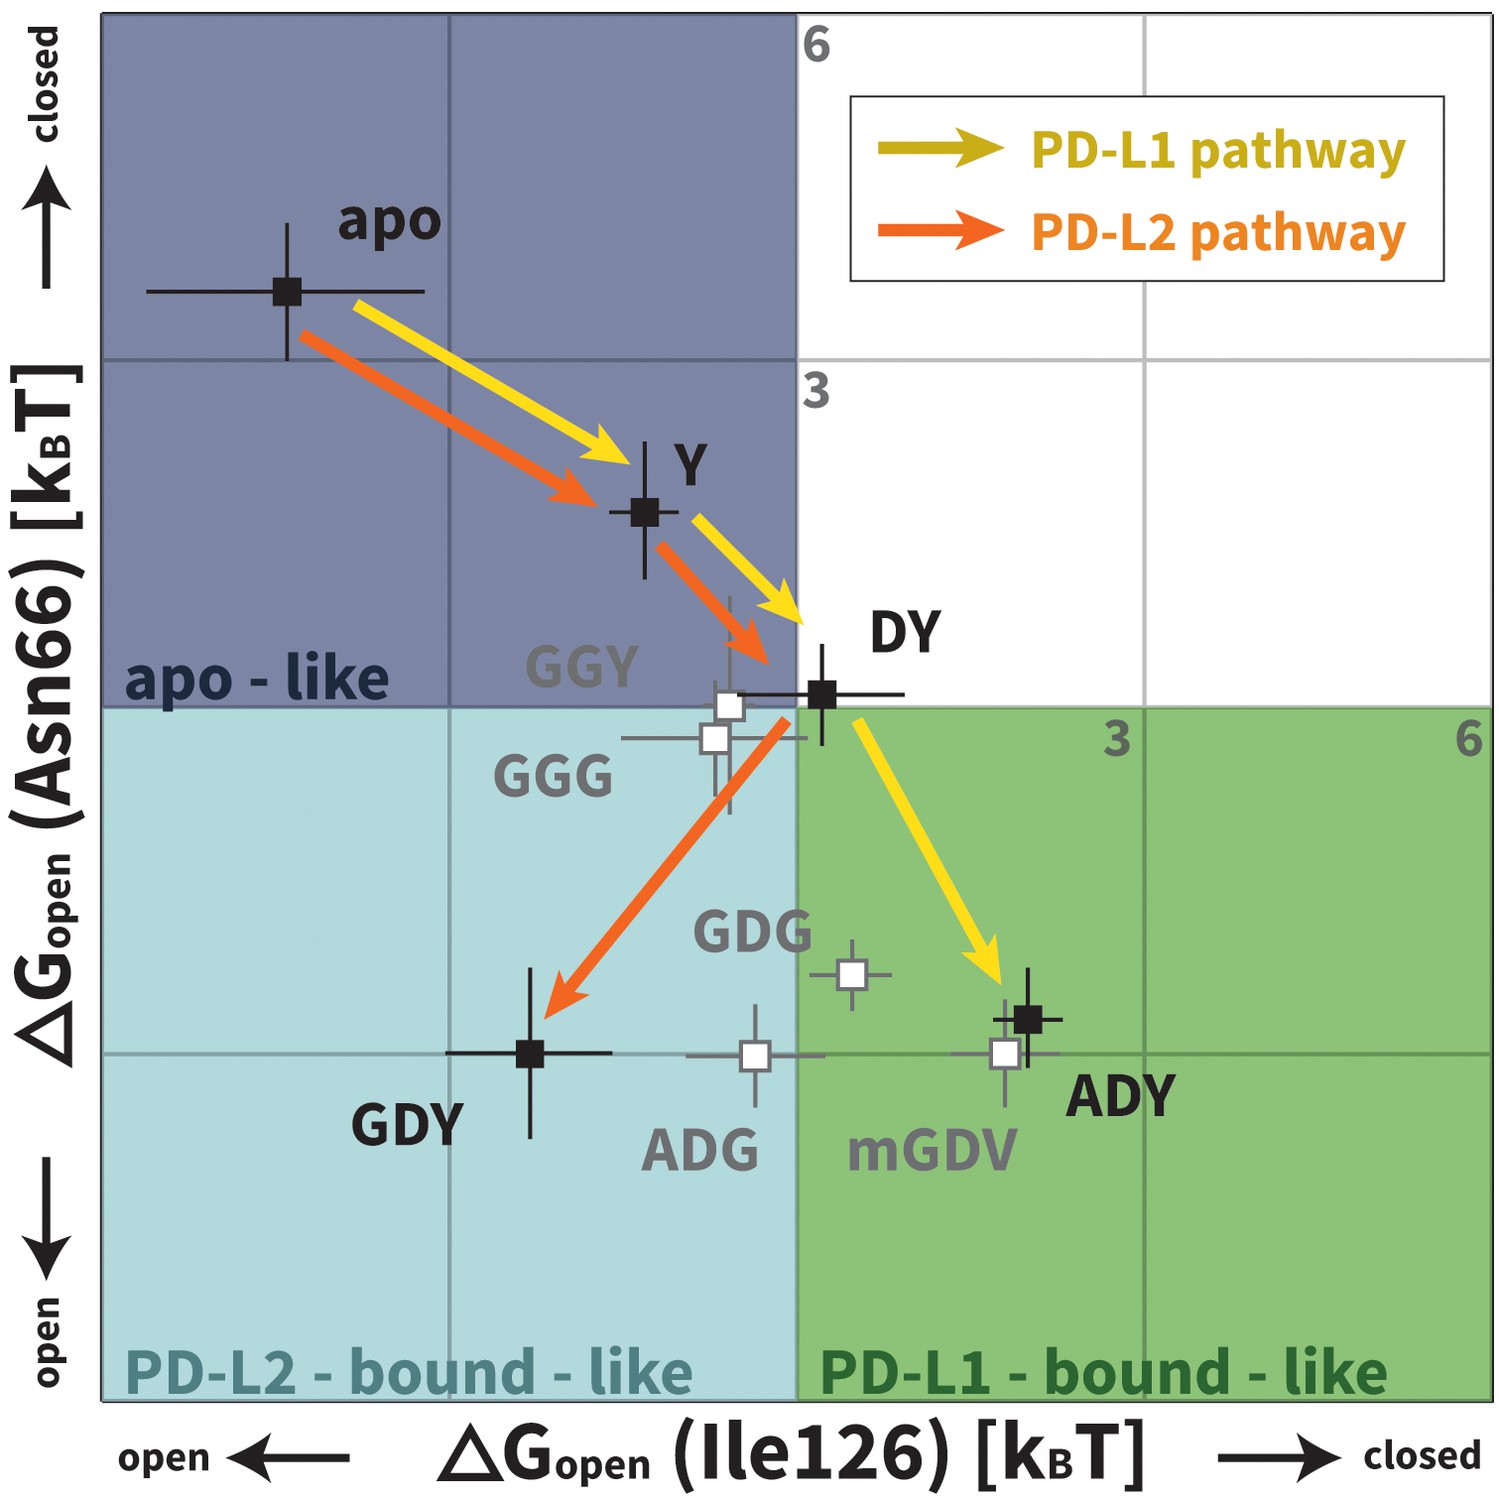
Downhill binding pathways of PD-1 triggers of induced fit for each cognate ligand.
Points on the plot represent average and standard deviation equilibrium free energy differences (from three replicate simulations) between the open and closed states of receptor residues Asn66 and Ile126 for apo PD-1 and PD-1 interacting with nine distinct ligand-mimicking peptides. The corresponding numerical values can be found in Table 2. Yellow and orange lines represent the ligand-specific induced fit binding pathways from the apo receptor ensemble to the PD-L1 and PD-L2 bound-like ensembles, respectively.
-
Figure 7—source data 1
Excel workbook with a single sheet containing the numerical data plotted in Figure 7.
- https://doi.org/10.7554/eLife.22889.018
Figure 8

Modulation of the PD-1 interface binding cavity in encounter complex simulations with PD-L1 and PD-L2.
Plot shoes the (rolling average) number of atoms in the bound-like Trp110 side chain reference that are occluded by the PD-1 interface throughout encounter complex simulations with PD-L1/2 (see Materials and methods for full details of how occlusion is calculated). Both encounter complexes begin with a closed Trp110 pocket, as this is the dominant state of apo PD-1. The PD-L2 trigger then stabilizes the hydrophobic cavity (no overlap), while the PD-L1 trigger stabilizes the hydrophobic patch (significant overlap).
-
Figure 8—source data 1
Excel workbook with a single sheet containing the time-series Trp110 atom overlap data from the encounter complex simulations plotted in Figure 8.
- https://doi.org/10.7554/eLife.22889.021
Figure 9
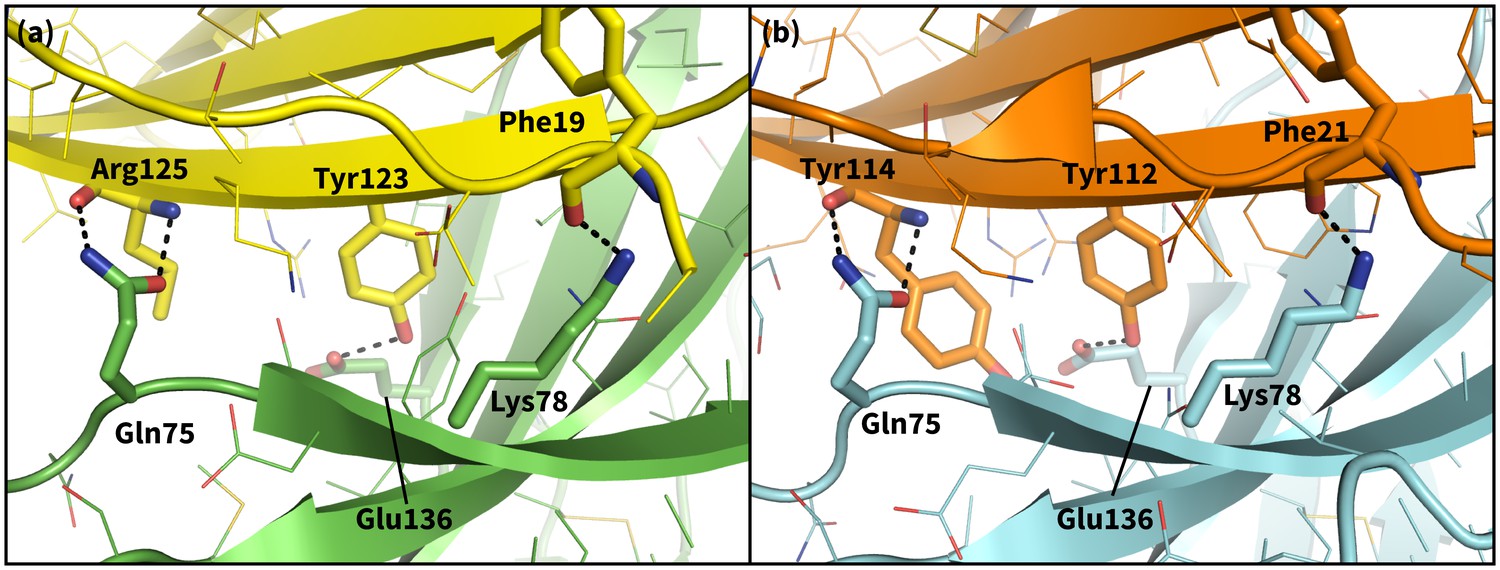
Secondary, non-triggering contacts in PD-1 encounter complexes.
Specific hydrogen bonds observed in the PD-1 – PD-L1 (a) (Zak et al., 2015) and PD-1 – PD-L2 (b) (Lázár-Molnár et al., 2008) cocrystal structures. In simulation, these contacts form approximately 10 ns after triggering interactions and their resulting induced fit deformations of the receptor (Table 3). Note also that the conserved Tyr123/112 anchor forms identical hydrogen bonds with Glu136 in the PD-L1– and PD-L2–bound states.
Figure 10 with 2 supplements
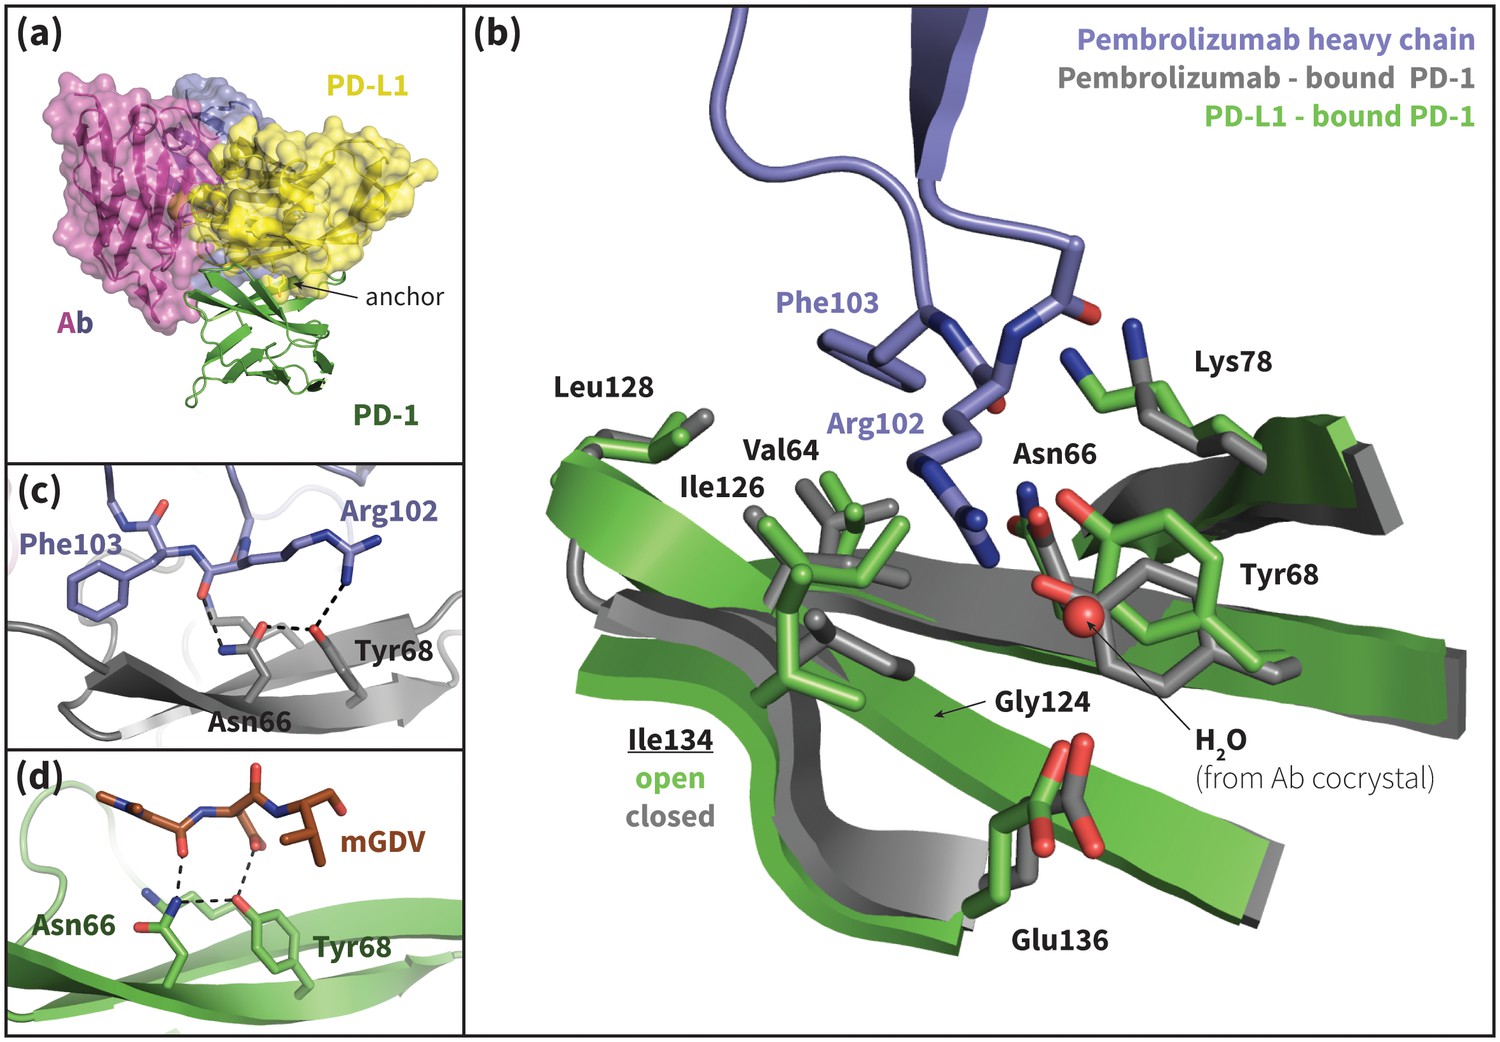
Pembrolizumab–bound PD-1 interface resembles PD-L1–bound interface with a closed Ile134.
(a) Alignment of crystal structures of the pembrolizumab antibody (Ab) (Horita et al., 2016) and PD-L1 (Zak et al., 2015) binding modes, showing distinct but partially overlapping binding interfaces on PD-1. The light chain of the Ab is shown in magenta and the heavy chain is shown in purple. (b) Detailed comparison of the aligned Ab–bound (grey) and PD-L1–bound (green) PD-1 interfaces. Most receptor interface residues exhibit near-identical conformations, except Ile134 which is open when bound to PD-L1 but closed when bound to pembrolizumab. Heavy chain Ab interface residues are shown in purple. (c) Detail of the Ab–PD-1 interface, highlighting the hydrogen bond (hydrogen bond) network that stabilizes the open state of Asn66. This hydrogen bond network is functionally analogous to those observed in the PD-L1 and PD-L2–bound cocrystals (Figure 5), although the OD1 and ND2 atoms of Asn66 are flipped. (d) Simulation snapshot of human PD-1 interacting with the mGDV motif from Bristol-Myers Squibb macrocyclic PD-1 inhibitor, highlighting the canonical hydrogen bond network that opens Asn66.
Figure 10—figure supplement 1
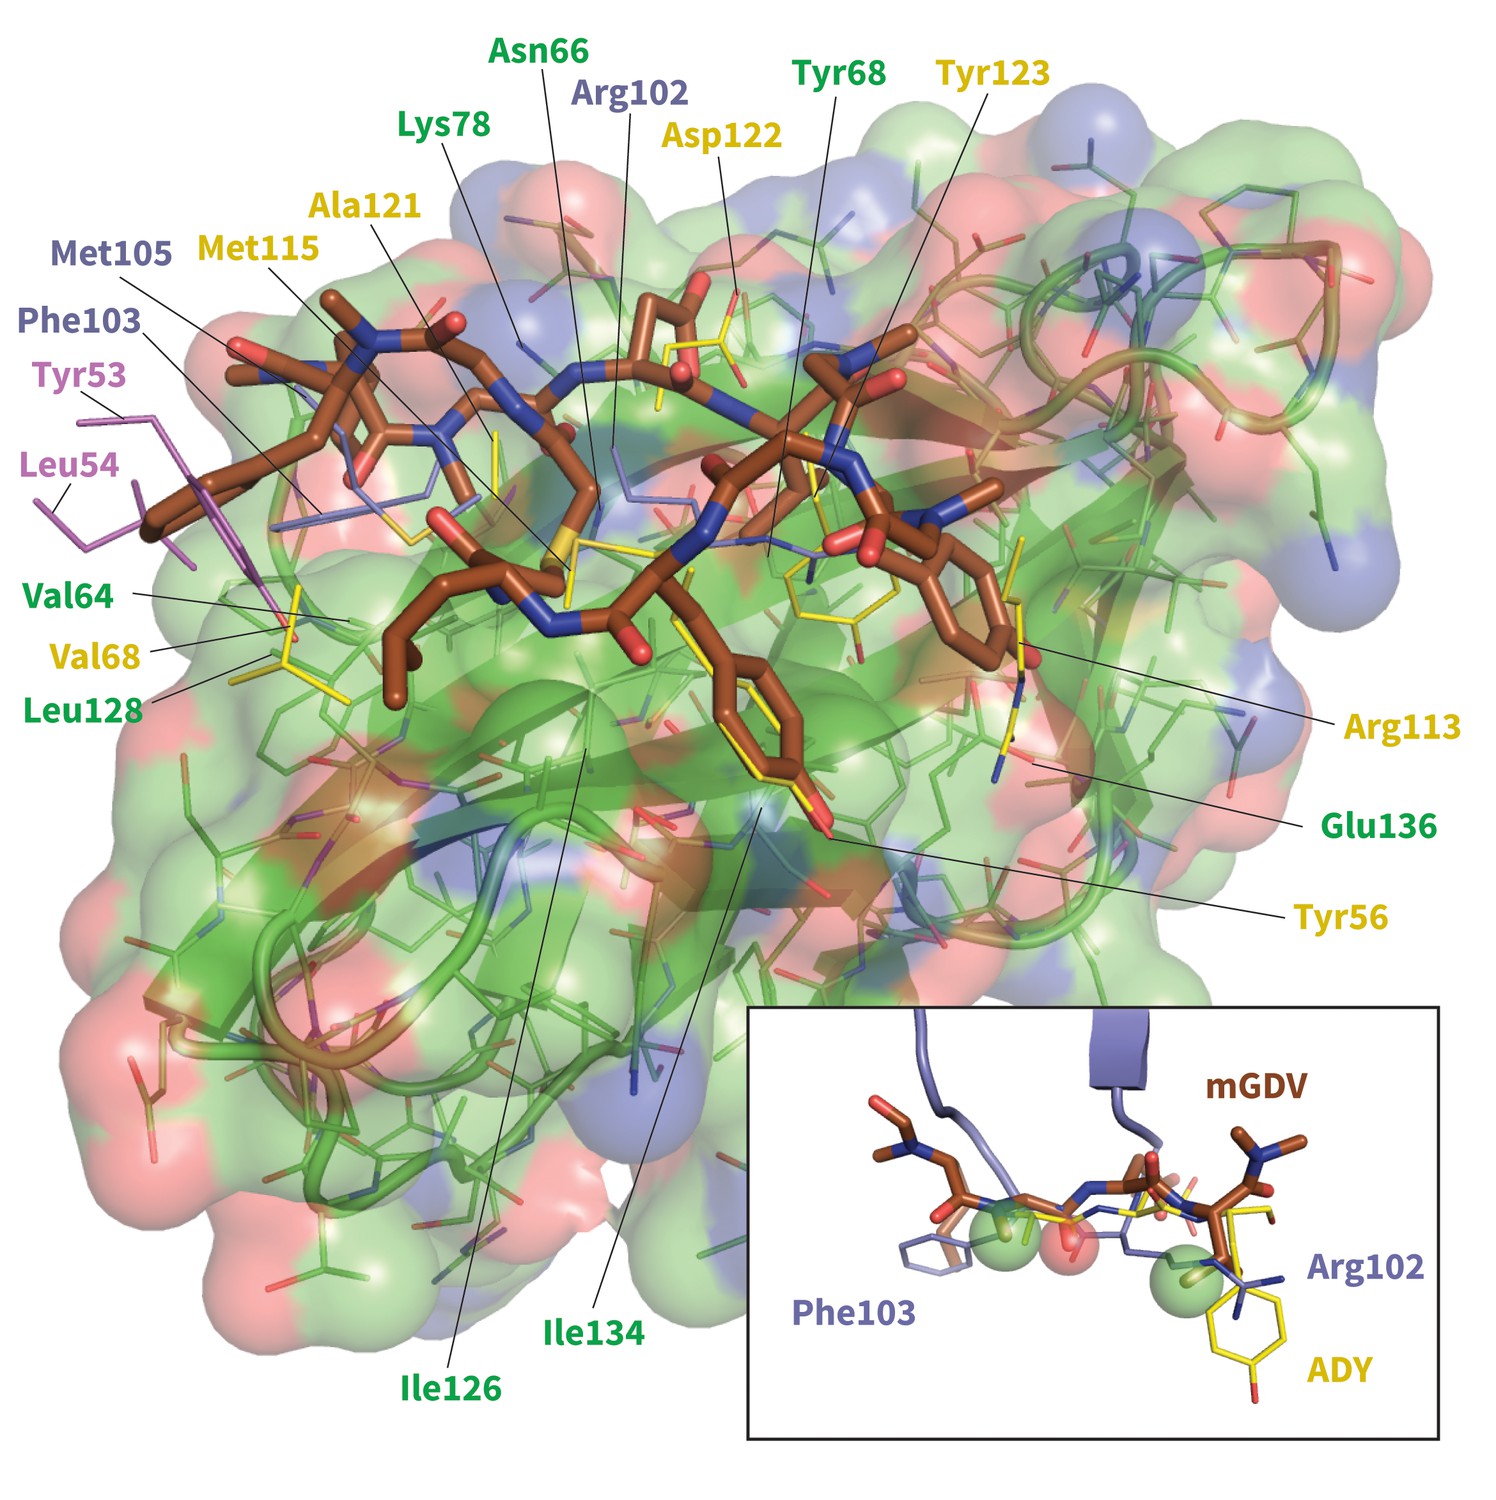
Model of potent Brystol-Myers-Squibb macrocyclic PD-1 inhibitor.
Predicted macrocycle binding mode is shown brown, with certain side chains omitted for clarity (see Figure 10—figure supplement 2 for full macrocycle structure). Key PD-L1 (yellow) (Zak et al., 2015) and pembrolizumab (purple and magenta) (Horita et al., 2016) interface residues from their bound cocrystal structures are shown to highlight predicted native-like contacts. Inset: the mGDV segment of the macrocycle aligned to PD-L1’s ADY trigger and pembrolizumab’s corresponding interface residues. Green and red spheres represent hydrophobic and polar pharmacophores matched by both pembrolizumab and the mGDV macrocycle motif.
Figure 10—figure supplement 2

Predicted interactions of Brystol-Myers-Squibb macrocyclic PD-1 inhibitor.
Figure shows the 2D structure of the patented Brystol-Myers-Squibb macrocycle with the mGDV sequence highlighted in magenta. Dashed lines indicate the specific interactions between the macrocycle and the PD-1 interface (green circles) that are observed in our binding model. Amino-acid components of the macrocycle are labeled, and analogous PD-L1 cocrystal (Zak et al., 2015) residues that participate in the same interactions are indicated in parenthesis. Our binding model recapitulates most native-like contacts present in the human PD-1–PD-L1 cocrystal.
Figure 11
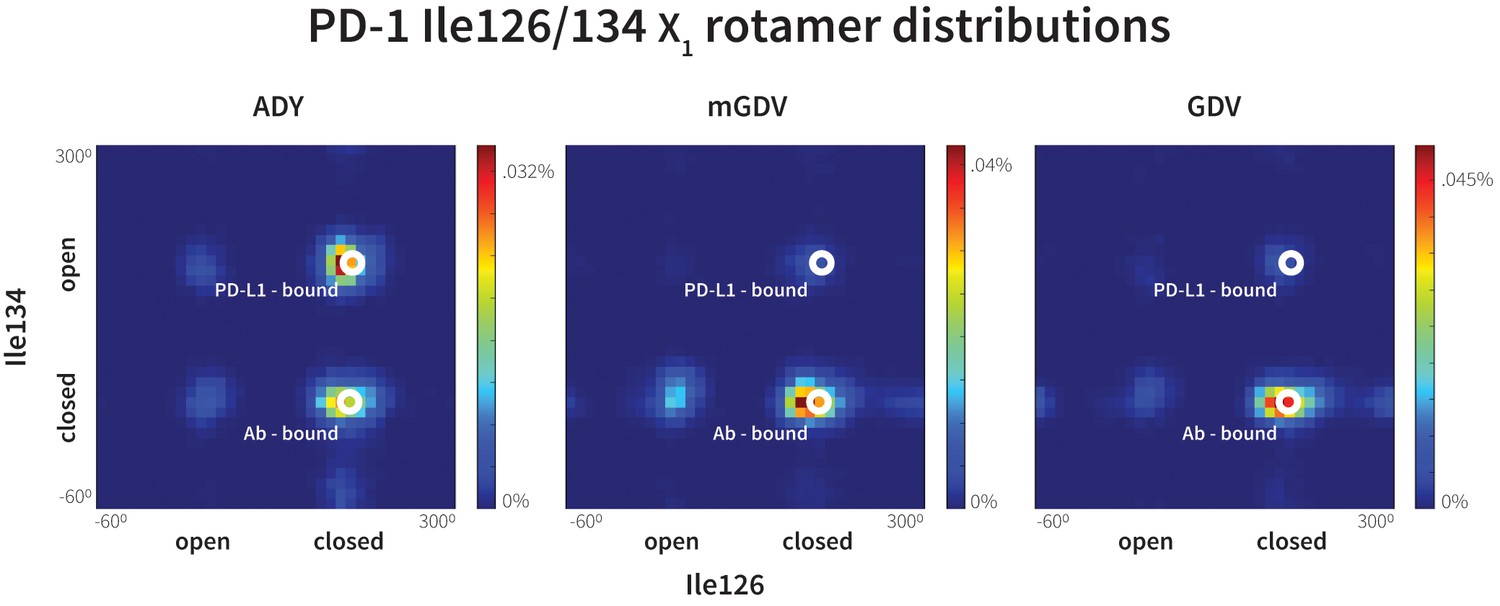
Macrocyclic mGDV motif induces structural changes in the PD-1 interface towards the pembrolizumab–bound state.
Heat maps show the distributions of PD-1’s Ile126 and Ile134 X1 rotamer angles in MDs of the receptor interacting with the ADY PD-L1 trigger (left), the BMS macrocycle mGDV motif (center), and the GDV peptide. Data for each ligand were gathered from three distinct 200ns simulations. White dots on the plots indicate the rotamer angles of the same two residues in the pembrolizumab (Ab)–bound (Horita et al., 2016) and PD-L1–bound (Zak et al., 2015) cocrystal structures.
-
Figure 11—source data 1
Excel workbook with a single sheet containing the 2D histogram data for the heatmaps shown in Figure 11.
- https://doi.org/10.7554/eLife.22889.030
Figure 12
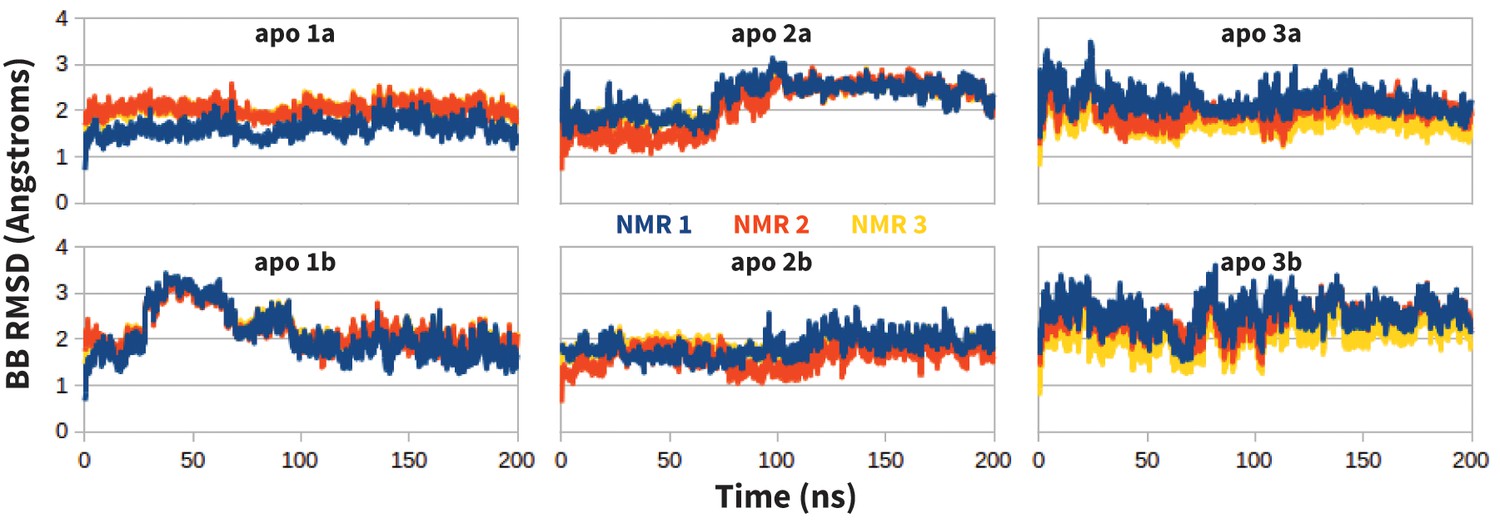
Stability of apo PD-1 simulations.
Backbone RMSD of apo PD-1 to the first three NMR models (shown in blue, red, and yellow, respectively). Data are shown for six simulations: two replicates (a,b) starting from each of the first three NMR models (1,2,3).
-
Figure 12—source data 1
Excel workbook with a single sheet containing the time-series RMSD-to-unbound data from the apo PD-1 simulations plotted in Figure 12.
- https://doi.org/10.7554/eLife.22889.032
Tables
Table 1
Anchor Tyr123 is key determinant of bound-like docked conformations. Backbone RMSD of top 10 ClusPro (Comeau et al., 2004) predicted PD-L1 binding modes to the human PD-1–PD-L1 cocrystal (PDB: 4ZQK). RMSDs shown for docked wild type human PD-L1 (WT) and for docked PD-L1 anchor mutants Y123G and Y123A.
| Docked PD-L1 backbone RMSD (Å) to 4ZQK PD-L1 | |||
|---|---|---|---|
| ClusPro model | WT | Y123G | Y123A |
| 0 | 4.65 | 8.8 | 49.7 |
| 1 | 54.0 | 38.2 | 49.1 |
| 2 | 49.5 | 49.1 | 39.2 |
| 3 | 47.5 | 40.4 | 40.4 |
| 4 | 39.4 | 49.4 | 48.5 |
| 5 | 48.0 | 40.07 | 53.2 |
| 6 | 45.8 | 53.2 | 49.5 |
| 7 | 40.6 | 46.5 | 48.1 |
| 8 | 48.6 | 47.8 | 47.6 |
| 9 | 50.7 | 48.7 | 50.4 |
Table 2
Free energy difference between the non-bound-like and bound-like states of PD-1 interface residues Asn66 and Ile126 in various systems. Listed values show the average and standard deviation of (from three replicate simulations) for Asn66 and Ile126 in the different PD-1 systems. Since the bound-like state of Ile126 is closed when PD-L1 – bound and open when PD-L2 - bound, the values for this residue take opposite signs. The trivial relationship between and are indicated for each column. Values shown are in units of kBT, with T = 300 K.
| Pd-l1 / PD-L2 | PD-L1 | PD-L2 | |
|---|---|---|---|
| PD-1 Simulation | (kBT) | (kBT) | (kBT) |
| apo () | 3.6 ± 0.60 | 4.4 ± 1.2 | −4.4 ± 1.2 |
| Y () | 1.7 ± 0.61 | 1.3 ± 0.3 | −1.3 ± 0.3 |
| DY () | 0.11 ± 0.44 | −0.21 ± 0.74 | 0.21 ± 0.74 |
| GGG () | −0.28 ± 0.52 | 0.7 ± 0.8 | −0.7 ± 0.8 |
| GGY () | 0.02 ± 0.17 | 0.58 ± 0.22 | −0.58 ± 0.22 |
| GDG () | −2.3 ± 0.32 | −0.46 ± 0.36 | 0.46 ± 0.36 |
| ADG () | −3.0 ± 0.45 | 0.35 ± 0.60 | −0.35 ± 0.60 |
| GDY () | −3.0 ± 0.7 | 2.3 ± 0.72 | −2.3 ± 0.72 |
| ADY () | −2.7 ± 0.44 | −2.0 ± 0.36 | 2.0 ± 0.36 |
| mGDV () | −3.0 ± 0.47 | −1.8 ± 0.48 | 1.8 ± 0.48 |
Table 3
Chronology of the formation of intermolecular interactions between PD-1 and PD-L1/2 in encounter complex simulations. Listed values show the average and standard deviation time to formation (from three replicate simulations) of various inter- and intramolecular hydrogen bonds following the burial of the ligand anchor and formation of the key Tyr68–Asp122/111 hydrogen bond.
| Δt (ns) after Tyr68 – Asp122/111 hydrogen bond formation | ||
|---|---|---|
| Hydrogen bond | PD-1 - PD-L1 Encounter Complex | PD-1 - PD-L2 Encounter Complex |
| Asn66 – Ala121/Trp110 | 6.3 ± 2.9 | 6.7 ± 7.2 |
| Asn66 – Tyr68 | 5.0 ± 1.7 | 8.3 ± 7.5 |
| Gln75 – Arg125/Tyr114 | 15 ± 7.8 | 17 ± 11 |
| Lys79 – Phe19/21 | 13 ± 15 | 15 ± 20 |
Table 4
Top 5 PD-1 residues contributing to electrostatic energy when binding to PD-L1 and pembrolizumab. Binding energies were calculated using the FastContact web server (Champ and Camacho, 2007) and cocrystal structures of PD-1 bound to PD-L1 (Zak et al., 2015) and pembrolizumab (Horita et al., 2016).
| PD-L1–bound | Pembrolizumab–bound | ||
|---|---|---|---|
| Residue | Energy (kcal/mol) | Residue | Energy (kcal/mol) |
| Glu136* | −11.531 | Asp85‡ | −8.367 |
| Asp77 | −5.073 | Ser87 | −3.629 |
| Lys78† | −4.266 | Asp77 | −2.417 |
| Gln75 | −4.027 | Tyr68 | −2.156 |
| Glu84 | −3.119 | Glu136 | −2.096 |
-
*The E136A mutation abolishes binding of PD-1 to PD-L1 and greatly reduces binding to PD-L2 (Lázár-Molnár et al., 2008).
-
†The K78A mutation abolishes binding of PD-1 to PD-L1 and greatly reduces binding to PD-L2 (Lázár-Molnár et al., 2008).
-
‡The D85G mutation abolishes binding of PD-1 to pembrolizumab (Na et al., 2017).
Table 5
Top 5 PD-1 residues contributing to desolvation energy when binding to PD-L1 and pembrolizumab. Binding energies were calculated using the FastContact web server (Champ and Camacho, 2007) and cocrystal structures of PD-1 bound to PD-L1 (Zak et al., 2015) and pembrolizumab (Horita et al., 2016).
| PD-L1–bound | Pembrolizumab–bound | ||
|---|---|---|---|
| Residue | Energy (kcal/mol) | Residue | Energy (kcal/mol) |
| Ile126* | −1.853 | Leu128† | −2.886 |
| Leu128† | −1.673 | Pro89 | −2.486 |
| Ile134‡ | −1.361 | Val64 | −1.721 |
| Val64 | −0.463 | Pro130 | −1.586 |
| Ala132 | −0.37 | Pro83 | −1.131 |
-
*The I126A mutation greatly reduces binding of PD-1 to both PD-L1 and PD-L2 (Lázár-Molnár et al., 2008).
-
†The L128A mutation abolishes binding of PD-1 to PD-L1 and partially reduces binding to PD-L2 (Lázár-Molnár et al., 2008).
-
‡The I134A mutation abolishes binding of PD-1 t oPD-L1 and greatly reduces binding to PD-L2 (Lázár-Molnár et al., 2008).
Download links
A two-part list of links to download the article, or parts of the article, in various formats.
Downloads (link to download the article as PDF)
Open citations (links to open the citations from this article in various online reference manager services)
Cite this article (links to download the citations from this article in formats compatible with various reference manager tools)
Probing protein flexibility reveals a mechanism for selective promiscuity
eLife 6:e22889.
https://doi.org/10.7554/eLife.22889


