MCTP is an ER-resident calcium sensor that stabilizes synaptic transmission and homeostatic plasticity
- Kavli Institute for Fundamental Neuroscience, University of California, San Francisco, United States
- University of Southern California, United States
Figures
Figure 1
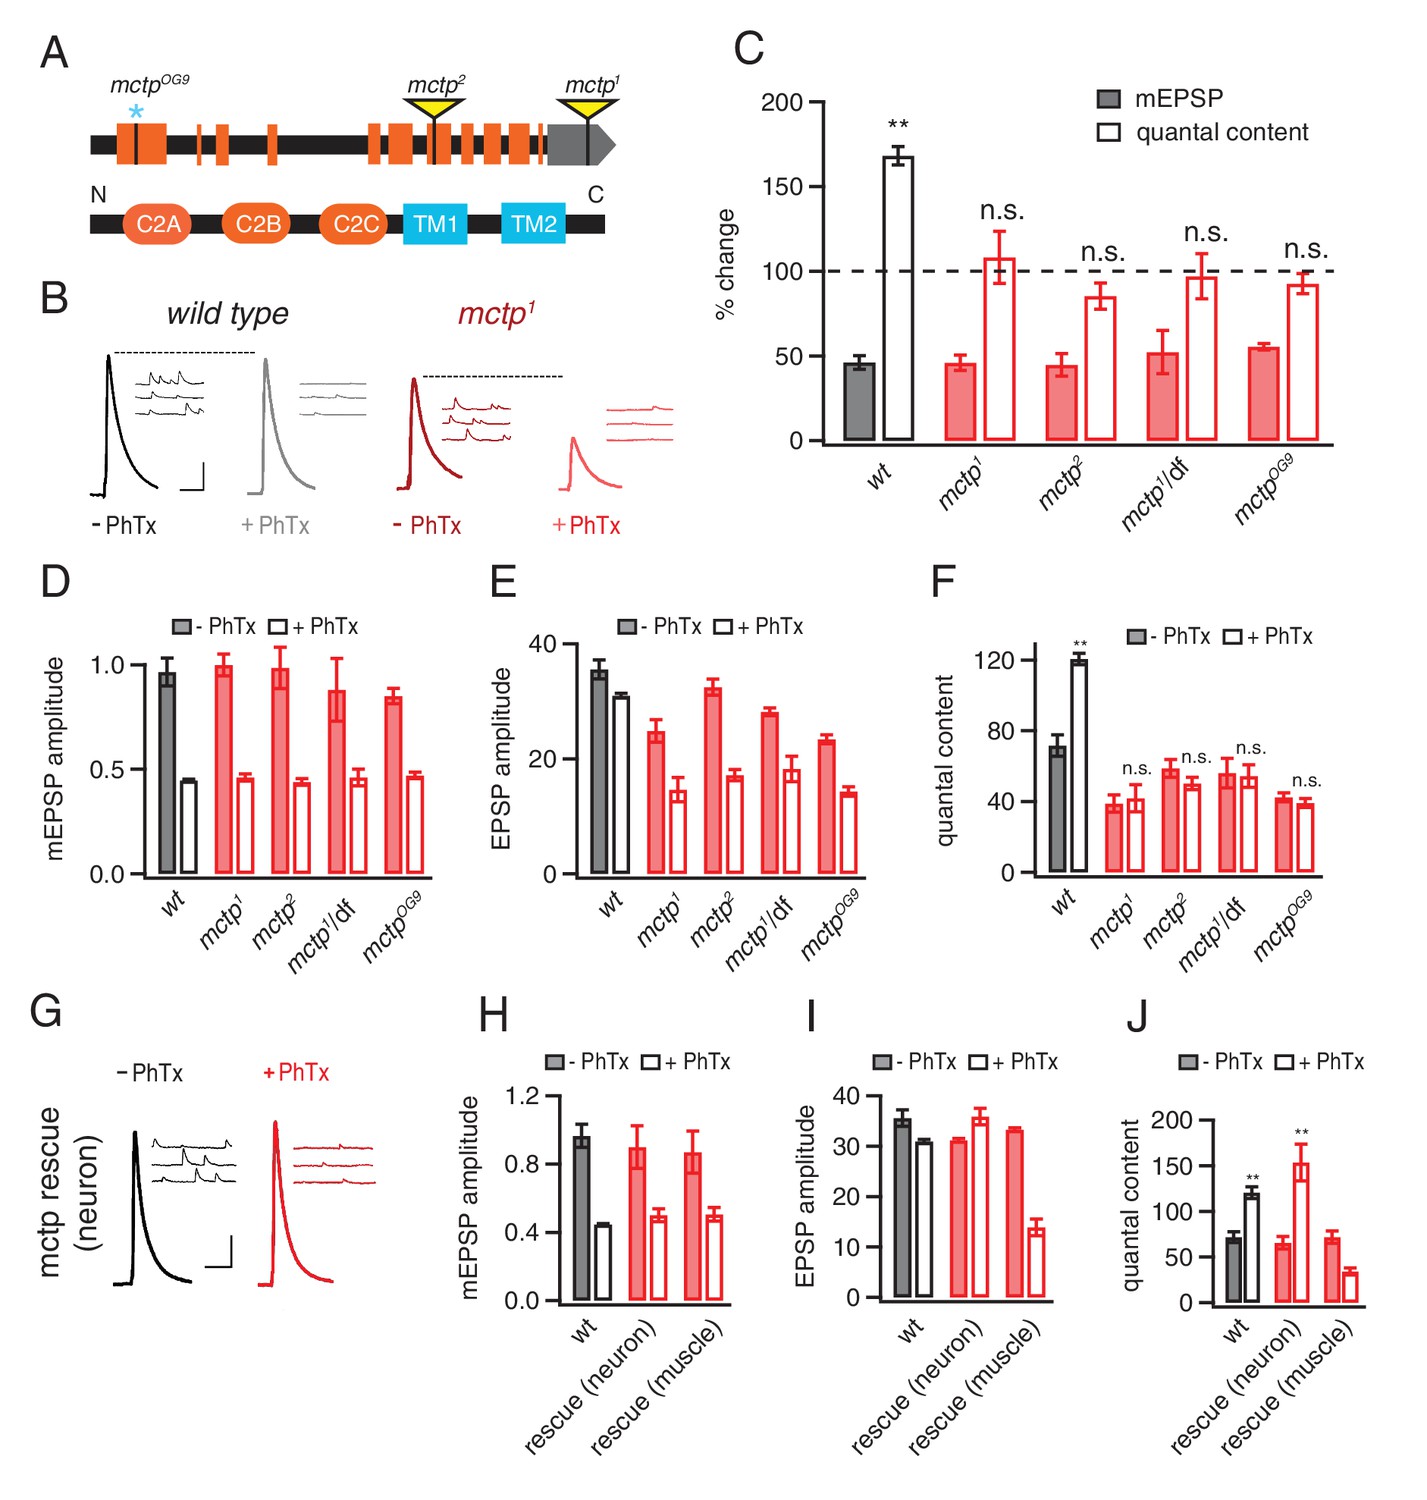
MCTP is a multiple C2 domain protein, which is necessary for the synaptic homeostasis.
(A) Top: schematic of the Drosophila mctp locus. The position of transposon insertion mutations (yellow triangles) and CRISPR-induced mutation (blue asterisk) are shown. Bottom: Diagram of the MCTP protein, which contains three C2 domains (orange round rectangles) and two transmembrane domains (blue rectangles). (B) Representative traces showing EPSPs and mEPSPs from mctp and wild type in the absence (left, black or dark red) or presence (light gray or light red) of philanthotoxin (PhTx) as indicated below. Scale bar: 4 mV/7 mV; 25 ms/60 ms. (C) Average percent change in mEPSP amplitude (filled bars) and quantal content (open bars) for the indicated genotypes, calculated as the percent change of each genotype in the presence of PhTx compared to baseline in the absence of PhTx. wild type (wt): n = 10 (-PhTx), n = 10 (+PhTx); mctp1: n = 11 (-PhTx), n = 8 (+PhTx); mctp2: n = 8 (-PhTx), n = 9 (+PhTx); mctp1/df: n = 8 (-PhTx), n = 7 (+PhTx); mctpOG9: n = 20 (-PhTx), n = 37 (+PhTx). Statistical comparisons are made comparing values in the presence or absence of PhTx within each genotype (Student’s t-test). (D–F) Quantification of mEPSP amplitude (D), EPSP amplitude (E) and quantal content (F) in the absence and presence of PhTx (as indicated). Statistical comparisons as in (C). (G) Representative traces for EPSPs and mEPSPs showing the restoration of the presynaptic homeostasis upon expression of a UAS-mctp transgene in neurons (elav-Gal4; black baseline; red +PhTx) Scale bar: 4 mV/7 mV; 25 ms/60 ms. (H–J) Quantification of average mEPSP amplitude, EPSP and quantal content for wild type (n = 10 without PhTx; n = 10 + PhTx), neural rescue (elav-Gal4) (n = 13 without PhTx; n = 10 + PhTx) and muscle rescue (MHC-Gal4) of mctp1 mutant (n = 11 without PhTx; n = 9 + PhTx) in the absence and presence of philanthotoxin (filled and open bars, respectively). Student’s t-test **p<0.01, n.s. p>0.05.
Figure 2
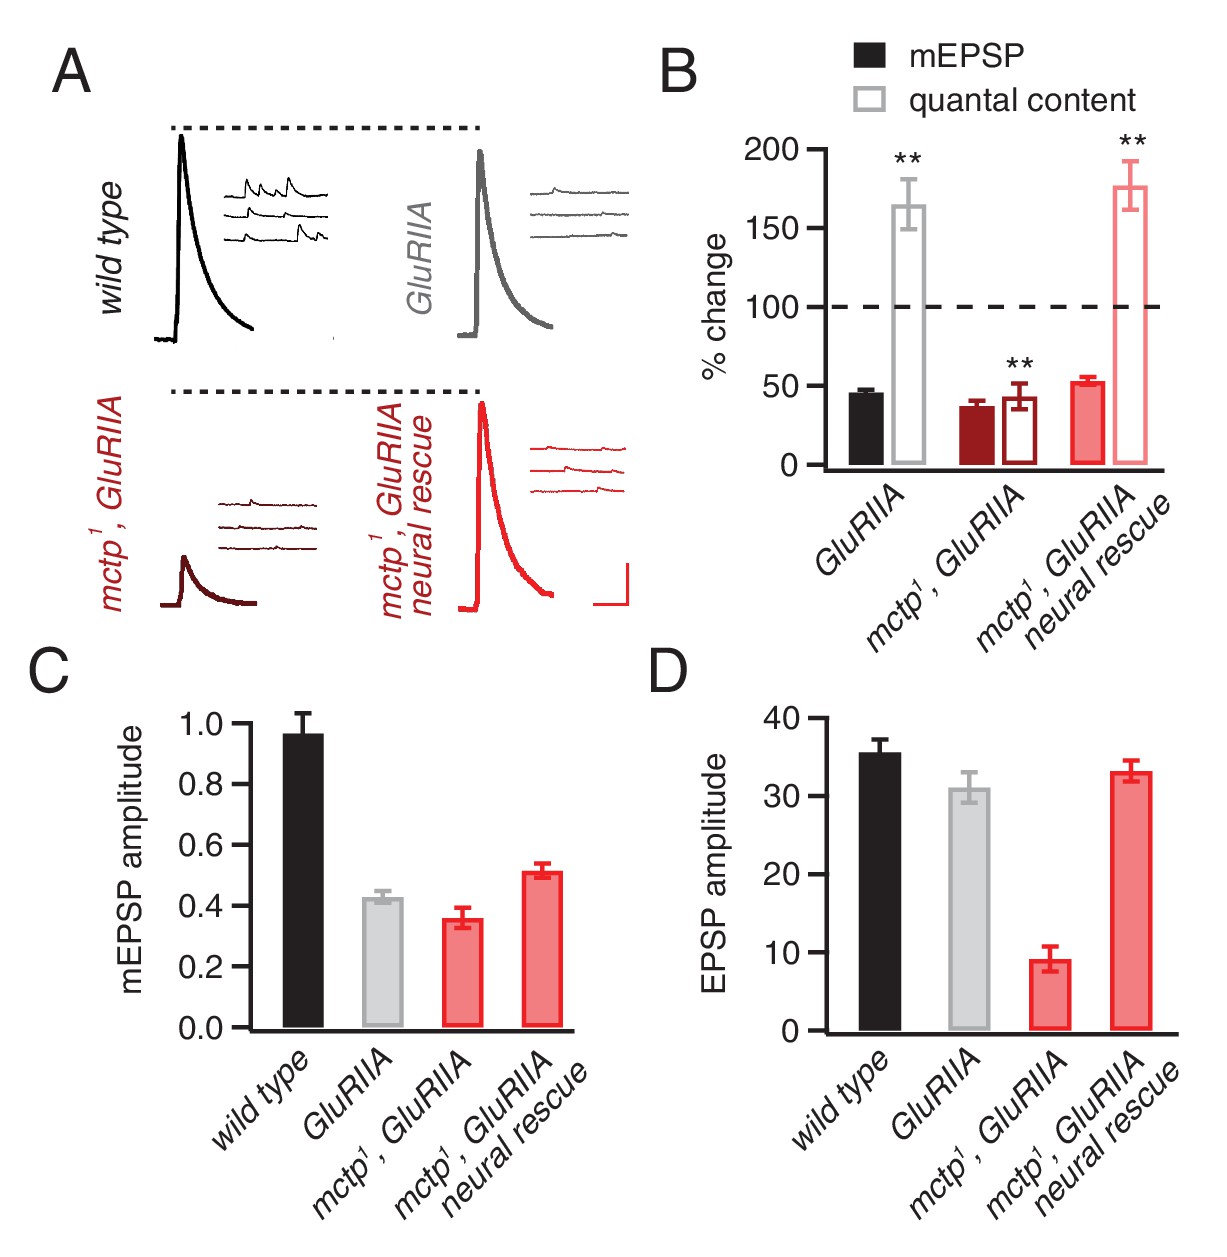
mctp is necessary for the sustained expression of homeostasis.
(A) Representative traces of EPSP and mEPSP are shown for the following genotypes: wild-type (left, top), GluRIIA mutant (right, top), mctp1,GluRIIA double mutant (left, bottom) and neural rescue of mctp1,GluRIIA double mutant with UAS-mctp driven by elav-Gal4 (right, bottom). Scale bar: 4 mV/7 mV; 25 ms/60 ms. (B) Average percent changes in mEPSP amplitude (filled bars) and quantal content (open bars) for indicated genotypes compared to wild type (wild type: n = 10; GluRIIA: n = 8; mctp1,GluRIIA: n = 7; mctp1,GluRIIA neural rescue: n = 10). (C–D) Average mEPSP amplitudes and quantal content are shown for genotypes as in (A). Student’s t-test ** for p<0.01, n.s. for p>0.05.
Figure 3
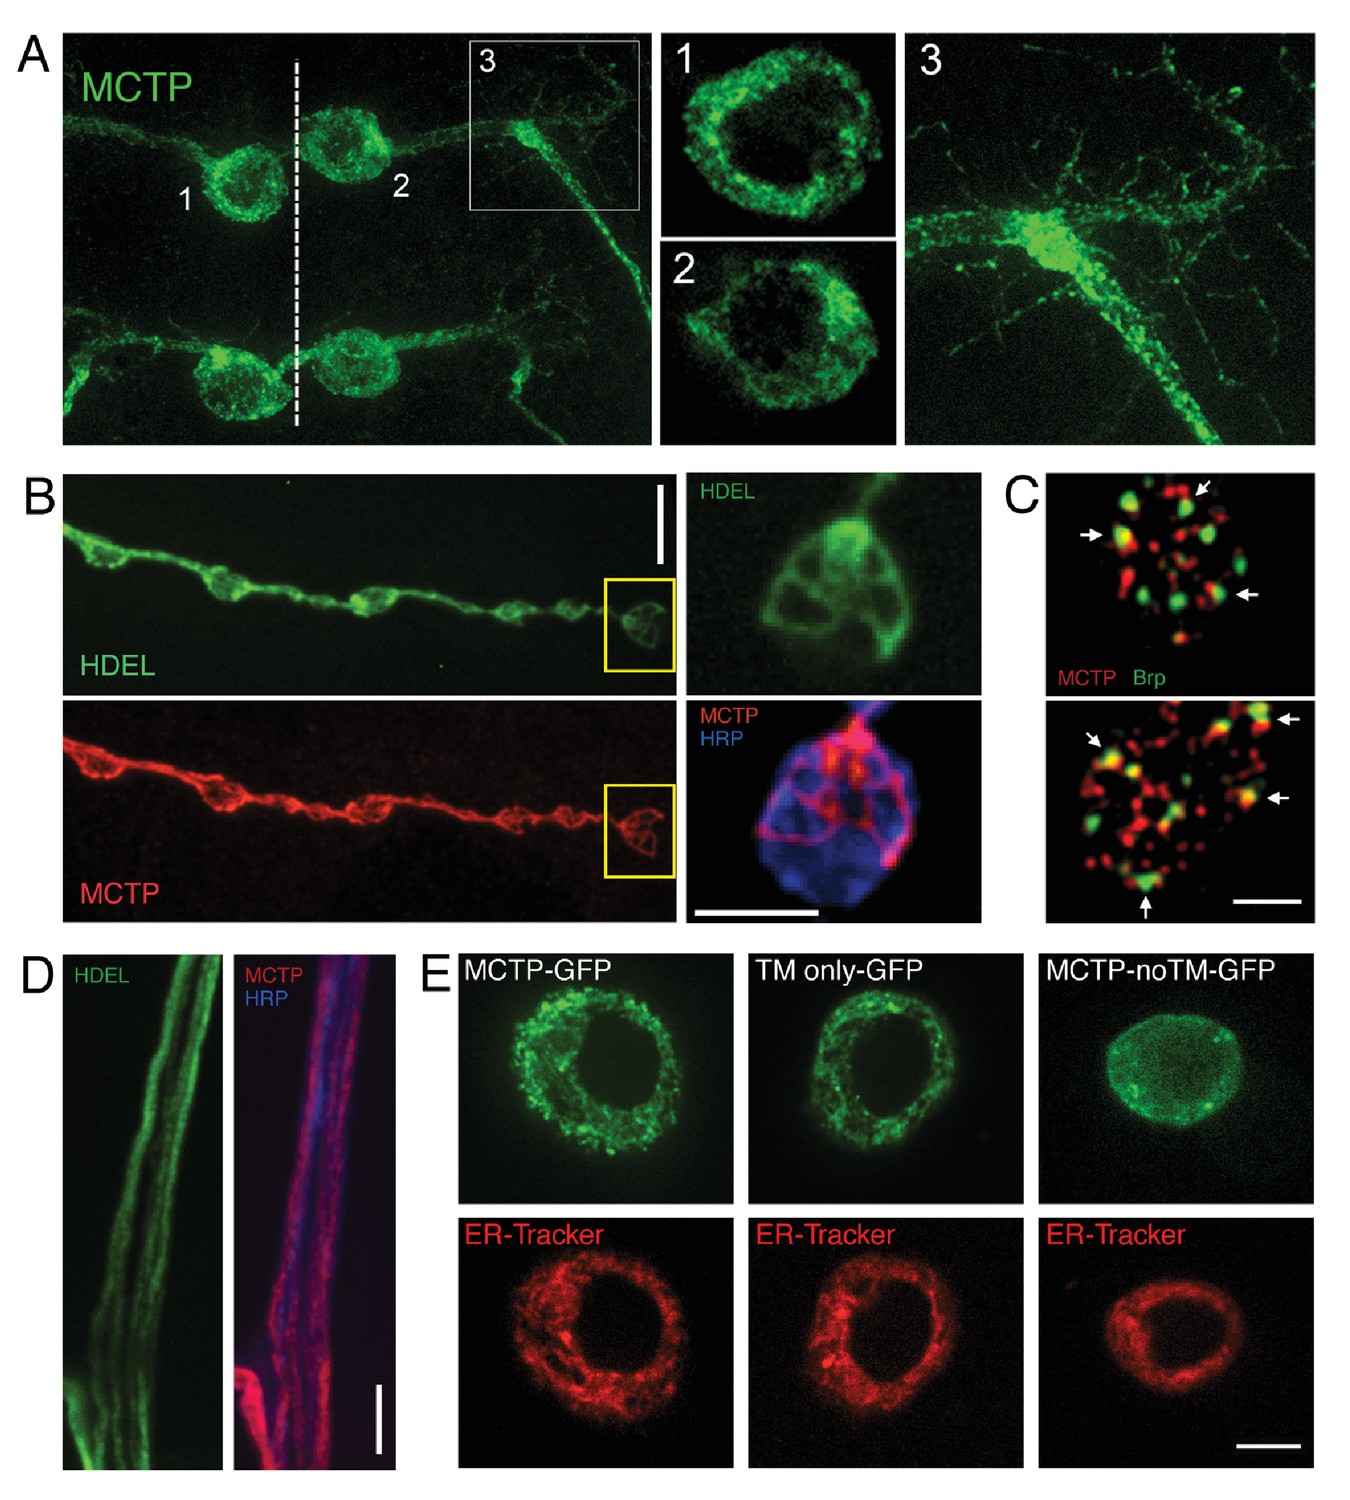
Epitope-tagged MCTP localizes to ER membranes.
(A) Image shows the distribution of epitope-tagged MCTP in a single bilaterally symmetrical pair of motoneurons in the larval CNS (MN1-Gal4>UAS-mctp-Flag, green) The dotted line indicates the CNS midline and the numbers refer to inset images at right showing single confocal sections of peri-nuclear reticular membranes in the soma (1, 2) and the MCTP-labeled membranes that continue into the axon and dendrites (3). (B) Synaptic distribution of HDEL-GFP (green, top), imaged in a live preparation. Below, MCTP-Flag (red) is shown for the same NMJ following mild fixation and antibody labeling. The yellow box indicates the region shown at higher magnification to the right. The live HDEL-GFP and post-fixation MCTP-Flag identify the same tubular organization of the ER membranes within an individual synaptic bouton. No staining on the neuronal plasma membrane is evident. The NMJ is co-stained with a marker of the neuronal plasma membrane (anti-HRP, blue). Scale bar: 10 µm. (C) Structured illumination microscopy (SIM), single confocal section images of a synaptic bouton expressing the active zone marker Brp-GFP (driven by its endogenous promoter, green) and MCTP (OK371-Gal4>UAS-MCTP-Flag, red). Arrows indicate regions where MCTP resides in close proximity to Brp puncta, which define the T-bar structures that reside at the center of individual active zones. Scale bar: 1 µm. (D) Axon membranes from the peripheral nerve stained as in (B). Scale bar: 50 µm. (E) Single confocal sections of individual S2 cells transfected with MCTP-GFP and co-labeled with ER-tracker (red; see Materials and methods). At left, an S2 cell transfected with full length MCTP-GFP. At middle, an S2 cell transfected with a transgene expressing only the two-transmembrane region of MCTP linked to GFP (TM only-GFP). ER localization is retained. At right, an S2 cell transfected with a transgene expressing an MCTP-GFP transgene lacking the two-transmembrane domain and ER localization is lost (MCTP-noTM-GFP). Scale bar: 10 µm.
Figure 4 with 1 supplement
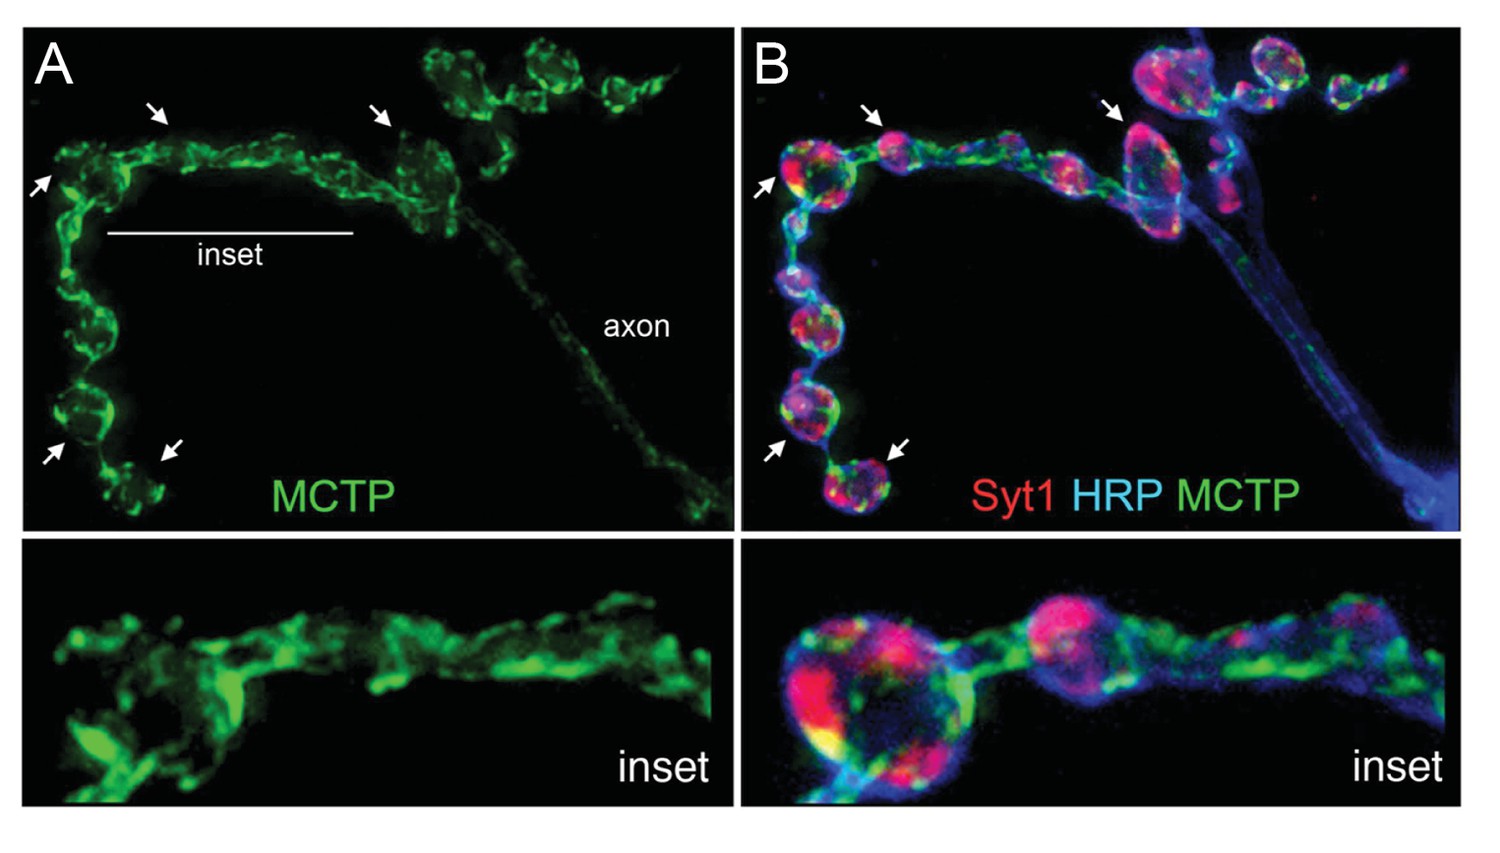
MCTP does not co-localize with the synaptic vesicle marker Syt1.
(A) Synaptic distribution of MCTP-Flag (green) at the NMJ. (B) The synapse in (A) co-stained with markers of the plasma membrane (anti-HRP, blue) and synaptic vesicles (anti-Syt1, red). Arrows indicate regions where Syt1 immunoreactivity is abundant and MCTP-Flag is absent. Insets (below; 2.5x magnification) of the region indicated by a horizontal line (top left) reveal regions occupied by Syt1 staining that are devoid of MCTP-Flag at higher magnification. Additional analysis of NMJ bouton anatomy and cytoskeleton is presented in Figure 4—figure supplement 1.
Figure 4—figure supplement 1
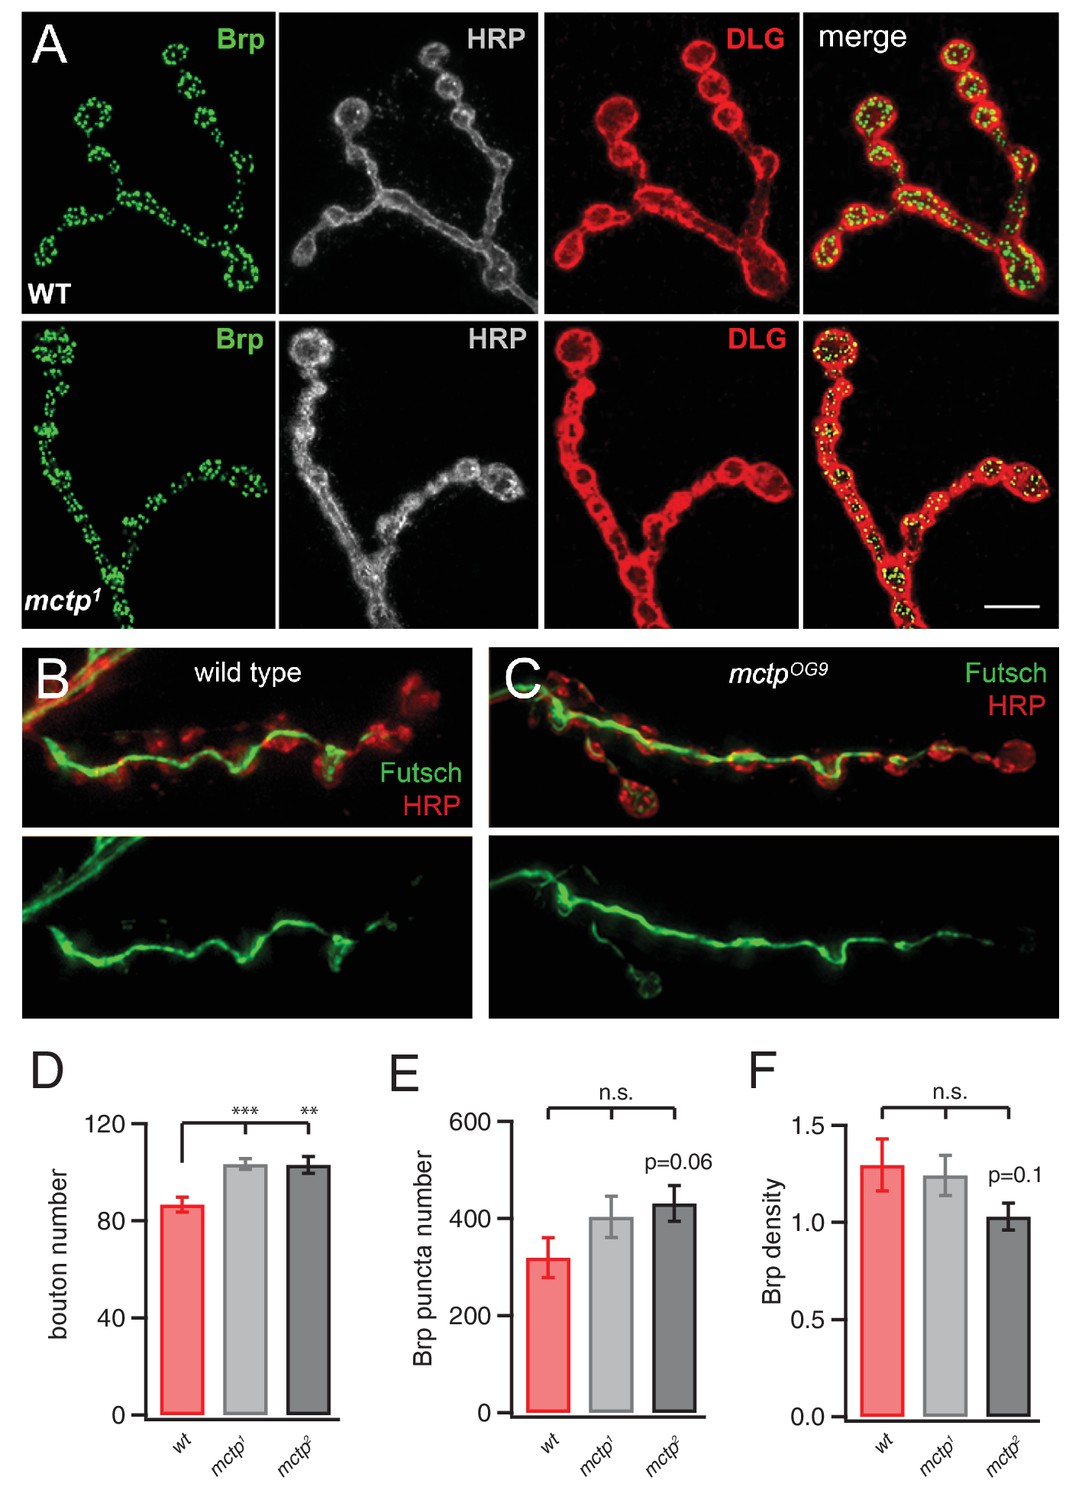
Normal NMJ Development in mctp mutants.
(A) Representative images of the wild type (top) and mctp1 (bottom) NMJ stained with anti-Brp (green), HRP (white) and anti-Dlg (red). The far right images in each row represent the merged channels. Scale 5 µm. (B) Image of the NMJ stained with anti-Futsch (green) to label the synaptic microtubule cytoskeleton and HRP (red) to label the presynaptic membranes. Below, the anti-Futsch channel is shown in isolation. (C) Staining as in (B) for an NMJ in the mctpOG9 mutant. There is no qualitative difference in anti-Futsch staining. (D–F) Quantification of bouton number (D), anti-Brp puncta number per NMJ (E) and the density of Brp puncta per bouton (F). There is a small but statistically significant increase in bouton number in both the mctp1 and mctp2 mutants compared to wild type. There is no change in total Brp puncta number and a small decline in Brp density per bouton in mctp2 compared to wild type, consistent with the modest increase in bouton number without a change in active zone number, as defined by the presence of a Brp puncta.
Figure 5
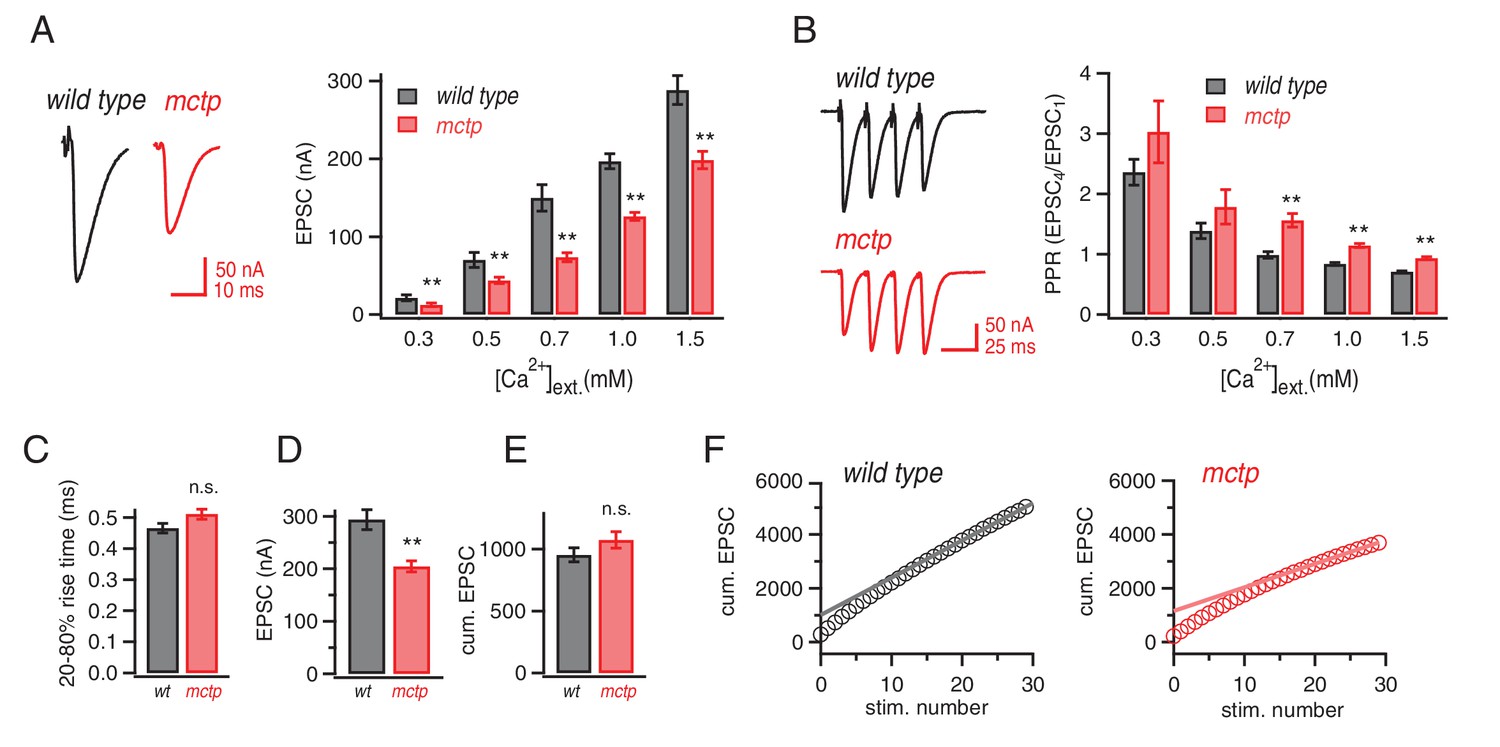
Altered baseline transmission and short-term plasticity in mctp mutants.
(A) At left, representative EPSC traces for wild type (black) and mctpOG9 (red). The plot shows average EPSC amplitudes for wild type (gray) and mctpOG9 (red) at the indicated extracellular calcium concentrations. Sample sizes as follows: 0.3 mM: n = 10 (wt), n = 8 (mctpOG9); 0.5 mM: n = 13 (wt), n = 11 (mctpOG9); 0.7 mM: n = 7 (wt), n = 16 (mctpOG9); 1.0 mM: n = 16 (wt), n = 13 (mctpOG9); 1.5 mM: n = 12 (wt), n = 10 (mctpOG9). The decrease in mctpOG9 is significant at every calcium concentration (t-test). (B) At left, representative traces for short stimulus trains (60 Hz) for wild type (black) and mctpOG9 (red). Scale bar: 50nA, 50 ms. The plot show average EPSC ratio (4thEPSC/1stEPSC) at the indicated calcium concentrations for wild type (gray) and mctpOG9 (red). (C) Average EPSC rise time (20–80%) for wild type (gray) and mctp (red). D) Average EPSC amplitudes . (E) Average cumulative EPSC as in (D). (F) Representative data for the cumulated peak EPSC amplitudes following a train of action potential (60 Hz, 30 stimuli) shown for wild type and mctpOG9. Data are fit with a linear function at x = 20 to x = 29 and back-extrapolated to time 0, intersecting the y-axis. Student’s t-test ** for p<0.01, n.s. for p>0.05.
Figure 6

Action-potential induced calcium influx is normal in the mctp mutant.
(A) Representative line-scan images at a single synaptic bouton revealing the spatially averaged calcium transients following a single action potential (first stimulus in trace) and a short train of action potentials (5 stimuli at 50 Hz, second stimulus in trace) for wild type (black) and mctpOG9 (red). Below the raw line-scan data are values (∆F/F) reporting the change in OGB-1 fluorescence relative to baseline as a function of time. Trials were separated by 750 ms. (B) Average peak amplitude of calcium transients (∆F/F) for single action potential (single AP). (C) Average decay (tau) for a single action potential for wild type (n = 10 boutons) and mctpOG9 (n = 12 boutons). (D) Average peak amplitudes of calcium transients (∆F/F) as in (B) for the short stimulus train (5X AP). (E) Average decay (tau) as in (C) for trains of five action potentials (5X AP).
Figure 7
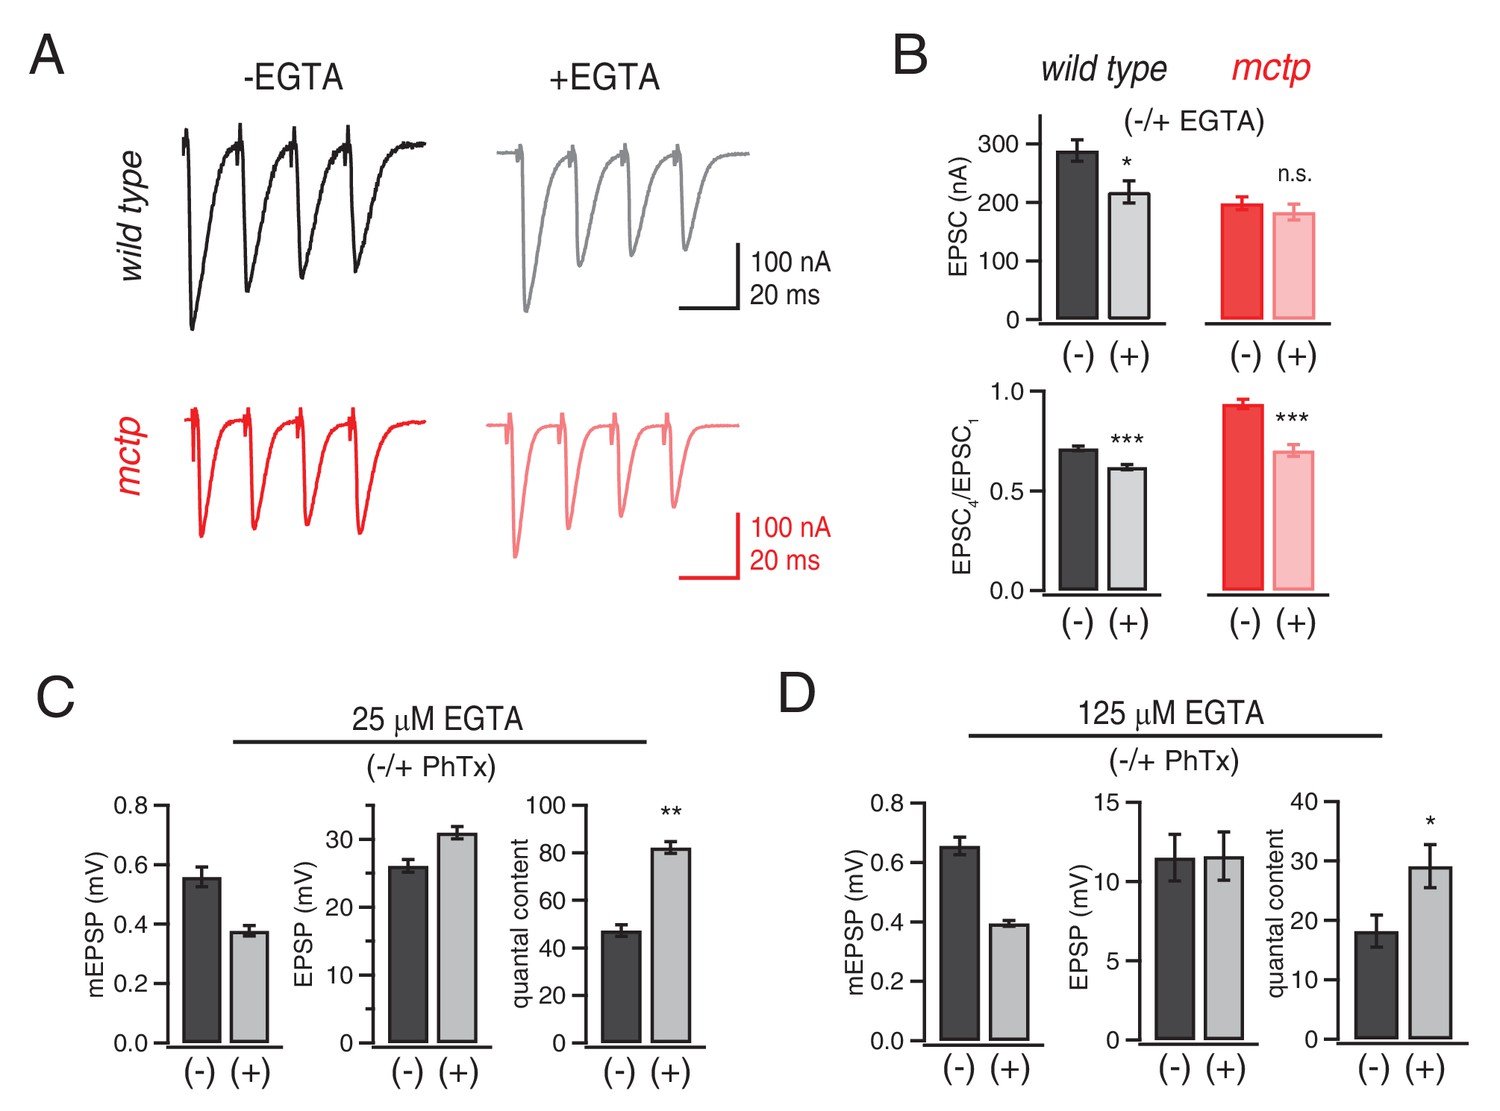
Evidence that MCTP is necessary for the release of an EGTA-sensitive pool of synaptic vesicles.
(A) Representative EPSC traces shown for wild type and mctpOG9 (black and red , respectively) in the absence and presence of EGTA-AM as indicated. (B) Average EPSC amplitudes and short-term modulation of EPSC amplitude (fourth EPSC / first EPSC) for wild type and mctpOG9 in the presence (+) or absence (−) of EGTA as indicated (sample size for wild type: (-EGTA) n = 12, (+EGTA) n = 11; for mctp: (-EGTA) n = 10, (+EGTA) n = 10). (C) Average mEPSP amplitude, EPSP amplitude and quantal content for wild type in the presence (+) or absence (−) of 25 µM EGTA, as indicated. Sample sizes as follows: -PhTx, n = 7; +PhTx, n = 4. (D) Recordings as in (C) performed in the presence of 125 µM EGTA-AM and the presence or absence of PhTx as indicated. Sample sizes as follows: -PhTx, n = 13; +PhTx, n = 15.
Figure 8
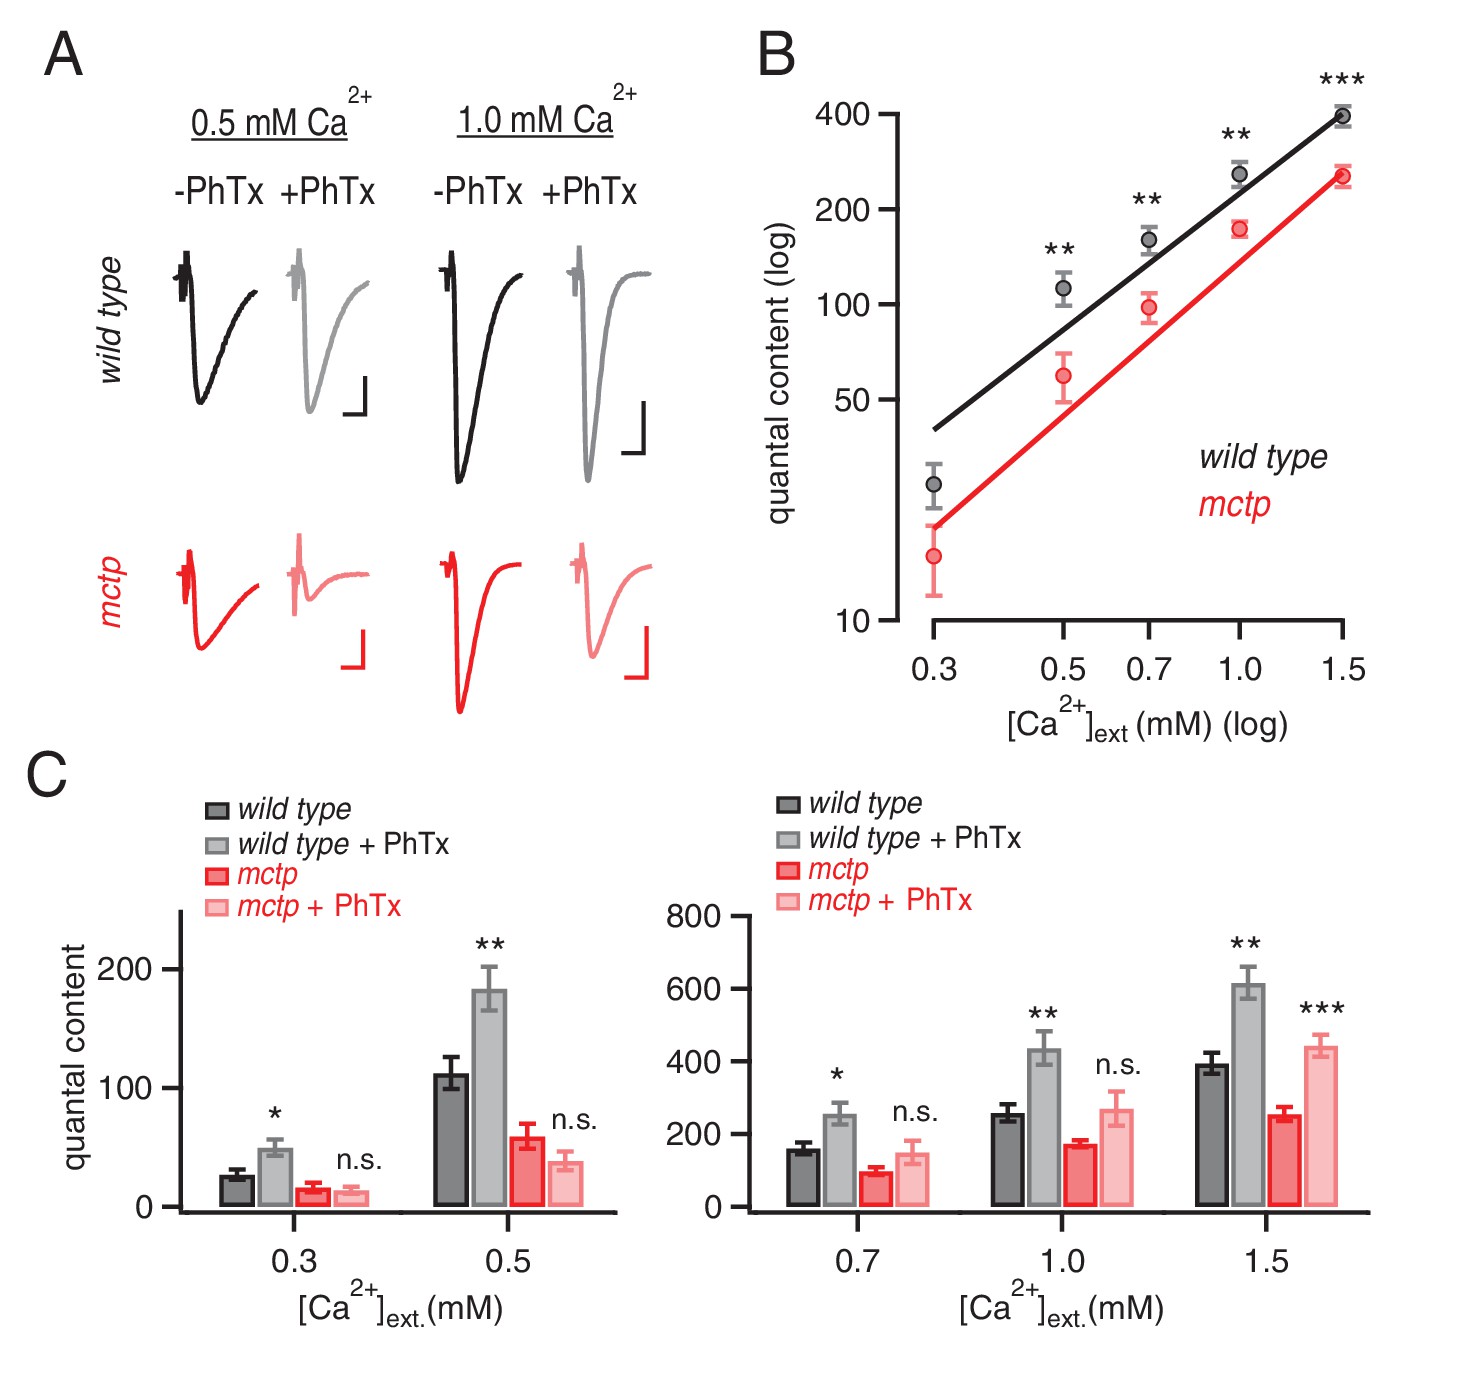
MCTP ensures that PHP is robust to variations in extracellular calcium.
(A) Representative EPSC traces for wild type (black) and mctpOG9 (red) at the indicated extracellular calcium concentrations, in the absence (−) and presence (+) of PhTx. Scale bar: 20 nA, 5 ms. (B) Average quantal content quantified at indicated calcium concentrations for wild type (black) and mctpOG9 (red). (C) Average quantal content for wild type (black/gray) and mctpOG9 (red/light red) in the absence and presence of PhTx at the indicated extracellular calcium concentrations. Sample sizes are shown for each calcium concentrations (mM) 0.3, 0.5, 0.7, 1.0 and 1.5, respectively: wild type (-Phtx) n = 10, 13, 6, 16, 12; wild type (+Phtx) n = 9, 12, 9, 7, 8. mctp (-Phtx) n = 8, 10, 14, 12, 9; mctp (+Phtx) n = 8, 10, 9, 6, 10. Statistical significance as indicated: Student’s t-test * for p<0.05; ** for p<0.01, n.s. for p>0.05.
Figure 9
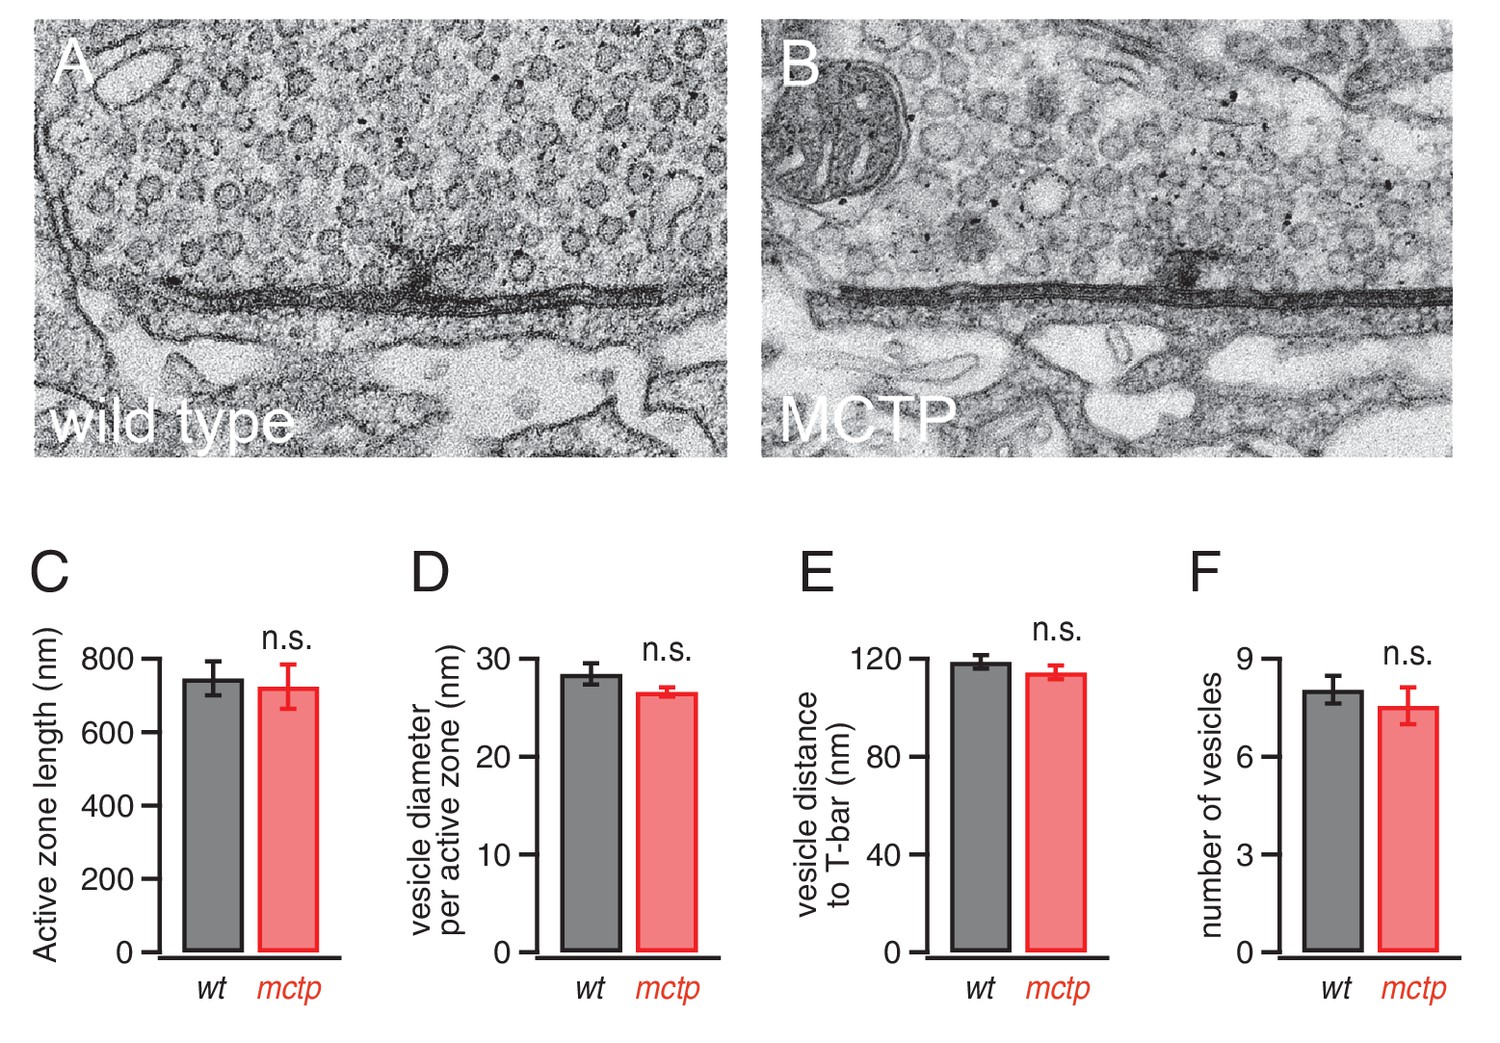
Normal active zone ultrastructure in the mctp mutant.
(A–B) Representative electron microscopy images of an active zone from wild type (A) and mctpOG9 (B). (C–F) Average active zone length (C), vesicle diameter per active zone (D), average vesicle distance to T-bar (E) and the average number of vesicles within 150 nm of the presynaptic T-bar (F). Sample sizes as follows: number of active zones in wild type, n = 19; mctp, n = 16; sections from at least two NMJ in two separate animals. Student’s t-test * for p<0.05; ** for p<0.01, n.s. for p>0.05.
Figure 10
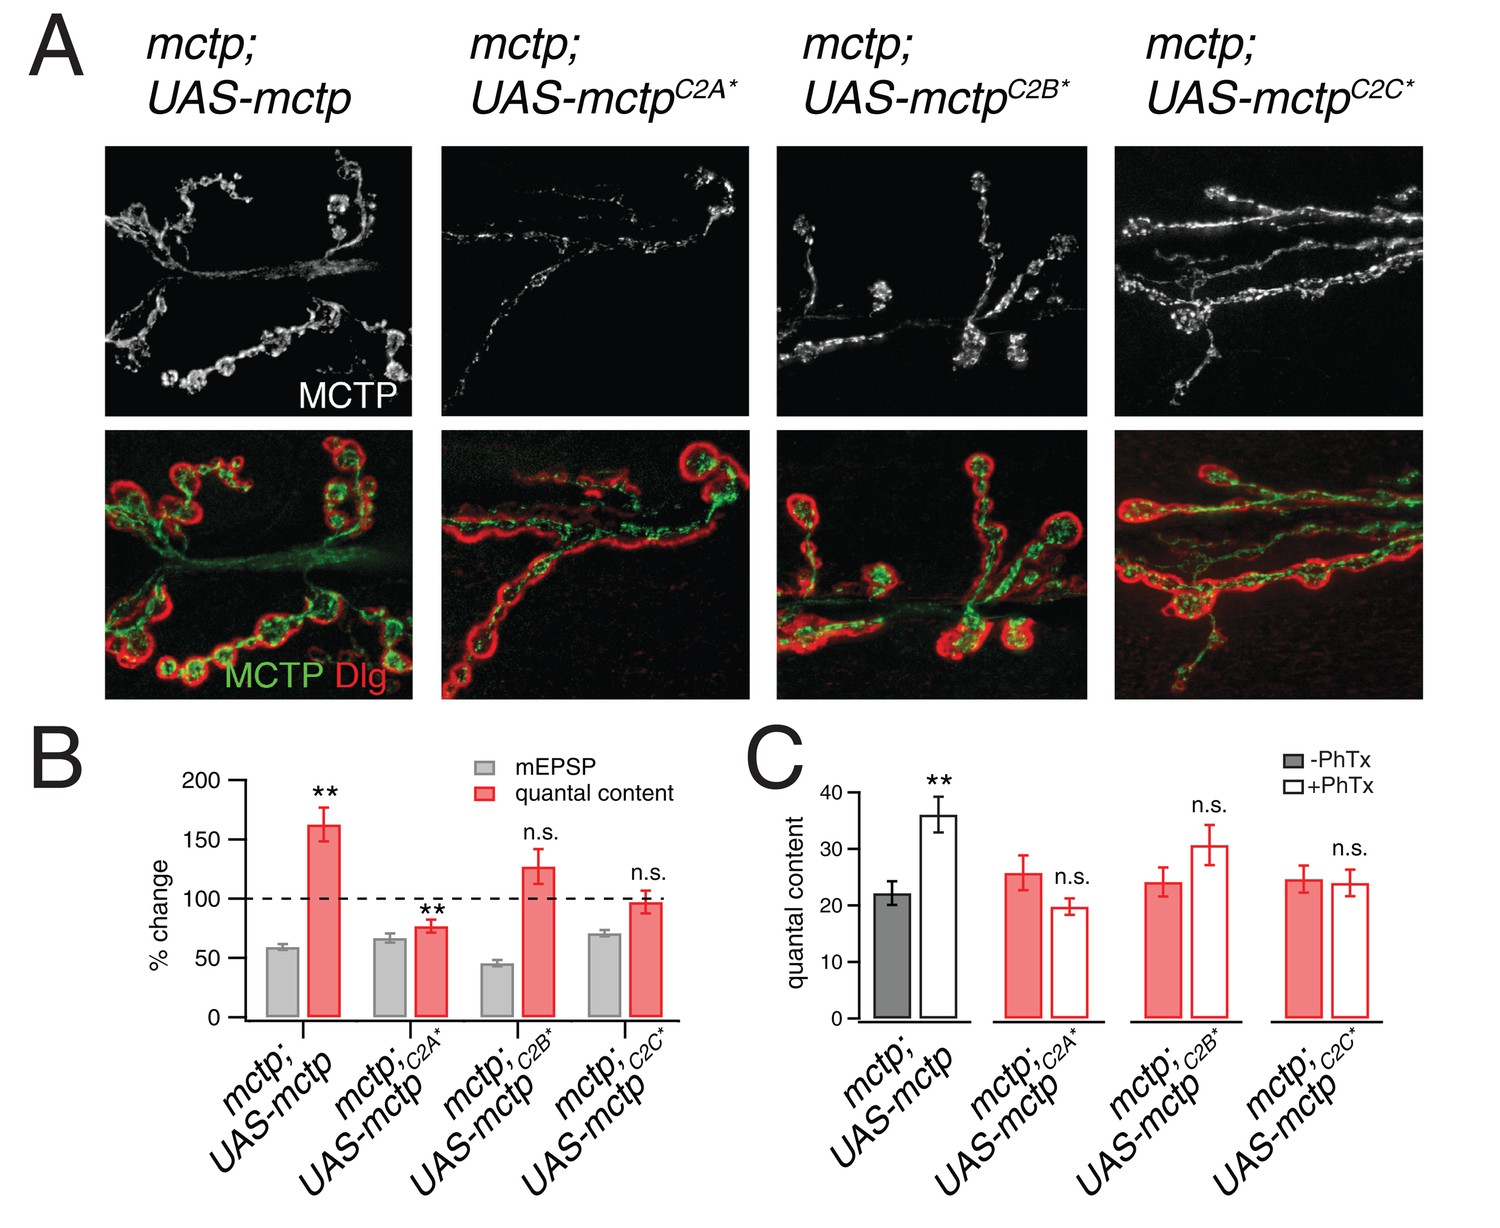
Evidence that MCTP is an ER localized calcium sensor.
(A) Representative images of the NMJ showing the expression of epitope tagged mctp transgenes (UAS-mctp-Flag). At top (black and white) are images of MCTP-Flag at the NMJ. Below, staining is shown for MCTP (green) and anti-Dlg (red). Sequentially, moving to the right are images for expression of mutant UAS-mctp-flag transgenes in the mctpOG9 mutant background. Each transgene harbors mutations in an individual C2 domain, either in the C2A domain (C2A*), the C2B domain (C2B*) or the C2C domain (C2C*, at far right). In all cases, the elav-Gal4 driver is used to express transgenes in neurons in the mctpOG9 mutant. (B) Average percent changes in mEPSP amplitude (filled bars) and quantal content (open bars) for the indicated genotypes (mctp, mctpC2A*, mctpC2B*, mctpC2C*) in the presence of PhTx compared to baseline. (C) Quantification of mEPSP amplitudes and quantal content for mctp (-PhTx, n = 10; +PhTx, n = 10), mctpC2A* (-PhTx, n = 14; +PhTx, n = 8), mctpC2B*(-PhTx, n = 6; +PhTx, n = 9), mctpC2C* (-PhTx, n = 14; +PhTx, n = 10). Student’s t-test ** for p<0.01, * for p<0.05, n.s. for p>0.05.
Download links
A two-part list of links to download the article, or parts of the article, in various formats.
Downloads (link to download the article as PDF)
Open citations (links to open the citations from this article in various online reference manager services)
Cite this article (links to download the citations from this article in formats compatible with various reference manager tools)
MCTP is an ER-resident calcium sensor that stabilizes synaptic transmission and homeostatic plasticity
eLife 6:e22904.
https://doi.org/10.7554/eLife.22904


