27 T ultra-high static magnetic field changes orientation and morphology of mitotic spindles in human cells
- Chinese Academy of Sciences, China
- University of Science and Technology of China, China
- Harvard Medical School, United States
- Nanjing University, China
Figures
Figure 1 with 1 supplement

27 T ultra-high water-cooled magnet and the biological sample incubation system.
(A) The WM4 (water-cooled magnet#4 in the Chinese High Magnetic Field Lab). (B, C) The design and picture of the biological sample incubation system. Two identical sets were made. One was used in the magnet while the other was placed outside of the magnet to serve as the ‘sham’ control. (D) The top view of the magnet, where the biological sample incubation tube was inserted. (E) The magnetic field was maintained at 27 T (total of 4 hr, 3 hr stable maintenance at 27 T with half hour increase and half hour decrease).
Figure 1—figure supplement 1
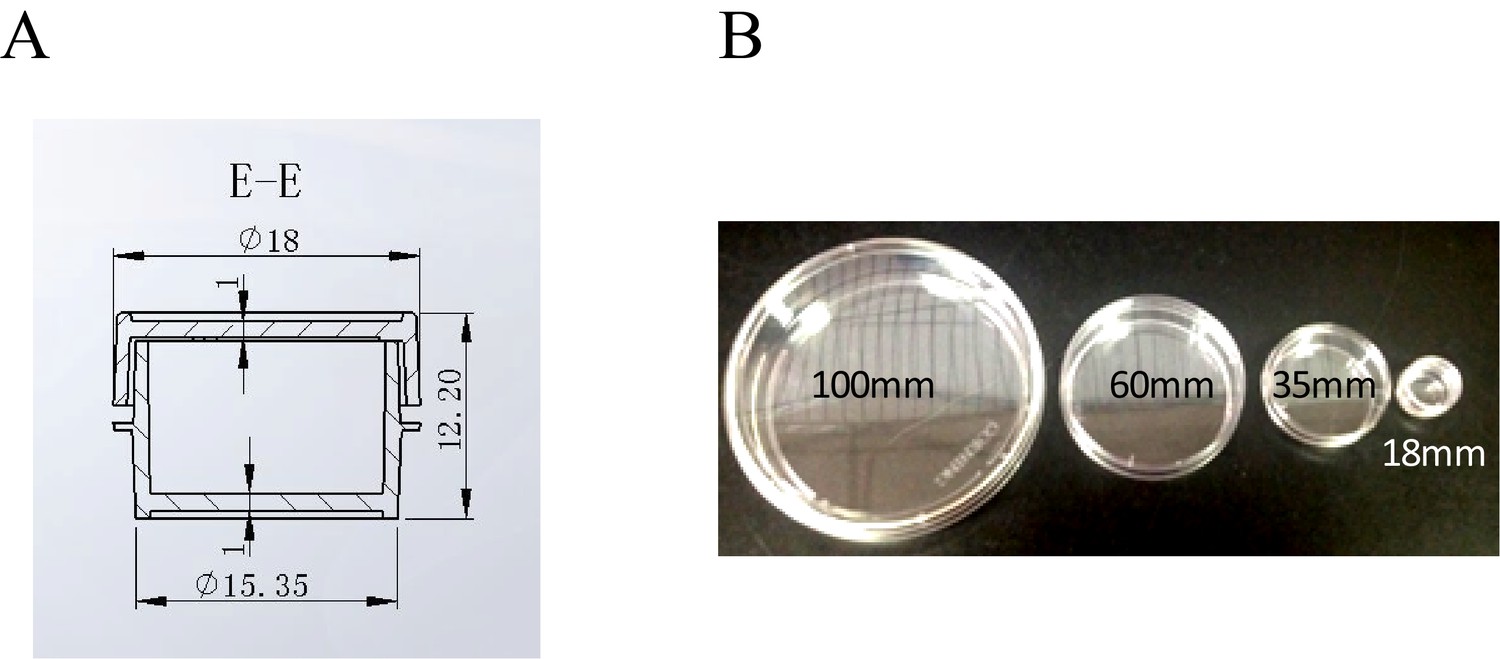
The design and actual picture of the 18 mm custom made cell culture plate.
(A) The design of the 18 mm plate. (B) The picture of the cell culture plates of different sizes. 100 mm, 60 mm and 35 mm plates were placed side-by-side in the bottom picture for size comparison. The smallest plate in the picture was the custom made 18 mm cell plate.
Figure 2 with 1 supplement
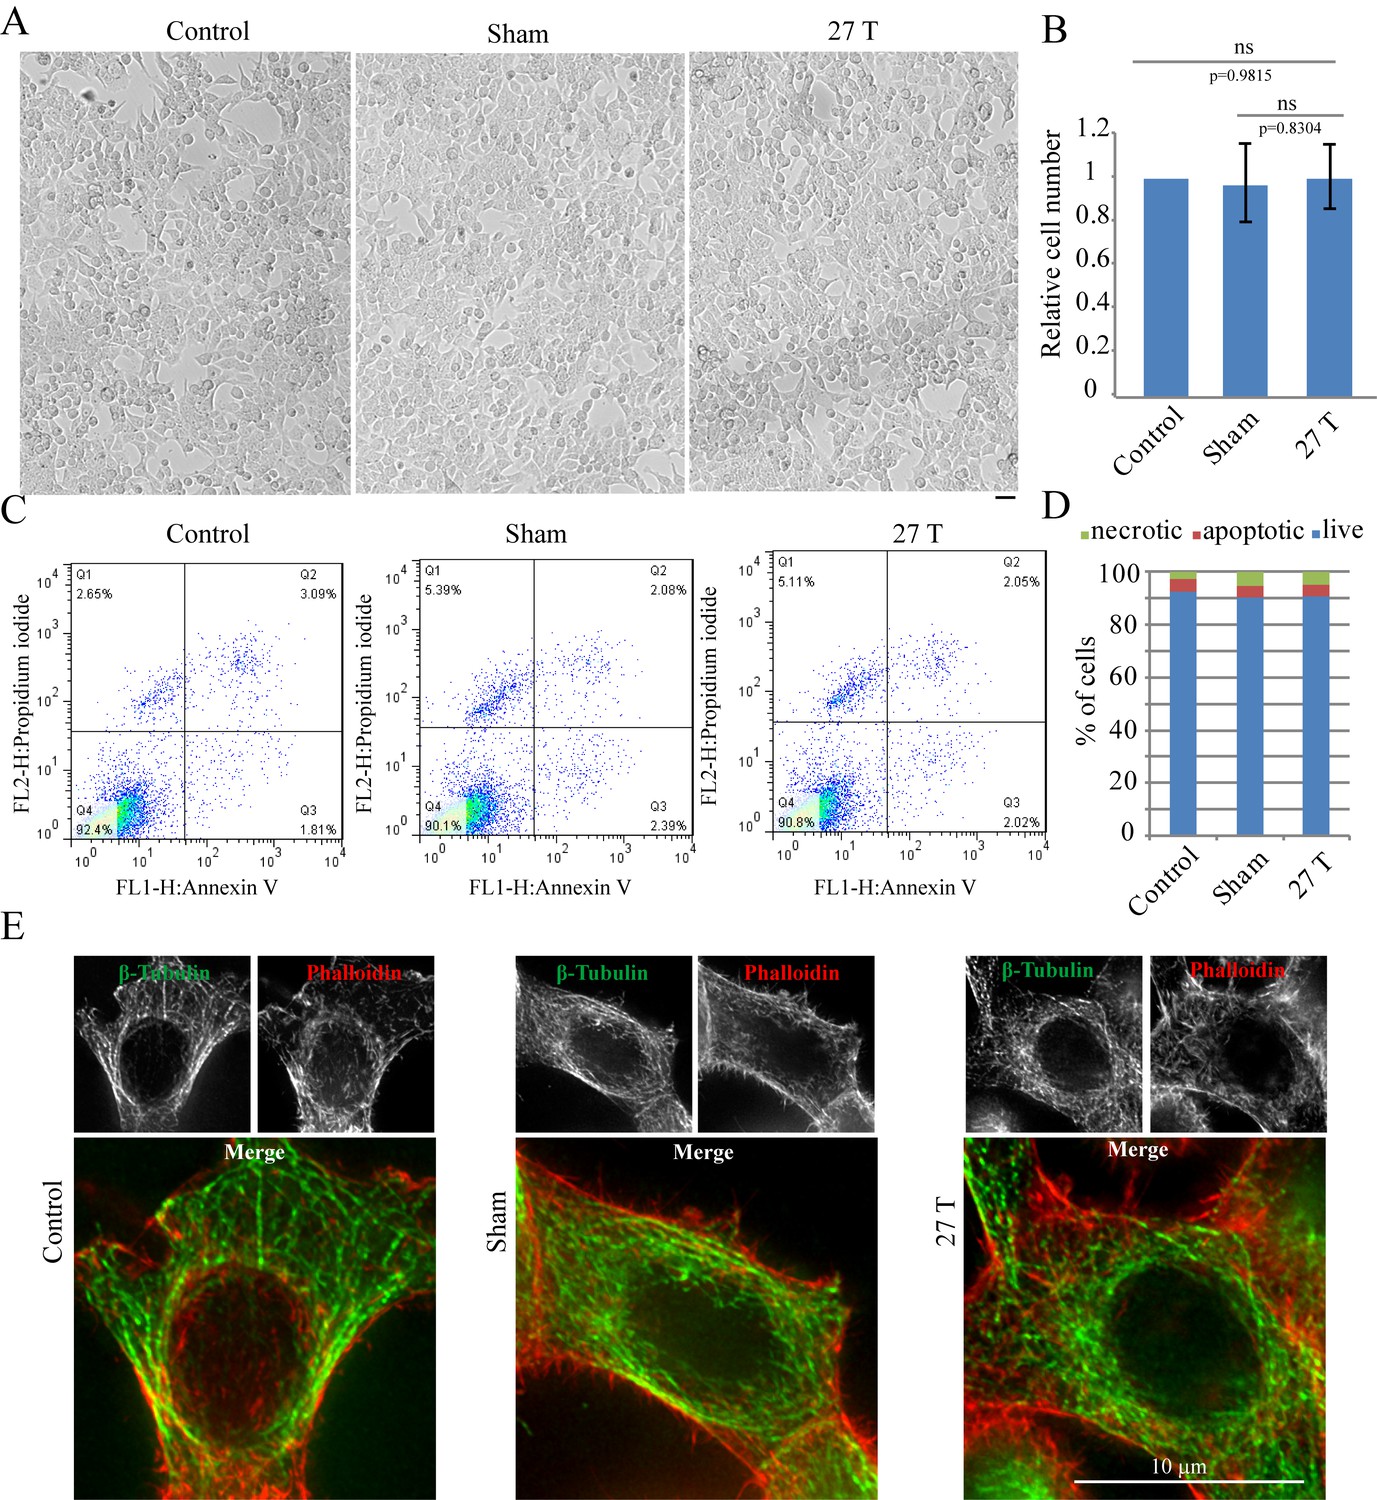
27 T Ultra-high magnetic field does not have immediate cytotoxicity effects in CNE-2Z cells.
CNE-2Z cells were plated directly on 18 mm tissue culture plate or coverslips in the18 mm tissue culture plate one night ahead to allow the cells to attach. On the day of experiment, they were placed in regular full-sized cell incubator (control) or the sample incubators in sham or in 27 T magnet for 4 hr before they were taken out and subjected to the following analysis. (A) Representative bright field images and of control, sham and 27 T SMF treated CNE-2Z cells. Scale bar: 20 μm. (B) Quantification of cell numbers in control, sham and 27 T SMF treated CNE-2Z cells from three independent experiments (n = 3). Data is mean ± SD. ‘ns’, not significant. (C) Flow cytometry results of CNE-2Z cells treated with control, sham or 27 T for 4 hr and dual staining with annexin V and PI. Bottom left leaflet shows the live cells that have intact cell membrane and have negative staining for both dyes. Top left leaflet shows necrotic cells. Right parts show apoptotic cells. (D) Quantification of cell numbers in each population. (E) Immunofluorescence of CNE-2Z cells shows that 27 T SMF does not have obvious effects on microtubule and actin cytoskeleton in interphase cells. CNE-2Z cells were fixed and stained with anti-tubulin antibody and fluorescently labeled phalloidin for microtubules (green) and actin (red) cytoskeleton. Experiments have been repeated for three times and representative images are shown in the figure. Scale bar: 10 μm.
-
Figure 2—source data 1
Quantification of cell numbers in control, sham and 27 T SMF treated CNE-2Z cells.
This is the source data for Figure 2B.
- https://doi.org/10.7554/eLife.22911.006
Figure 2—figure supplement 1
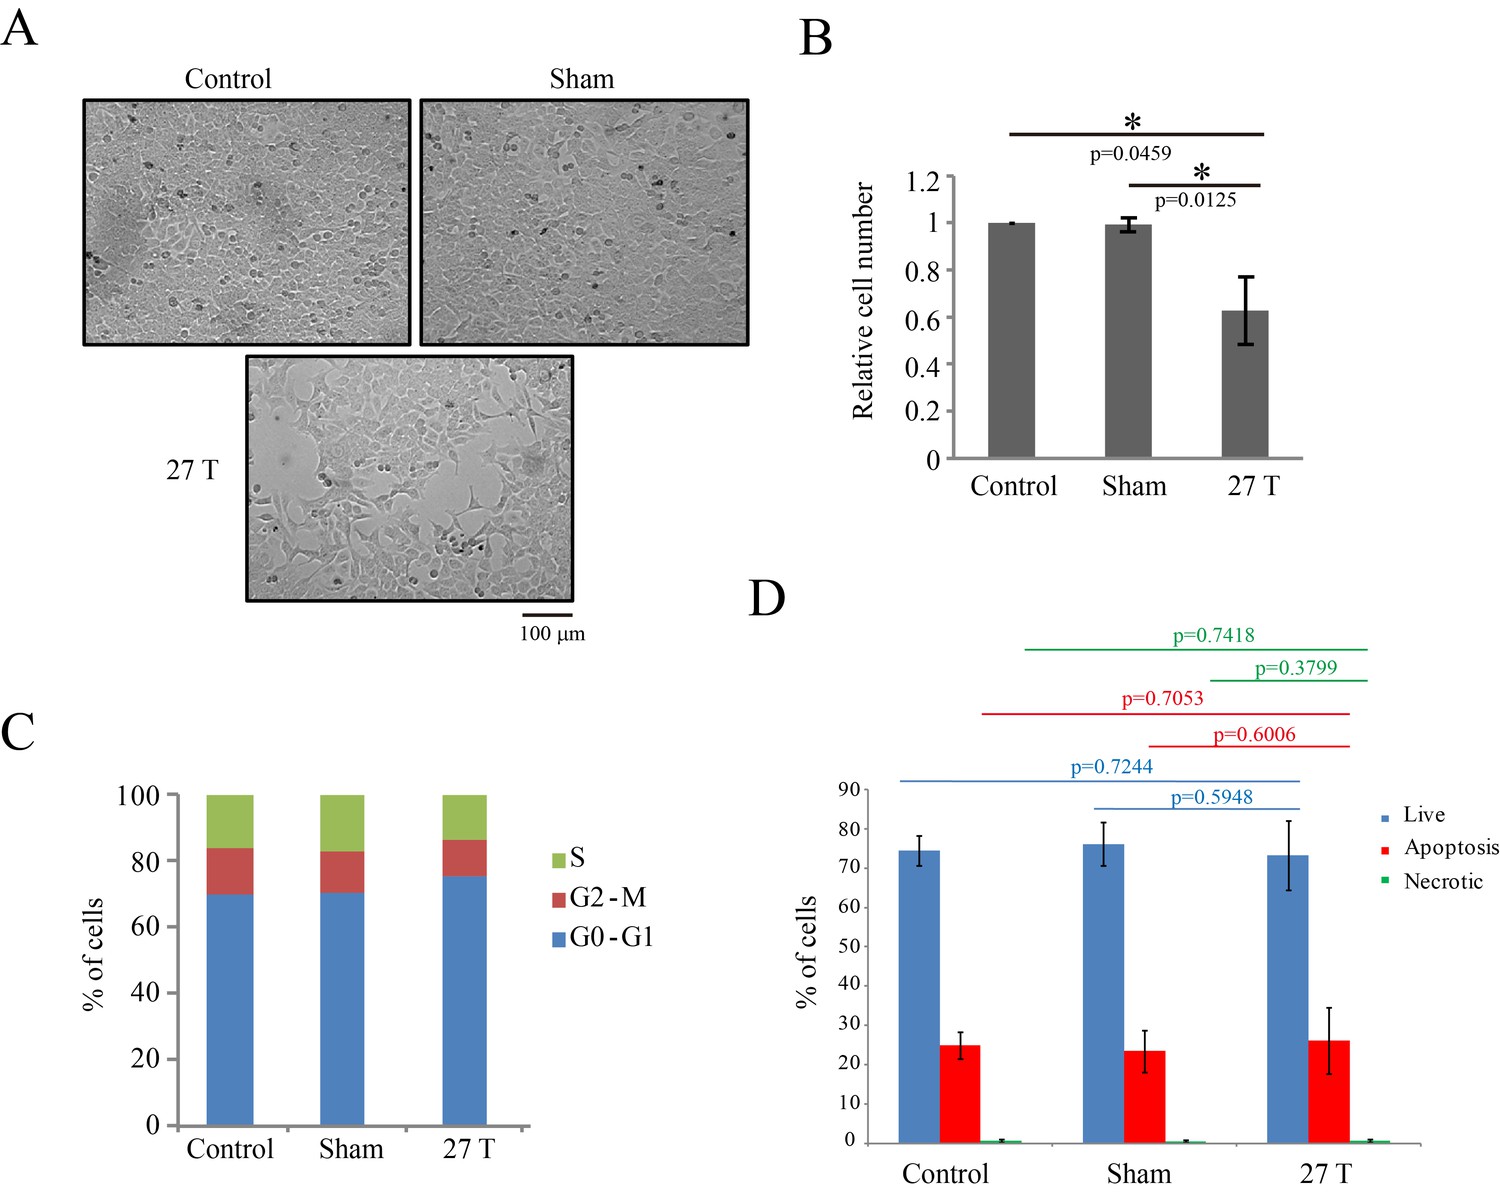
27 T SMF reduced CNE-2Z cell number three days post-exposure.
CNE-2Z cells were plated one night ahead to allow the cells to attach, exposed to 27 T SMF for 4 hr before they were taken out and returned back to the regular full sized cell incubator for another 3 days before they were subjected to the following analysis. (A) Representative bright field images and of control, sham and 27T SMF treated CNE-2Z cells. (B) Quantification of cell numbers in control, sham and 27 T SMF treated CNE-2Z cells from three independent experiments (n = 3). Data is mean ± SD. *p<0.05. (C) Flow cytometry cell cycle analysis shows the cell distribution in each cell cycle. (D) Flow cytometry results of CNE-2Z cells treated with control, sham or 27T for 4 hr and dual staining with annexin V and PI for cell death. Quantification of cell numbers in each cell population from three independent experiments (n = 3). Data is mean ± SD.
Figure 3 with 1 supplement
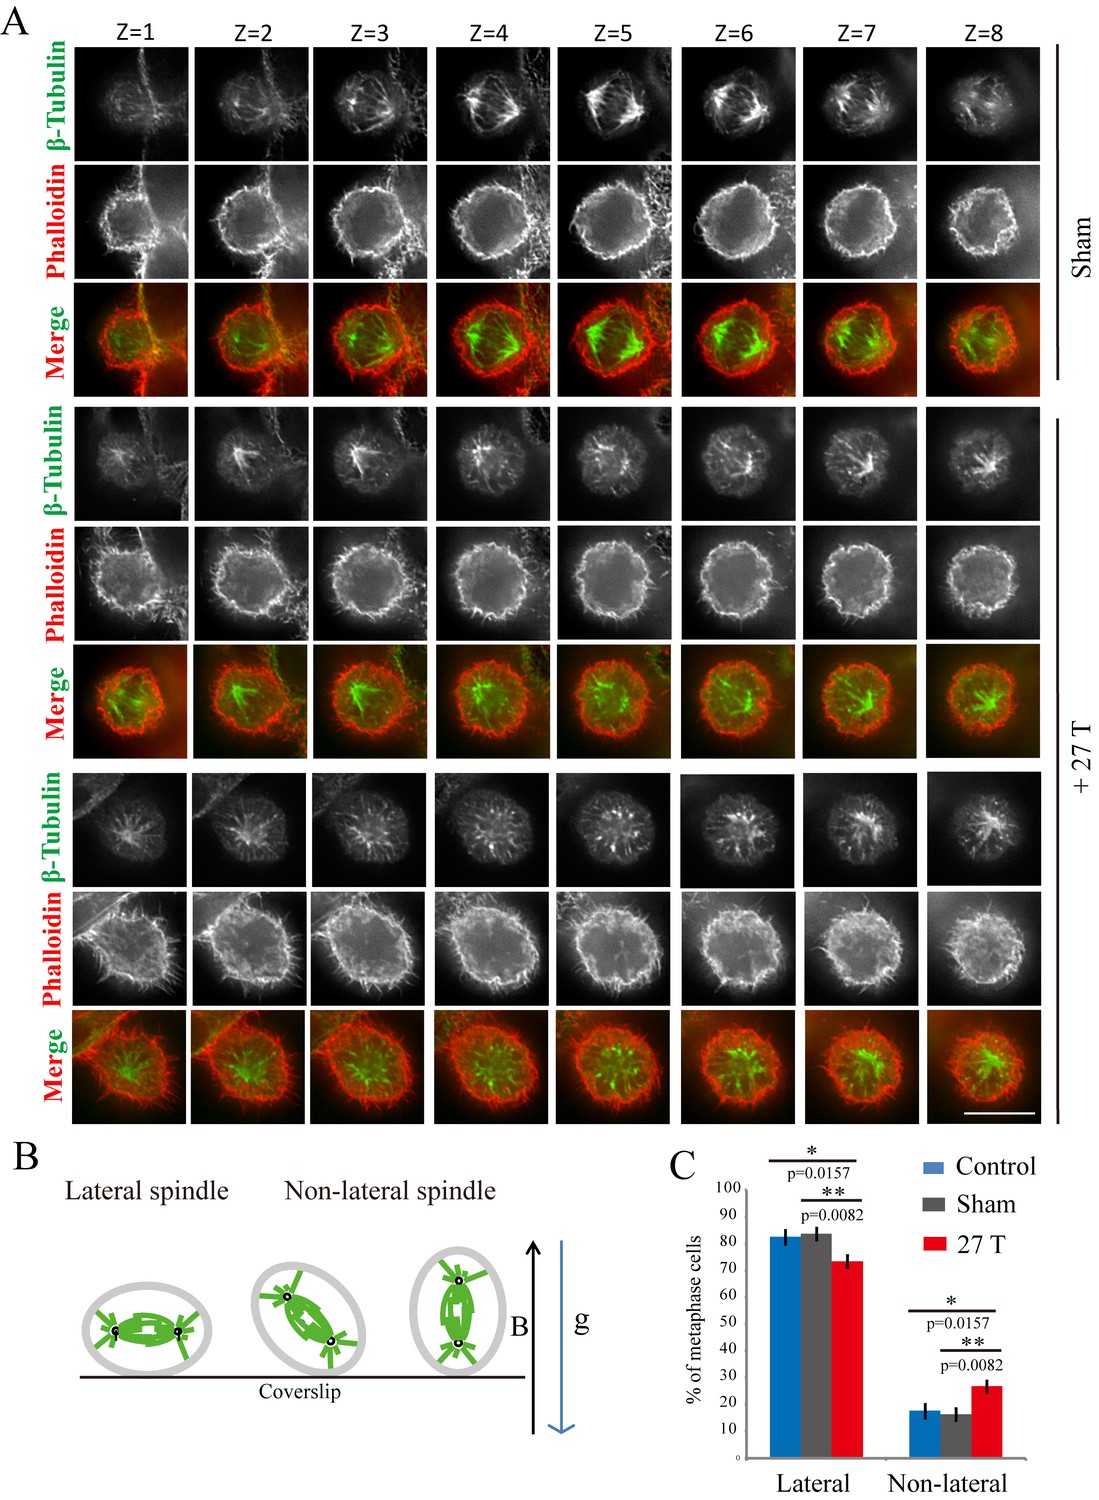
27 T SMF changed spindle orientation.
CNE-2Z cells were plated on coverslips in the 18 mm tissue culture plate one night ahead to allow the cells to attach. On the day of experiment, they were placed in regular full-sized cell incubator (control) or the sample incubators in sham or in 27 T magnet for 4 hr before they were taken out, fixed and stained with anti-tubulin antibody (for microtubules), phalloidin (for F-actin). (A) Representative immunofluorescence images of CNE-2Z cells show that 27 T SMF changes spindle orientation. Multistack images were taken and individual vertical image planes (Z) were displayed to show the spindle orientation. Microtubules are shown in green and F-actin filaments are shown in red. One cell in sham and two cells in 27 T SMF treated group are shown. (B) Illustration of spindles with different orientations. ‘B’ shows the magnetic field direction and ‘g’ shows the gravity direction. (C) Quantification of spindle orientations in control, sham or 27 T treated cells from four independent experiments (n = 4). Data is presented as mean ± SD. *p<0.05; **p<0.01. Total of 921 metaphase spindles were counted.
-
Figure 3—source data 1
Quantification of spindle orientations in control, sham or 27 T treated cells from four independent experiments.
This is the source data for Figure 3C.
- https://doi.org/10.7554/eLife.22911.009
Figure 3—figure supplement 1
Spindle orientation in prometaphase and metaphase CNE-2Z cells were changed by 27 T SMF.
Quantification of spindle orientations in control, sham or 27 T treated cells from four independent experiments (n = 4). Data is presented as mean ± SD. Both prometaphase and metaphase cells were quantified. Total of 1447 spindles were measured. **p<0.01.
Figure 4

SMFs affected spindle orientation in a field intensity dependent manner.
CNE-2Z cells were plated on coverslips in the 35 mm or 24 well tissue culture plate one night ahead to allow the cells to attach. On the day of experiment, they were exposed to different intensity SMFs for different time before they were taken out, fixed and stained with anti-tubulin antibody (for microtubules) and DAPI (for DNA). (A) 0.05 T and 1 T moderate intensity SMF exposure experimental set-up. Permanent magnets were placed inside a regular full-sized cell incubator to ensure proper culture conditions. Cell culture plate was placed on the top surface center of the magnet. (B–F) Quantification of spindle orientations in control, 0.05 T, 1 T or 9 T treated cells. Total of 200–300 metaphase spindles from 3–4 independent coverslips were examined for each condition. Data is presented as mean ± SD. ‘ns’, not significant; *p<0.05.
-
Figure 4—source data 1
Quantification of spindle orientations in control, 0.05 T or 1 T treated cells (4 hr treatment).
This is the source data for Figure 4B.
- https://doi.org/10.7554/eLife.22911.012
-
Figure 4—source data 2
Quantification of spindle orientations in control, or 9 T treated cells (4 hr treatment).
This is the source data for Figure 4C.
- https://doi.org/10.7554/eLife.22911.013
-
Figure 4—source data 3
Quantification of spindle orientations in control, 0.05 T or 1 T treated cells (3d treatment).
This is the source data for Figure 4D.
- https://doi.org/10.7554/eLife.22911.014
-
Figure 4—source data 4
Quantification of spindle orientations in control, or 9 T treated cells (3d treatment).
This is the source data for Figure 4E.
- https://doi.org/10.7554/eLife.22911.015
-
Figure 4—source data 5
Quantification of spindle orientations in control, 0.05 T or 1 T treated cells (7d treatment).
This is the source data for Figure 4F.
- https://doi.org/10.7554/eLife.22911.016
Figure 5 with 3 supplements
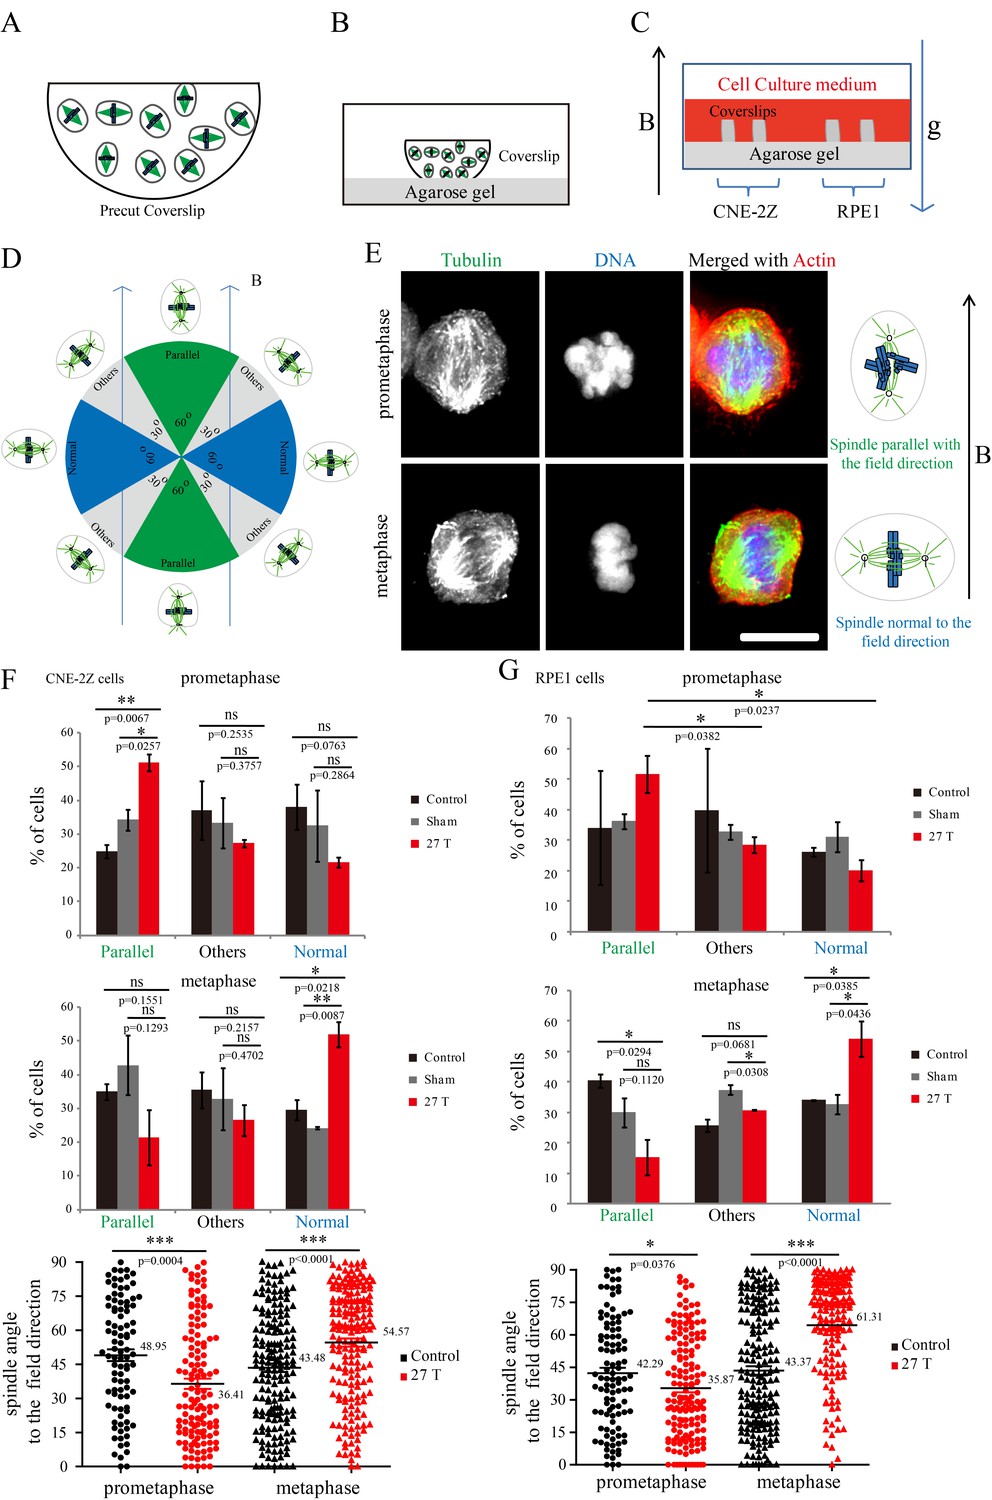
Prometaphase and metaphase spindles have different orientations in 27 T SMFs.
(A–C) Schematic illustration of the experimental set-up. (A) CNE-2Z and RPE1 cells were plated on pre-cut coverslips one night ahead to allow the cells to attach. (B) On the day of experiment, the coverslips were inserted onto agarose gel in the 18 mm plates. (C) Cells were treated with or without synchronization, and with or without 27 T magnetic field for 4 hr before they were fixed and stained with anti-tubulin antibody (for microtubules) and fluorescently labeled phalloidin (for actin polymer) and DAPI (for DNA). ‘B’ shows the magnetic field direction and ‘g’ shows the gravity direction. (D) The orientation of the spindle long axis was measured and characterized into ‘parallel’ (green), ‘normal’ (blue) and ‘others’ (grey) according to the angle between spindle long axis and the magnetic field direction. (E) Representative immunofluorescence images of prometaphase and metaphase RPE1 cells that have different orientation when they were exposed to 27 T SMF for 4 hr. Scale bar: 10 μm. (F, G) Quantification of prometaphase and metaphase spindle orientations in control, sham or 27 T treated CNE-2Z (F), and RPE1 (G) cells. One experiment was done in synchronized cells and the other was done with unsynchronized. Total of 1575 spindles were measured from four independent coverslips from two independent experiments. The histograms were created in excel (mean ± SD). Scatter plots were created in GraphPad (mean ± SEM). *p<0.05, **p<0.01, ***p<0.005.
-
Figure 5—source data 1
Quantification of prometaphase and metaphase spindle orientations in control, sham or 27 T treated CNE-2Z cells.
This is the source data for Figure 5F.
- https://doi.org/10.7554/eLife.22911.018
-
Figure 5—source data 2
Quantification of prometaphase and metaphase spindle orientations in control, sham or 27 T treated RPE1 cells.
This is the source data for Figure 5G.
- https://doi.org/10.7554/eLife.22911.019
Figure 5—figure supplement 1
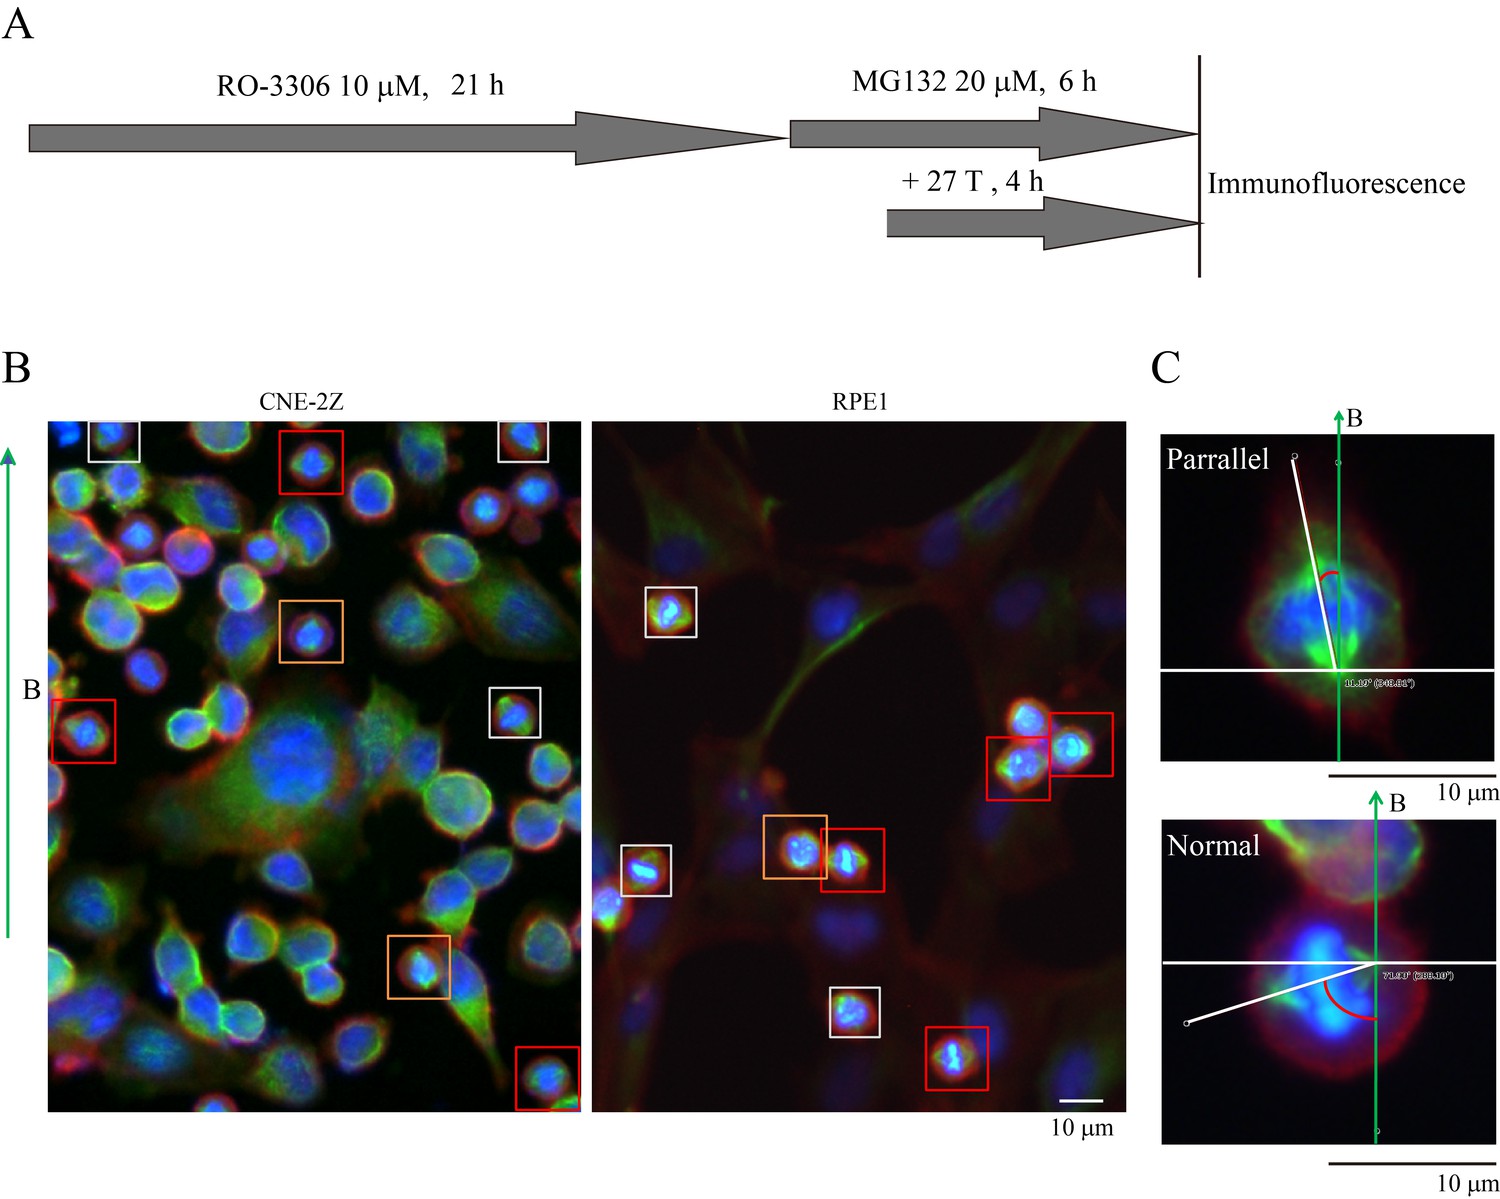
Synchronization procedure to enrich mitotic cells and spindle orientation measurement.
(A) Schematic illustration of the experimental procedure. (B) Representative immunofluorescence images of CNE-2Z and RPE1 cells show that 27 T SMF changes spindle orientation. Spindles with different orientations were labeled by boxes with different colors. Orange indicates parallel to the field direction; Red indicates normal to the field directions; Gray indicates others that are not parallel or vertical to the field direction. Scale bar: 10 μm. (C) The angle between spindles and the magnetic field direction was measured. The angles were measured by drawing a line between the two spindle poles and a line for the field direction.
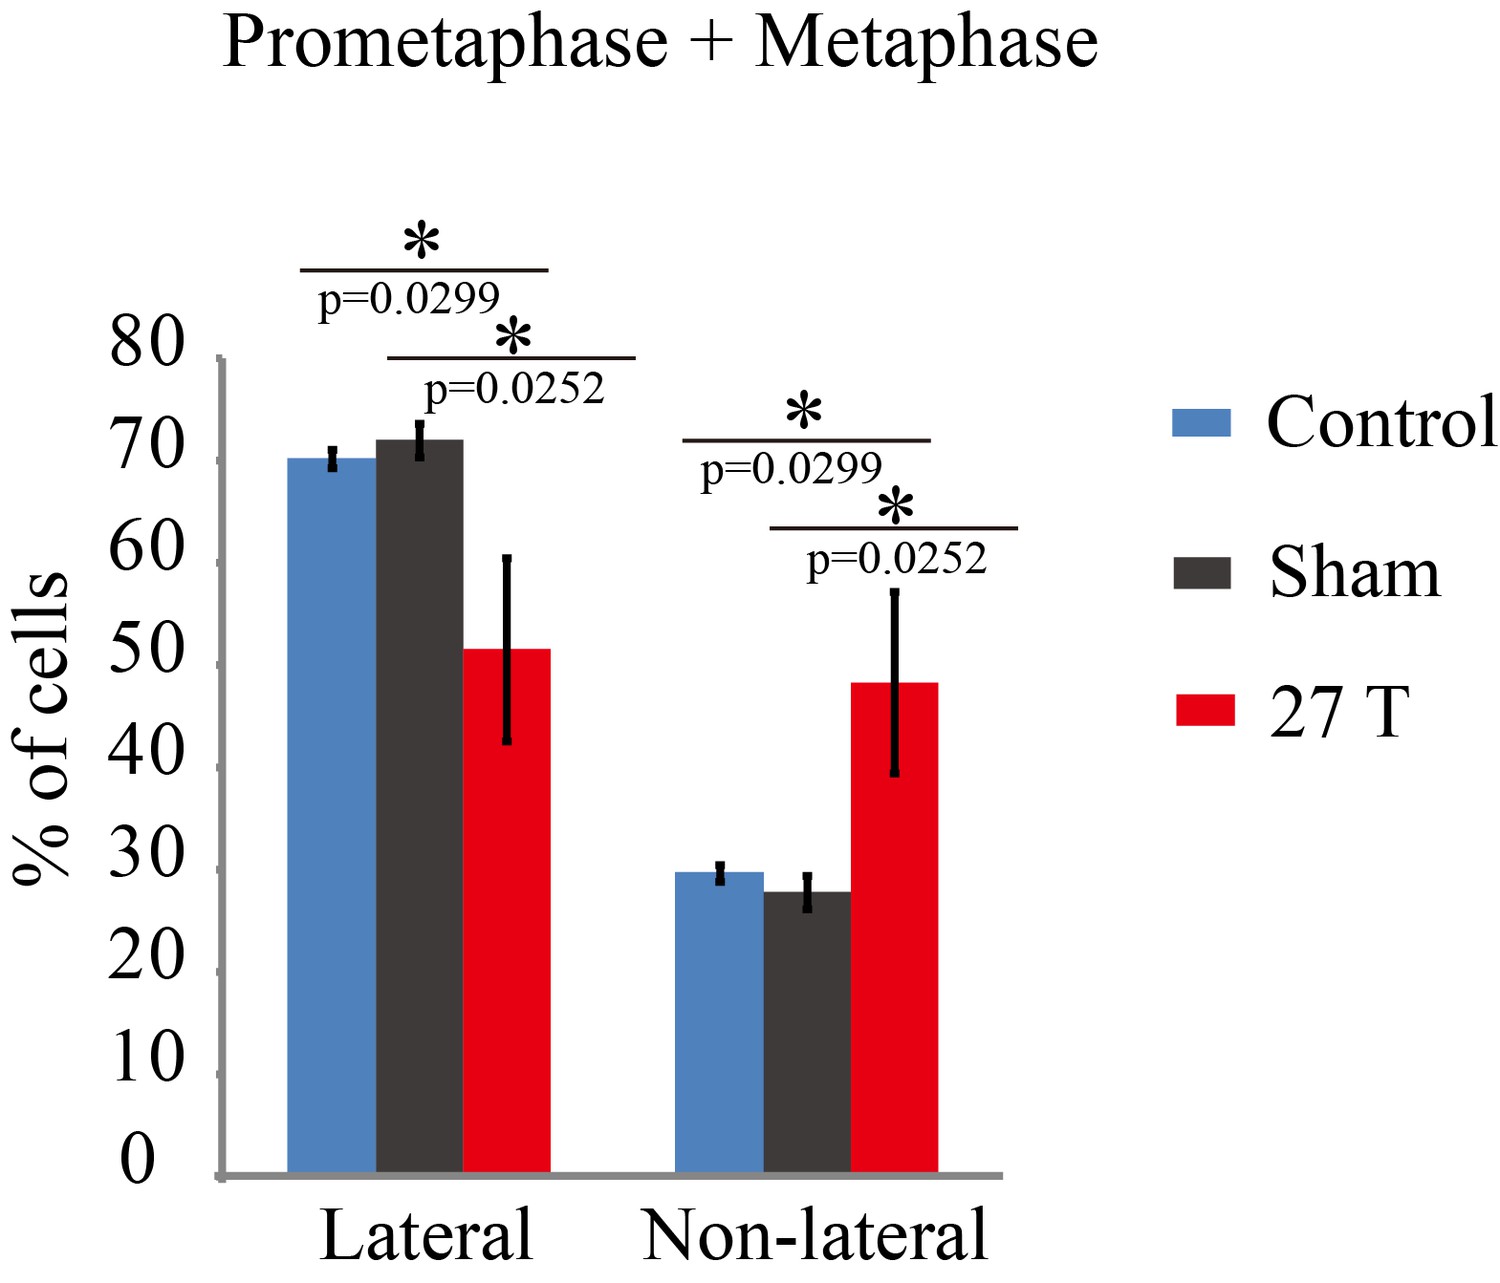
Figure 5—figure supplement 2
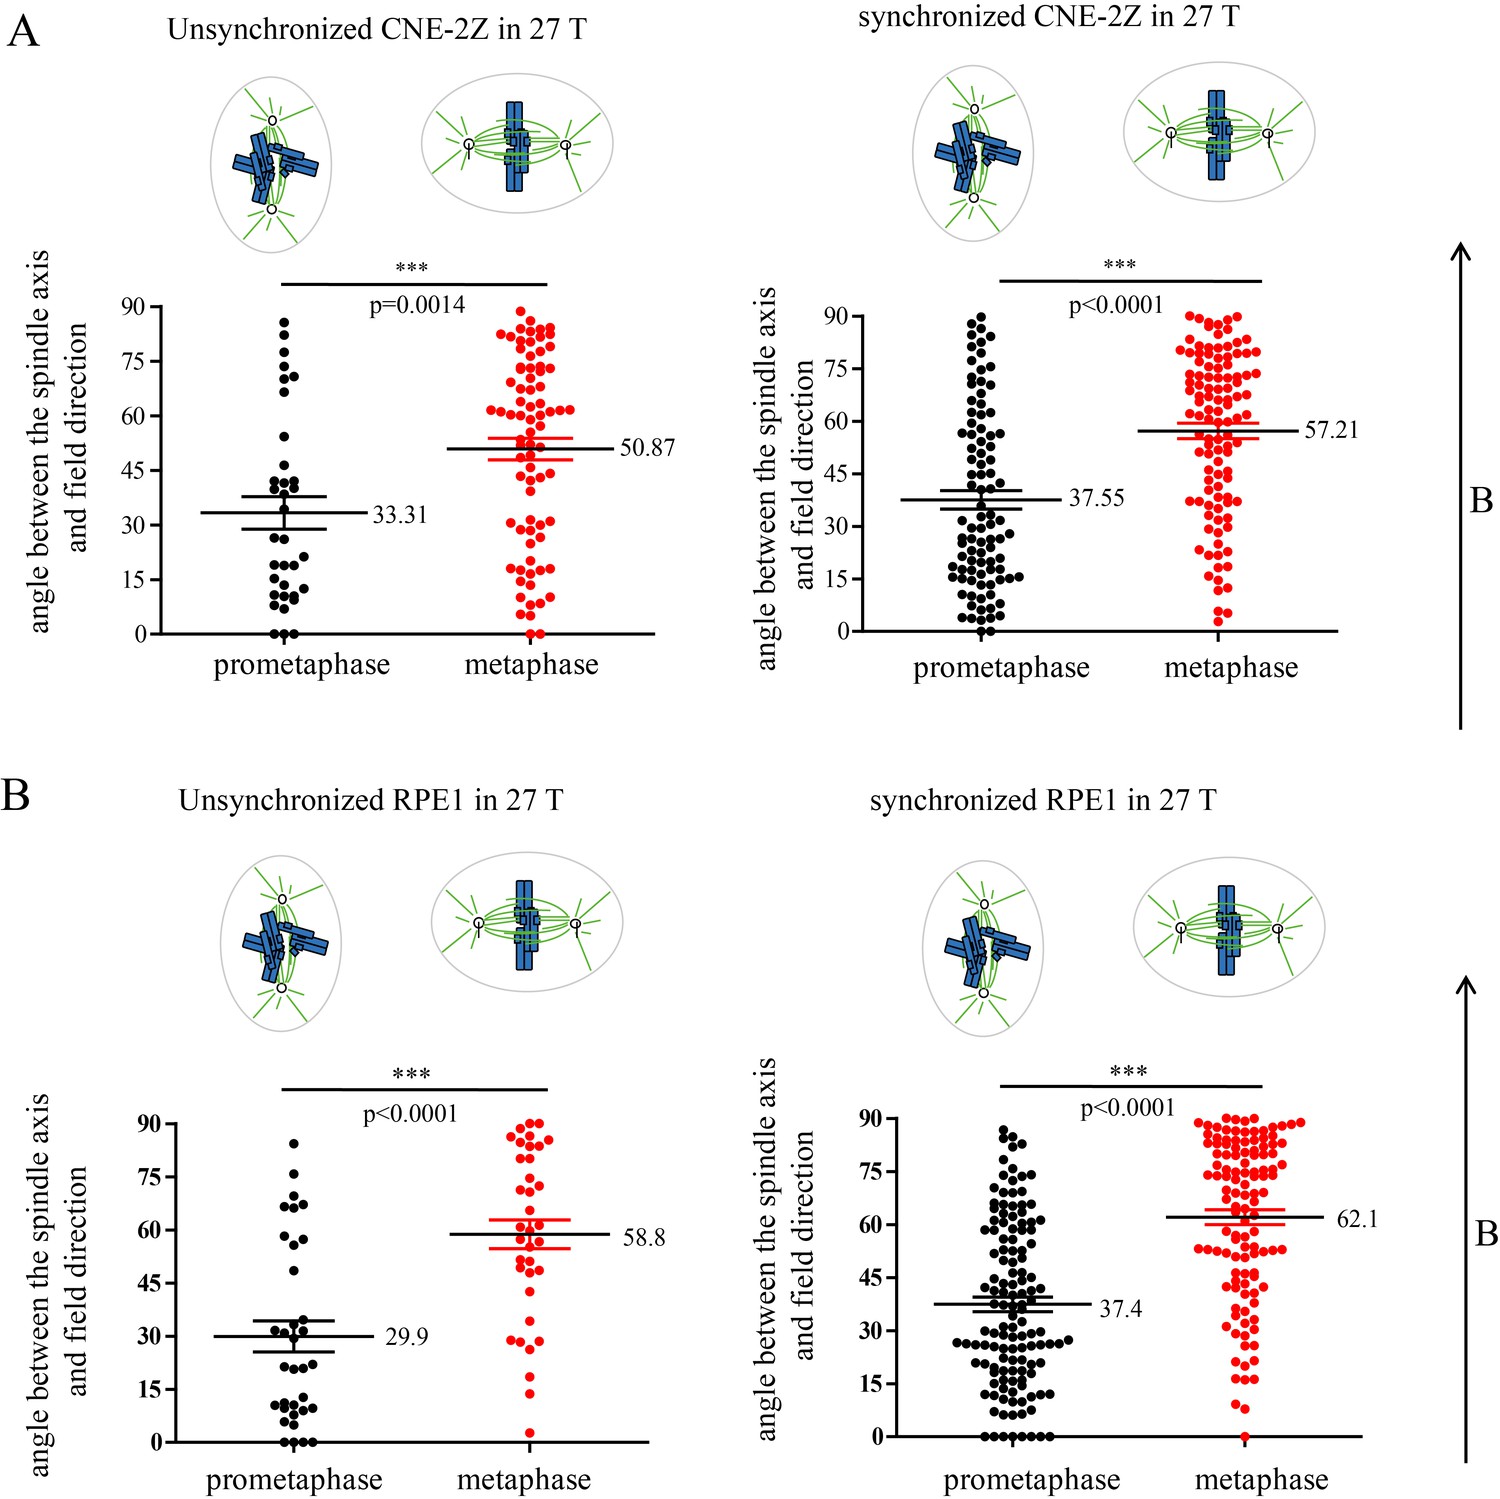
Prometaphase and metaphase cells show different orientation in both synchronized and unsynchronized CNE-2Z and RPE1 cells after 27 T SMF exposure for 4 hr.
Quantification of prometaphase and metaphase spindle orientations in 27 T treated CNE-2Z (A) and RPE1 (B) cells from four independent coverslips from an unsynchronized or synchronized experiment. One dot represents one spindle. Data is mean ± SEM. ***p<0.005.
Figure 5—figure supplement 3
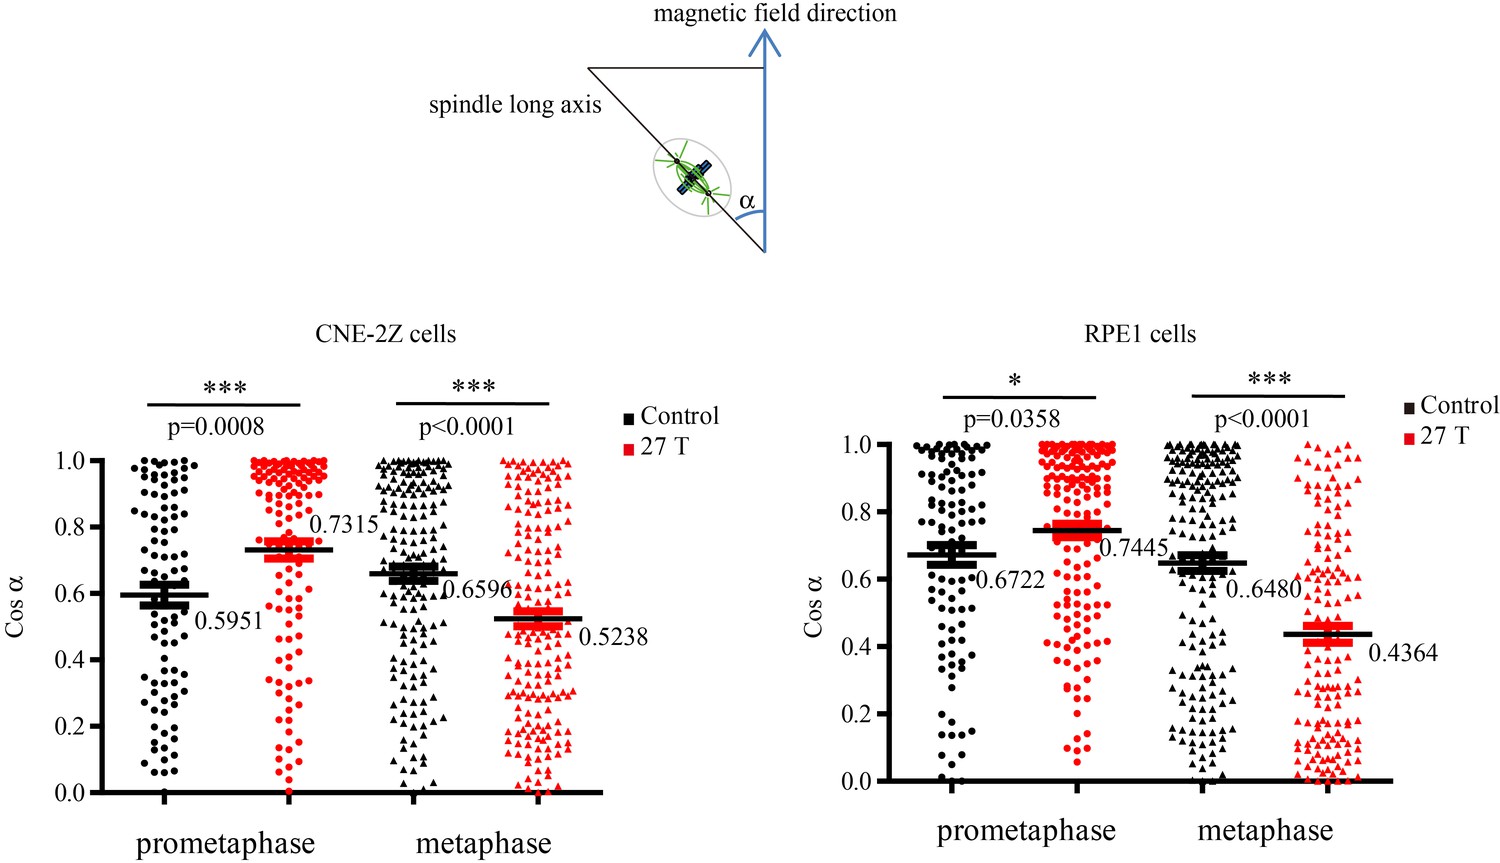
Cosinus of angles between spindle long axis and the 27 T magnetic field direction.
The calculation was based on Figure 5F and G.
Figure 6 with 2 supplements
Chromosome alignment affects spindle orientation.
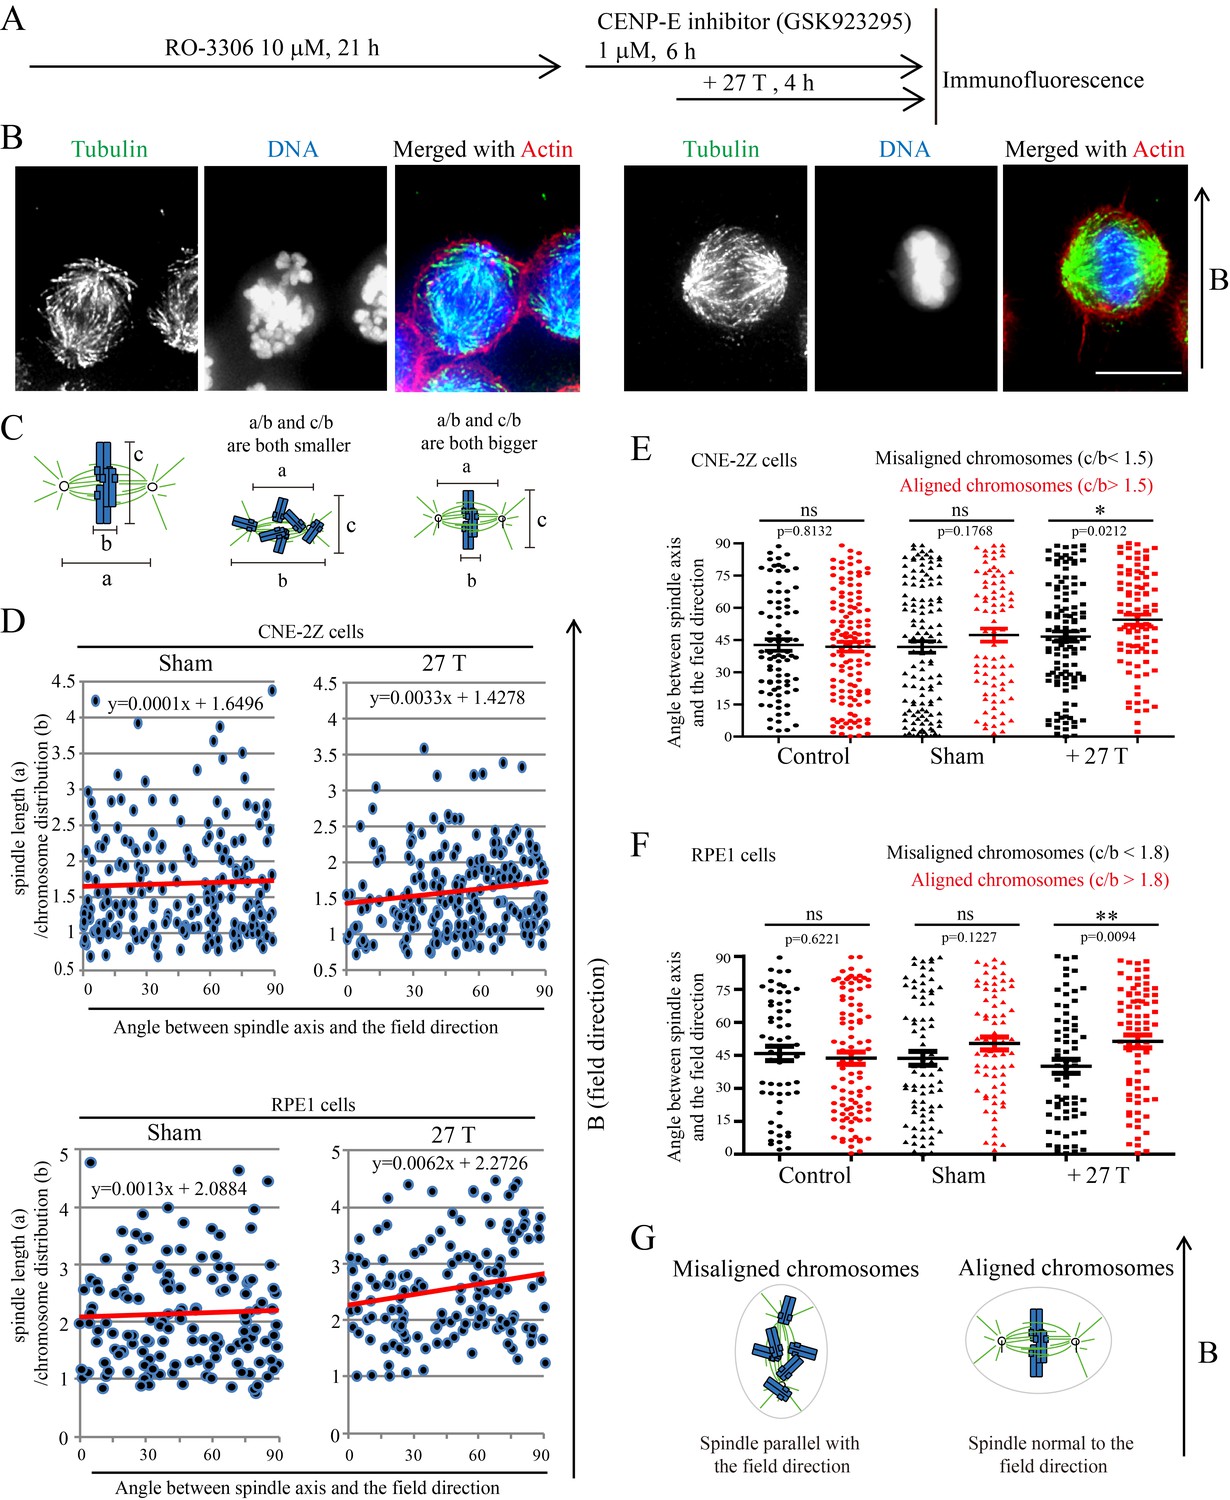
CNE-2Z and RPE1 cells were treated with RO-3306 and the CENP-E inhibitor (GSK923295) before they were exposed to 27 T SMF for 4 hr. Cells were then harvested for Immunofluorescence experiment. (A) Schematic illustration of the experimental procedure. (B) Representative immunofluorescence images show that CNE-2Z cells with misaligned chromosomes prefer to align with their spindle long axis in parallel with the magnetic field direction (upward) but the cells with well aligned chromosomes prefer to align their chromosome plate in parallel, with the spindle long axis normal to, the magnetic field direction. Scale bar: 10 μm. (C) Schematic illustration of the spindle and chromosome measurement. ‘a’ is the spindle length, defined as the distance between two spindle poles. ‘b’ is the chromosome distribution, defined by the maximum distance between chromosomes along the spindle long axis. ‘c’ is the metaphase plate width. Measurements were done in Adobe Photoshop. (D) The 27 T SMF affects the angle between spindle long axis with magnetic field direction in CNE-2Z and RPE1 cells, which is determined by chromosome distribution. Sham and 27 T groups are shown in the figure. Control groups are shown in the figure supplement due to space limitation. (E, F) Quantification of the angle between spindle long axis with the magnetic field direction in CNE-2Z (E) or RPE1 (F) cells in control, sham control or 27 T SMF treated group to compare the difference between spindles with misaligned vs. aligned chromosomes. ‘Misaligned chromosomes’ were defined as c/b <1.5 (CNE-2Z cells) or 1.8 (RPE1 cells) and ‘Aligned chromosomes’ were defined as c/b >1.5 (CNE-2Z cells) or 1.8 (RPE1 cells). Quantifications for D-F were from total of 618 CNE-2Z spindles and 452 RPE1 spindles. Spindles for each cell type were from four independent coverslips in two independent days. Data is mean ± SEM. ‘ns’, not significant; *p<0.05; **p<0.01. (G) Cartoon illustrates that spindles with misaligned chromosomes tend to align along the magnetic field direction (B, upward) while spindles with compact metaphase plate tend to align normal to the field direction.
-
Figure 6—source data 1
The 27 T SMF affects the angle between spindle long axis with magnetic field direction in CNE-2Z and RPE1 cells, which is determined by chromosome distribution.
This is the source data for Figure 6D.
- https://doi.org/10.7554/eLife.22911.024
-
Figure 6—source data 2
Quantification of the angle between spindle long axis with the magnetic field direction in CNE-2Z cells in control, sham control or 27 T SMF treated group to compare the difference between spindles with misaligned vs. aligned chromosomes.
This is the source data for Figure 6E.
- https://doi.org/10.7554/eLife.22911.025
-
Figure 6—source data 3
Quantification of the angle between spindle long axis with the magnetic field direction in RPE1 cells in control, sham control or 27 T SMF treated group to compare the difference between spindles with misaligned vs. aligned chromosomes.
This is the source data for Figure 6F.
- https://doi.org/10.7554/eLife.22911.026
Figure 6—figure supplement 1
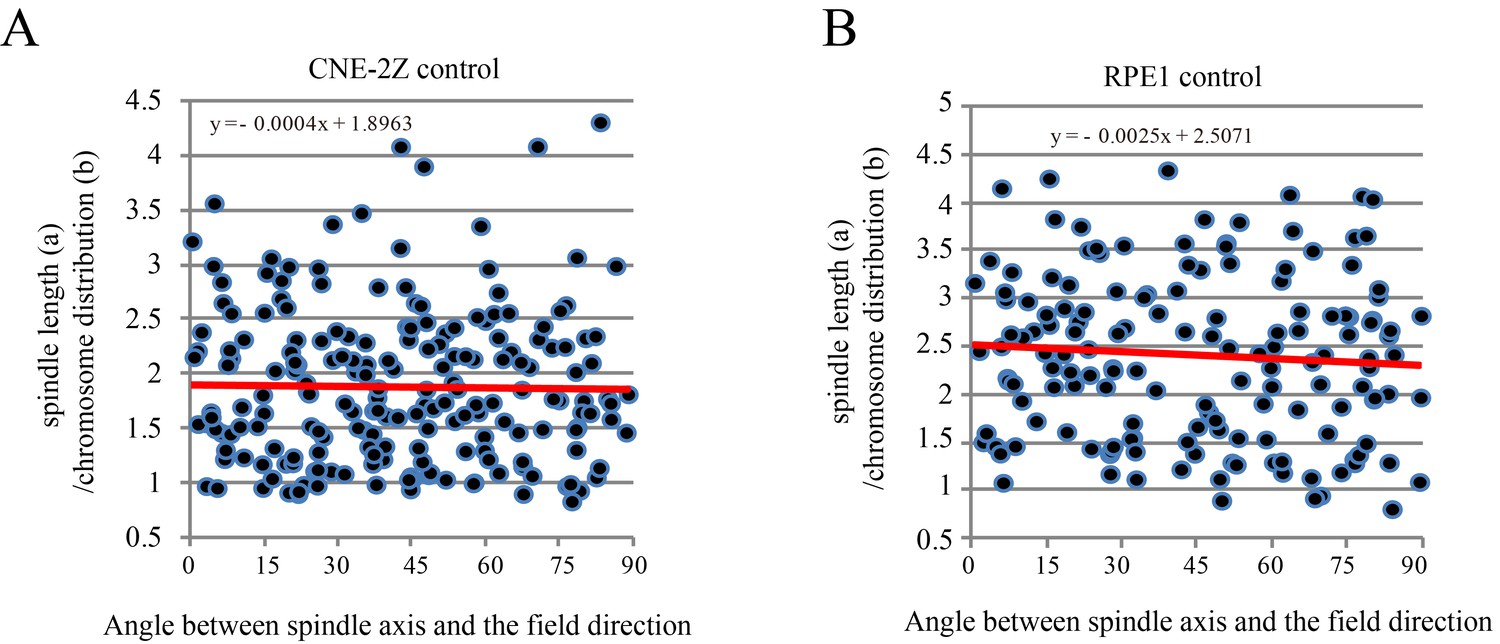
The chromosome distribution and angle between spindle long axis and the magnetic field/gravity direction in control CNE-2Z and RPE1 cells.
These are the control groups of Figure 6D.
Figure 6—figure supplement 2
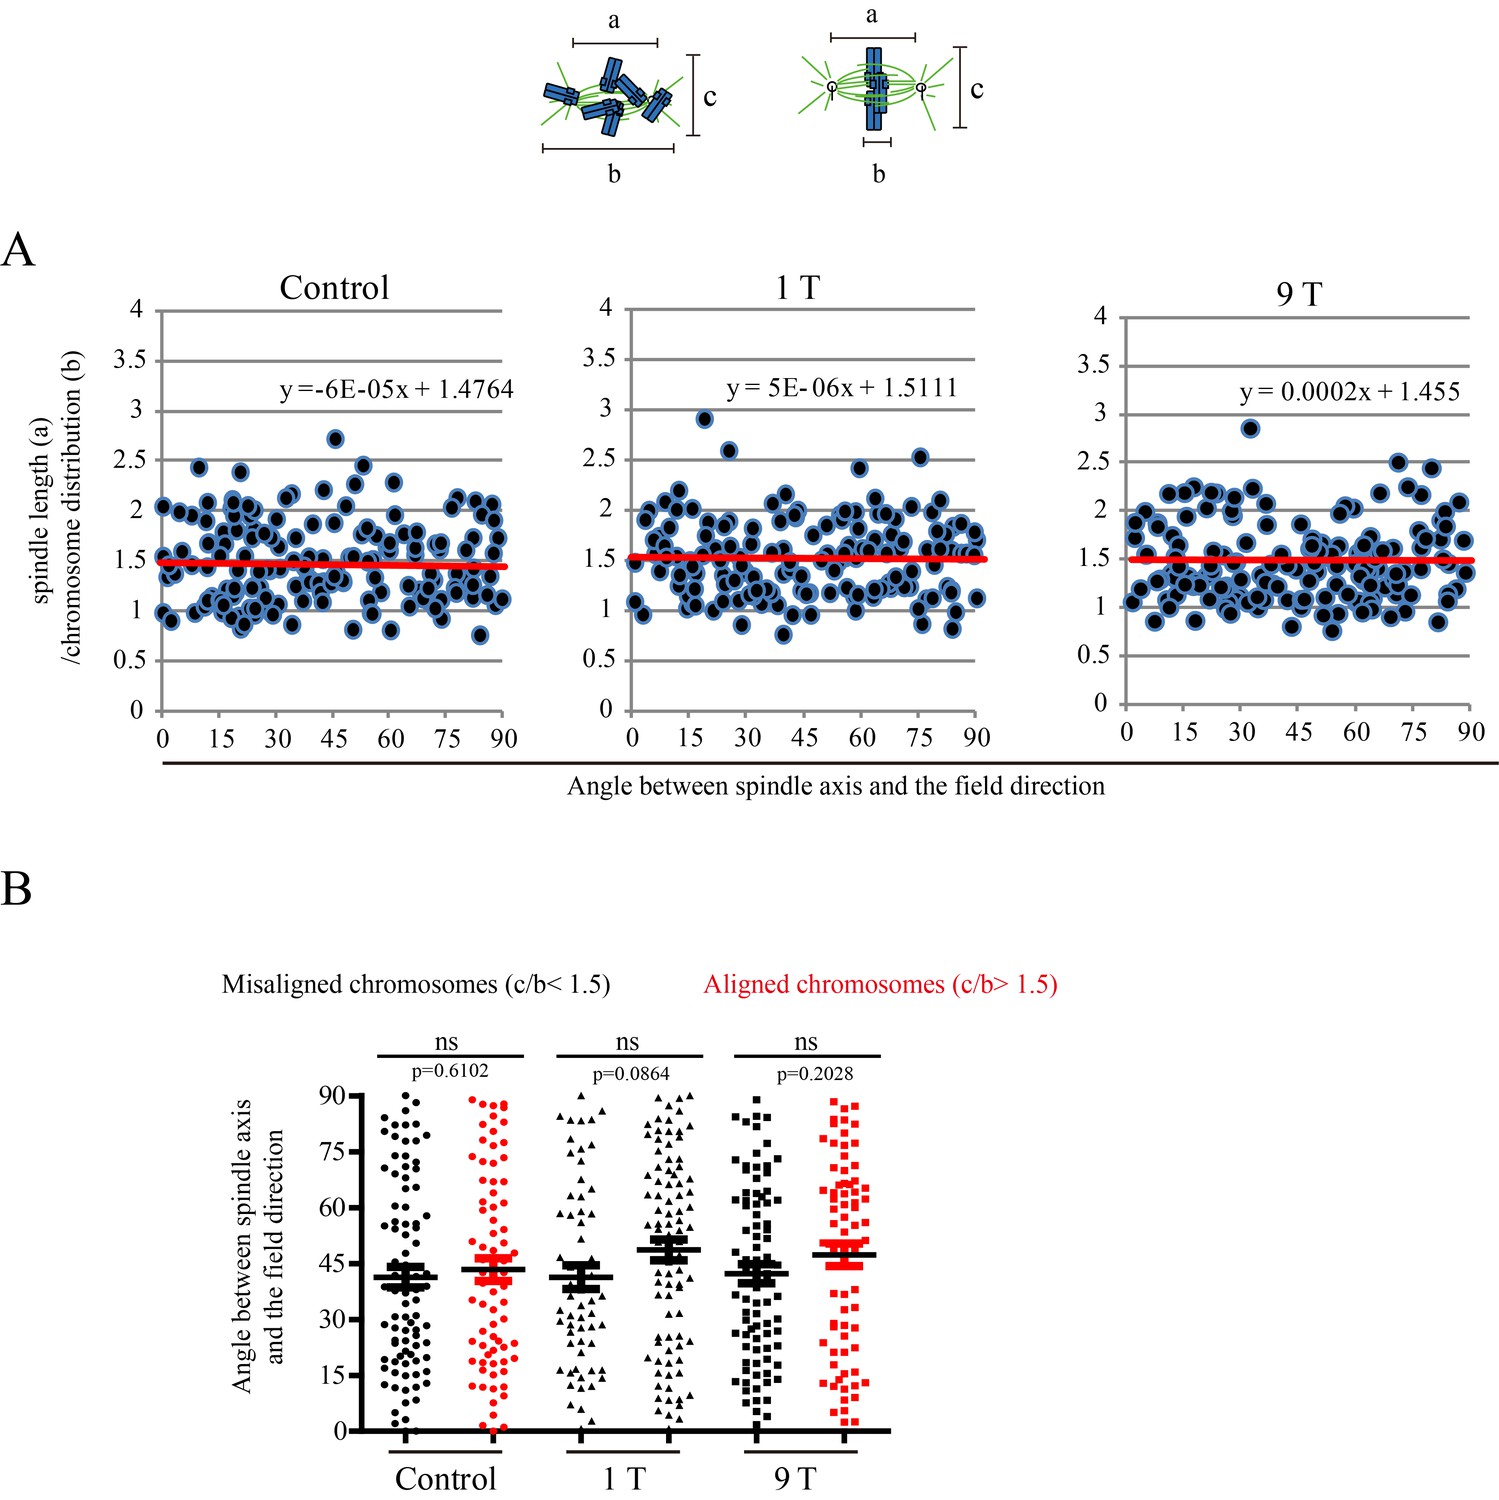
SMFs of 1 T and 9 T did not affect spindle orientation in CNE-2Z cells.
Similar to Figure 6, ‘a’ is the spindle length, defined as the distance between two spindle poles. ‘b’ is the chromosome distribution, defined by the maximum distance between chromosomes along the spindle long axis. a/b value reflects the chromosome distribution within the spindle. (A) The angle between spindle long axis with the magnetic field direction was not affected by 1 T and 9 T SMFs or the chromosome distribution within the spindle; (B) The angle between spindle long axis with the magnetic field direction was not affected by chromosome alignment in 1 T and 9 T SMFs. Quantifications were from total of 466 CNE-2Z spindles from four independent coverslips in two independent days. Data is mean ± SEM. ‘ns’, not significant.
Figure 7 with 2 supplements

27 T SMF changes spindle morphology in both CNE-2Z and RPE1 cells.
(A) Representative immunofluorescence images of CNE-2Z and RPE1 cells with or without 27 T SMF treatment for 4 hr. Scale bar: 5 μm. (B) Illustration of the pole angle measurement of the metaphase spindles in CNE-2Z and RPE1 cells with or without 27 T SMF treatment for 4 hr. ‘1’ measures the pole angle of metaphase spindles in parallel to the magnetic field/gravity direction (green) and ‘2’ measures the pole angle of metaphase spindles normal to the magnetic field/gravity direction (blue). Scale bar: 5 μm. (C) Quantification of the metaphase spindle pole angle measurement for synchronized CNE-2Z and RPE1 cells with or without 27 T SMF. RO-3306 and MG132 synchronization was used to increase the percentage of mitotic cells. Total of 295 metaphase spindles were measured from four independent coverslips. Data is mean ± SEM. (D) Quantification of the spindle width for RO-3306 and CENP-E inhibitor treated CNE-2Z and RPE1 cells. Experimental procedure was as shown in Figure 5A. Sham and 27 T treated groups are shown here and the control groups are shown in Figure 7—figure supplement 2C,D. (E) Illustration of the spindle and chromosome measurement. (F) Quantification of the relationship between spindle morphology and chromosome alignment in CENP-E inhibitor treated CNE-2Z cells that have spindle axis normal to the magnetic field/gravity direction (angle of 80–90 degree). Misaligned chromosomes (black) vs. aligned chromosomes (red) were classified by different c/b ratio values. Measurement was done on spindles from four independent coverslips from two independent experiments. Data is mean ± SEM. ‘ns’, not significant; *p<0.05; ***p<0.005.
-
Figure 7—source data 1
Quantification of the metaphase spindle pole angle measurement for synchronized CNE-2Z and RPE1 cells with or without 27 T SMF.
This is the source data for Figure 7C.
- https://doi.org/10.7554/eLife.22911.030
-
Figure 7—source data 2
Quantification of the spindle width for RO-3306 and CENP-E inhibitor treated CNE-2Z and RPE1 cells.
This is the source data for Figure 7D.
- https://doi.org/10.7554/eLife.22911.031
-
Figure 7—source data 3
Quantification of the relationship between spindle morphology and chromosome alignment in CENP-E inhibitor treated CNE-2Z cells that have spindle axis normal to the magnetic field/gravity direction (angle of 80–90 degree).
This is the source data for Figure 7F.
- https://doi.org/10.7554/eLife.22911.032
Figure 7—figure supplement 1
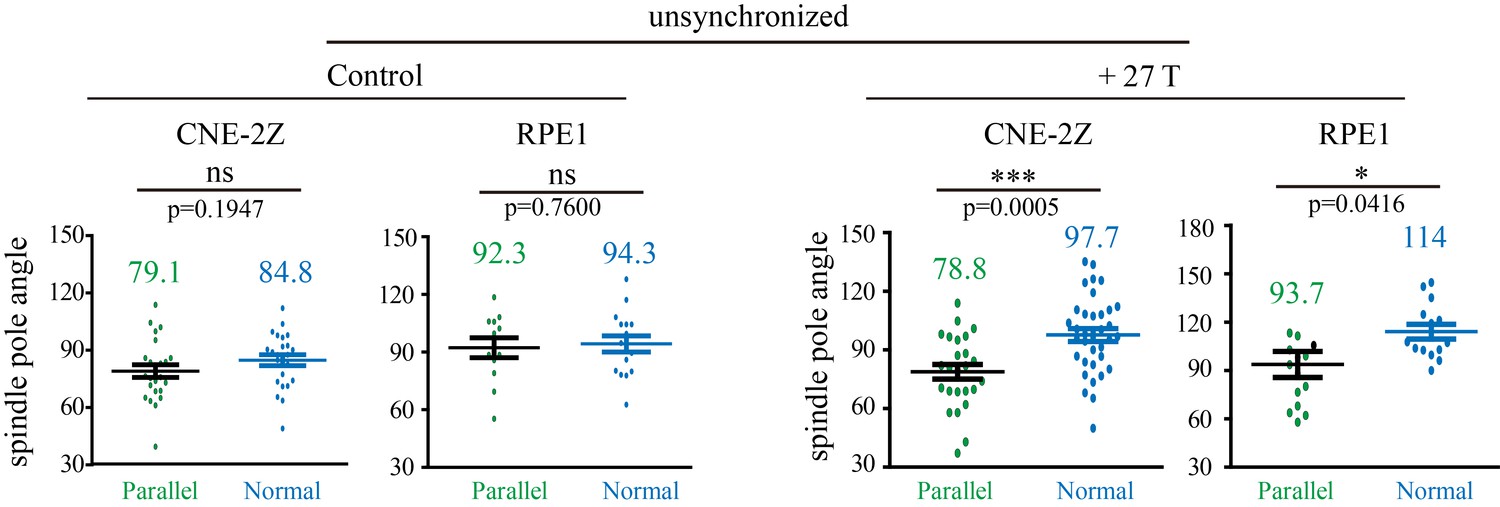
Quantification of the spindle pole angle measurement in unsynchronized CNE-2Z and RPE1 cells.
Green dots represent spindles that are in parallel to the field direction. Blue dots represent spindles that are normal to the field direction. Total of 166 metaphase spindles were measured from four independent coverslips. Data is mean ± SEM. ‘ns’, not significant; *p<0.05; ***p<0.005.
Figure 7—figure supplement 2

Spindle length was not affected by 27 T SMF when spindle axis was normal to the field direction.
Spindle length and width, as well as their orientation were measured in CNE-2Z and RPE1 cells. (A, B) Spindle length of control, sham or 27 T treated CNE-2Z (A) and RPE1 (B) cells. (C, D) Spindle width in control CNE-2Z (C) and RPE1 (D) cells.
Figure 8
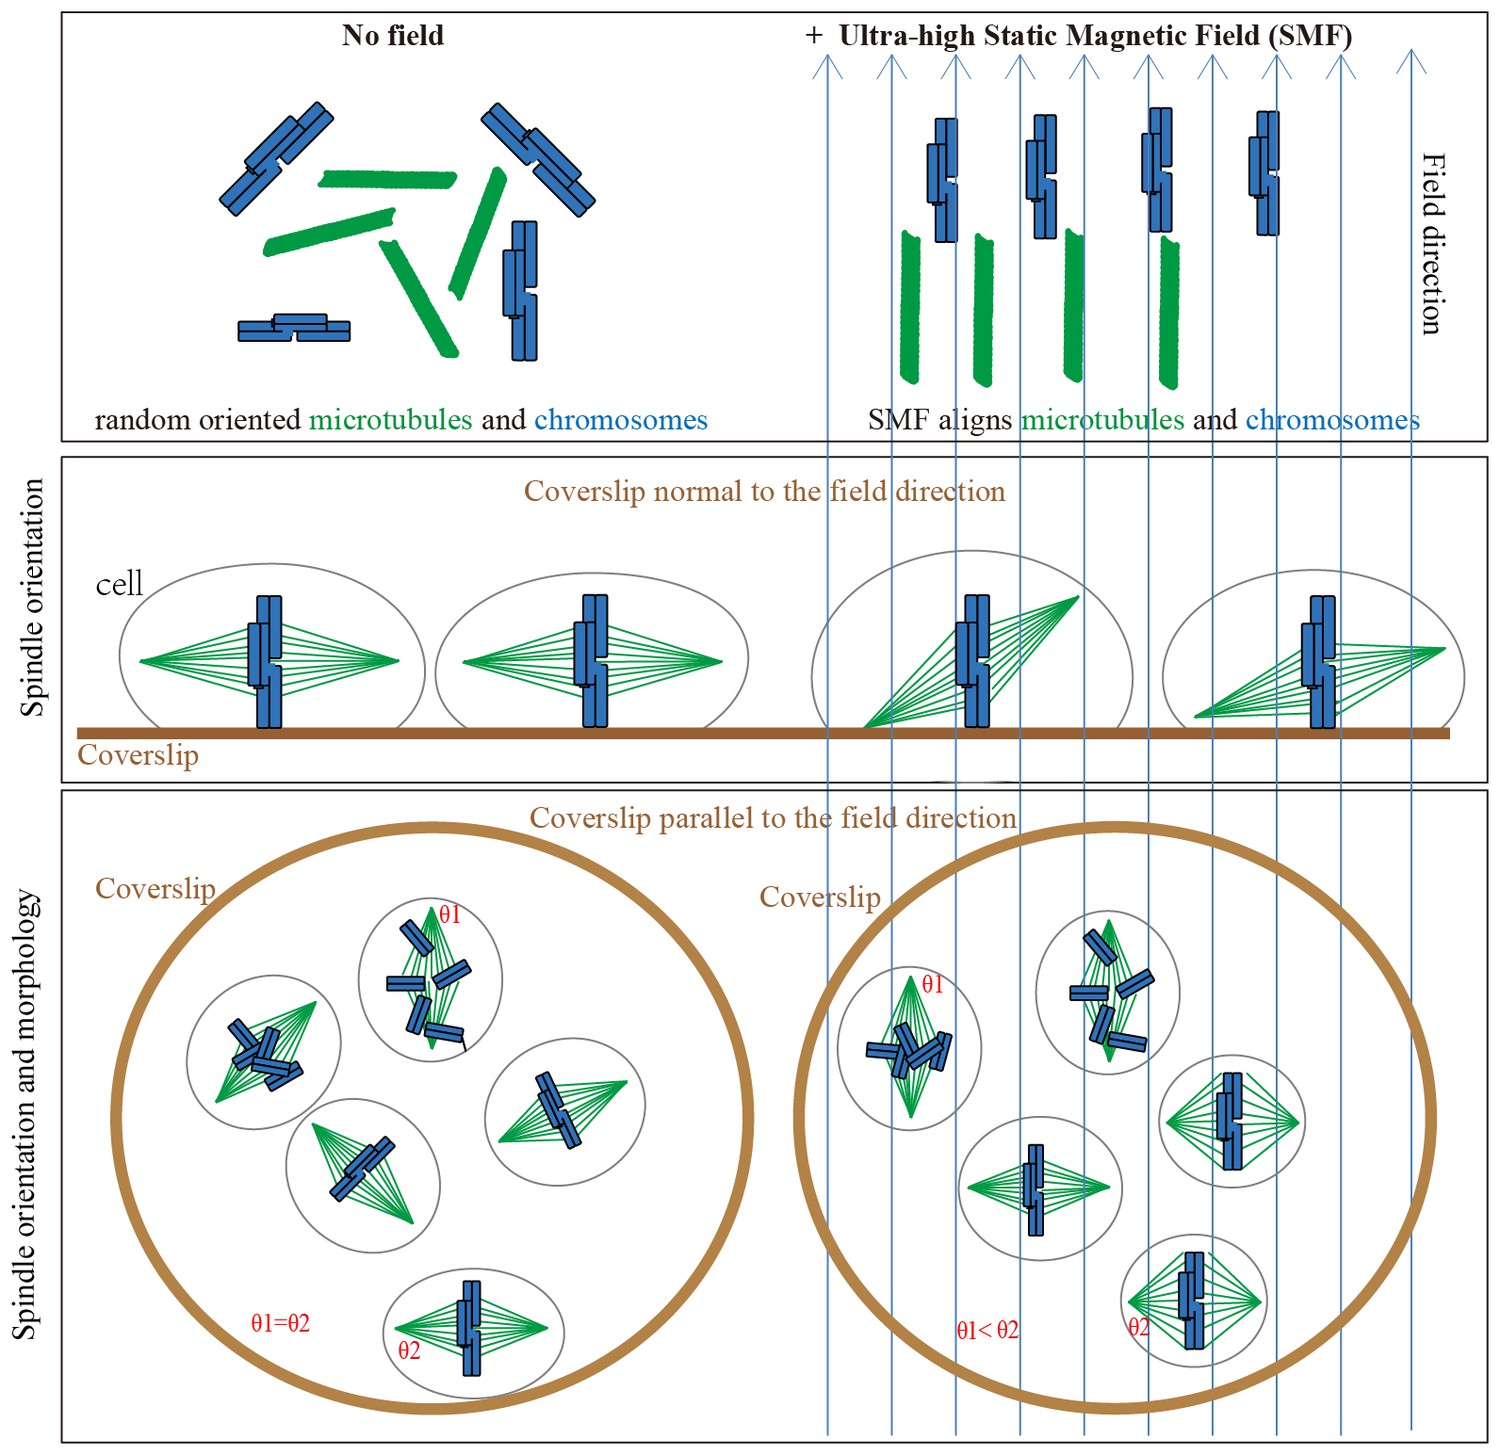
Models show that ultra-high SMFs align microtubules and chromosomes to change spindle orientation and morphology.
Blue upward arrows show magnetic field direction. Cells were plated on coverslips, which were placed in the ultra-high magnetic field either normal to or in parallel with the field direction.
Download links
A two-part list of links to download the article, or parts of the article, in various formats.
Downloads (link to download the article as PDF)
Open citations (links to open the citations from this article in various online reference manager services)
Cite this article (links to download the citations from this article in formats compatible with various reference manager tools)
27 T ultra-high static magnetic field changes orientation and morphology of mitotic spindles in human cells
eLife 6:e22911.
https://doi.org/10.7554/eLife.22911


