Structural insights into the molecular mechanisms of myasthenia gravis and their therapeutic implications
- University of Southern California, United States
- Keck School of Medicine, University of Southern California, United States
Figures
Figure 1 with 3 supplements
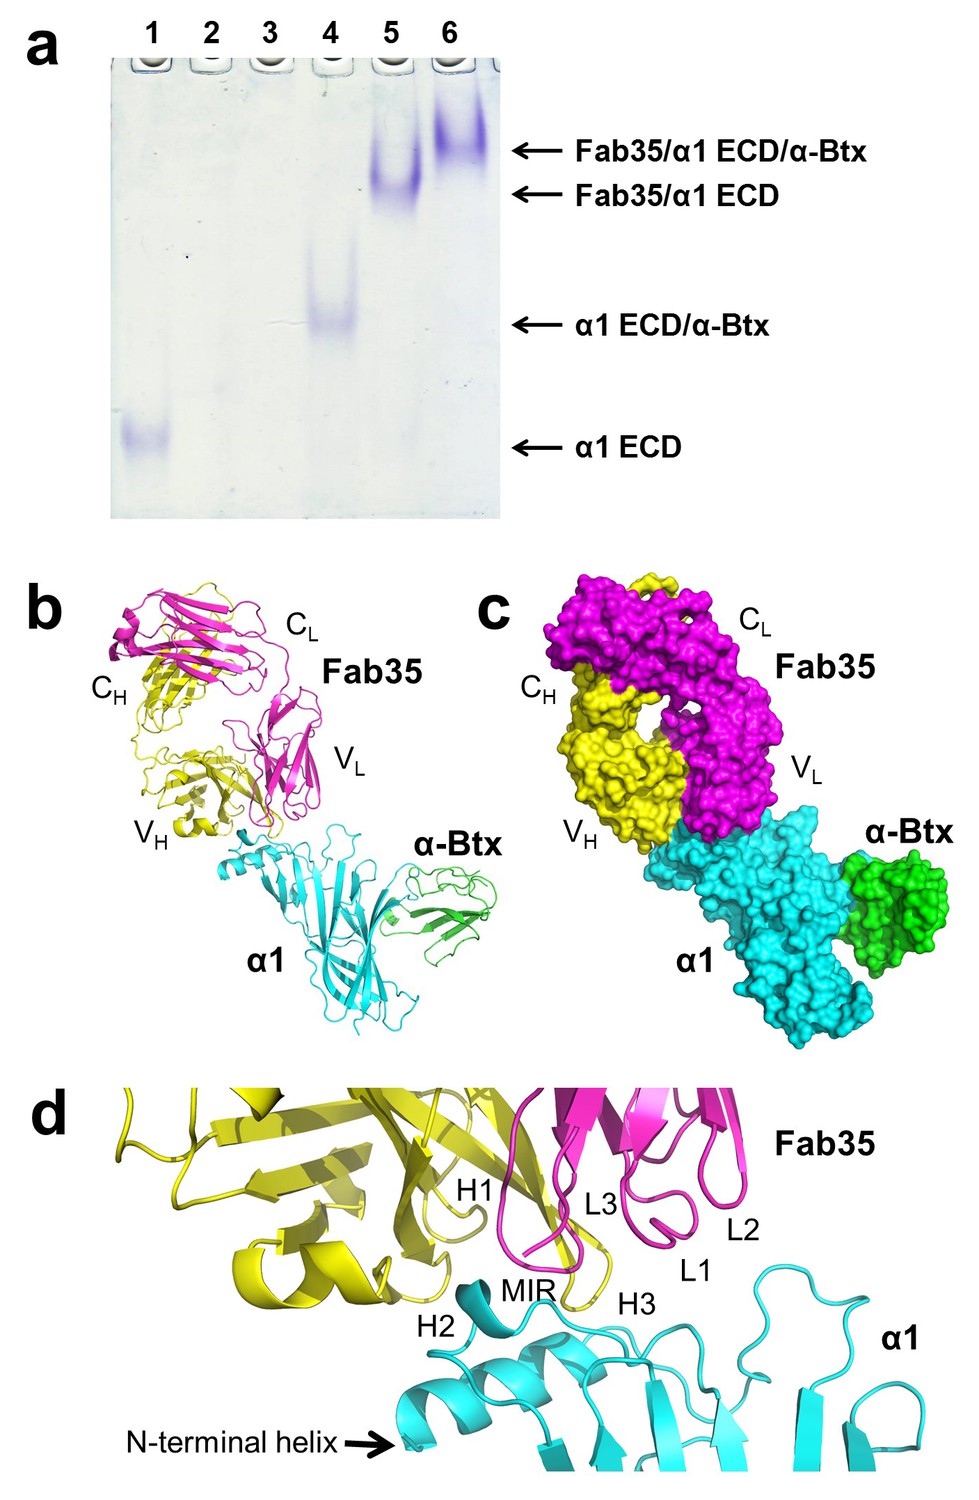
The ternary complex of nAChR α1 ECD bound by Fab35 and α-Btx.
(a) Gel shift assay. Native PAGE showed the formation of the ternary complex of nAChR α1 ECD, α-Btx and Fab35. Lane 1: nAChR α1 ECD alone (labeled as α1 ECD), Lane 2: α-Btx alone, Lane 3: Fab35 alone, Lane 4: nAChR α1 ECD plus α-Btx, Lane 5: nAChR α1 ECD plus Fab35, and Lane 6: nAChR α1 ECD plus α-Btx plus Fab35. Note that α-Btx in Lane 2 and Fab35 in Lane 3 were not visible because both proteins migrated upward due to their net positive charges under the experimental condition. (b) Ribbon representation of nAChR α1 ECD (α1: cyan) bound by α-Btx (green) and Fab35 (heavy chain, H: yellow and light chain, L: magenta). The variable domains (VH and VL) and the constant domains (CH and CL) of Fab35 are indicated accordingly. This color scheme is kept the same throughout illustration unless noted otherwise. (c) Surface representation of the ternary complex. (d) Zoomed-in view of the binding interface. The complementarity determining regions (CDRs) of the heavy chain (CDR-H1, CDR-H2, and CDR-H3) are indicated as H1, H2, and H3, respectively. Those of the light chain (CDR-L1, CDR-L2 and CDR-L3) are indicated as, L1, L2, and L3, respectively.
Figure 1—figure supplement 1
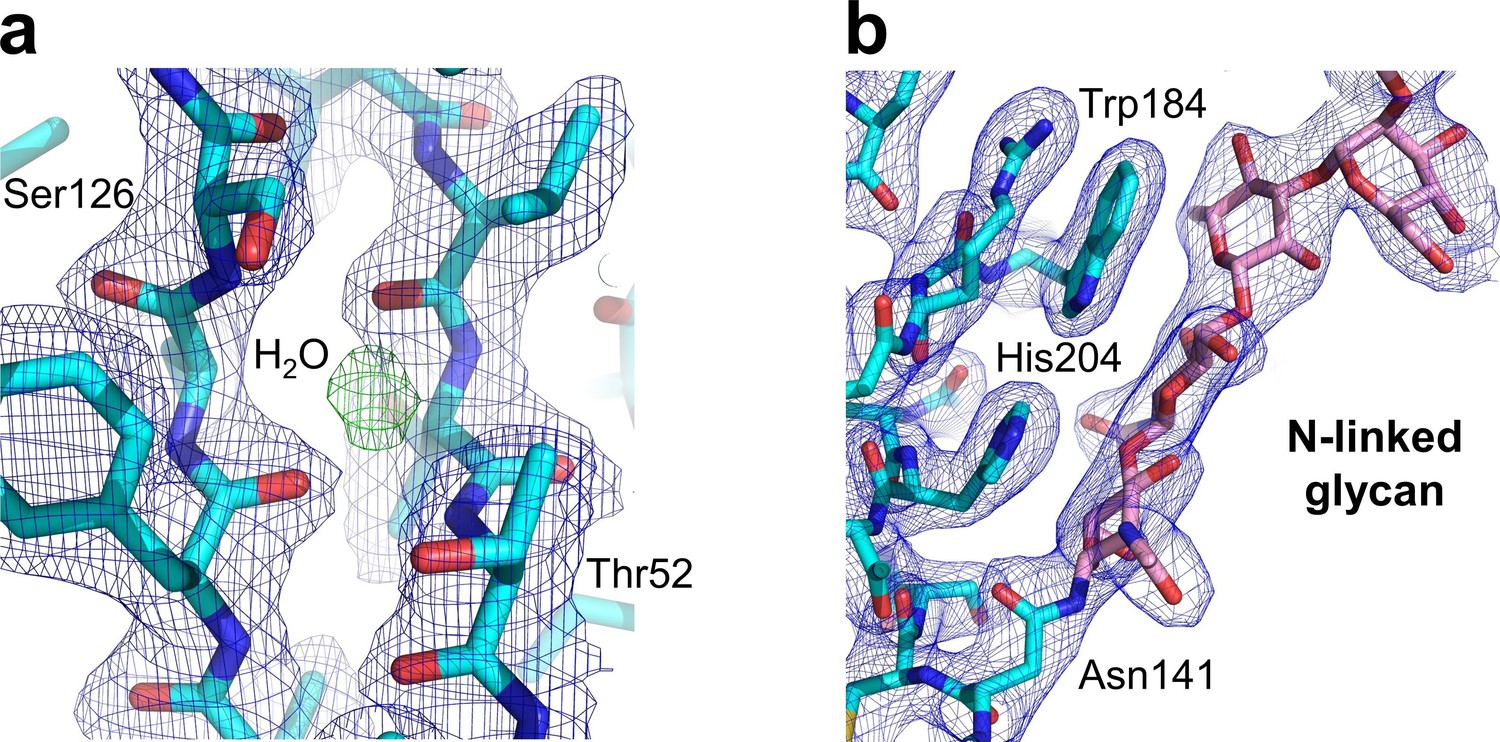
Key structural features of the human nAChR α1 ECD.
Our study also generated the first atomic picture of the human nAChR α1 ECD, which appears very similar to the previously characterized mouse nAChR α1 ECD (PDB ID, 2QC1) (Lindstrom, 2000). Many functionally important structural features observed in the mouse nAChR α1 ECD are also conserved in the human α1 ECD as shown here. (a) The hydrophilic residues (Thr52 and Ser126) and a bound water molecule buried inside the beta sandwich core of the ECD. The 2Fo-Fc electron density map (shown in blue) is countered at one sigma level. The electron density of water is shown as the Fo-Fc omit map (shown in green) countered at three sigma level. (b) The N-linked glycan (at the Asn141) bridging the Cys-loop and the loop C. The 2Fo-Fc electron density map (shown in blue) is contoured at one sigma level.
Figure 1—figure supplement 2
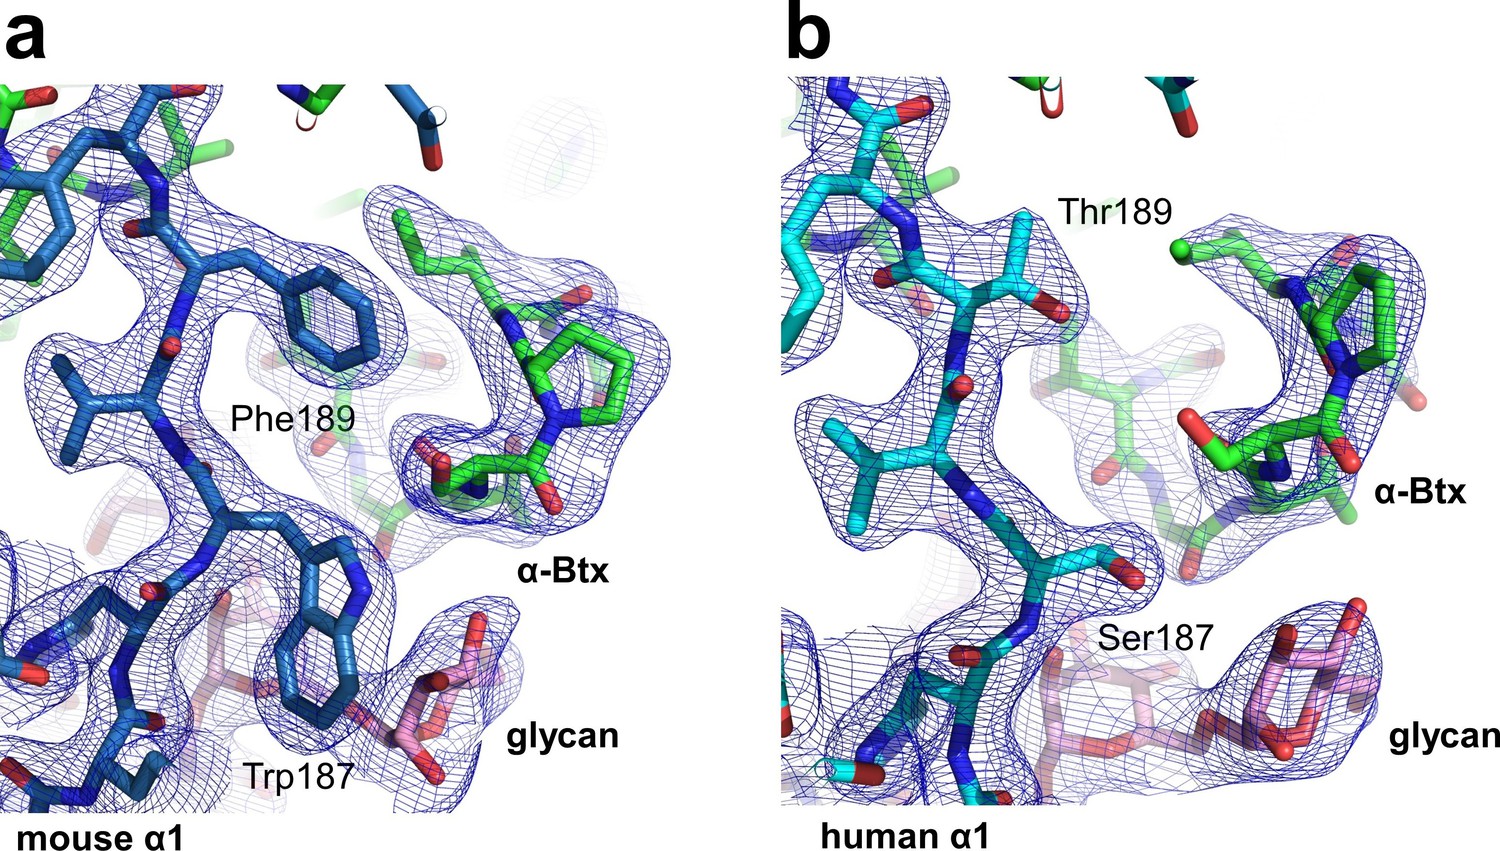
Structural differences between the human and mouse nAChR α1 ECDs.
A significant structural difference between the human and mouse nAChR α1 ECDs is the binding interface of α-Btx. (a) In the mouse nAChR α1 ECD, Phe189 is inserted into a surface pocket of α-Btx. (b) In the human nAChR α1 ECD, Thr189, is too small to fill in the α-Btx pocket. These observations are consistent with predictions from previous analyses of the nAChR α1/α-Btx complex (Vincent et al., 2001). The 2Fo-Fc electron density map (shown in blue) was contoured at one sigma level.
Figure 1—figure supplement 3
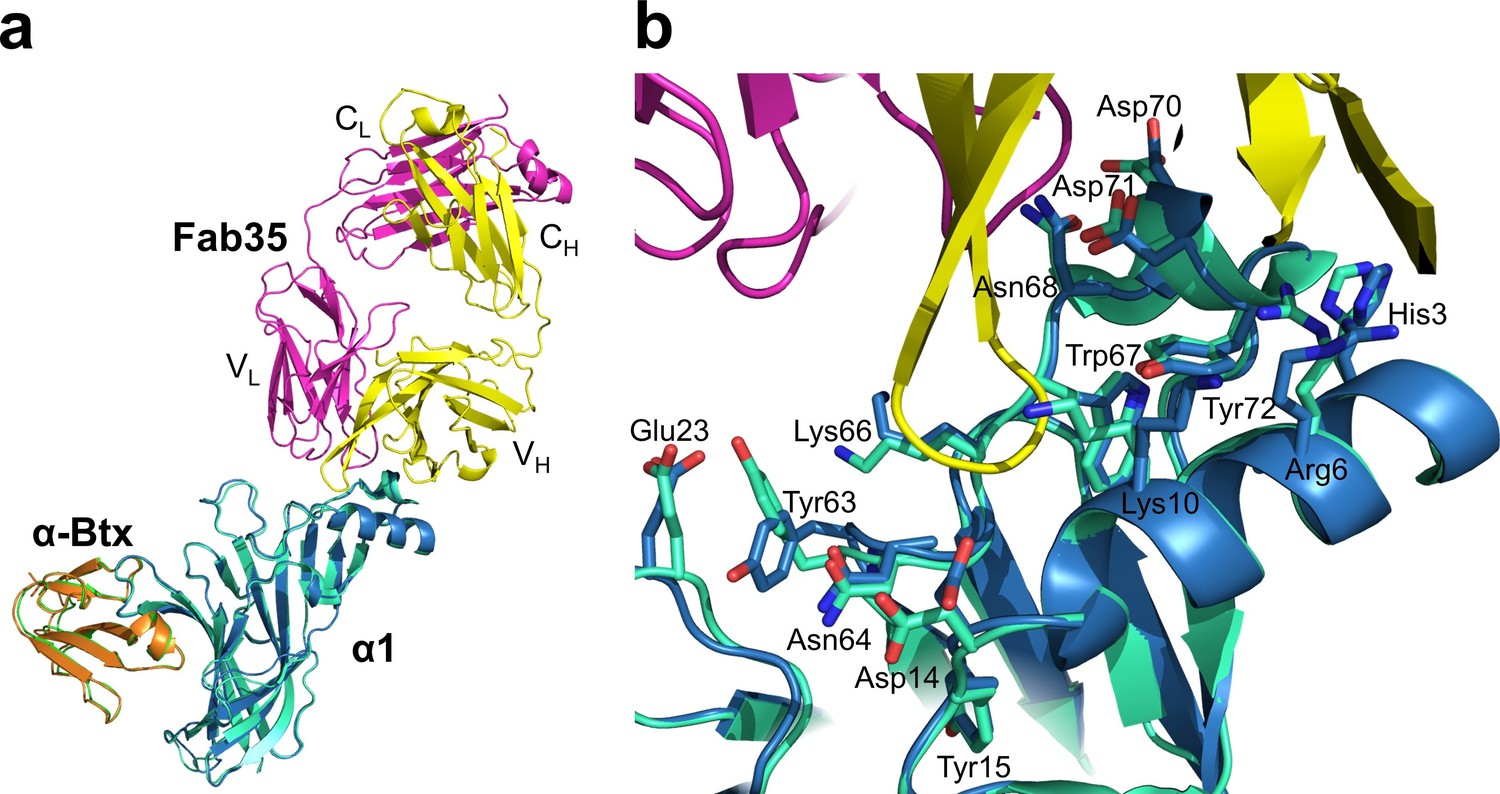
Structural comparison of mouse nAChR α1 ECDs in the ternary complex of Fab35/nAChR α1 ECD/α-Btx and the binary complex of nAChR α1 ECD/α-Btx.
(a) Superposition of the mouse nAChR α1 ECD from the Fab35/nAChR α1 ECD/α-Btx complex (blue) and the nAChR α1 ECD/α-Btx complex (green) (PDB ID, 2QC1) (Lindstrom, 2000) using the Cα backbone of the nAChR α1 ECD. (b) Detailed comparison of side chain orientation of residues involved in Fab35 binding.
Figure 2
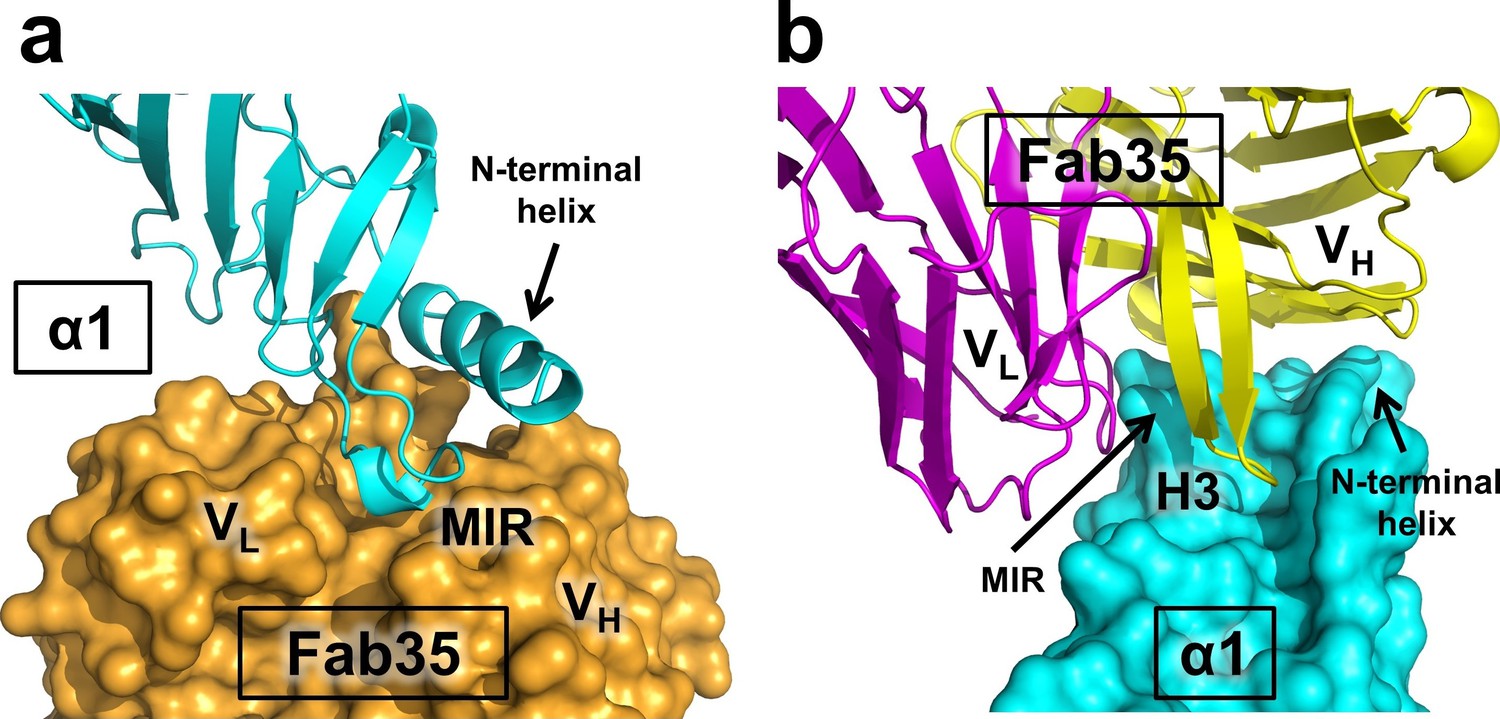
Mutual insertion of loops into pockets of binding partners.
(a) The MIR loop of nAChR α1 inserts into a surface pocket between the variable domains of the heavy and light chains (VH and VL) of Fab35 (orange) while the N-terminal helix sits into a groove on the surface of the heavy chain. (b) The CDR-H3 (H3) from the heavy chain of Fab35 inserts into a surface pocket between the MIR loop and the N-terminal helix on the nAChR α1 ECD.
Figure 3 with 1 supplement
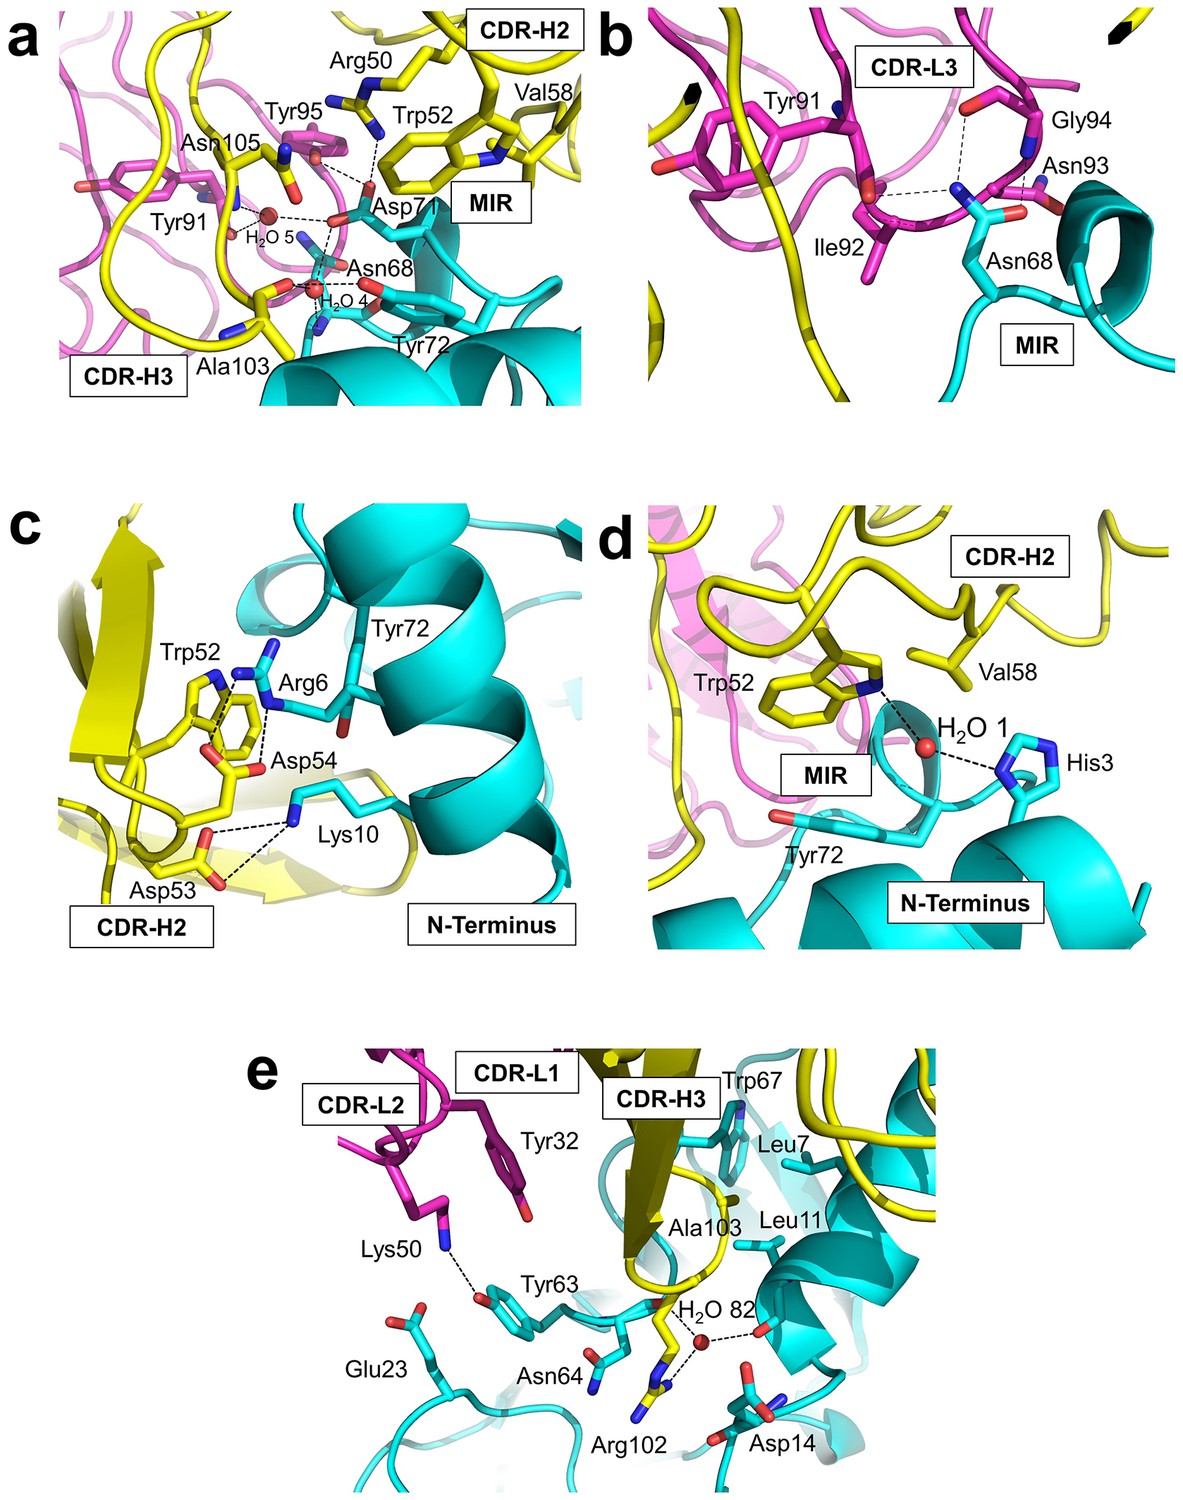
Detailed interactions at the interface between Fab35 and nAChR α1 ECD.
(a) Binding interactions at the Asp71 site of α1 (located at the MIR). (b) Binding interactions at the Asn68 site of α1 (located at the MIR). (c) Binding interactions surrounding Arg6 and Lys10 of α1 (located at the N-terminus of α1). (d) Binding interactions mediated by His3 of α1 (located at the N-terminus of α1). (e) Binding interactions at the CDR-H3 loop of Fab35. Interacting residues are represented by stick model and are colored according to their protein subunits. Water molecules are represented by red spheres.
Figure 3—figure supplement 1
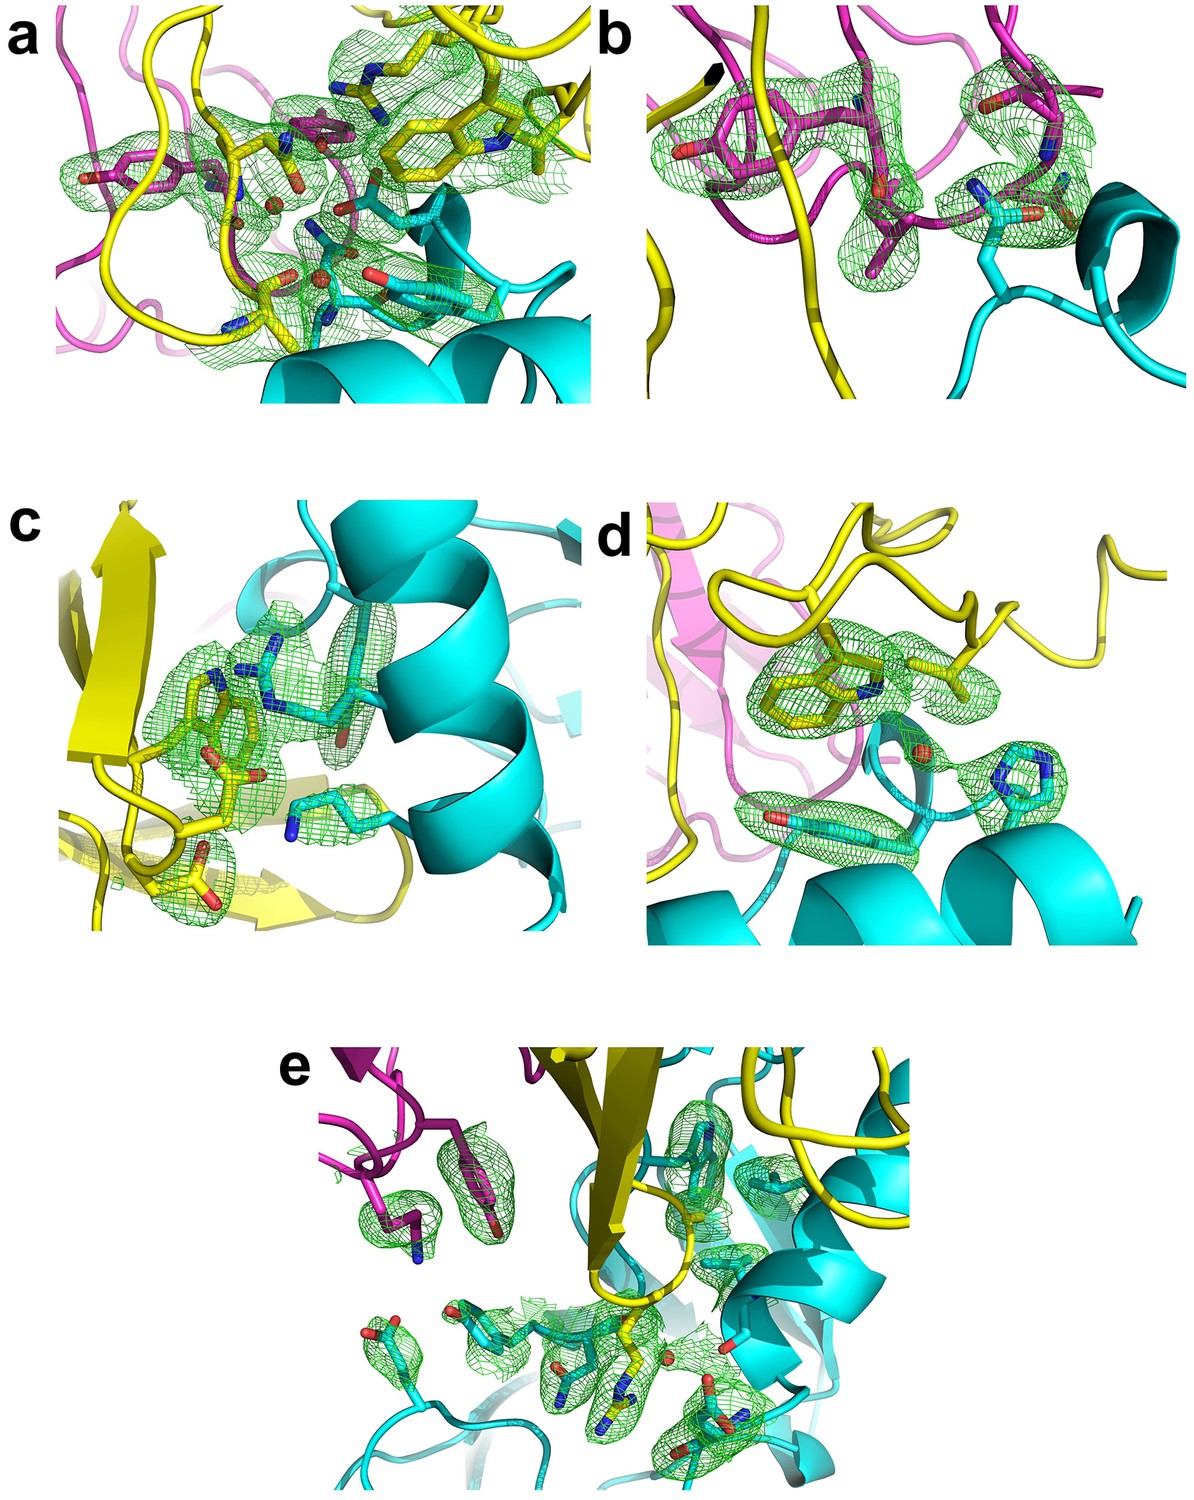
Fo-Fc omit maps of the interface between Fab35 and nAChR α1 ECD.
The Fo-Fc omit maps of representative side chains and main chains (only interacting ones) of the Fab35-alpha1 residues and waters at the binding interface. The Fo-Fc omit maps are shown in green and countered at two sigma level for (a) and (e) and three sigma level for (b) – (d). The orientation of each figure panel is the same as Figure 3.
Figure 4 with 1 supplement
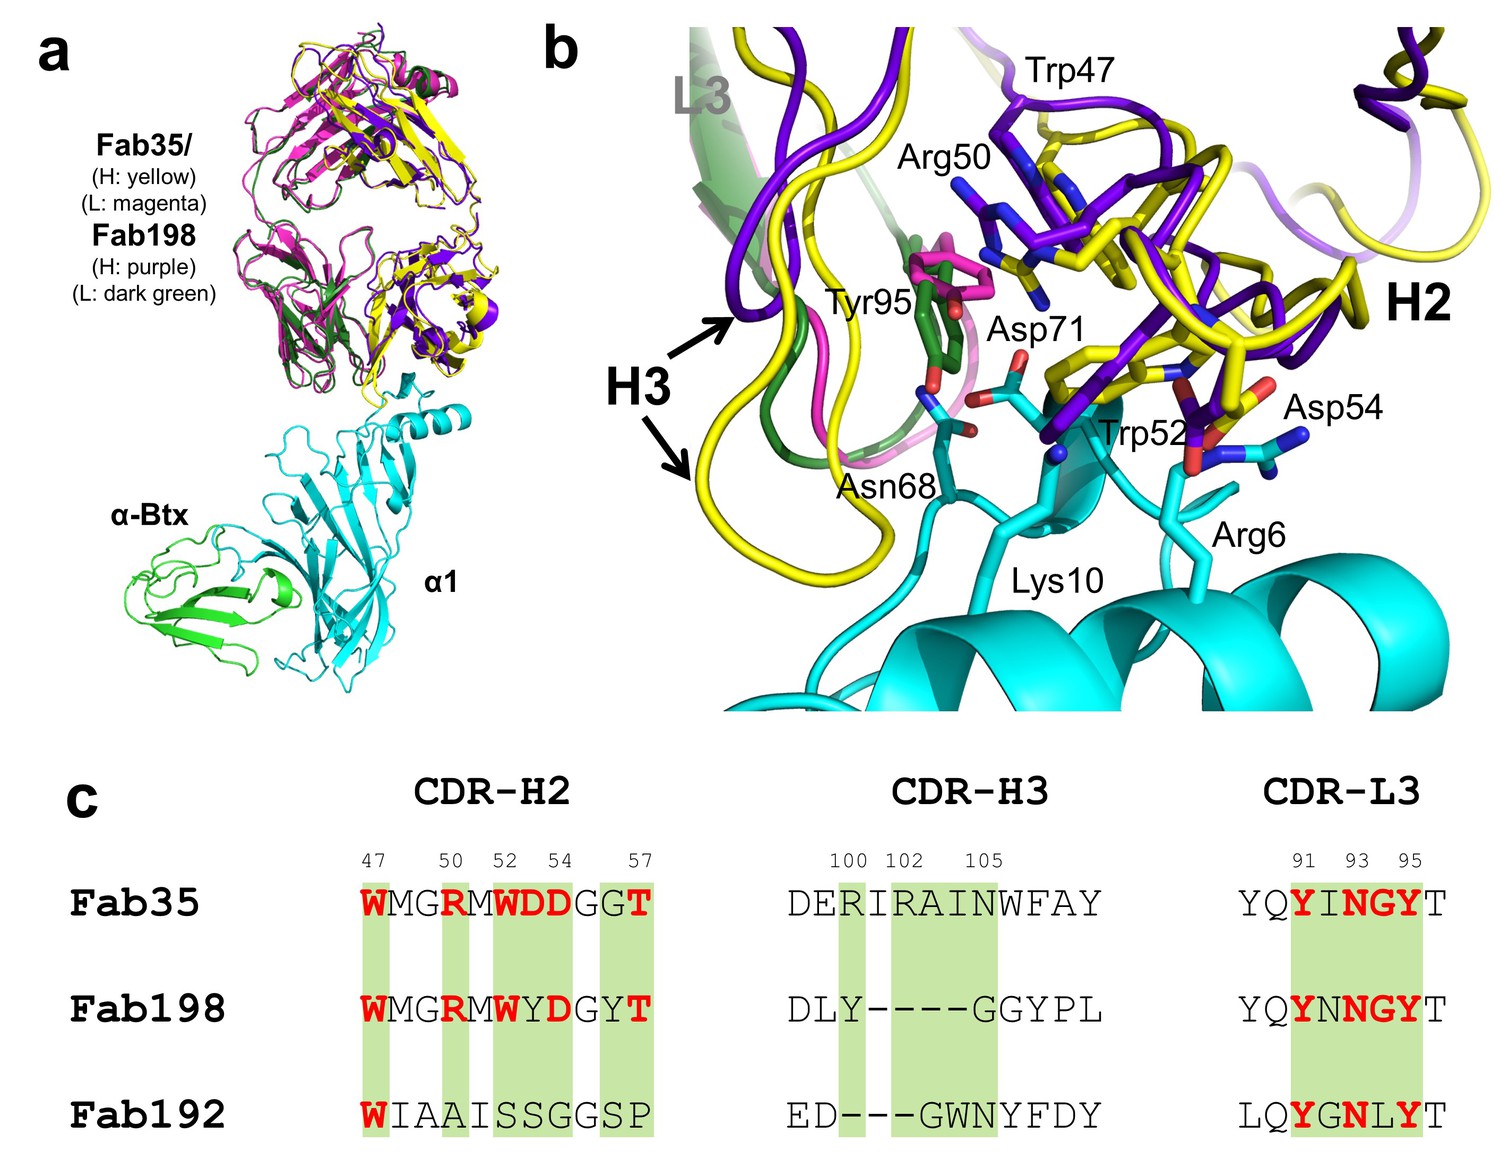
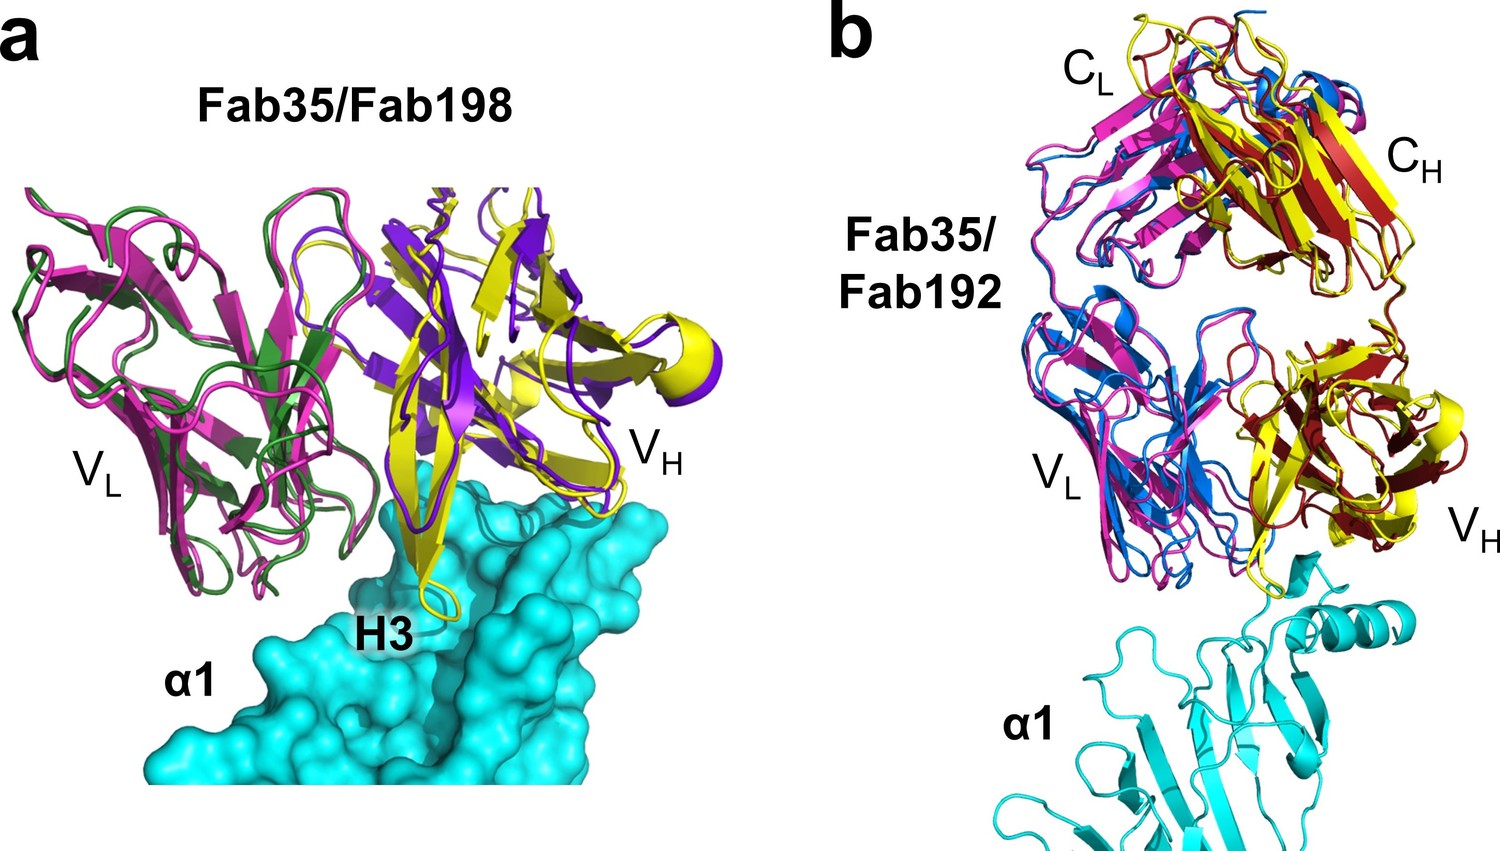
Structural comparisons among MG mAbs.
(a) Superposition of Fab198 (Poulas et al., 2001) (heavy chain: purple and light chain: dark green) onto Fab35 in the Fab35/nAChR α1/α-Btx ternary complex using the Cα backbone. (b) Detailed comparison of the binding interface. The residues are colored according to their protein subunits. Note that key α1-binding residues in Fab35, including Trp47, Arg50, Trp52 and Asp54 of VH and Tyr95 of VL are conserved in Fab198, and seem to be able to make similar contacts to nAChR α1 in the modeled interface. The CDR-H3 loop of Fab198 (purple) is substantially shorter than that of Fab35 (yellow), as indicated by arrows. (c) Structure-based sequence alignment of the nAChR α1-binding loops (CDR-H2, CDR-H3 and CDR-L3) between Fab35, Fab198 and Fab192 (Kontou et al., 2000). Residues shaded in light green are involved in nAChR α1 binding in Fab35, some of these (in bold font and colored in red) are conserved in Fab198 or Fab192. Note that Fab35 and Fab198 share a high similarity in their nAChR α1-binding CDR-H2 and CDR-L3 loops, but differ significantly in CDR-H3. On the other hand, Fab192 differs significantly from Fab35 and Fab198, especially in the CDR-H2 and CDR-H3 loops (See also Figure 4—figure supplement 1).
Figure 4—figure supplement 1
Structural comparison between Fab35 and Fab198/Fab192.
(a) A surface model showing that the CDR-H3 loop of Fab198 (PDB ID, 1FN4) (purple) (Engel and Arahata, 1987) is too short to interact with the surface pocket of nAChR α1, which is, on the other hand, occupied by the corresponding CDR-H3 loop of Fab35 (yellow). (b) The structure of Fab192 (PDB ID, 1C5D) (heavy chain, red; light chain, blue) (Drachman et al., 1978) was superimposed onto that of the Fab35 in the Fab35/nAChR α1/α-Btx ternary complex using the Cα backbone. It shows substantial differences between Fab192 and Fab35.
Figure 5
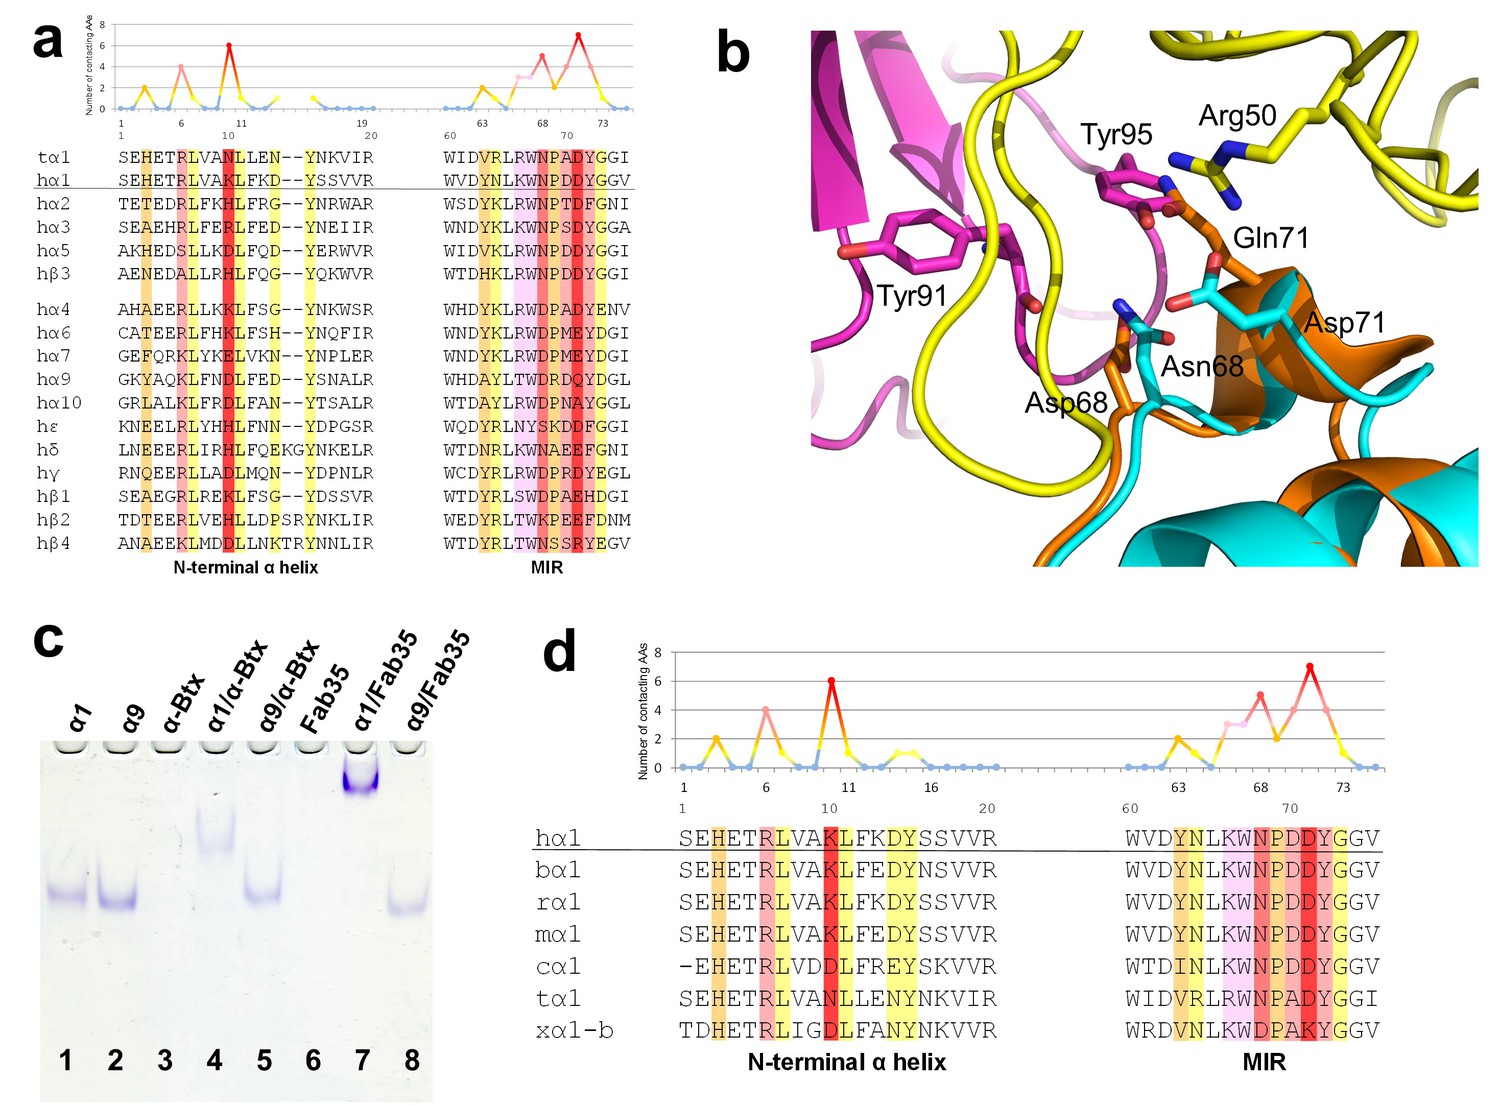
Specificity of antibody-receptor binding.
(a) Multiple sequence alignment of the N-terminal α helix (left) and the MIR (right) of human nAChR family members. The sequence of human nAChR α1 (hα1) in the crystal structure is underlined. Abbreviation follows as t (torpedo) and h (human). The Fab35-contacting profile for human nAChR α1, indicating how many Fab35 residues are directly contacting with each particular residue of human nAChR α1, is shown above the sequence. The aligned sequences are colored based on the contacting profile, with red color indicating highly contacting residues (‘hotspots’). (b) Superposition of nAChR α9 (orange) (Zouridakis et al., 2014) onto the nAChR α1 in the Fab35/nAChR α1/α-Btx ternary complex showing the disrupted binding interface. (c) Native PAGE showing the binding specificity of Fab35. Lane 1: α211 (labeled as α1), Lane 2: α9, Lane 3: α-Btx, Lane 4: α211 plus α-Btx, Lane 5: α9 plus α-Btx, Lane 6: Fab35, Lane 7: α211 plus Fab35, and Lane 8: α9 plus Fab35. Note that α-Btx in Lane 3 and Fab35 in Lane 6 were not visible because both proteins are positively charged and migrated upward under the native gel electrophoresis condition. Lanes with α-Btx were included as positive controls (Lanes 3–5). Lanes 4 and 5 show that both nAChR α1 and α9 bind α-Btx. Note that the α9/α-Btx complex has a smaller shift than the α1/α-Btx complex. Lanes 7 and 8 show that Fab35 binds α1 but not α9. (d) Multiple sequence alignment of the N-terminal α helix (left) and the MIR (right) of nAChR α1 from several species along with the Fab35-contacting profile as in (a). Abbreviation follows as b (bovine), r (rat), m (mouse), c (chicken), t (torpedo) and x (Xenopus).
Figure 6 with 1 supplement
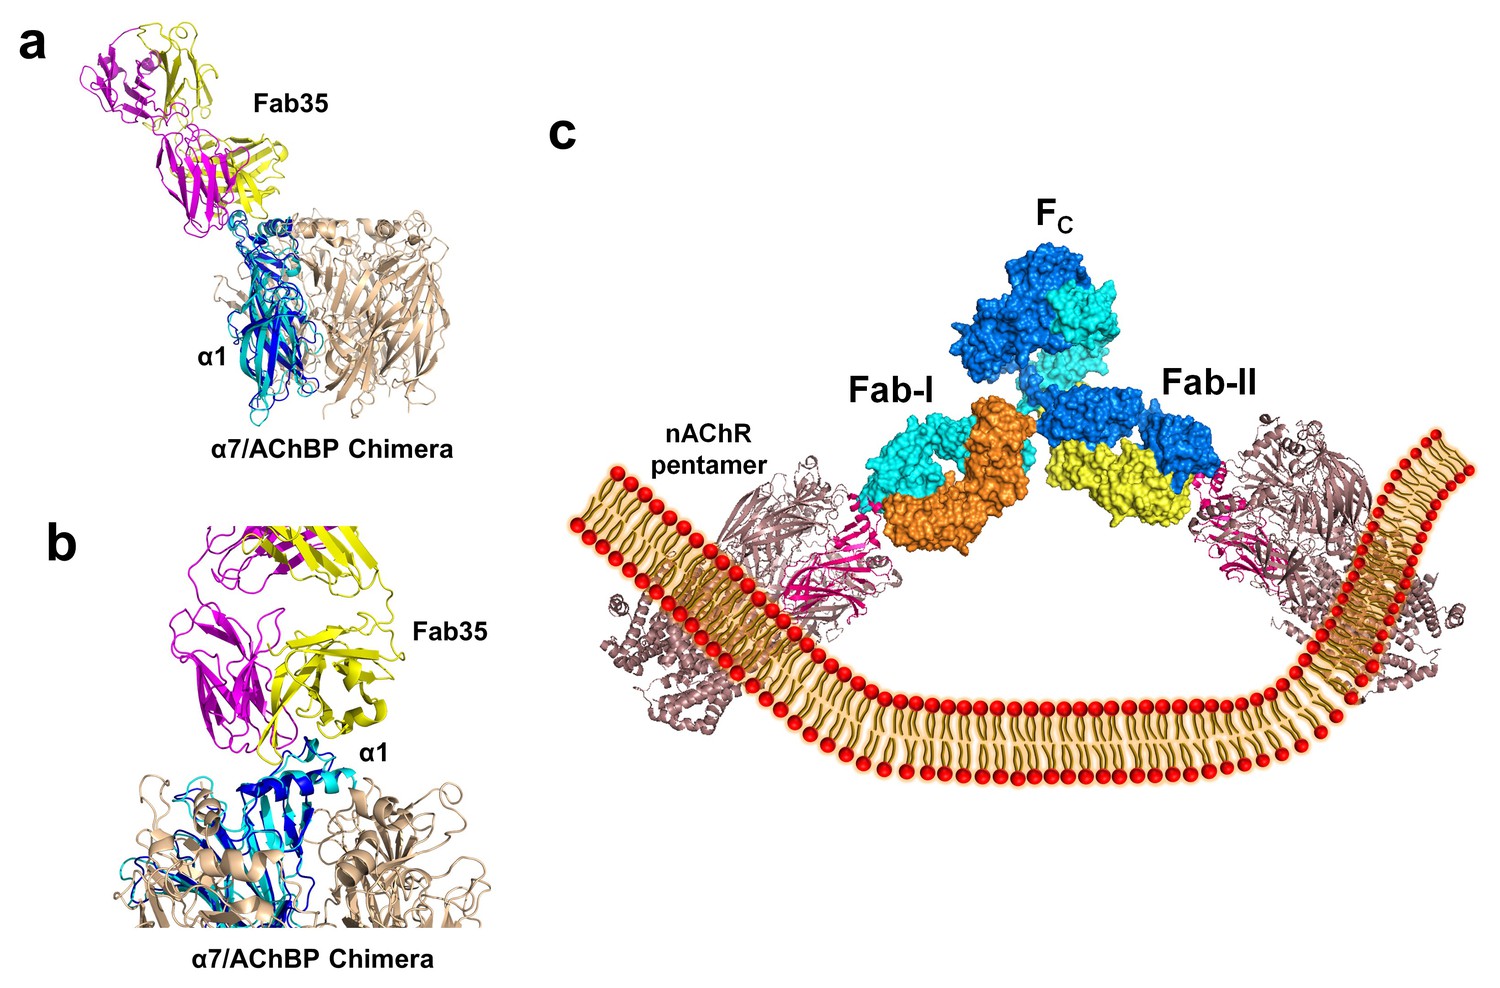
Modeling the binding of Fab35 to a nAChR pentamer.
(a) Superposition of the Fab35/nAChR α1 ECD/α-Btx ternary complex on one subunit of the α7/AChBP chimera pentamer (blue) (PDB ID, 3SQ9) (Li et al., 2011) using the Cα backbone of ECDs as the reference. (b) Zoomed-in view of the contact between Fab35 and α7/AChBP Chimera. Fab35 makes no direct contact to the neighboring subunits in the pentamer. (c) Binding of a complete antibody (Fab+Fc) to a nAChR pentamer. The ternary Fab35/nAChR α1 ECD/α-Btx complex structure was used to guide the docking of an intact IgG1 antibody (PDB ID, 1IGY) (in surface model) (Harris et al., 1998) onto the human α4β2 nicotinic receptor (PDB ID, 5KXI, 3.94 Å resolution) (Morales-Perez et al., 2016). The two Fab domains (Fab-I and Fab-II) and the Fc region of IgG1 are indicated as shown. Each heavy chain is colored as blue and cyan. Each light chain is colored as yellow and orange. ECD of nAChR α1 is shown in magenta.
Figure 6—figure supplement 1
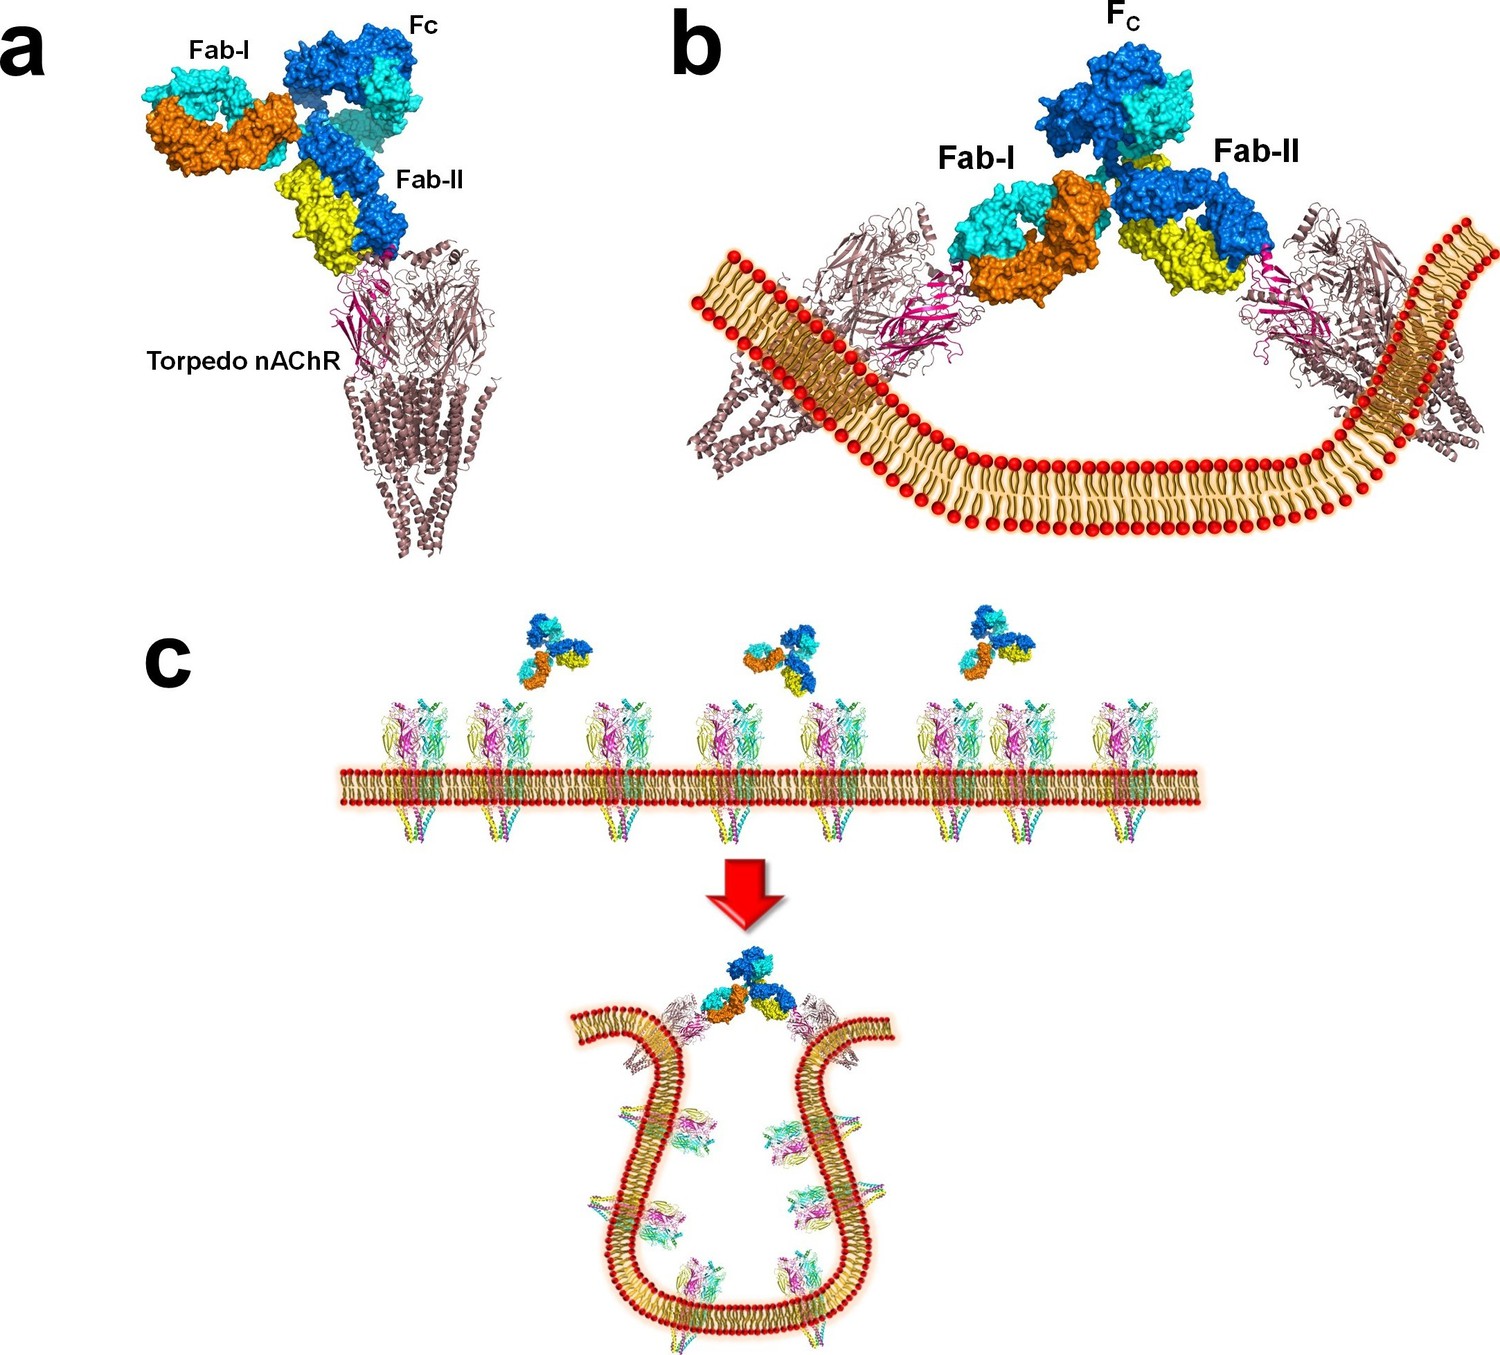
Modeling the binding of a complete MG mAb to full-length nAChR(s).
(a) Modeling of the binding of a complete antibody (Fab+Fc) to a nAChR pentamer using the Torpedo nAChR as a template. The ternary Fab35/nAChR α1 ECD/α-Btx complex structure was used to guide the docking of an intact IgG1 antibody (PDB ID, 1IGY) (in surface model) (Gomez et al., 2010) onto the full-length Torpedo nAChR pentamer (PDB ID, 2BG9) (in ribbon model) (Luo and Lindstrom, 2015). The two Fab domains (Fab-I and Fab-II) and the Fc region of IgG1 are indicated as shown. The extracellular domain of Torpedo nAChR α1 subunit is colored in magenta. Each heavy chain is colored as blue and cyan. Each light chain is colored as yellow and orange. (b) Cross-linking of two nAChR pentamers by a single MG antibody. This model shows that this cross-linking event may cause the curving of the cell membrane. (c) A hypothetical model wherein the cross-linking of nAChRs by MG antibodies leads to inward membrane curvature and internalization of nAChRs.
Additional files
-
Supplementary file 1
The statistics of data collection and structure refinement for Fab35/human nAChR α1 ECD/α-Btx ternary complexes and Fab35/mouse nAChR α1 ECD/α-Btx ternary complexes.
- https://doi.org/10.7554/eLife.23043.015
-
Supplementary file 2
Contacting residues at the Fab35/human nAChR α1 ECD interface.
Residues at the Fab35/human nAChR α1 (α211) interface were mapped using the contact program in CCP4 with a 4.5 Å distance cutoff (Winn et al., 2011). For each residue of nAChR α1 involved in antibody binding (Chain B/α211 listed in the first column), its interacting residues from the light chain (Chain C listed in the second column) and the heavy chain (Chain D listed in the third column) of Fab35 are listed in the corresponding row. Residues on the N-terminal helix is highlighted in yellow and residues on the MIR loop is highlighted in light green. Note that several nAChR α1 residues, including R6, K10, N68 and D71/Y72 (red font), contact a large number of antibody residues. These residues can be considered as ‘hotspots’ of the binding interface. Y72 can be considered as part of the Asp71 ‘hotspot’ (see the text).
- https://doi.org/10.7554/eLife.23043.016
Download links
A two-part list of links to download the article, or parts of the article, in various formats.
Downloads (link to download the article as PDF)
Open citations (links to open the citations from this article in various online reference manager services)
Cite this article (links to download the citations from this article in formats compatible with various reference manager tools)
Structural insights into the molecular mechanisms of myasthenia gravis and their therapeutic implications
eLife 6:e23043.
https://doi.org/10.7554/eLife.23043


