Learning shapes the aversion and reward responses of lateral habenula neurons
- Tsinghua University, China
- National Institute of Biological Sciences, China
Figures
Figure 1 with 1 supplement
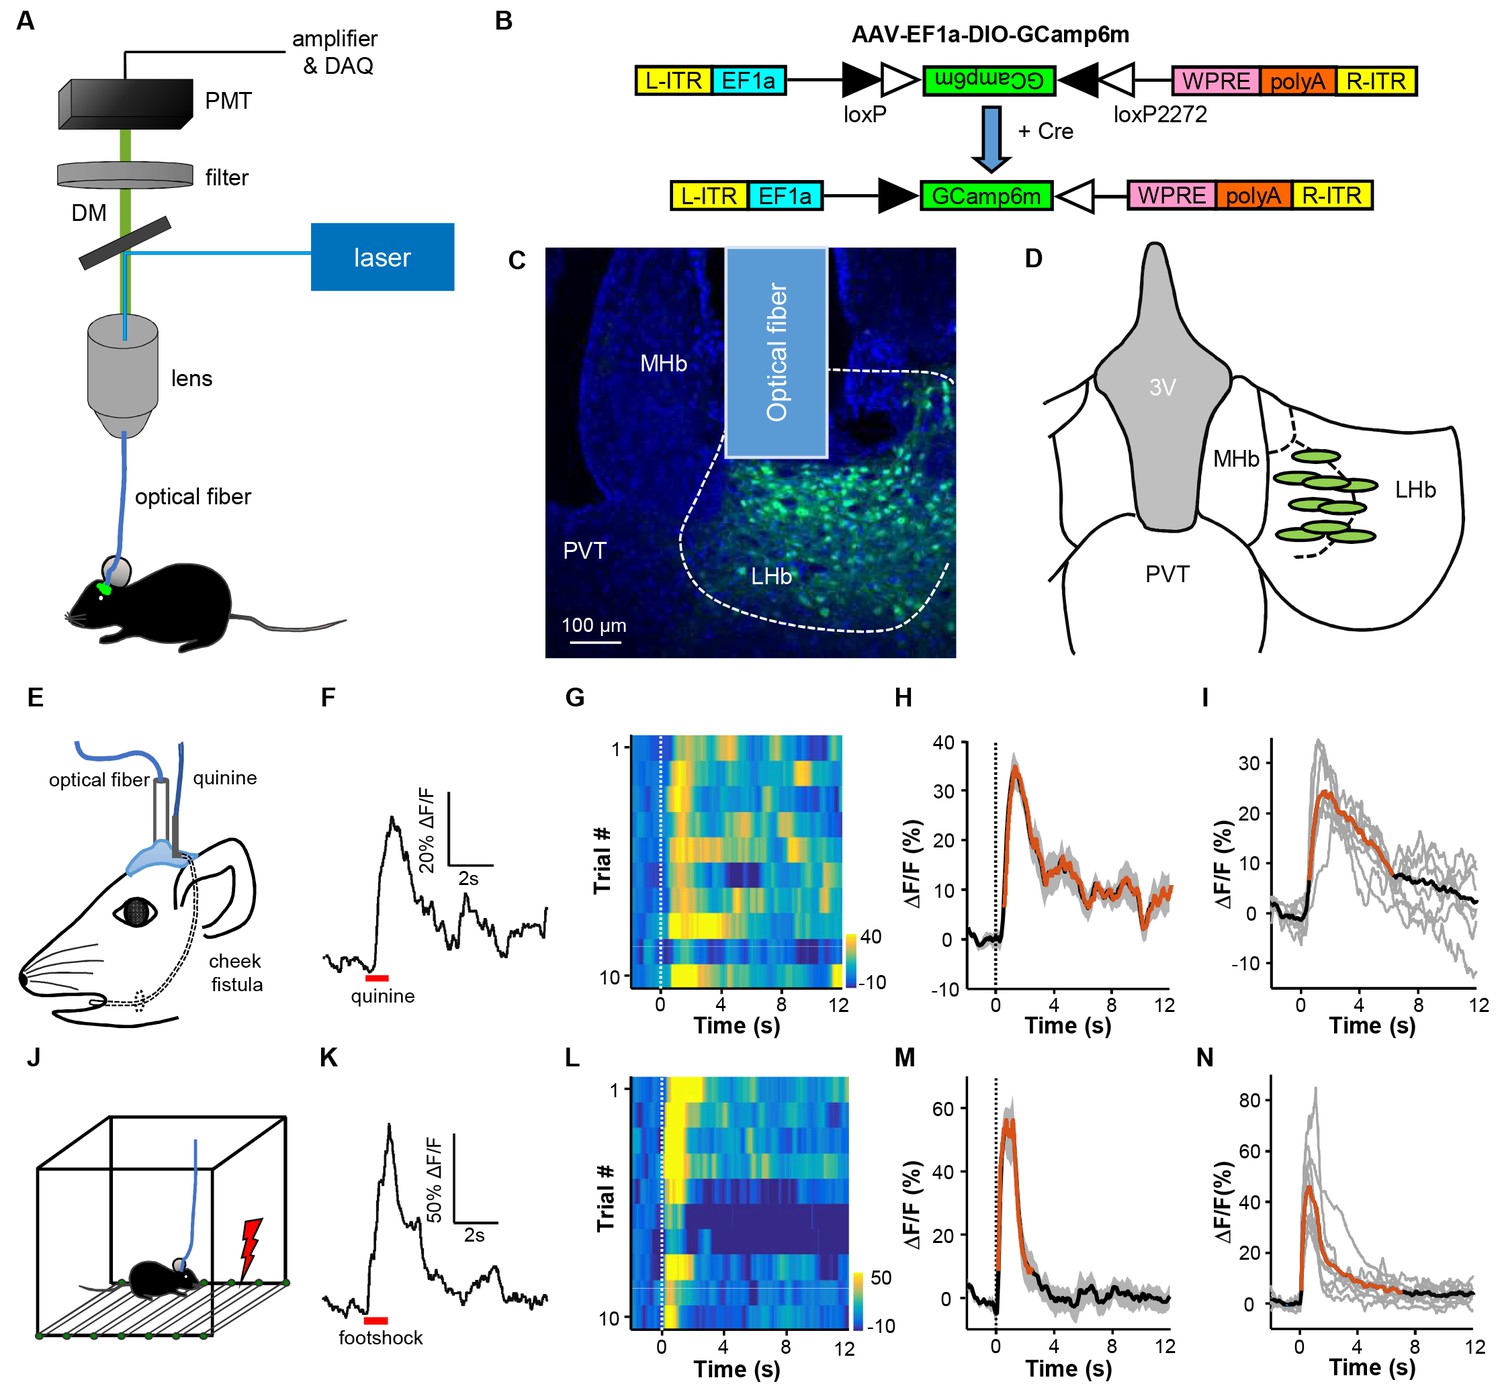
Intra-oral quinine delivery and footshock increase Ca2+ signals in VGlut2-expressing neurons in the LHb.
(A) Schematic of the fiber-photometry setup. We recorded Ca2+ transients from GCaMP6-expressing neurons from the LHb of freely behaving mice. DM, dichroic mirror; PMT, photomultiplier tube. (B and C) Injecting recombinant AAV-DIO-GCaMP6m (B) into the LHb of a Slc17a6-ires-Cre (Vglut2-LHb-GCaMP6) mouse resulted in GCaMP6m expression (green) in LHb neurons (C). Postmortem examination verified the location of the implanted optical fiber. Blue, DAPI counterstaining of cell nuclei. (D) Recording sites within the LHb (n = 9 mice). Each green dot represents the center of optical tip in an individual mouse. (E) The schematics of intra-oral solution infusion through a cheek fistula. (F) Raw trace of fluorescence changes shows that intra-oral delivery of quinine (horizontal bar) rapidly increased GCaMP6 signals within one test trial. (G and H) Trial-by-trial heatmap representation of GCaMP6m transients evoked by random quinine infusion (n = 10 trials; G) and peri-event plot of the average Ca2+ transient for a mouse (H). Color scale indicates the range of ΔF/F in (G); (I) Average Ca2+ signals associated with intra-oral quinine infusion for the entire test group (n = 7 mice). (J–N) The effects of footshock. (J) Schematics showing footshock application. (K) The raw trace shows a footshock-evoked change in GCaMP6 fluorescence within one test trial. (L) Heatmap representation of GCaMP6 signals across trials. (M) Average GCaMP6 transients across trials for the same mouse shown in (C). (N) Average GCaMP6 transients for the entire test group (n = 8 mice). In (H, I, M, and N), thick lines indicate the mean, shaded areas indicate the SEM, and the dashed lines indicate the onset of quinine infusion or footshock. Red segments indicate statistically-significant increases from the baseline (p<0.05; multivariate permutation tests).
Figure 1—figure supplement 1
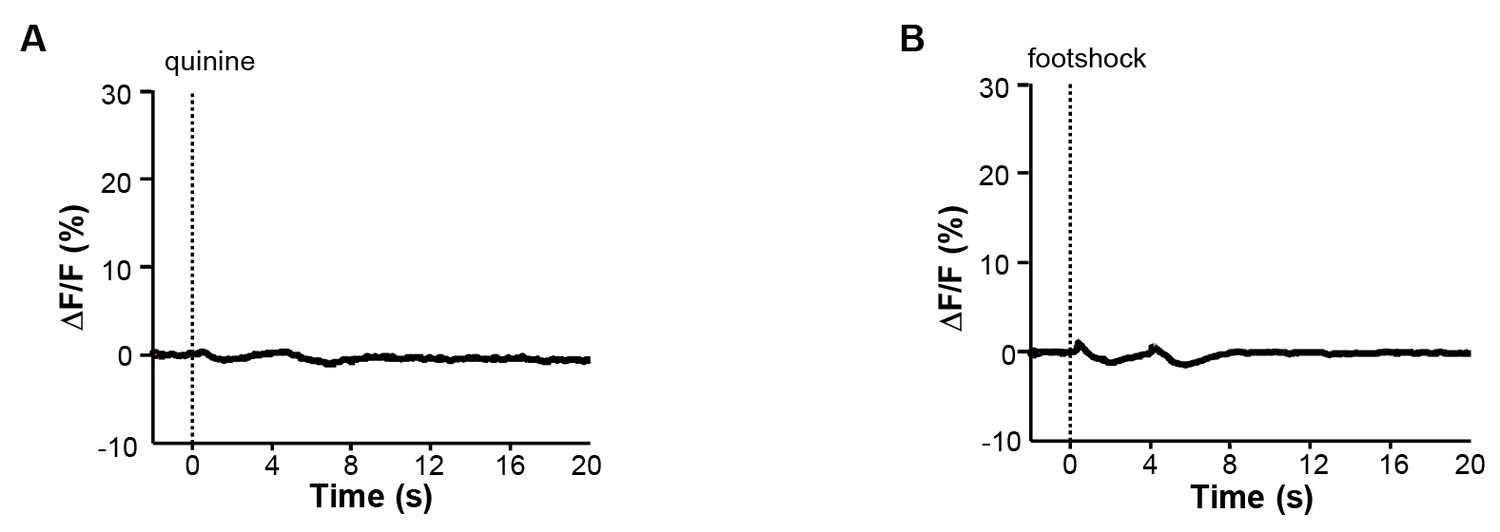
Quinine and footshock do not evoke substantial changes in GFP fluorescence in the control Vglut2-LHb-EmGFP mice.
(A) Effect of intra-oral quinine infusion (dashed vertical line) on the GFP fluorescence in the LHb of Vglut2-LHb-EmGFP mice (n = 5 mice). (B) Effect of footshock on the GFP fluorescence in the LHb of control mice (n = 5 mice).
Figure 2 with 1 supplement
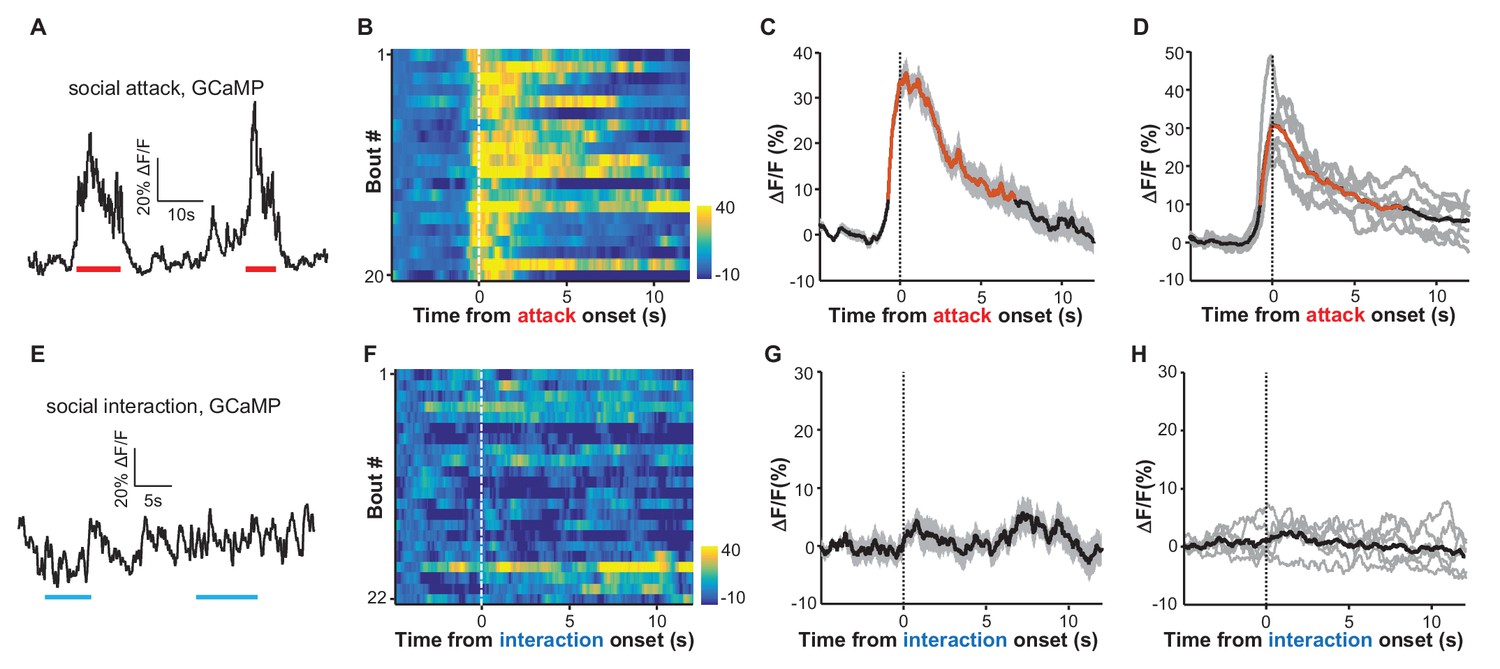
Social attack by an aggressor activates LHb neurons.
(A–D) Ca2+ signals in the LHb neurons of test male mice increased when an aggressive resident male attacked the test male. A Vglut2-LHb-GCaMP6 male mouse was introduced into the home cage of a CD-1 male mouse (aggressor), who often initiated attacks on the test male. GCaMP fluorescence changes were segmented and aligned to the onset of attack by the resident male. (A) Raw trace of GCaMP6m fluorescence levels in response to social defeat. (B) Heatmap representation of Ca2+ transients in the LHb neurons of a Vglut2-LHb-GCaMP6 mouse. Each row represents a bout. (C) Peri-event plot of the average Ca2+ transients from the same mouse shown in (B). (D) Mean Ca2+ signals for the entire test group (n = 7 Vglut2-LHb-GCaMP6 mice). In (C and D), thick lines indicate the mean and shaded areas indicate the SEM. Red segments indicate statistically-significant increases from the baseline (p<0.05; multivariate permutation test). (E–H) Raw trace (E), heatmap (F), and average Ca2+ transient of an individual mouse (G), as well as the average plot for the entire test group (H), all showing the lack of clear Ca2+ signals during the social interaction between the test male and its non-aggressive male littermate (n = 6 Vglut2-LHb-GCaMP6 mice). Same conventions as in (A–D).
Figure 2—figure supplement 1
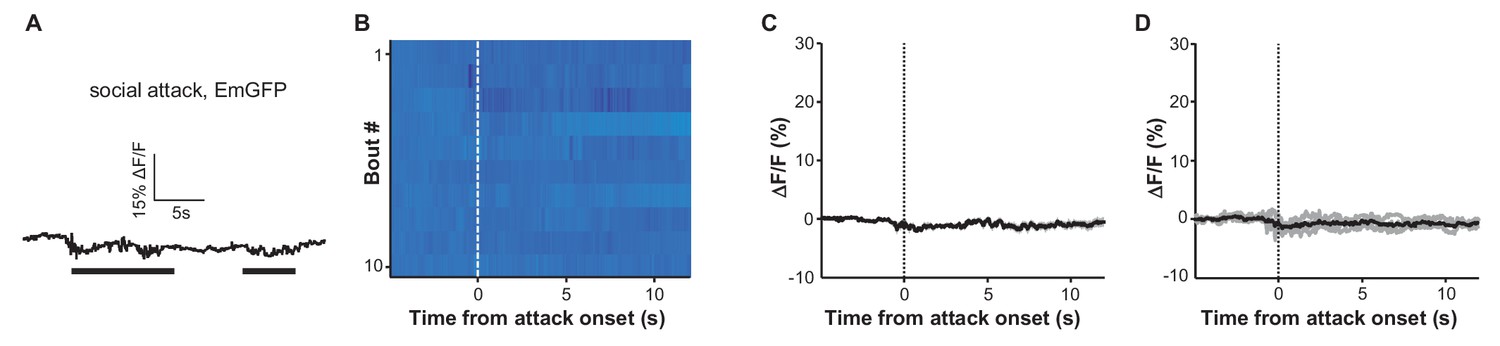
Social attack by an aggressor does not produce any clear change in green fluorescence in the EmGFP-expressing control mice.
(A) Raw trace. (B) Heatmap representation of 10 fighting bouts. (C) Average GFP fluorescence change of the same mouse as shown in (B). (D) Mean fluorescence change of the test population (n = 4 Vglut2-LHb-EmGFP control mice).
Figure 3 with 1 supplement

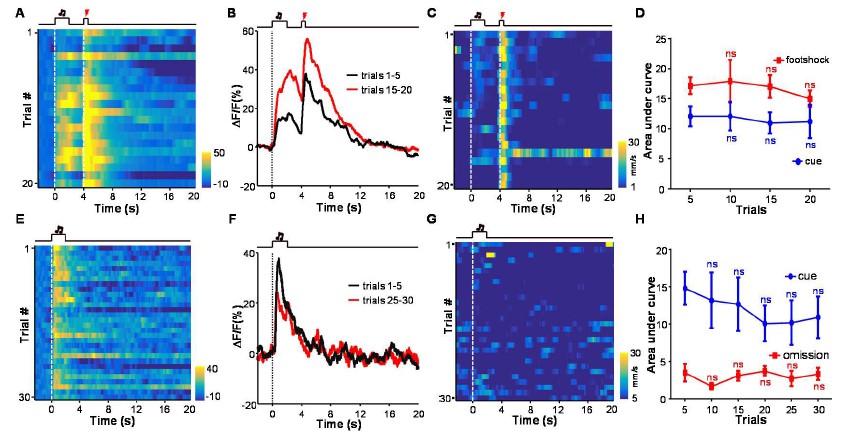
Aversive conditioning rapidly induces excitatory responses to aversion-predicting cues and omitting an unconditioned aversive stimulus slowly extinguishes previously-conditioned responses.
(A) Heatmap representation of LHb Ca2+ transients within a session of cue-quinine Pavlovian conditioning. The conditioning session consisted of 20 trials. The dashed lines and timeline below indicate the timing of an auditory cue (2 s), delay (2 s), and intra-oral infusion of quinine (0.5 s). (B) The peri-event plot of the average Ca2+ transient from the same mouse shown in (A) during the first five trials (black) and last 5 trials of the conditioning session. (C) Mean Ca2+ transient for the entire test group (n = 9 mice). (D) Sum of Ca2+ transients for cues (0–2 s; blue line) and quinine infusion (4.0–4.5 s; red line) throughout the conditioning process. (E–H) LHb neurons rapidly gained responses to an auditory cue after its coupling to footshock. (E) Heatmap representation of Ca2+ transients during a conditioning session (n = 20 trials). (F) Mean Ca2+ transients across the conditioning trials for the same mouse shown in (E). (G) Mean Ca2+ transients for the entire test group (n = 9 mice). (H) Ca2+ responses to the auditory cue (0–2 s, blue line) increase, whereas those to the footshock (4.0–4.5 s, red line) remain largely stable during the conditioning phase (n = 9 mice). (I–L) The effects of omitting footshock on previously conditioned responses to the footshock-predicting cue. (I) Heatmap representation of Ca2+ transients in an extinction session (30 trials), within which we repetitively presented 30 CS cues but omitted footshock. (J) Mean Ca2+ transients for one extinction session. (I and J) correspond to the same mouse in (E and F). (K) Population mean of Ca2+ transients (n = 9 mice). Thick lines indicate the mean and shaded areas indicate the SEM. Red segments indicate statistically-significant increases from the baseline (p<0.05; multivariate permutation test). (L) Sum of Ca2+ transients during cue presentation (0–2 s; blue line) and footshock omission (4–4.5 s; red line). Each data point represents the average of 5 consecutive trials. (In D, H, L), *p<0.05; **p<0.01; ***p<0.001; ****p<0.0001; n.s., not significant; nonparametric one-way ANOVA with Geisser-Greenhouse correction for the difference between the first data point and those of the following trials.
Figure 3—figure supplement 1

Cue-footshock associative learning changes animal locomotor behavior.
(A) Heatmap representation of the locomotor speed of a mouse shown during a conditioning session. Same mouse as shown in Figure 3E and Figure 3I. (B) At the group level, animal locomotor speed changed during the footshock-predicting period (0–4 s after cue onset) across conditioning trials. Each data point represents the average of 5 consecutive trials. (C) Heatmap representation of the locomotor speed of the same mouse shown in (A) in an extinction session. (D) Population locomotor speed following cue presentation (0–4 s following cue onset) across extinction trials. Each data point represents the average of 5 consecutive trials. The speed was measured as the rate of body position change. (In B and D), *p<0.05; **p<0.01; n.s., not significant; nonparametric one-way ANOVA with Geisser-Greenhouse correction for the difference between the first data point and those in the following trials; n = 5 mice.
Figure 4 with 1 supplement
Social defeat by CD-1 aggressors induces excitatory responses of LHb neurons that were previously nonresponsive to aggressors.
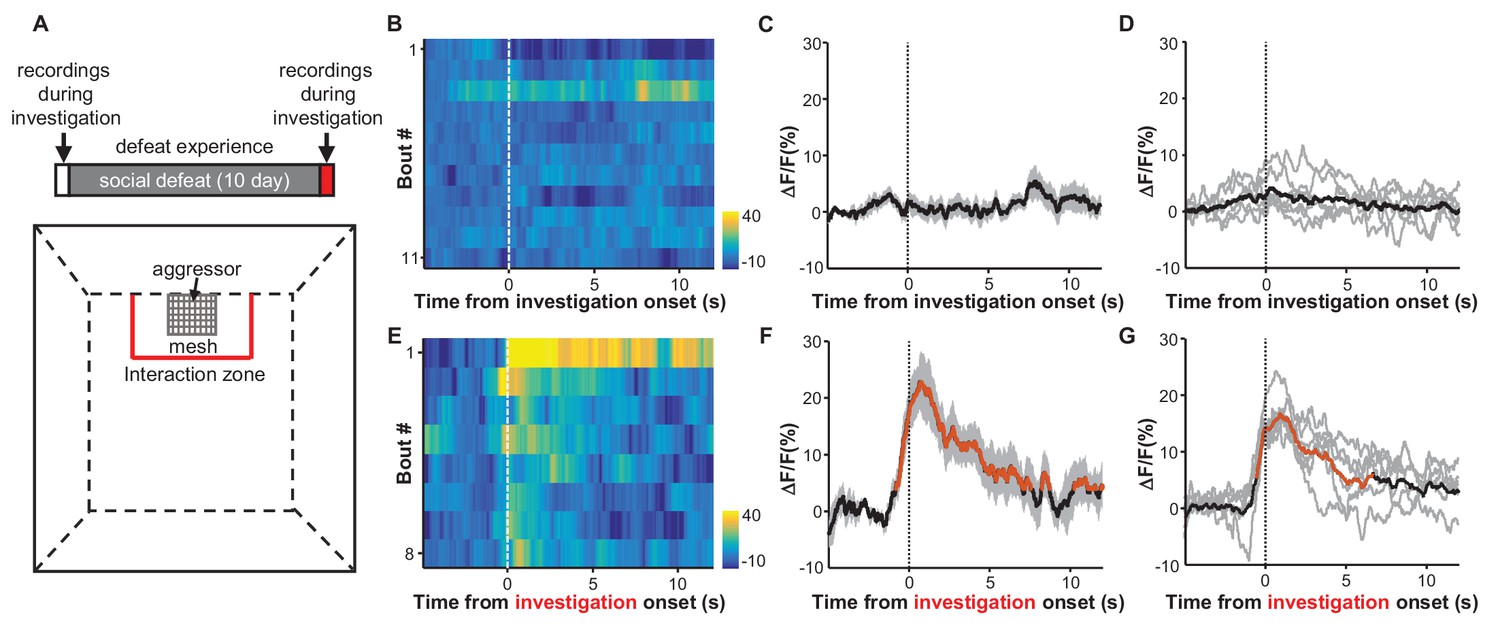
(A) Behavioral experimental paradigm. The upper panel shows the timeline of the experiments. During the first and last days (day 1 and day 12), we recorded Ca2+ signals of LHb neurons from a test mouse interacting with a CD-1 aggressor separated by a mesh enclosure in the social interaction arena (lower panel). During days 2-11, the test mouse was challenged with social defeat by an aggressive CD-1 mouse in the resident CD1 aggressor’s home-cage. (B–D) Heatmap representation (B) and averaged Ca2+ signals (C) from one test mouse and the group data (D, n = 6 mice) show that investigation of the aggressor by the test mouse did not produce any clear activation of LHb neurons. We defined an 'investigation' event as when the test mouse entered the interaction zone near the aggressor. (E–G) Following repeated social defeat over 10 days, a naive aggressor induced clear activation of LHb neurons in the test mouse. (E) A heatmap illustrating the response of eight consecutive investigation events of one test mouse in a behavioral session. (F) Average responses of the same mouse shown in (E). (G) Group data (n = 6 mice). In (C and F), thick lines indicate the mean and shaded areas indicate the SEM. In (D and G), each gray line represents data from an individual test mouse. Red segments indicate statistically-significant increases from the baseline (p<0.05; multivariate permutation test).
Figure 4—figure supplement 1
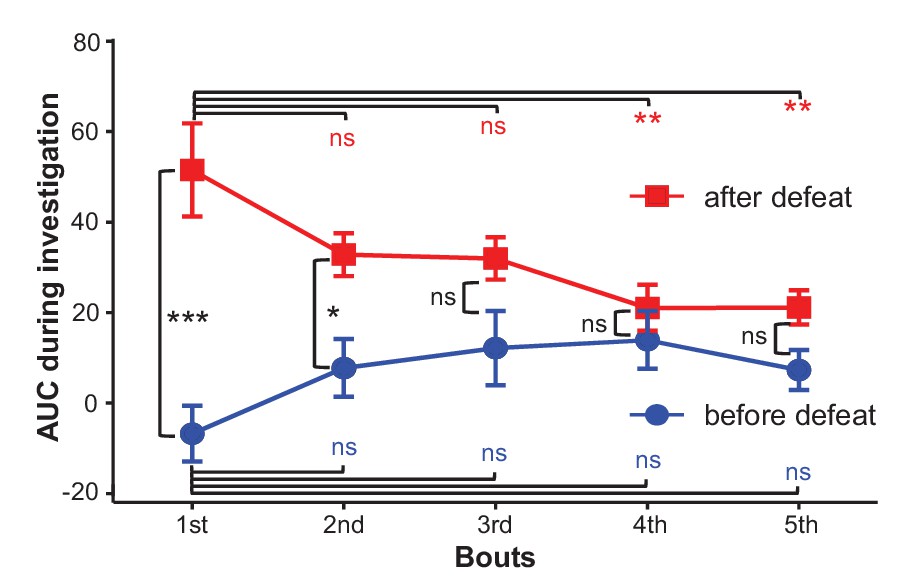
The effects of social defeat and investigation trials on investigation-associated Ca2+ signals of LHb neurons.
During the first day, LHb neurons did not exhibit any significant response to a strange CD-1 male. After 10 daily sessions of social defeat by aggressive CD-1 males, the LHb neurons became significantly activated when the test mouse interacted with an aggressor in a mesh enclosure. ns, not significant; *p<0.05; **p<0.01; ***p<0.001; nonparametric one-way ANOVA with Geisser-Greenhouse correction for analyzing the difference across bouts and t-tests corrected for multiple comparisons using the Holm-Sidak method for analyzing the difference between before- and after- defeat (n = 6 test mice).
Figure 5 with 2 supplements
Appetitive Pavlovian conditioning changes the response patterns of LHb neurons to sucrose and sucrose-predicting cues.
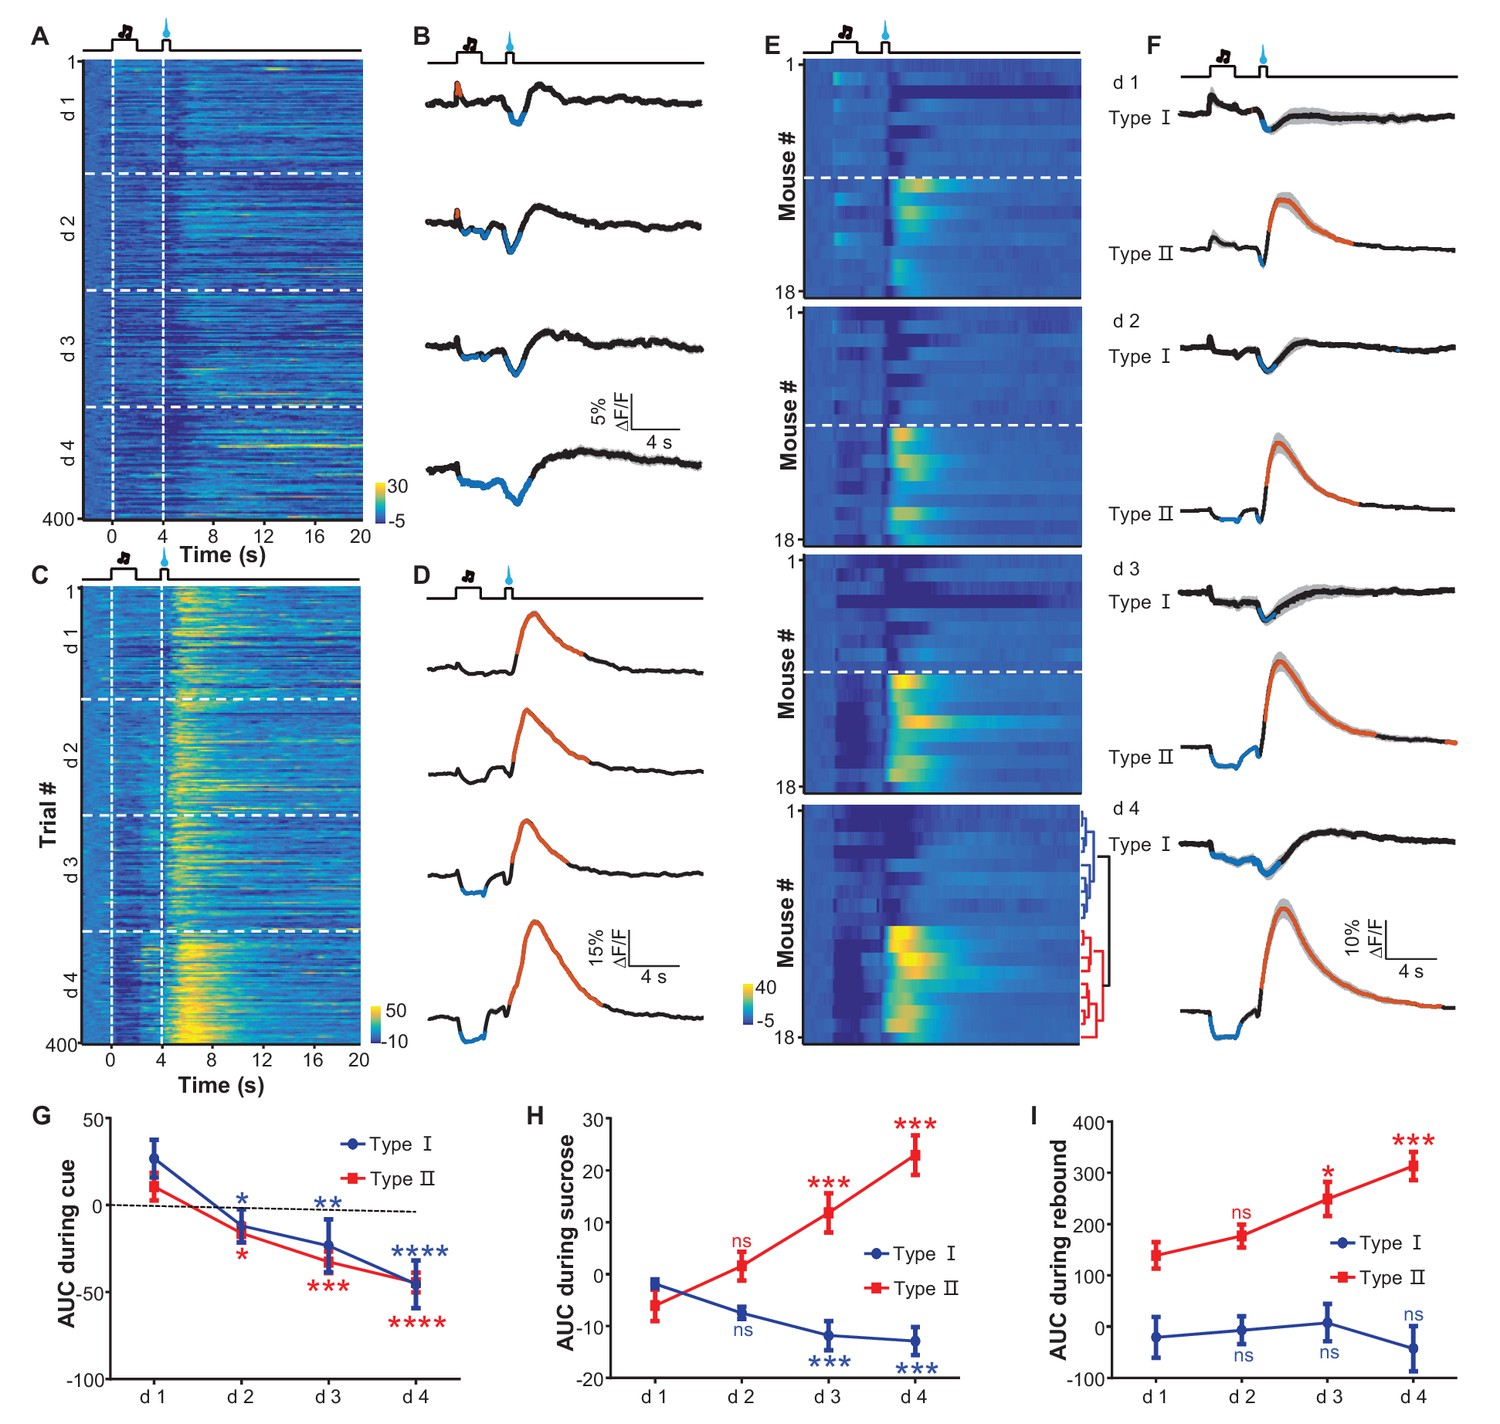
(A and B) An example of inhibitory Ca2+ responses to a cue and to a reward. The mouse was trained by coupling an auditory tone with delayed delivery of sucrose. The heatmap in (A) represents data from four daily sessions, each of which consisted of 100 trials. The peri-event plots (B) illustrate the average Ca2+ transients over four consecutive days (d 1–4) for the same animal shown in (A). (C and D) An example response pattern that included inhibition by the cue and an inhibition-then-excitation response to reward. Same conventions as in (A and B). (E) Heatmap illustration of the reward conditioning-associated Ca2+ signals from 18 individual recording sites across four conditioning sessions (days 1-4). Each row represents one recording site. We clustered the response profiles into two types, including Type I, which exhibited pure inhibitory responses, and Type II, which exhibited inhibition-then-excitation responses. (F) Evolution of Type I and Type II responses across the training sessions. Thick lines indicate the mean and shaded areas indicate the SEM. Red and blue segments indicate statistically-significant increases and decreases from the baseline, respectively (p<0.05; multivariate permutation test). (G–I) The intensity of Type I and Type II responses to the cue presentation (0–2 s; G), sucrose delivery (4.0–4.5 s; H), and post-sucrose evaluation (5–10 s; I) across the four training sessions. *p<0.05; **p<0.01; ***p<0.001; ****p<0.0001; n.s., not significant; nonparametric one-way ANOVA with Geisser-Greenhouse correction for the difference between day 1 and the following days.
Figure 5—figure supplement 1
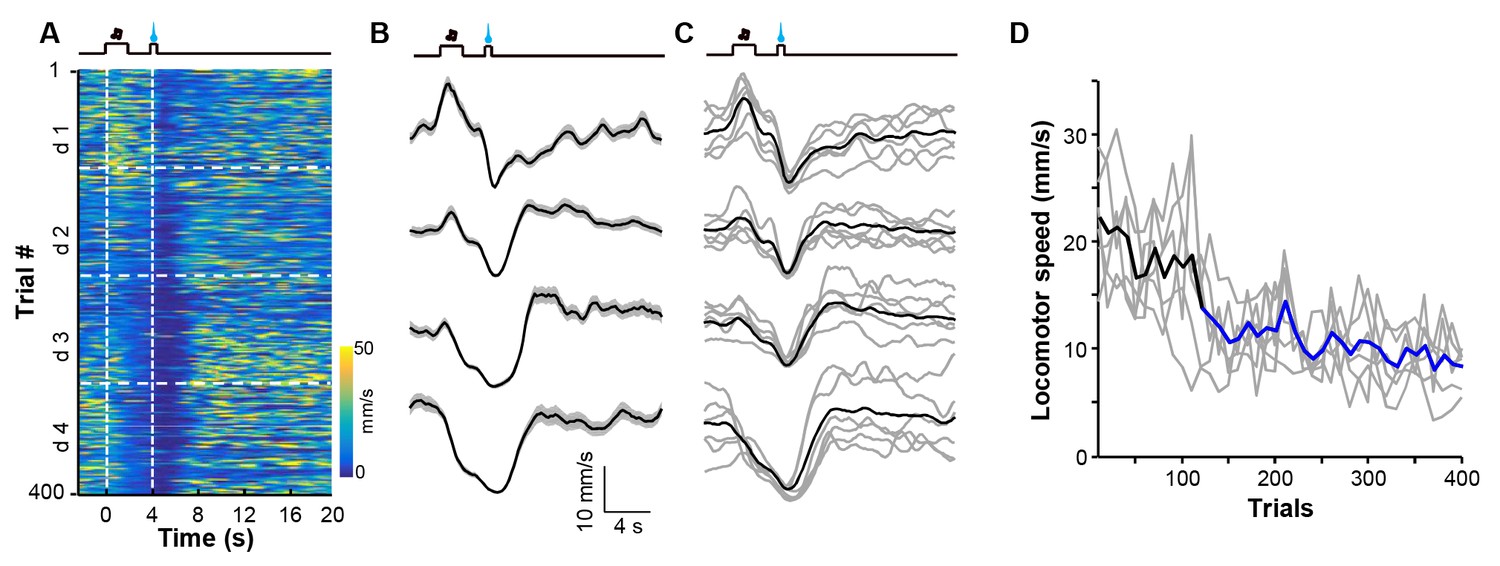
Appetitive Pavlovian conditioning changes animal locomotion during the sucrose-predicting period.
(A and B) Heatmap illustration (A) and peri-event plots (B) of locomotor speed of a mouse from four consecutive conditioning sessions (d1–d4). (C) Mean locomotor speed for the entire test group (n = 6 mice). Black line indicates the average speed and gray lines indicate locomotor speed from each individual mouse. (D) Population change in locomotor speed during the reward predicting period (0–4 s after cue onset) across 400 conditioning trials. Thick line, population average; gray lines, locomotor response of each individual mouse. Each data point represents the average of 10 consecutive trials. Blue segments indicate statistically significant decreases from the baseline (p<0.05; multivariate permutation test; n = 6 mice).
Figure 5—figure supplement 2
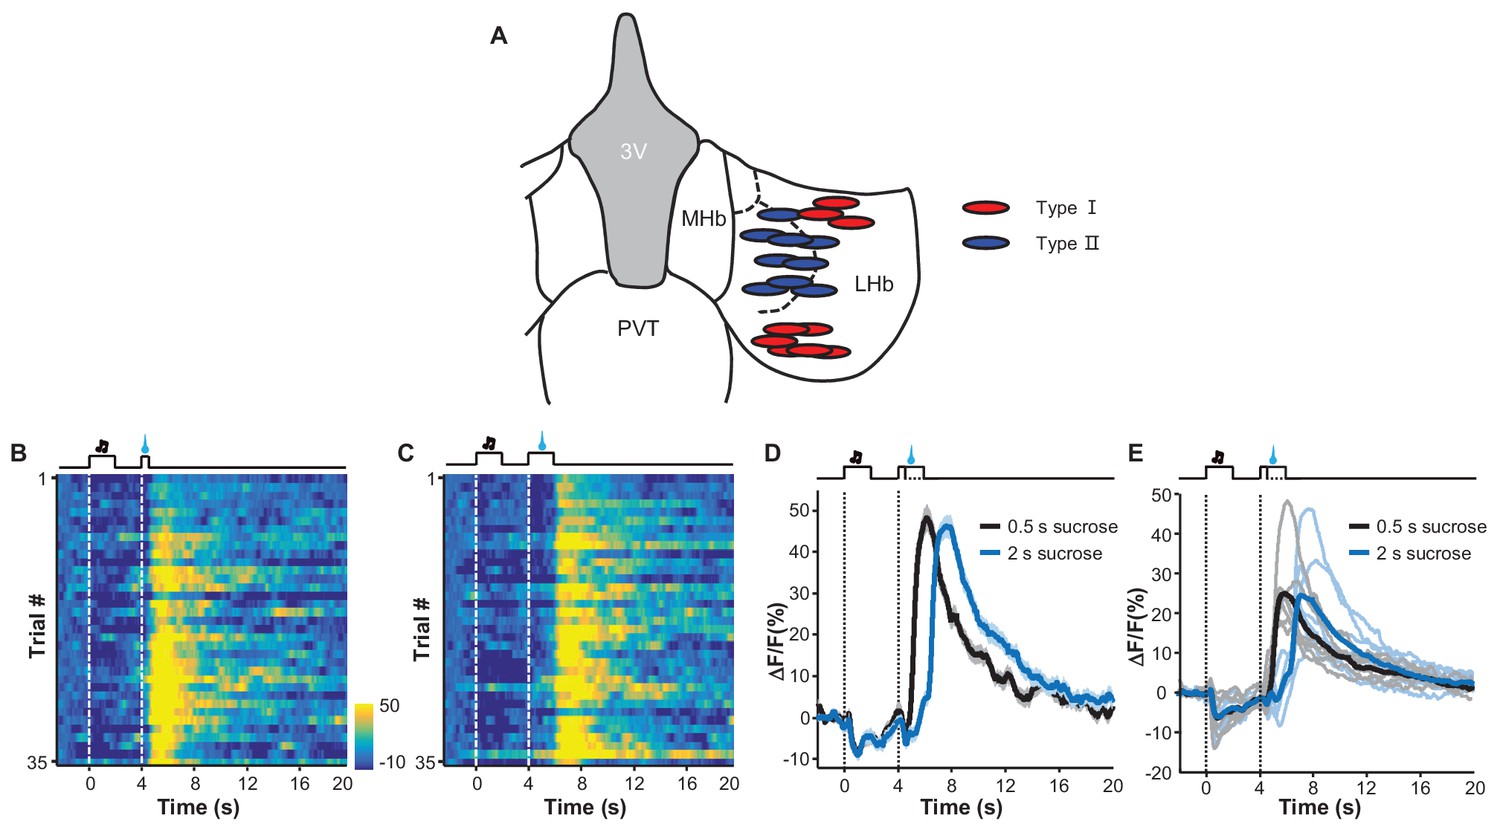
The recording sites associated with the two types of response patterns and the effect of prolonging reward delivery on the inhibition-then-excitation (Type II) response pattern.
(A) Recording sites for Type I and Type II responses. (B–D) Heatmap representations (B and C) and average Ca2+ transients (D) associated with the Type II conditioned responses to sucrose delivery for 0.5 s and 2 s. (E) Population data (n = 6 mice). In (C and D), thick lines indicate the mean and shaded areas indicate the SEM. In (E), individual lines represent data from individual mice, with black and blue lines corresponding to data for, respectively, 0.5 s and 2 s of sucrose delivery duration.
Figure 6
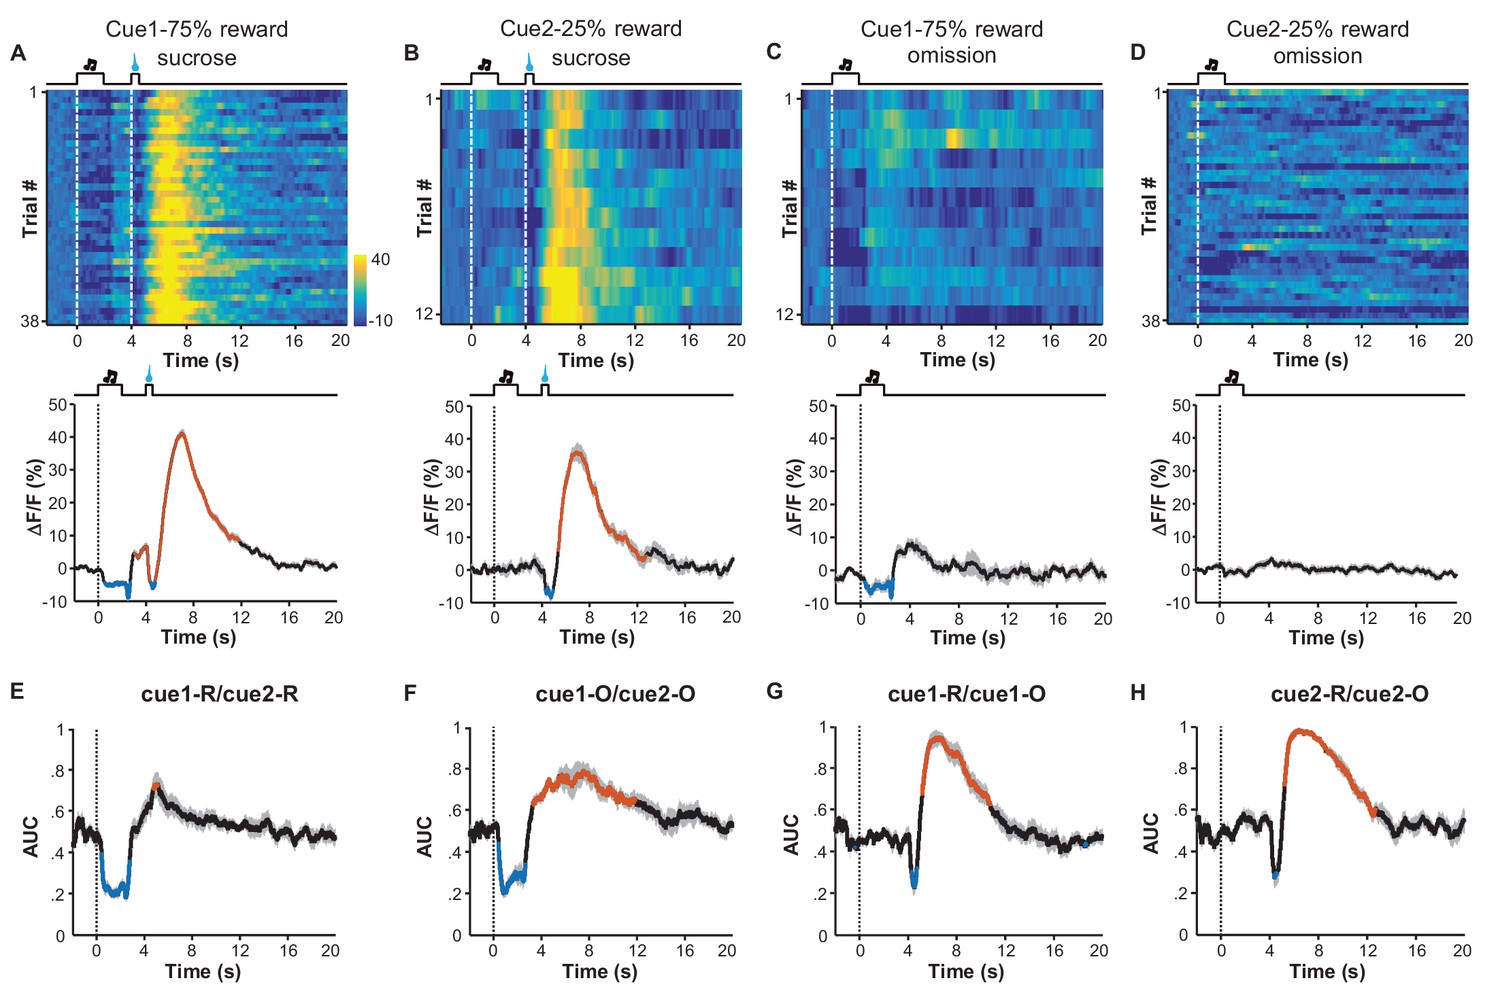
Expected probability of reward modulates the response pattern of LHb neurons.
(A–D) Ca2+ signals of LHb Vglut2-expressing neurons from a mouse within the 6th conditioning session, which consisted of 100 trials with either of two cues that indicated high (75%; Cue 1) or low (25%; Cue 2) probability of sucrose infusion. The heatmaps and peri-event plots of average transients illustrate the responses to reward delivery following Cue 1 (A), reward delivery following Cue 2 (B), reward omission following Cue 1 (C), and reward omission following Cue 2 (D). (E–H) Separable effects of reward probability and reward outcome on the Ca2+ signals of LHb neurons. Regardless of whether a reward was delivered (E) or omitted (F), the cue indicating higher reward probability significantly reduced Ca2+ signals in LHb neurons during the cue, and evoked a rebound after the cue (n = 7 mice). On the other hand, regardless of whether a reward was preceded by a cue of higher reward probability (G) or lower probability (H), actual reward delivery was associated with an initial reduction and then rebound of Ca2+ signals (n = 7 mice). Thick lines indicate the mean and shaded areas indicate the SEM. Red and blue segments indicate statistically-significant increases and decreases from the baseline, respectively (p<0.05; multivariate permutation test). The cue associated with 25% reward probability lacked any statistically significant effect on activity inhibition.
Figure 7 with 1 supplement

Spike firing patterns of individual LHb neurons in a reward Pavlovian conditioning task.
(A) The schematic of setup for recording from LHb Vglut2-expressing neurons in a freely-behaving mouse. (B and C) Identification of a Vglut2-expressing neuron using optical tagging. The arrow in (B) points to the electrolytic lesion site targeted by an optotrode from a representative Vglut2-LHb-ChR2-mCherry mouse. Red, ChR2-mCherry. Blue, DAPI counterstaining of cell nuclei. The peri-event time histogram (PETH, bin width = 50 ms) in (C) shows that trains of light pulses (5 ms, 10 Hz) transiently and reliably evoked spike firing from a single unit. (D) Spike firing pattern of a representative LHb neuron (the same one shown in C). Upper panel, heatmap representation of the spike firing rates within the fourth daily session of Pavlovian reward conditioning. The color scale indicates the range of firing rates (spikes/s). Lower panel, PSTH of the mean firing rates (smoothed with a Gaussian kernel with σ of 50 ms). (E) The firing patterns of individual Vglut2 neurons (n = 70 optically-tagged cells). The standardized spike firing rates are represented as heatmaps. Each row represents the firing pattern of a single unit aligned to the cue onset. Principal component analysis indicates that the firing patterns cluster into two major subtypes. (F and G) Mean standardized firing rates of the Type I (F) and the Type II (G) response patterns of LHb neurons. Thick lines indicate the mean and shaded areas indicate the SEM. Red and blue segments indicate statistically-significant increases and decreases from the baseline, respectively (p<0.05; multivariate permutation test).
Figure 7—figure supplement 1
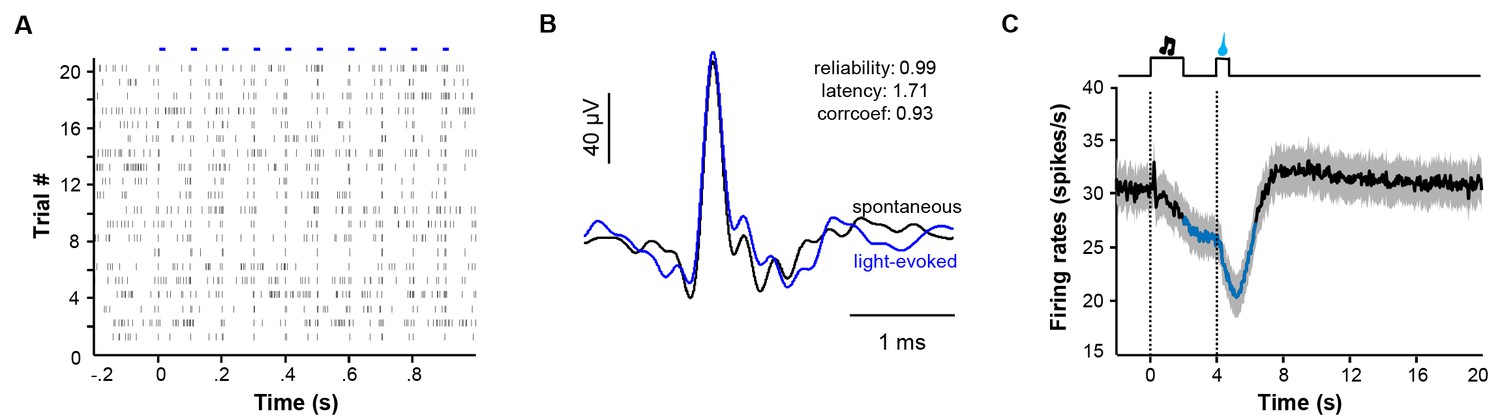
Identification of LHb neurons and the overall response pattern in a reward Pavlovian conditioning task.
(A) Raster plot showing that trains of light pulses (5 ms, 10 Hz) transiently and reliably evoked spike firing from a single unit in a Vglut2-LHb-ChR2-mCherry mouse. Each dot indicates a spike. (B) Overlaying average waveforms revealed that the light-evoked spikes (blue) resembled spontaneous spikes (black). (C) Average PETH of the firing rates for all identified LHb neurons (n = 70 cells).
Author response image 1

Heatmaps represent the firing patterns of individual Vglut2 neurons clustered by response intensities during cue onset (A) and during US delivery onset (B).
n = 70 optically-tagged cells.
Author response image 2
There is not clear relationship between the cue-evoked Ca2+ signals and animal locomotor speed.
(A) Heatmap representation of Ca2+ transients during a conditioning session (n =20 trials; the same one shown in Figure 3E). (B) The peri-event plot of the average Ca2+ transient from the same mouse shown in (A) during the first 5 trials (black) and last 5 trials of the conditioning session. (C) Heatmap represents the locomotion speed of the same mouse shown in (A) during a conditioning session. (D) Walking distance during cue presentation (0-2 s; blue line) and footshock delivery (4-4.5 s; red line). Each data point represents the average of 5 consecutive trials. (E-H) The effects of omitting footshock on previously conditioned responses to the footshock-predicting cue and locomotion speed. (E) Heatmap representation of Ca2+ transients in an extinction session (30 trials), within which we repetitively presented 30 CS cues but omitted footshock. (F) Mean Ca2+ transients in one extinction session. (E and F) correspond to the same mouse in (A and B). (G) Heatmap represents the locomotor speed of the same mouse shown in (A) in an extinction session. (H) Walking distance during cue presentation (0-2 s; blue line) and footshock omission (4-4.5 s; red line). Each data point represents the average of 5 consecutive trials. The distance was measured as the accumulating pixel changes in video frames during either CS or US presentation. (In D, H) n.s., not significant; nonparametric one-way ANOVA for the difference between the first data point and those of the following trials.
Videos
Video 1
Social attack by an aggressor activates LHb neurons.
Using fiber photometry, we recorded GCaMP signals from the LHb neurons of a male mouse. Following its introduction to the cage of an aggressive CD-1 male, this test animal was repetitively attacked by the CD-1 aggressor. The social attack was reliably associated with strong increases in GCaMP signals.
Download links
A two-part list of links to download the article, or parts of the article, in various formats.
Downloads (link to download the article as PDF)
Open citations (links to open the citations from this article in various online reference manager services)
Cite this article (links to download the citations from this article in formats compatible with various reference manager tools)
Learning shapes the aversion and reward responses of lateral habenula neurons
eLife 6:e23045.
https://doi.org/10.7554/eLife.23045


