Modelling primaquine-induced haemolysis in G6PD deficiency
- Mahidol University, Thailand
- University of Oxford, United Kingdom
- Institut Pasteur du Cambodge, Cambodia
- National Center for Parasitology, Entomology and Malaria Control, Cambodia
Figures
Figure 1
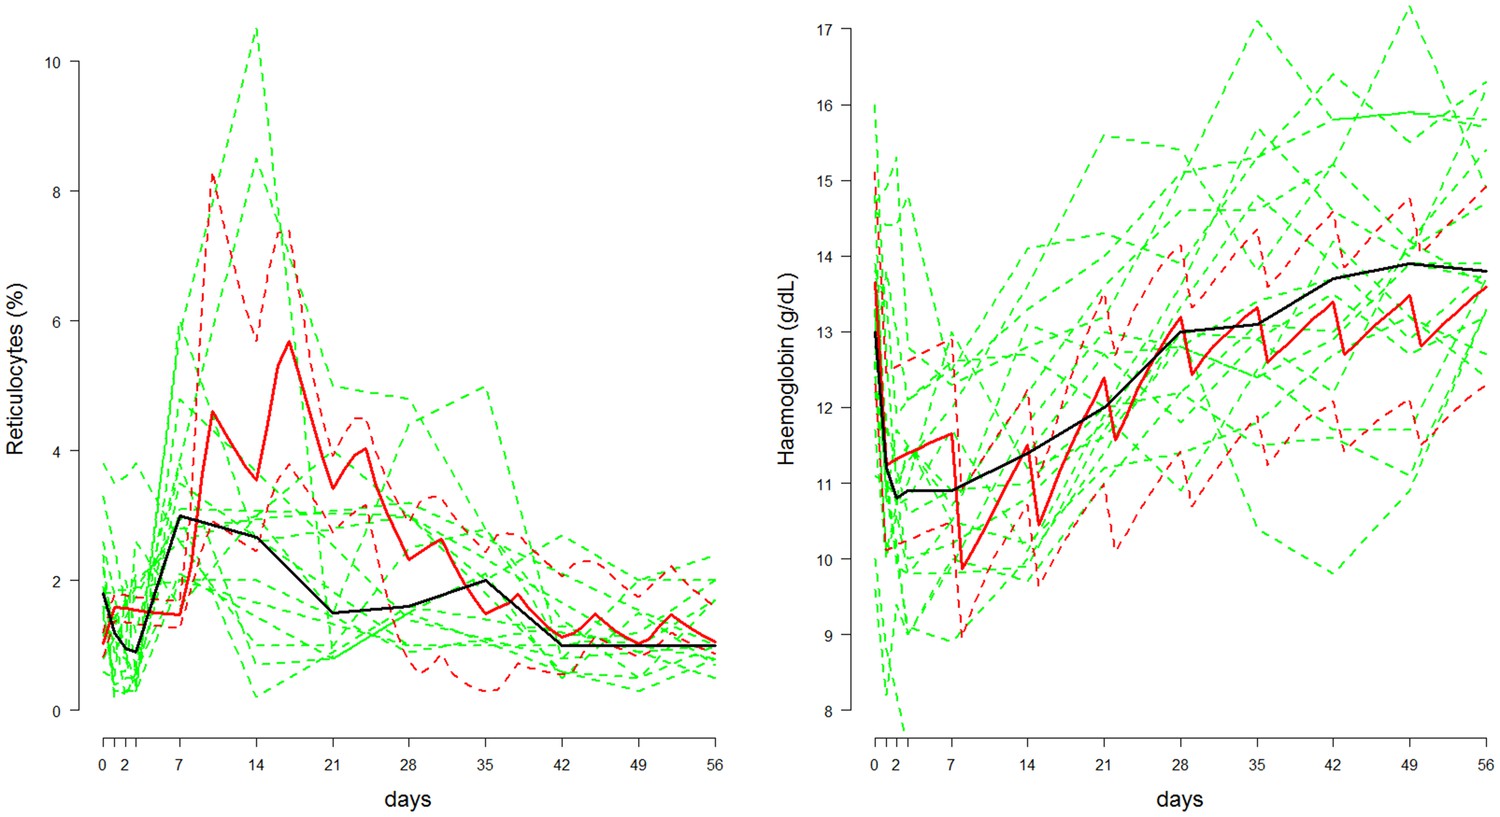
Comparison between the data from Kheng et al. (2015) (shown in green, population median in thick black line) and posterior predictive 80% credible intervals (shown in red, median: thick line; 10&90% boundaries: dashed lines) in which adult Cambodian patients who were G6PD deficient were given weekly primaquine (45 mg) for eight weeks.
Left: reticulocyte response; Right: haemoglobin response.
Figure 2
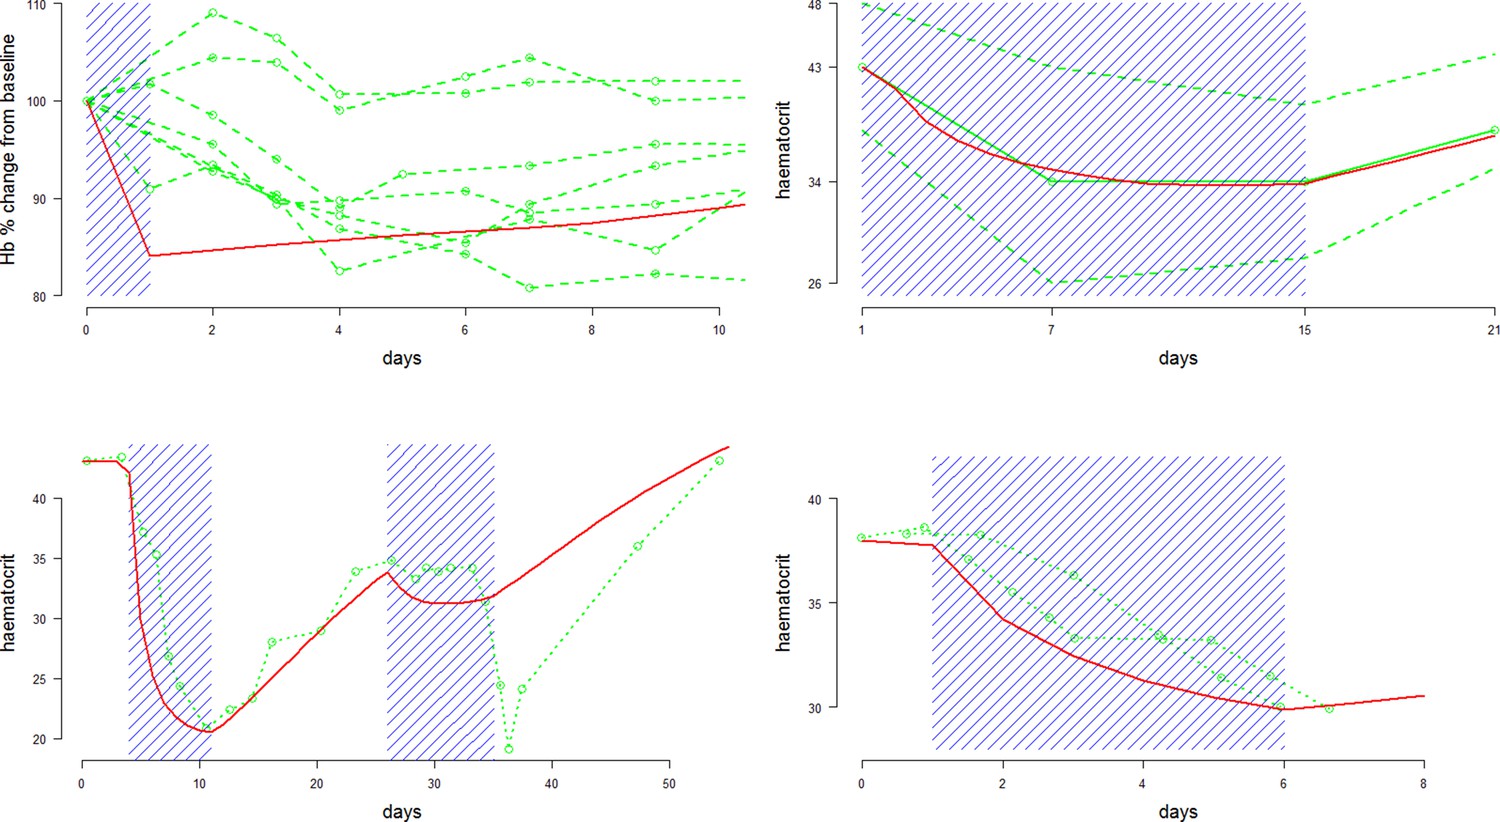
Comparison between approximate model fits (red) and data (green) extracted from four primaquine studies with a single dose or daily regimens all at 30/45 mg adult doses.
Dosing periods are shaded in blue. The top two plots are for Mahidol and Viangchan variants, respectively. The bottom two plots are for the Mediterranean variant. From top left to bottom right: single 45 mg dose given to 7 G6PDd Mahidol Thais (Charoenlarp et al., 1972); 14 daily doses of 30 mg given to 15 G6PDd presumed Viangchan variant Khmer soldiers (only mean and extreme values reported) (Everett et al., 1977); 1 G6PDd Med Sardinian given two courses of daily 30 mg doses (Pannacciulli et al., 1965); 2 G6PDd Med Sardinians given 5 daily doses of 30 mg (Salvidio et al., 1967).
Figure 3
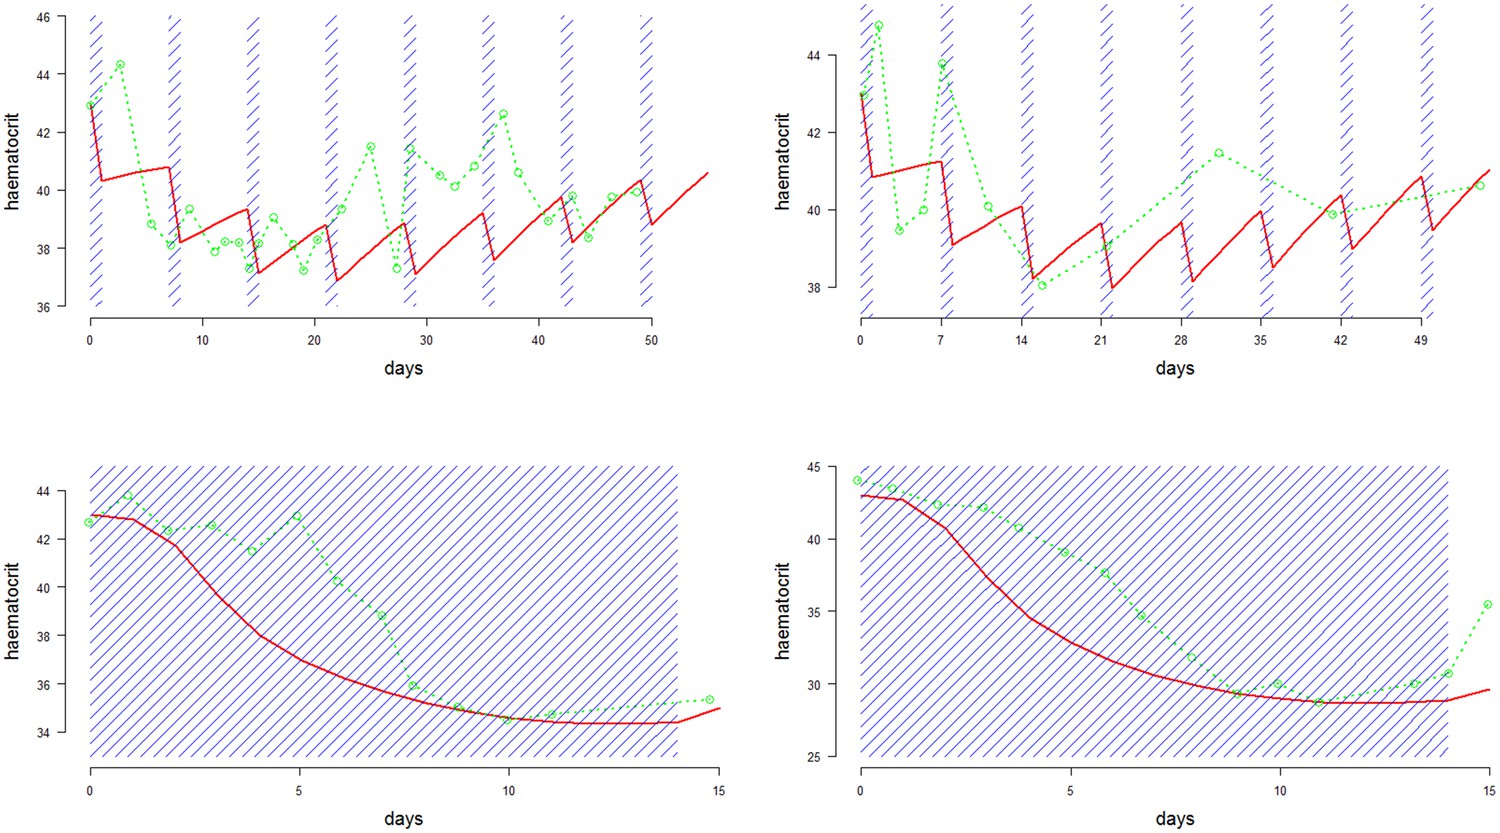
Comparison between approximate model fits (red) and data (green) extracted from four primaquine studies on the same individual with G6PDd African (Alving et al., 1960).
Dosing periods are shaded in blue. The top two plots are for weekly dosing regimens (8 doses): left is 60 mg per week; right is 45 mg per week; the bottom two plots are daily dosing regimens (14 doses): left is 15 mg per day; right is 30 mg per day.
Figure 4
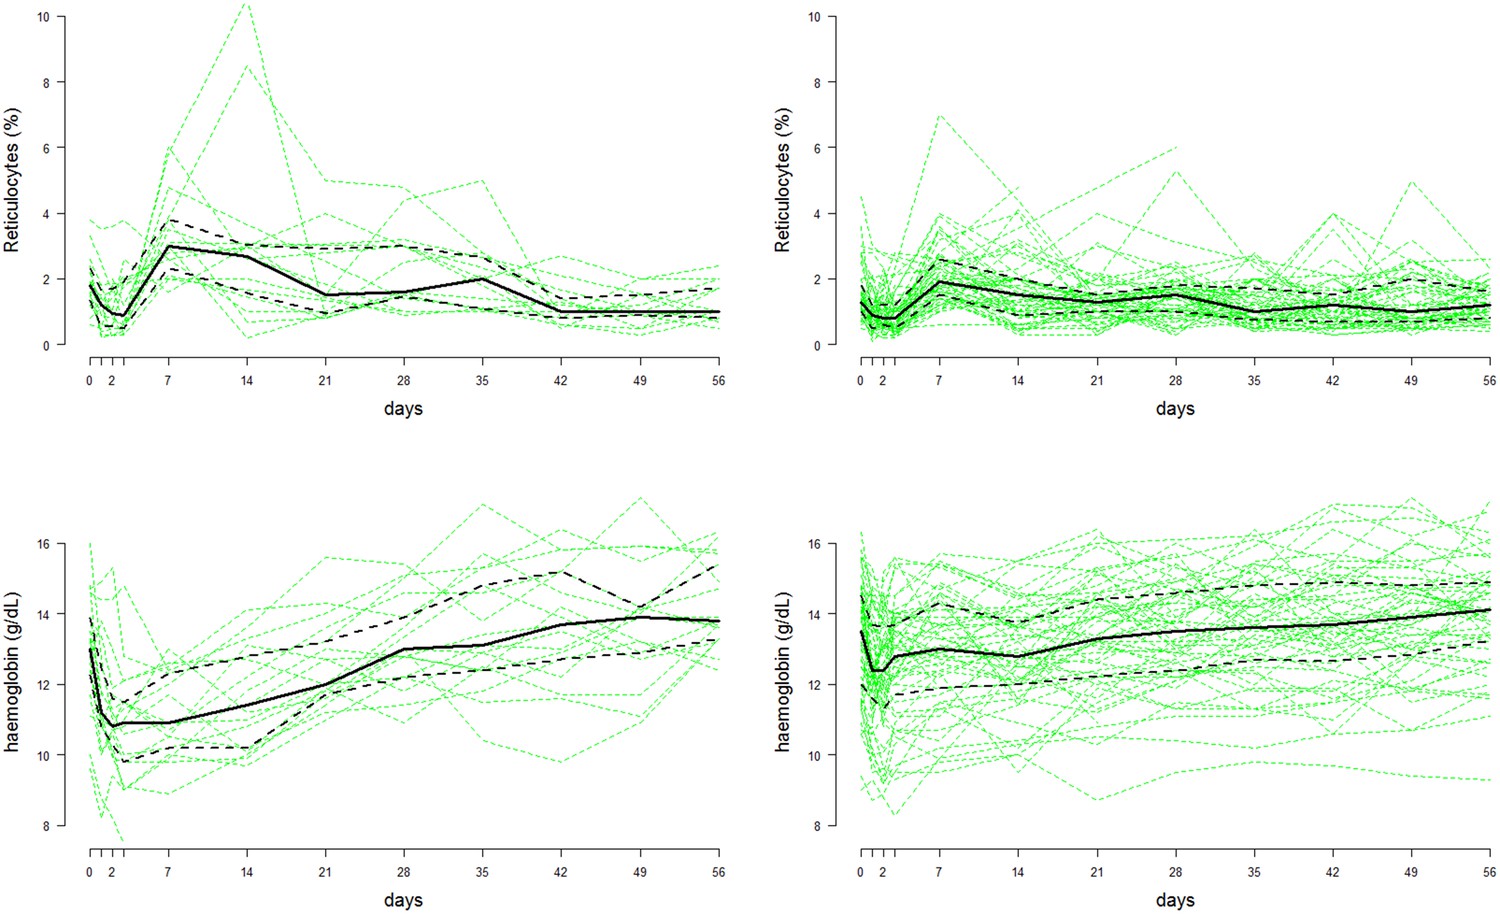
Time series data of reticulocyte count (top row) and haemoglobin concentrations (bottom row) from the Cambodian study on G6PDd individuals (, left column) and G6PD normals (, right column) (Kheng et al., 2015).
The faint green lines show individual patient data; the thick black lines represent the population median values at each time-point; the dashed black lines show the interquartile range.
-
Figure 4—source data 1
This provides the source data for the reticulocyte counts and haemoglobin concentrations over time from the Kheng et al. (2015) study on weekly high-dose primaquine.
- https://doi.org/10.7554/eLife.23061.007
Figure 5
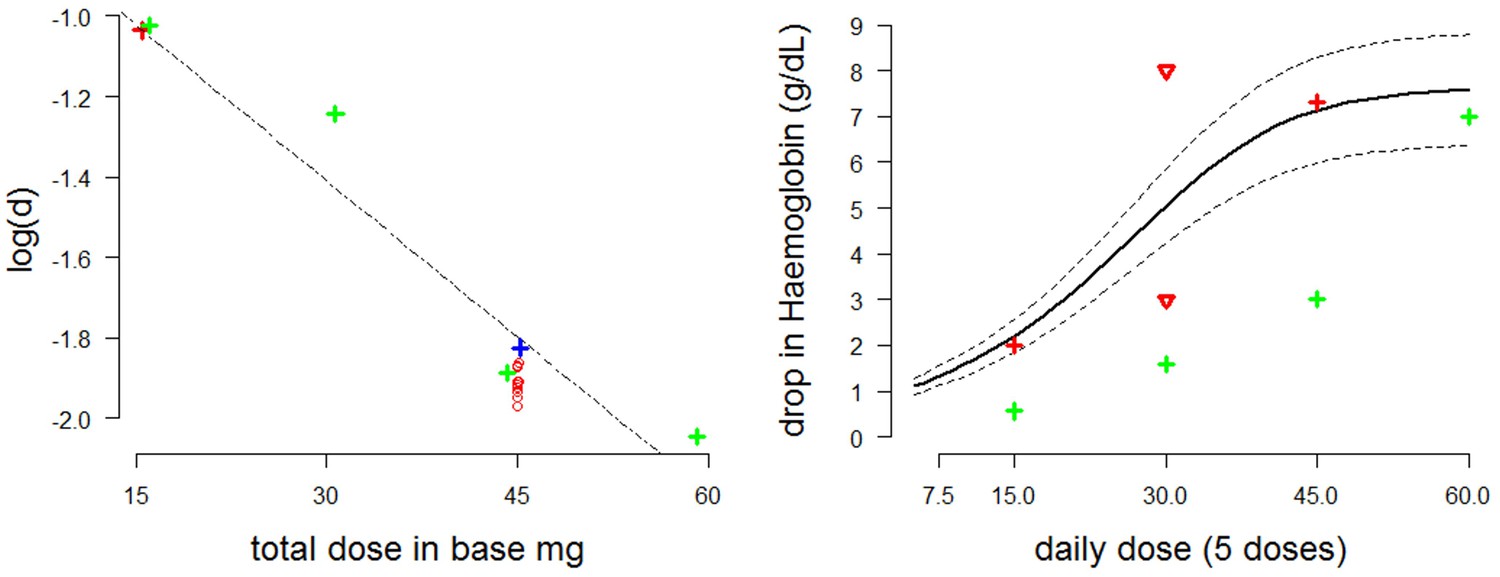
Estimating the dose-response curve for moderate/severe G6PDd.
Left: estimates of the parameter as a function of the administered dose plotted with a linear regression curve (red cross: Viangchan; red circles: posterior estimates from model fitted to data from G6PDd Viangchan; blue cross: Mahidol; green crosses: African ). Right: dose-response curve (thick black line) with 90% credible intervals (dotted black lines) as measured by fall in haemoglobin (-axis) after five days at a given dose (-axis) based on draws from the posterior distribution. The red and green crosses are the estimated falls after five days from Viangchan and African studies, respectively (see Figures 2,3). The red triangles show the falls observed in G6PDd Med studies from Figure 2.
Figure 6
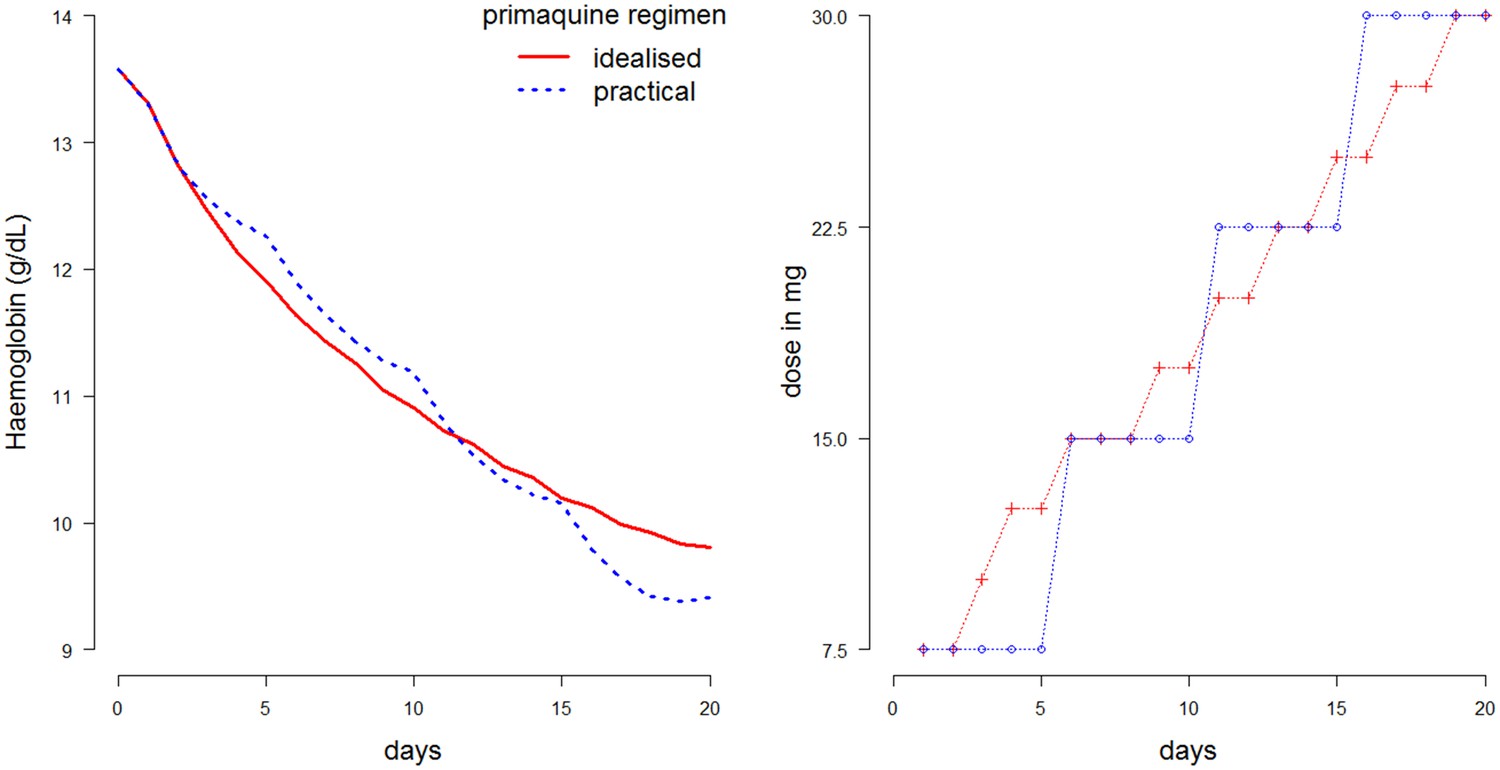
Comparison of two 20-day ascending-dose regimens.
Left: haemolysis over time resulting from regimens. Blue: simplified regimen; red: idealized optimal regimen. Right: daily dosing construction for the two regimens. Total dose of blue regimen is 375 mg; total dose of red regimen is 382.5 mg.
Figure 7
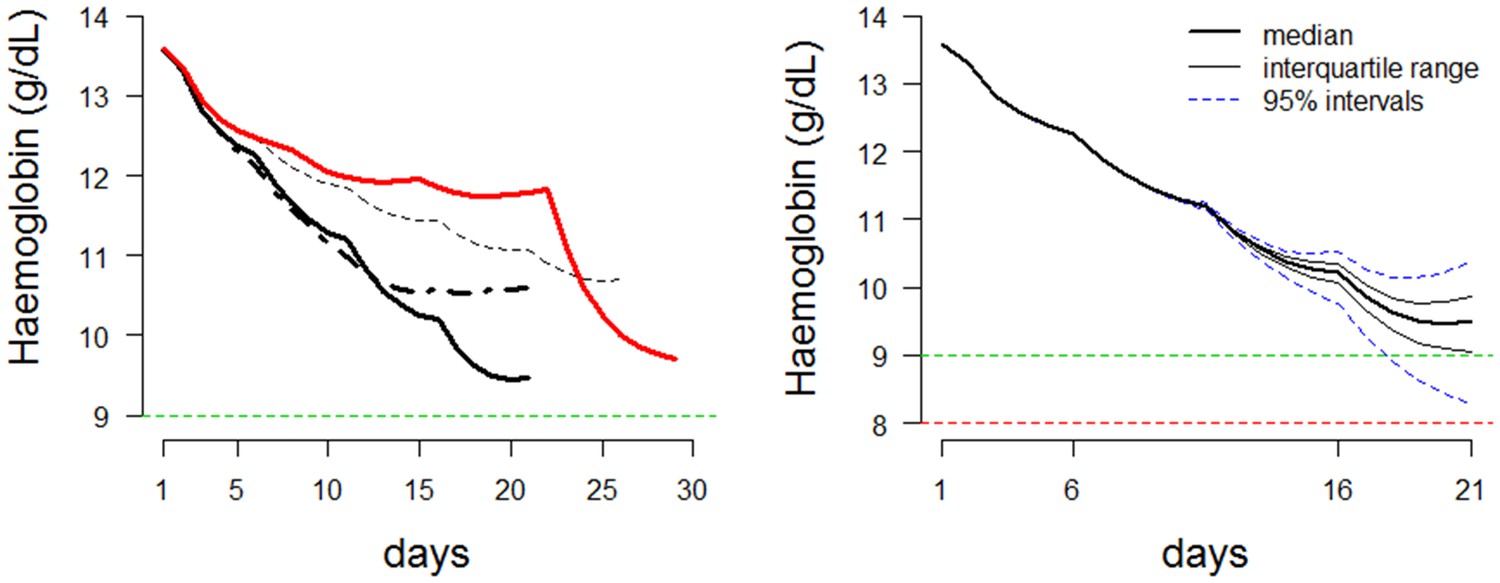
Dynamics of ascending regimens.
Left: Comparing the haemolytic effect of four regimens. Thick black line: proposed optimal regimen; thick black dashed line: more conservative regimen with lower total dose; thin black dashed line: longer duration regimen for more severe variants; thick red line: bad choice regimen. Right: Posterior predictions for the proposed ascending dose for a given starting haemoglobin (steady state). Prediction using the median posterior values is shown by a thick black line. Predictions for 100 random draws from the posterior are shown by dashed blue lines. The horizontal line at a haemoglobin concentration of 9 is a proposed conservative ‘safety threshold’. Horizontal line at a haemoglobin concentration of 8 is a proposed regimen limiting toxicity threshold.
Appendix 1—figure 1
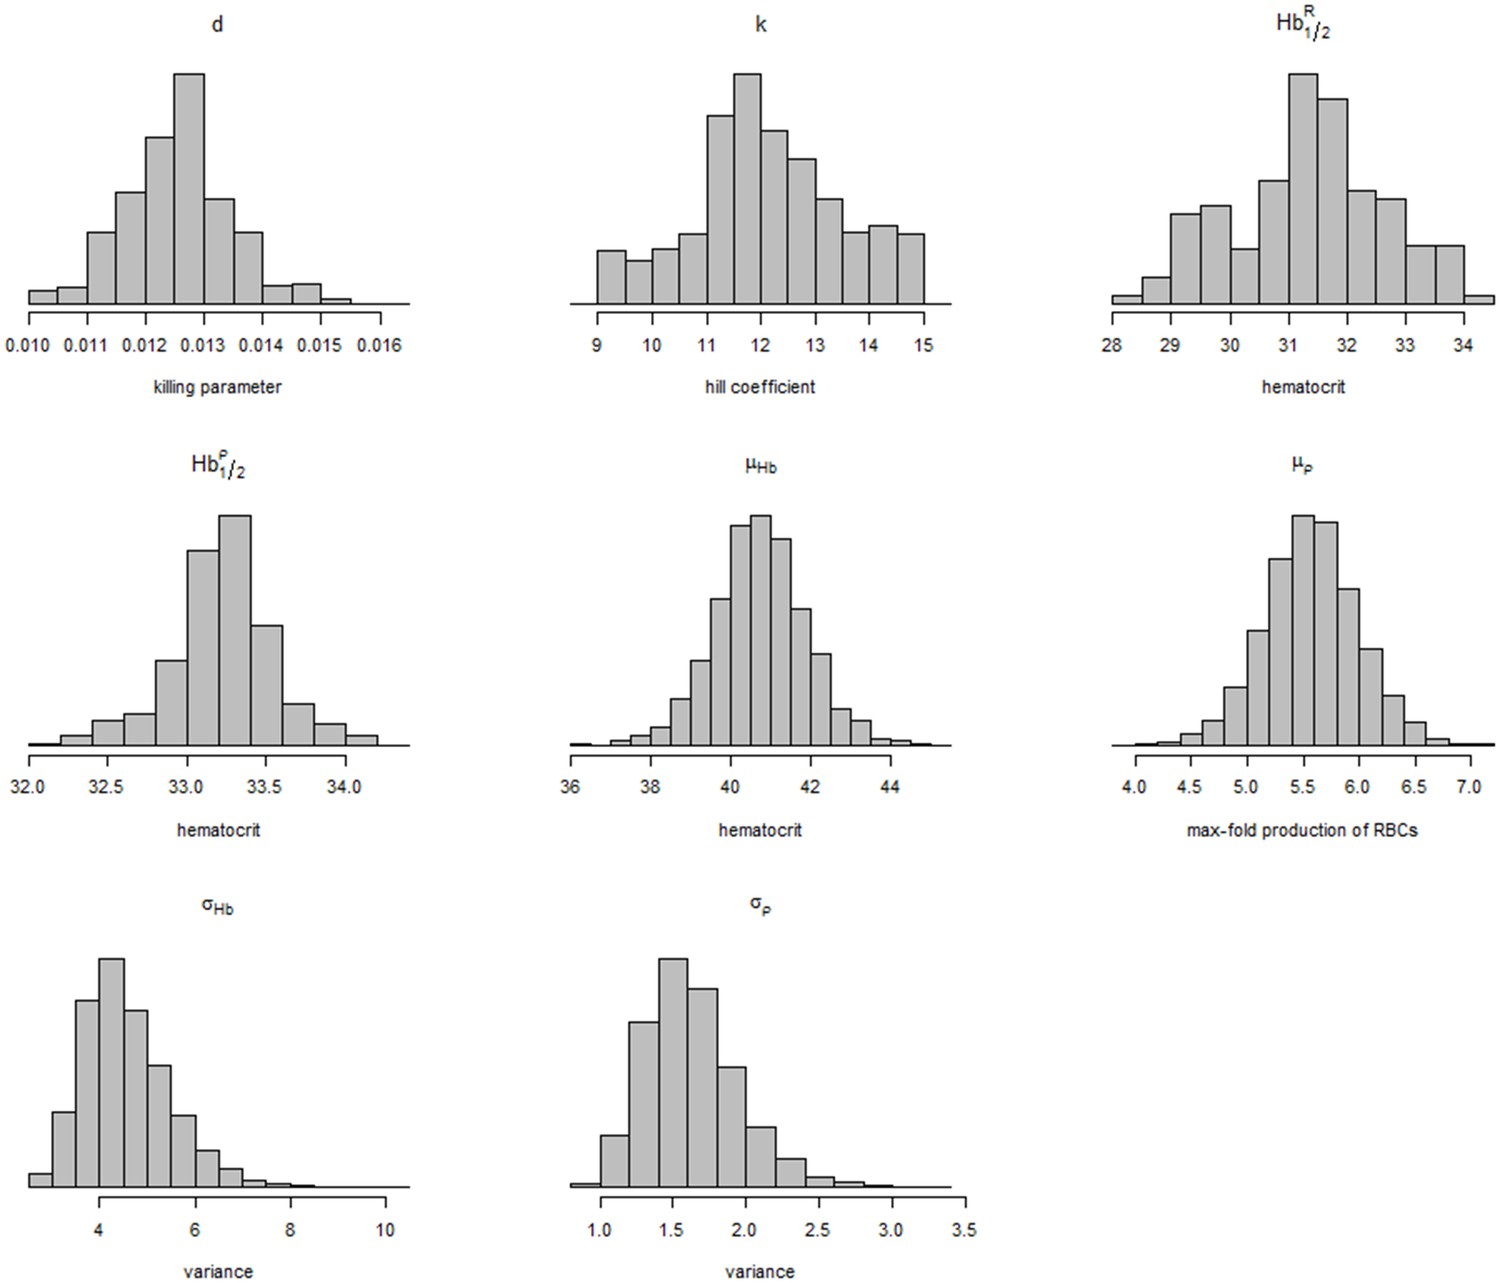
Posterior distributions of model parameters and hyperparameters.
https://doi.org/10.7554/eLife.23061.016
Appendix 1—figure 2
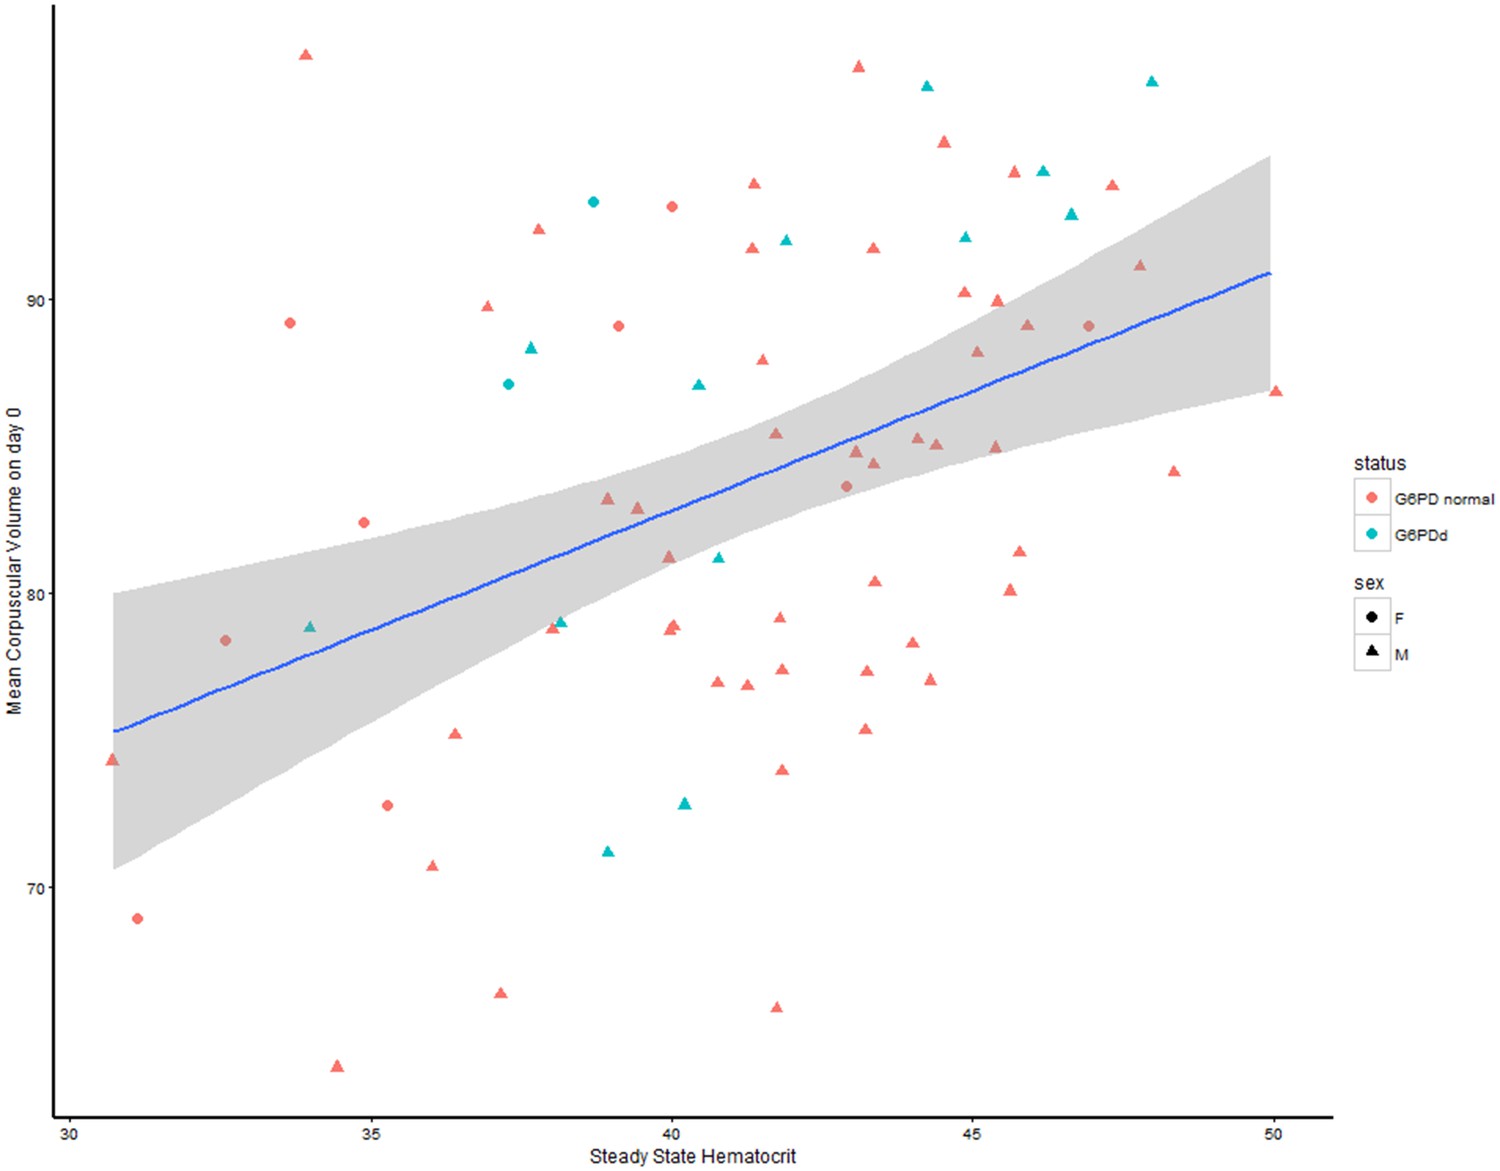
Relationship between the steady state haematocrit and the mean corpuscular volume at day zero.
G6PDd patients are colored in blue, G6PD normal patients in red; women are shown by circles, men by triangles.
Appendix 1—figure 3
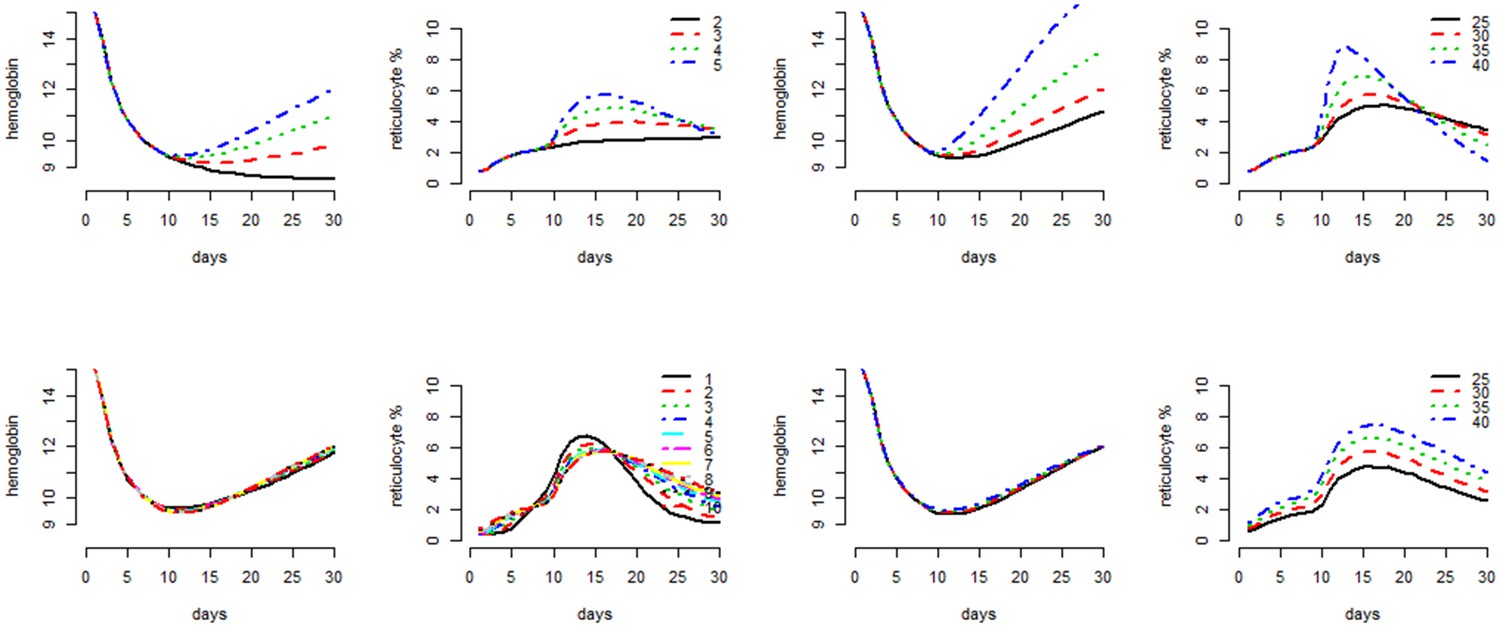
Individual parameter effects on the behavior of the compartmental model as shown by the haematocrit response and the reticulocyte count response.
From top left to bottom right, grouped by pairs: the mid-haemoglobin concentration parameter for the reticulocyte release function; the mid-haemoglobin concentration parameter for the marrow production function; the hill coefficient for the reticulocyte release function; the max-fold production factor . The different values plotted for each parameter are shown in the legend for reticulocyte response plot.
Videos
Video 1
Animated video showing the red blood cell dynamics for our optimal ascending dose regimen.
https://doi.org/10.7554/eLife.23061.010Tables
Table 1
Illustrative regimens. A is our proposed optimal ascending dose regimen; B is a slight variation on this regimen (accelerated); C is a slower ascending dose regimen (potentially suitable for more severe variants); D illustrates a very poor regimen.
| Regimen | Day | |||||
|---|---|---|---|---|---|---|
| 1-5 | 6-10 | 11-15 | 16-20 | 21-25 | 26-30 | |
| A | 7.5 mg | 15 mg | 22.5 mg | 30 mg | - | - |
| B | 7.5 mg x3 d;10 mg x 2 d | 15 mg x 3 d; 17.5 mg x 2 d | 20 mg | 22.5 mg x 3 d; 25 mg x 2 d | - | - |
| C | 5 mg | 10 mg | 15 mg | 20 mg | 25 mg | - |
| D | 5 mg | 5 mg x 2 d; 10 mg x 3 d | 10 mg x 4 d; 15 mg x 1 d | 15 mg | 15 mg x 1d; 30 mg x 4d | 30 mg x 3 d |
Table 2
Parameters and functions of the compartmental model along with their interpretation.
| Parameter | Units | Meaning |
|---|---|---|
| unitless | Parameter of age-dependent killing function. | |
| Hb | Steady state haemoglobin concentration. | |
| Hb | Haemoglobin concentration at time . | |
| unitless | Fold-increase in production of RBCs as a function of haemoglobin concentration (at steady state ). | |
| unitless | Maximum fold increase in RBC production, this will be reduced in anemia. | |
| Hb | Haemoglobin concentration for which production is elevated to . | |
| days | Time of release of reticulocytes into circulation as a function of haemoglobin concentration. | |
| unitless | Hill coefficient of sigmoid function . | |
| Hb | Haemoglobin concentration corresponding to the mid-point of sigmoid describing reticulocyte release into circulation. | |
| hours | Earliest age of an RBC vulnerable to primaquine-induced haemolysis. | |
| hours | Time to reach the maximum haemolytic effect of primaquine. | |
Additional files
-
Supplementary file 1
Posterior MCMC samples from model run on data from Kheng et al. (2015).
- https://doi.org/10.7554/eLife.23061.014
-
Source code 1
Model code.
- https://doi.org/10.7554/eLife.23061.015
Download links
A two-part list of links to download the article, or parts of the article, in various formats.
Downloads (link to download the article as PDF)
Open citations (links to open the citations from this article in various online reference manager services)
Cite this article (links to download the citations from this article in formats compatible with various reference manager tools)
Modelling primaquine-induced haemolysis in G6PD deficiency
eLife 6:e23061.
https://doi.org/10.7554/eLife.23061


