Bacterial flagella grow through an injection-diffusion mechanism
- Helmholtz Centre for Infection Research, Germany
- Max Planck Institute for Infection Biology, Germany
- Osaka University, Japan
- Institute of Science and Technology Austria, Austria
- Laval University, Quebec City, Canada
- IBM Thomas J Watson Research Center, United States
- RIKEN Quantitative Biology Center, Japan
- University of Utah, United States
Figures
Figure 1 with 2 supplements
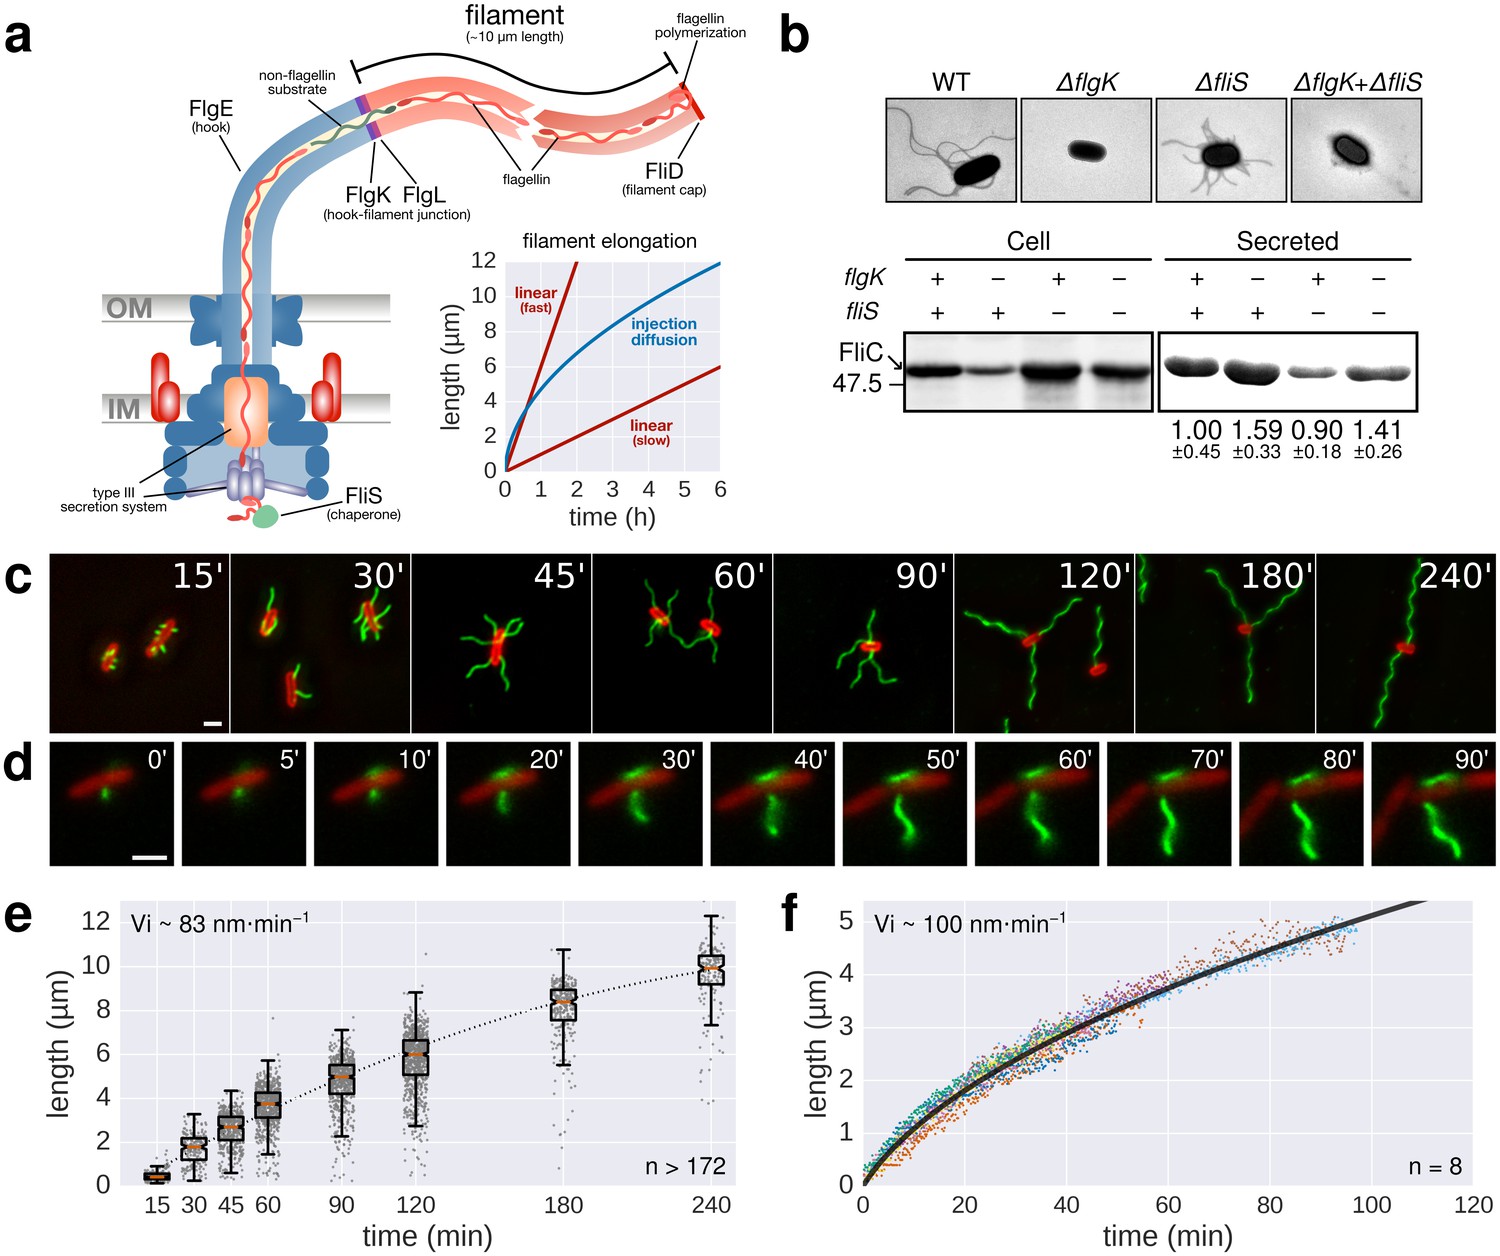
Flagellin protein export and flagella growth rate decrease with filament length.
(a) Schematic depiction of the bacterial flagellum and proposed models to explain the filament elongation dynamics (Iino, 1974; Turner et al., 2012; Evans et al., 2013). OM=outer membrane, IM=inner membrane. (b) Top: Electron micrograph images of mutants deficient in the hook-filament junction protein FlgK or the flagellin-specific chaperone FliS. Bottom: Immunoblotting of cellular and Coomassie-staining of secreted flagellin (FliC) in ∆flgK and ∆fliS mutant strains (relative secreted flagellin levels report mean ± s.d., n = 3). (c) Representative images of a population-based flagellin immunostaining time-course. Time in minutes after induction of flagellin synthesis is indicated. (d) Continuous in situ flagellin immunostaining reveals elongation kinetics of individual filaments in real time. Exemplary movie frames are shown and elapsed time in minutes after start of imaging is indicated. (e) Quantification of the population immunostaining. Measured filaments per group: t15’ (n = 187), t30’ (n = 206), t45’ (n = 480), t60’ (n = 648), t90’ (n = 700), t120’ (n = 827), t180’ (n = 302), t240’ (n = 172). The box plot reports the median (in red), the 25th and 75th quartiles and the 1.5 interquartile range. (f) Quantification of the continuous in situ flagellin immunostaining. The dark line represents the global, averaged fit of 8 individual filaments. Raw data shown as coloured dots excluding measurement incidents as explained in Figure 1—figure supplement 2. The initial velocity (Vi) was measured on the initial, linear part of the growth curve. Scale bars 2 µm.
Figure 1—figure supplement 1
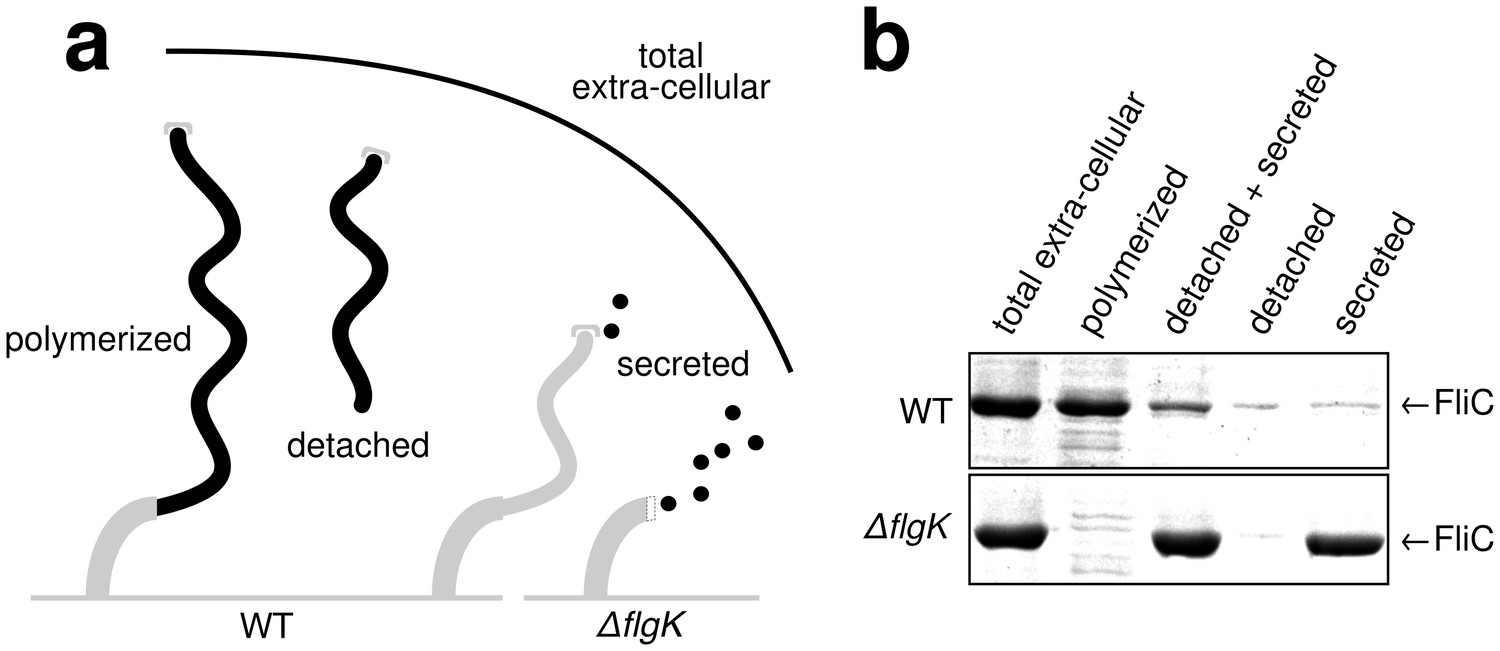
Quantitative measurements of flagellin leakage during filament formation.
(a) Schematic overview of experimental setup to determine flagellin leakage during filament assembly. The black elements represent the quantified fractions. (b) Coomassie-staining of total extracellular flagellin (filaments attached to cell bodies and flagellin secreted into culture supernatant), polymerized flagellin (filaments attached to cell bodies), detached and secreted flagellin (FliC detected in culture supernatant), detached flagellin (filaments detached from cell bodies as collected by ultracentrifugation of cleared culture supernatant) and secreted flagellin (FliC monomers detected in the culture supernatant after ultracentrifugation) of wild-type (WT) and ∆flgK mutant strains. Relative extracellular flagellin levels in the wild-type were 1.000 ± 0.175 for total extracellular flagellin, 0.756 ± 0.046 for polymerized flagellin, 0.239 ± 0.037 for detached and secreted flagellin, 0.057 ± 0.036 for detached flagellin and 0.085 ± 0.021 for secreted flagellin (mean ± s.d., n = 4).
Figure 1—figure supplement 2
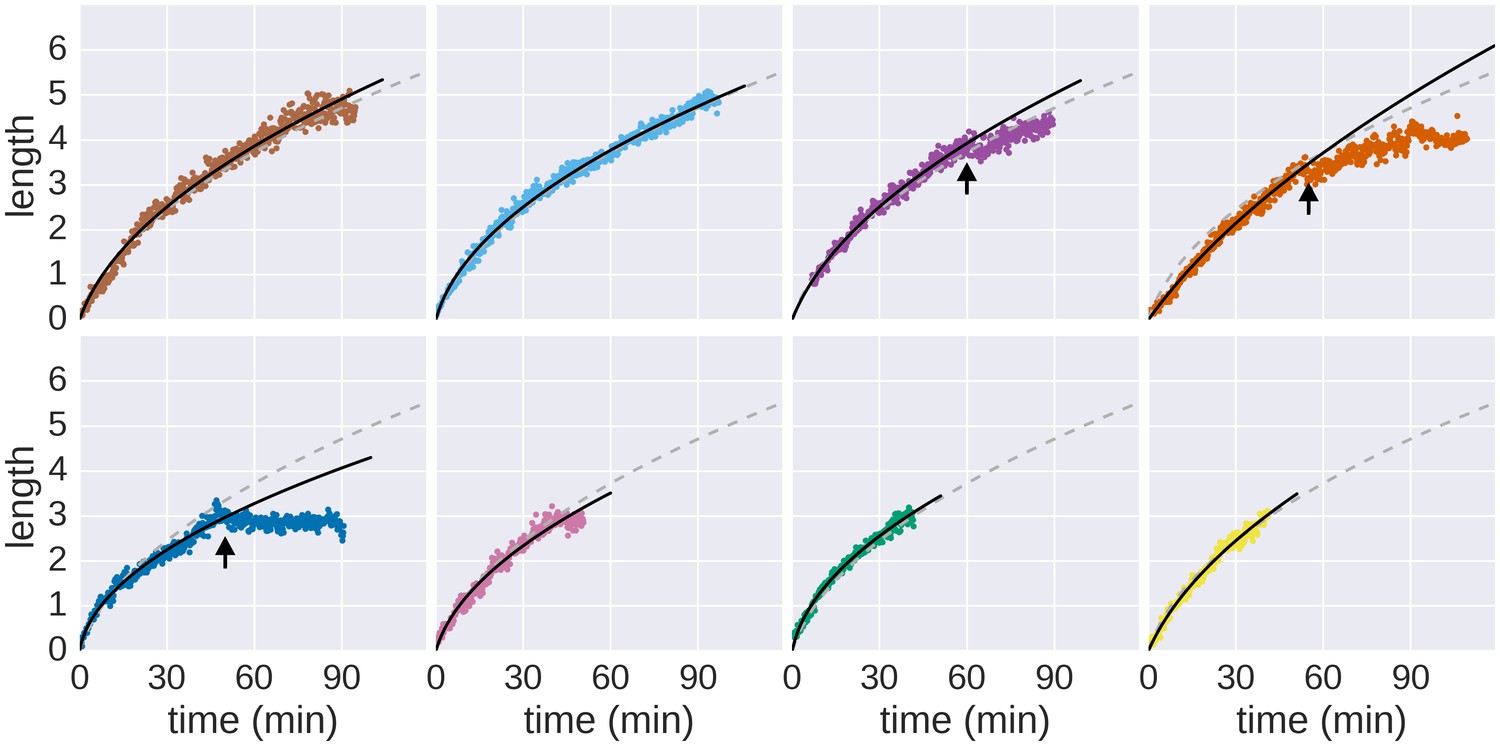
Growth of individual filaments monitored by continuous flow real-time immunostaining.
Raw data measurements of the real-time growth of individual filaments and corresponding fits to the saturated diffusion model are shown. The dashed grey line represents the global fit depicted in Figure 1f and the solid black line represents the fit computed for the individual filament. Arrows denote growth or measurement incidents (e.g. filament diffused out of focus, the filament stopped growing until the end of the experiment or the cell body rotated thereby preventing accurate length measurements, see Video 1). Only the growth rate data before the arrows were used to fit the model.
Figure 2 with 2 supplements
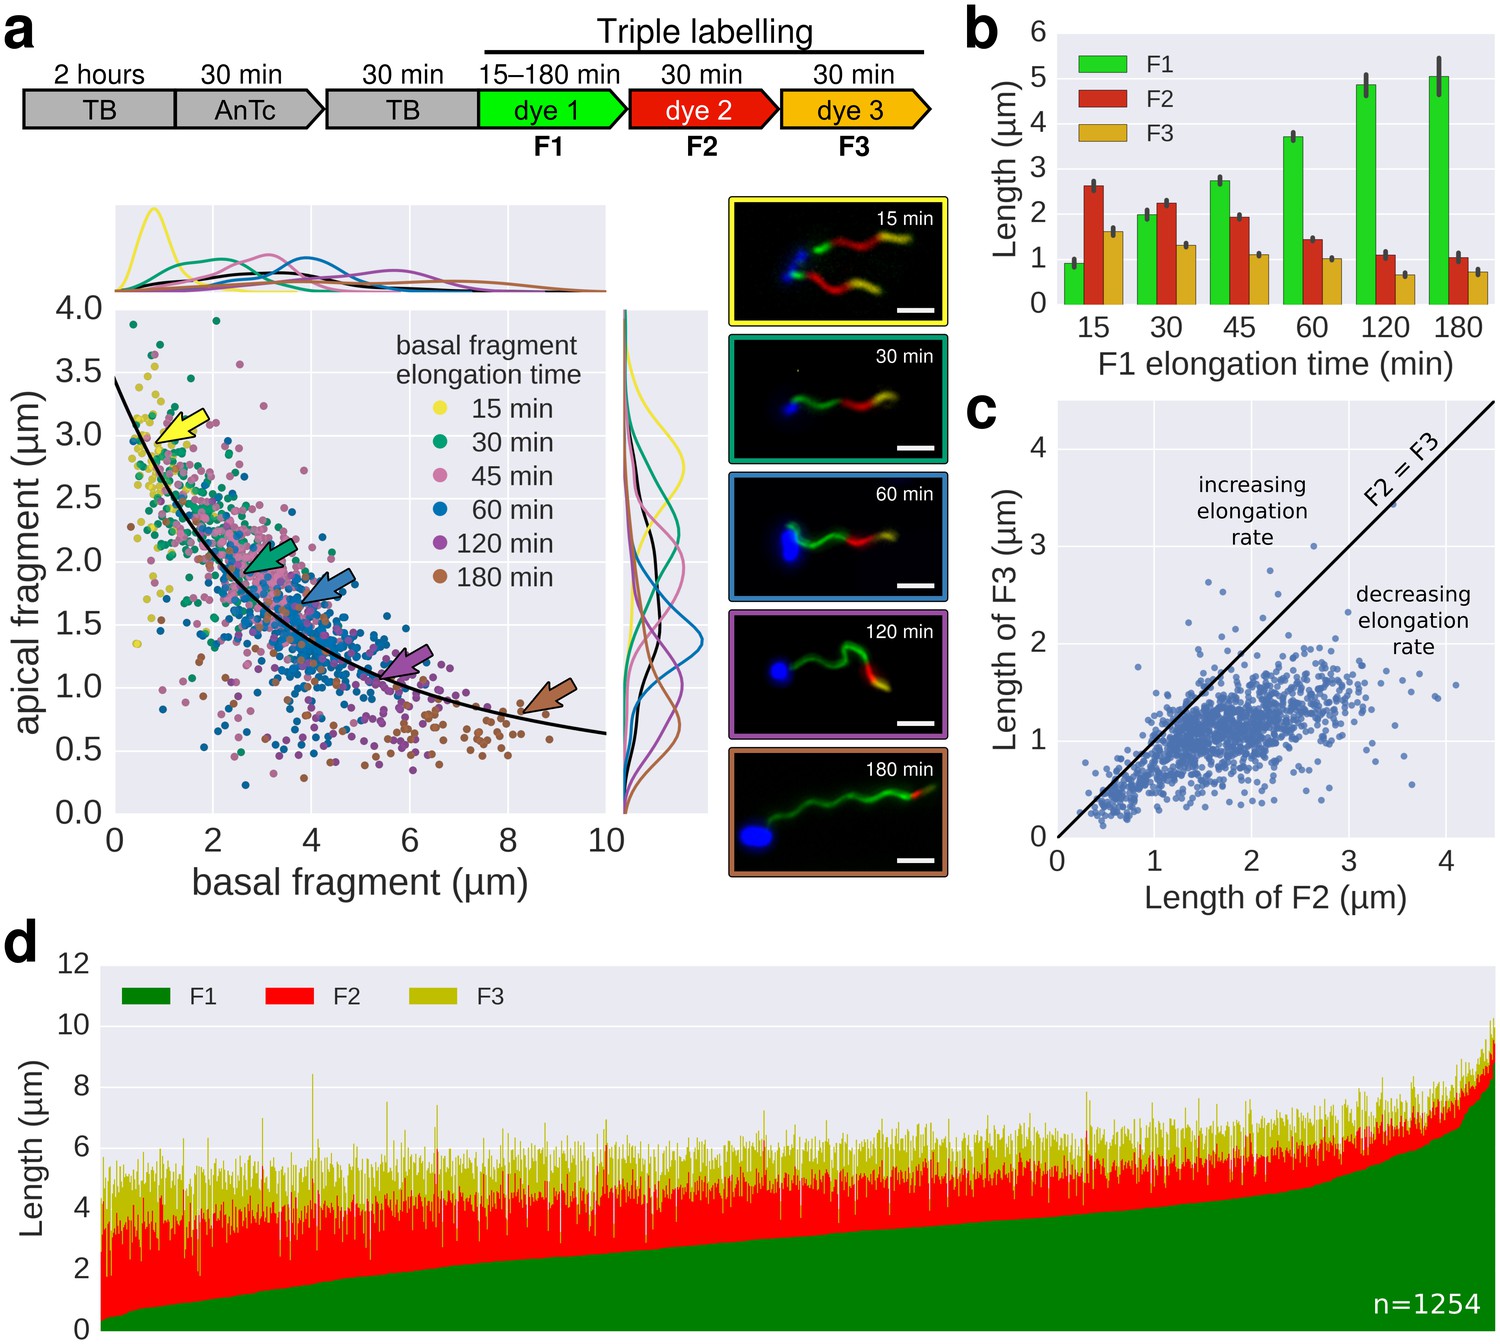
In situ filament labelling reveals a negative correlation between filament length and elongation rate.
(a) Experimental design of the in situ triple-colour labelling time-course. Basal (F1) and apical (F2) fragments were grown for 15–180 min and 30 min, respectively. The growth duration of basal fragments is indicated in the legend. Coloured arrows indicate the coordinates of the representative example images. The fit represents the injection-diffusion model with parameters kon ≈ 33.35 s−1and D ≈ 5.90 × 10⁻¹³ m2 ⋅ s−1. Scale bar 2 µm. (b) Average size of the individual fragments for different durations of elongation of the first fragment. Error bars represent the 95% confidence interval of mean estimation. (c) Relation between the size of the second and third fragment. 93.4% of the filaments have F3 fragments shorter than the F2 fragment with the difference increasing with the length of F2. (d) Flagella labelled in panel a were measured and sorted according to the length of F1, which reveals the inverted relationship between the initial length and extension length of the filament. Each vertical line represents an individual filament (n = 1254).
Figure 2—figure supplement 1
In situ labelling of flagella using maleimide fluorochromes.
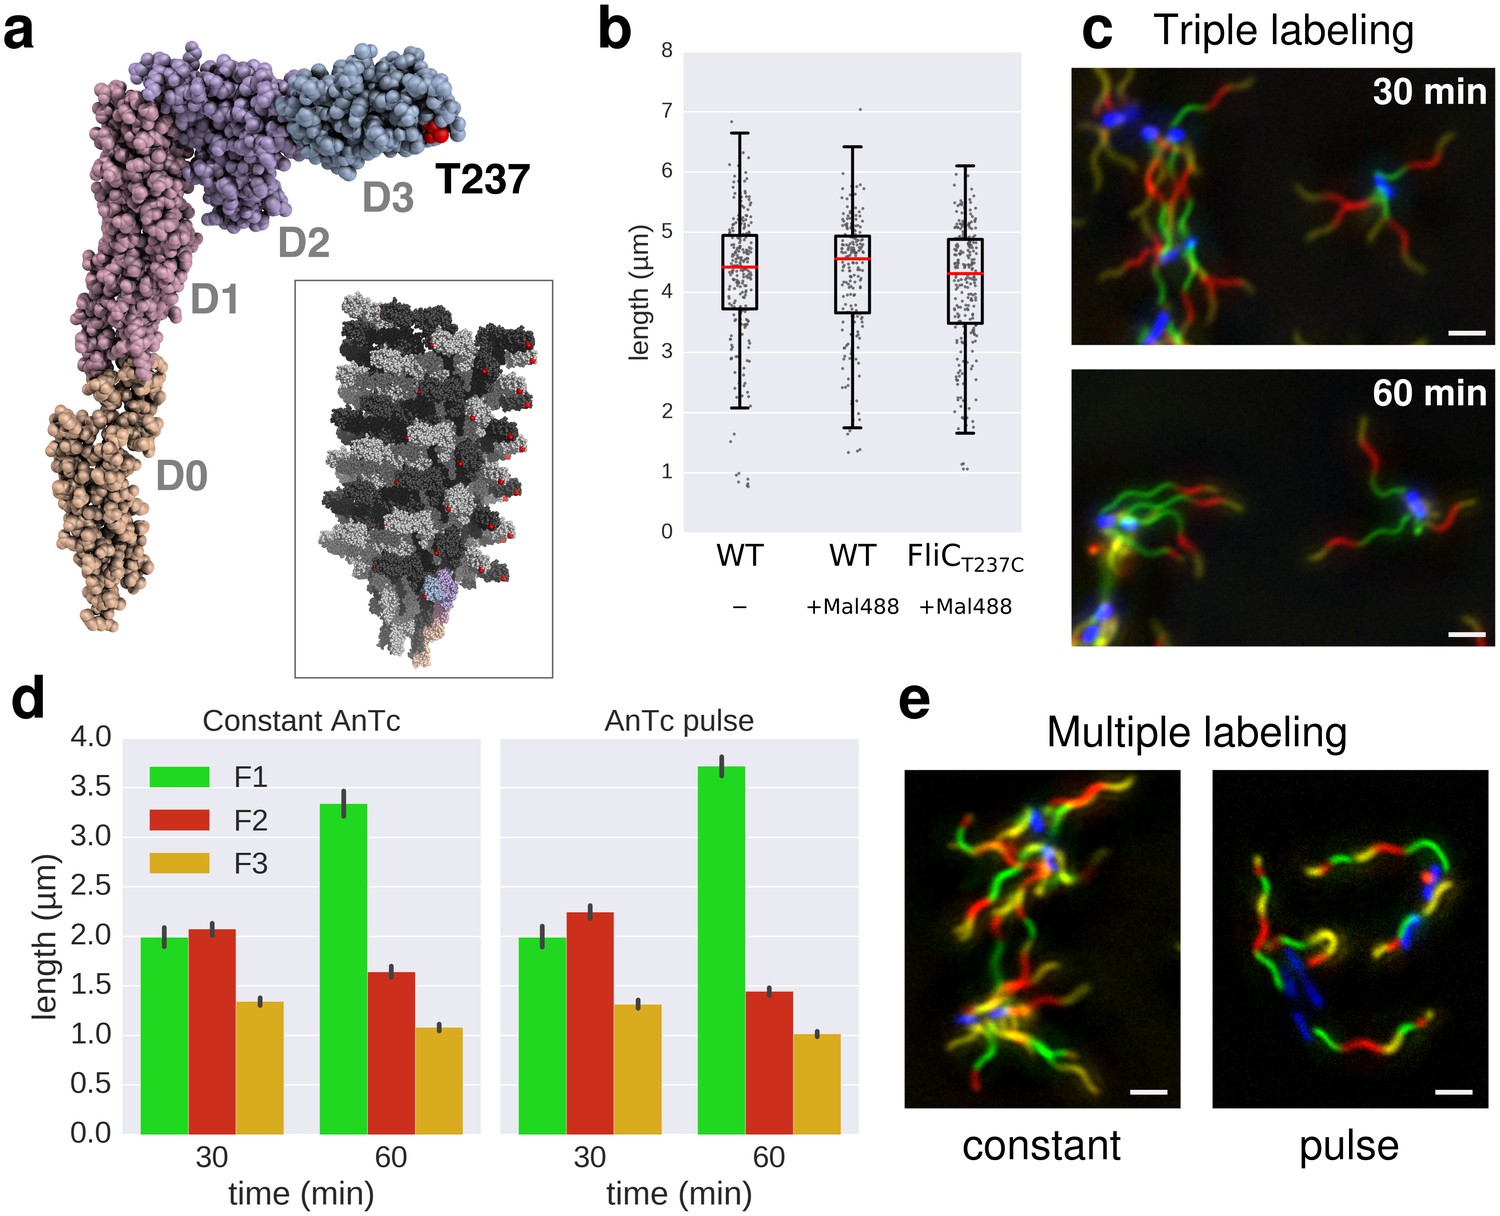
(a) Localization of the T237 residue in FliC, mutated to cysteine for the fluorochrome-maleimide labelling. The inset shows the structure of the polymerized filament with the localization of T237 in red. (b) Filament length distribution of the FliCT237C mutant strain EM2046 after 1 hr of growth in presence of the maleimide fluorochrome (Mal488) is identical to the wild-type (TH15801) grown in the same conditions or in absence of the maleimide fluorochrome in the medium. The box plot reports the median (in red), the 25th and 75th quartiles and the 1.5 interquartile range. (c) Representative images of the triple labelling of strain EM2400 with constant induction of FlhDC. Variations in F1 growth time (30 min and 60 min) demonstrate length-dependent decrease in filament growth rate. Scale bar 2 µm. (d) Triple filament labelling after constant (left, compare also panel c) or transient (right) induction of FlhDC led to comparable fragments size (n = 417 filaments for constant AnTc, n = 1254 filaments for AnTc pulse). Variations in F1 growth time (30 min and 60 min) highlight the length-dependent filament elongation rate. Error bars represent the 95% confidence interval of mean estimation. (e) Representative images for multiple labelling of strain EM2400 with constant (left) or transient (right) induction of FlhDC. Transient induction of FlhDC decreases the number of flagella per cell without changing the growth kinetics (see panel d), and accordingly facilitated quantitative analysis of filament length. Scale bar 2 µm.
Figure 2—figure supplement 2
Triple-colour labelling time course of second fragment F2.
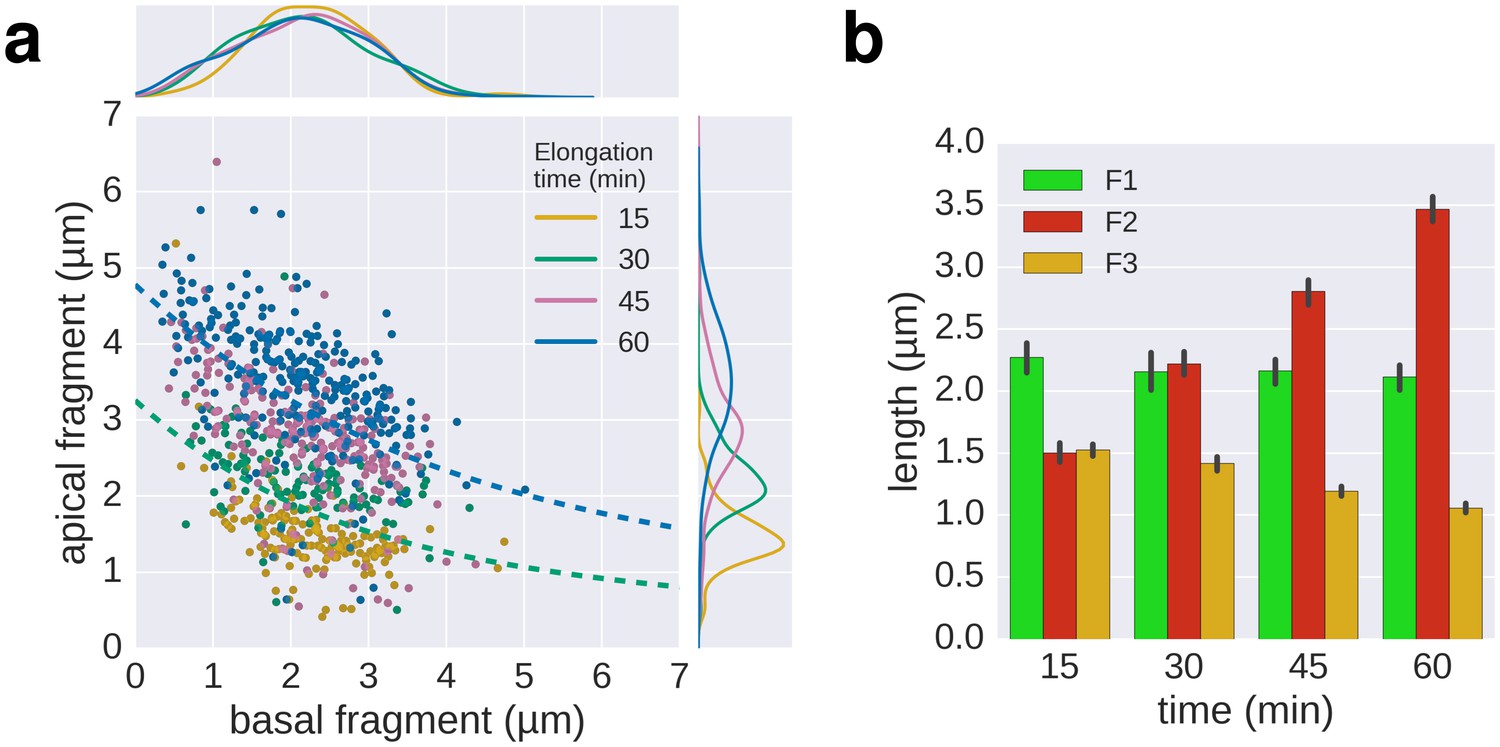
(a) Triple labelling with time course of the second fragment (F2), the first and third fragment were grown for 30 min. The dotted lines, shown for comparison, are the fit lines of the 30 and 60 min curves of the multiple labelling in Figure 3c. (b) Average length of the fragments for the different time points. Error bars represent the 95% confidence interval of mean estimation.
Figure 3 with 2 supplements
Growth kinetics of individual flagella revealed by in situ, multicolour labelling.
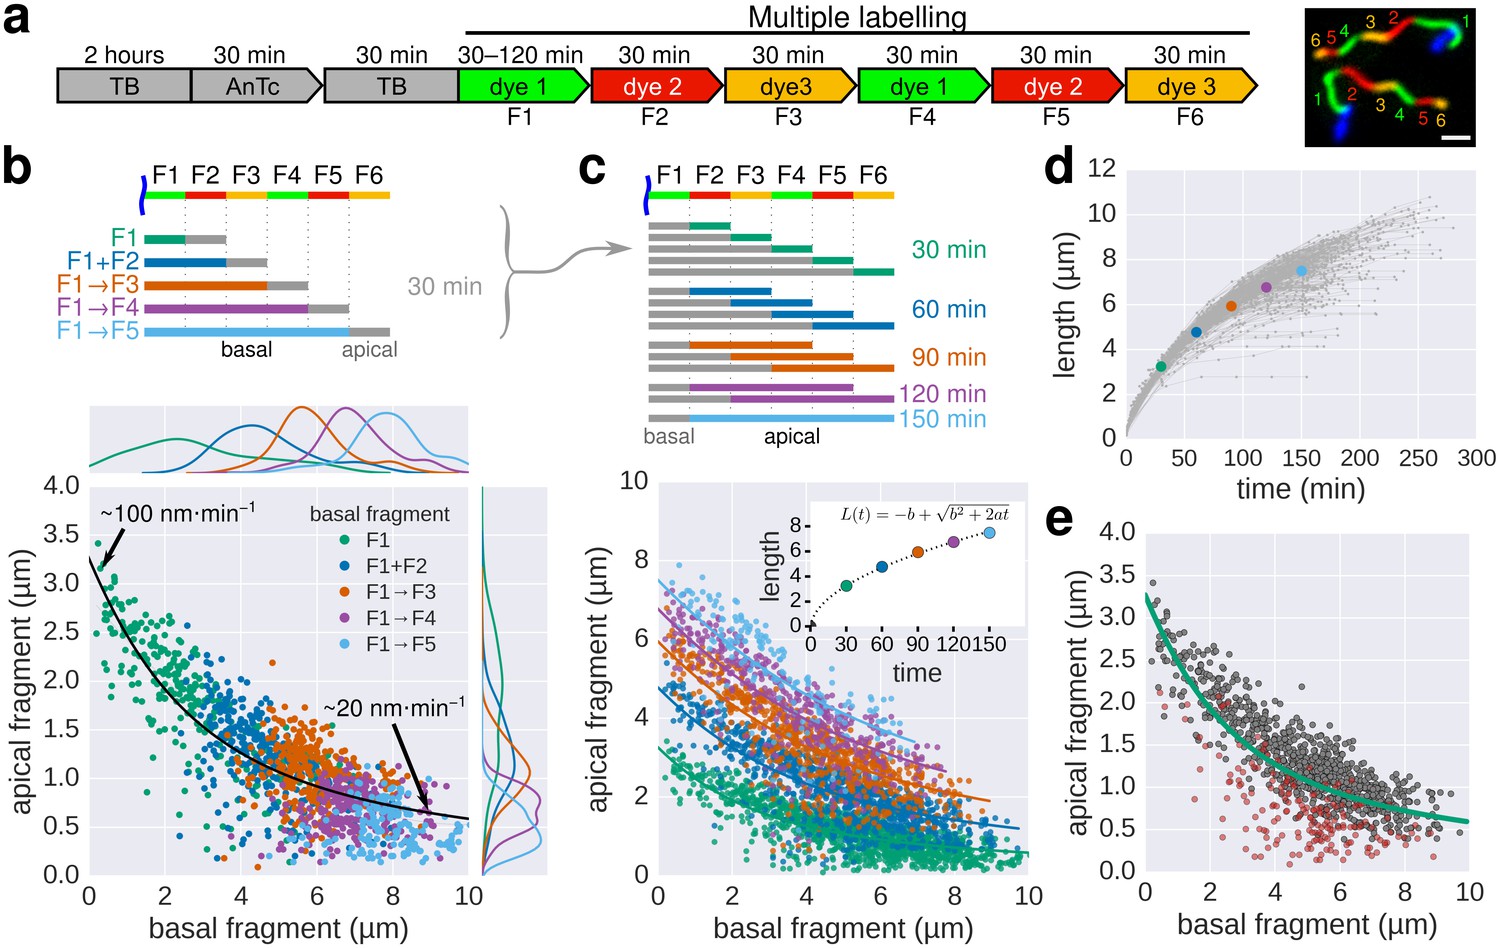
(a) Left: Experimental design of the in situ, multicolour labelling. Right: Representative fluorescent microscopy image for multiple labelling of flagellar filaments with a series of maleimide dyes. TB: tryptone broth without dye, AnTc: anhydrotetracyline induction of flagella genes. Scale bar 2 µm. (b) Basal/apical length coordinates were obtained by varying the duration of basal growth and successive fragments were combined to generate a total of 1276 basal/apical coordinates from 291 filaments. The growth duration of the apical fragment was 30 min. Average speeds are calculated from the average elongation per 30 min (<1 µm or >8 µm). The fit represents the injection-diffusion model with parameters kon ≈ 27.09 s−1and D ≈ 5.41 × 10⁻¹³ m2 ⋅ s−1. (c) Basal/apical length coordinates were obtained for various durations of apical growth (30–150 min) from the multiple labelling data shown in panel b. (n = 1276 for 30 min, n = 986 for 60 min, n = 697 for 90 min, n = 422 for 120 min, n = 169 for 150 min). The fit for various durations of apical growth represents the injection-diffusion model with parameters kon and D (60 min: kon ≈ 27.72 s−1, D ≈ 5.56 × 10⁻¹³ m2 ⋅ s−1; 90 min: kon ≈ 28.06 s−1, D ≈ 5.63 × 10⁻¹³ m2 ⋅ s−1; 120 min: kon ≈ 27.03 s−1, D ≈ 5.42 × 10⁻¹³ m2 ⋅ s−1; 150 min: kon ≈ 26.36 s−1, D ≈ 5.29 × 10⁻¹³ m2 ⋅ s−1). Average growth rates were estimated from the Y-intercept of the fit curve. The inset presents the average growth plotted against time. (d) Filament length as a function of time of individual flagella from the multiple labelling data. Each grey line represents the growth curve of an individual filament. The average growth rates estimated in panel c are plotted for comparison. (e) Quality of multiple labelling data. Only a minor fraction of the filaments were broken or stalled (highlighted as red dots, Figure 3—figure supplement 1a), which has limited effect on the parameter fit.
Figure 3—figure supplement 1
Quality of multiple labelling data.
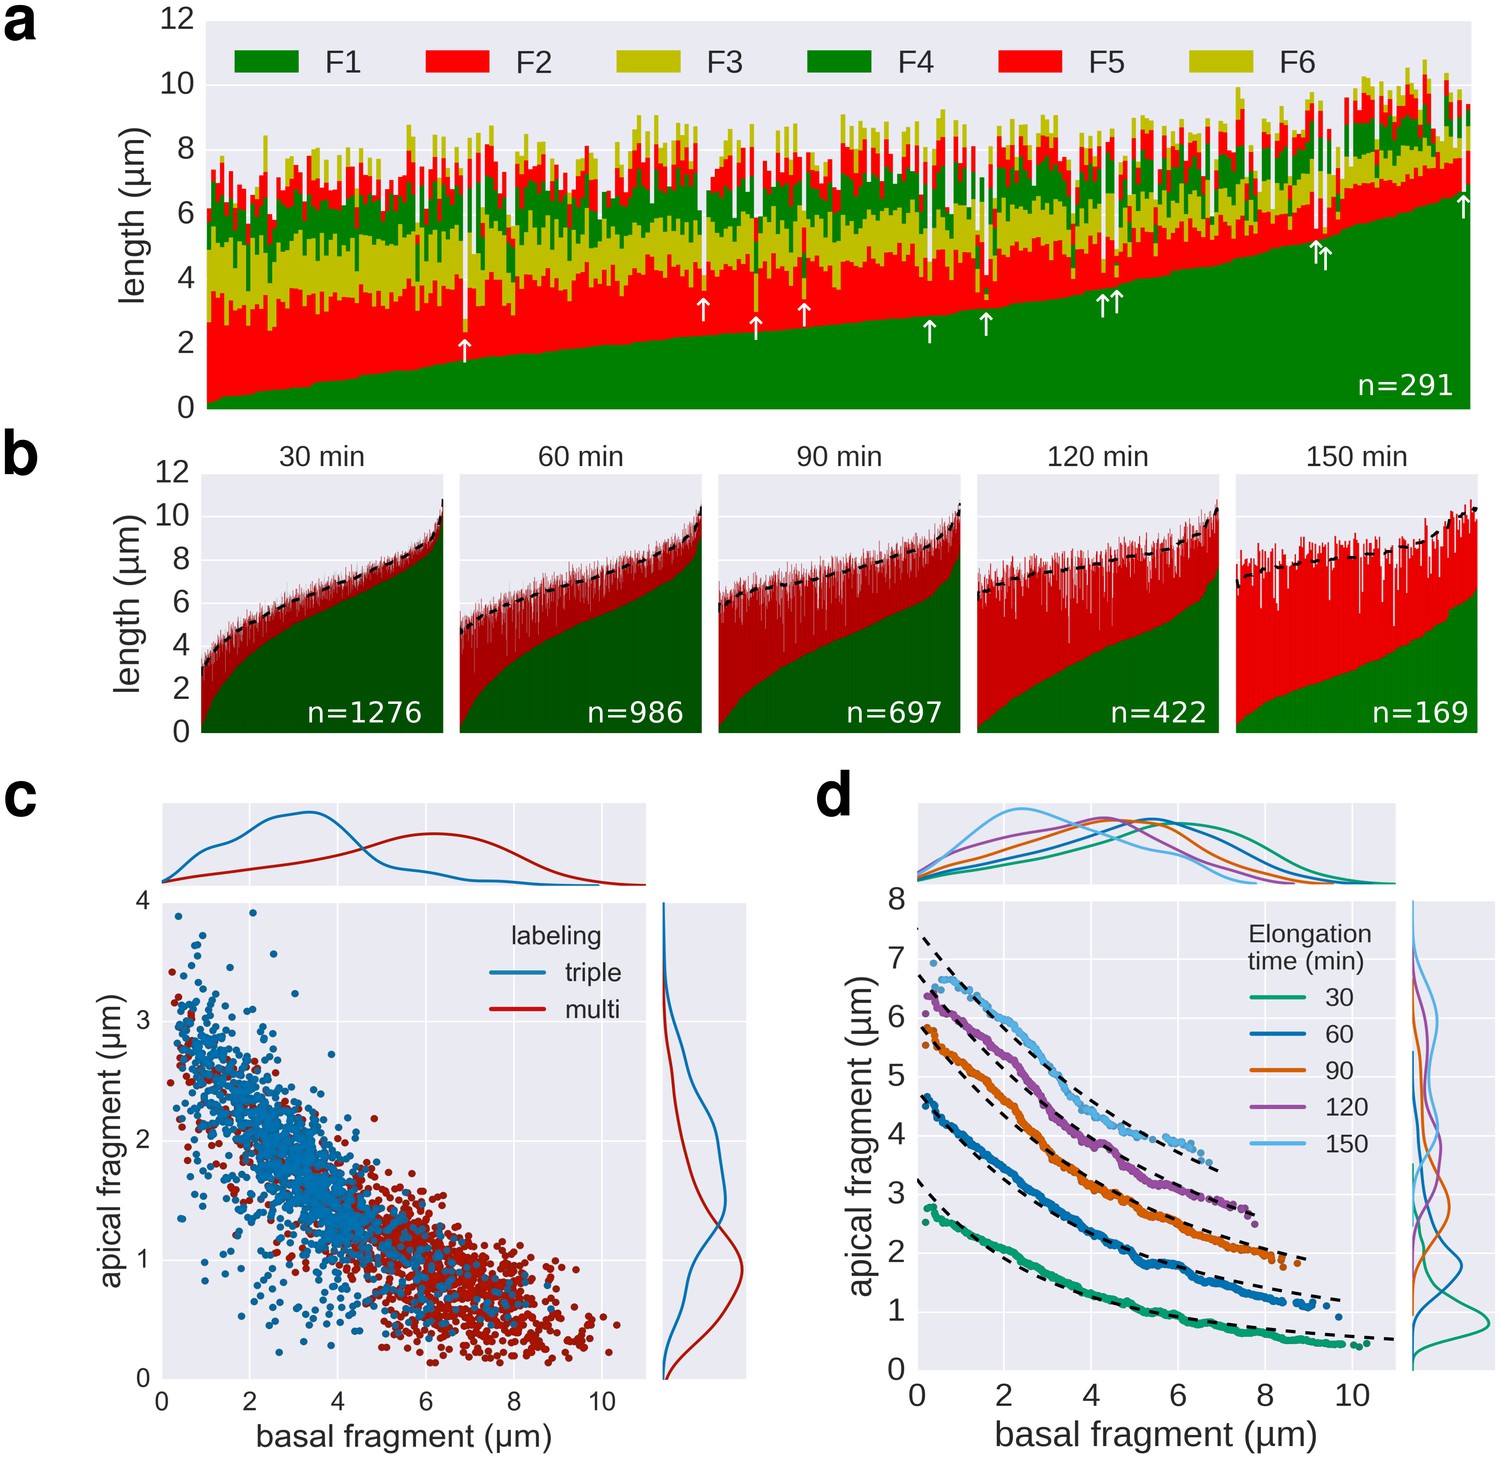
(a) Raw data of the multiple labelling. Each vertical line represents an individual filament (n = 291). Broken or strongly stalled filaments are denoted with a white arrow. Basal/apical length coordinates resulting from those filaments are highlighted in red in Figure 3e. (b) Basal/apical couples, as calculated in Figure 3c are shown in green/red, respectively. The elongation time of the apical fragment is indicated on top of each graph. Smoothing was applied on the apical data using exponentially weighted moving averages (span = 50) to remove the individual-based variability. The smoothed data is represented for each elongation time as a dotted line. (c) Comparison of the triple labelling data (1254 fragments) and the multiple labelling data for 30 min elongation (1276 fragments derived from 291 flagella). The multiple labelling allows obtaining greater resolution with about four times less flagella. (d) Basal/apical coordinates were obtained by smoothing of the raw data as described in panel b. The growth curves from Figure 3c are plotted for comparison.
Figure 3—figure supplement 2
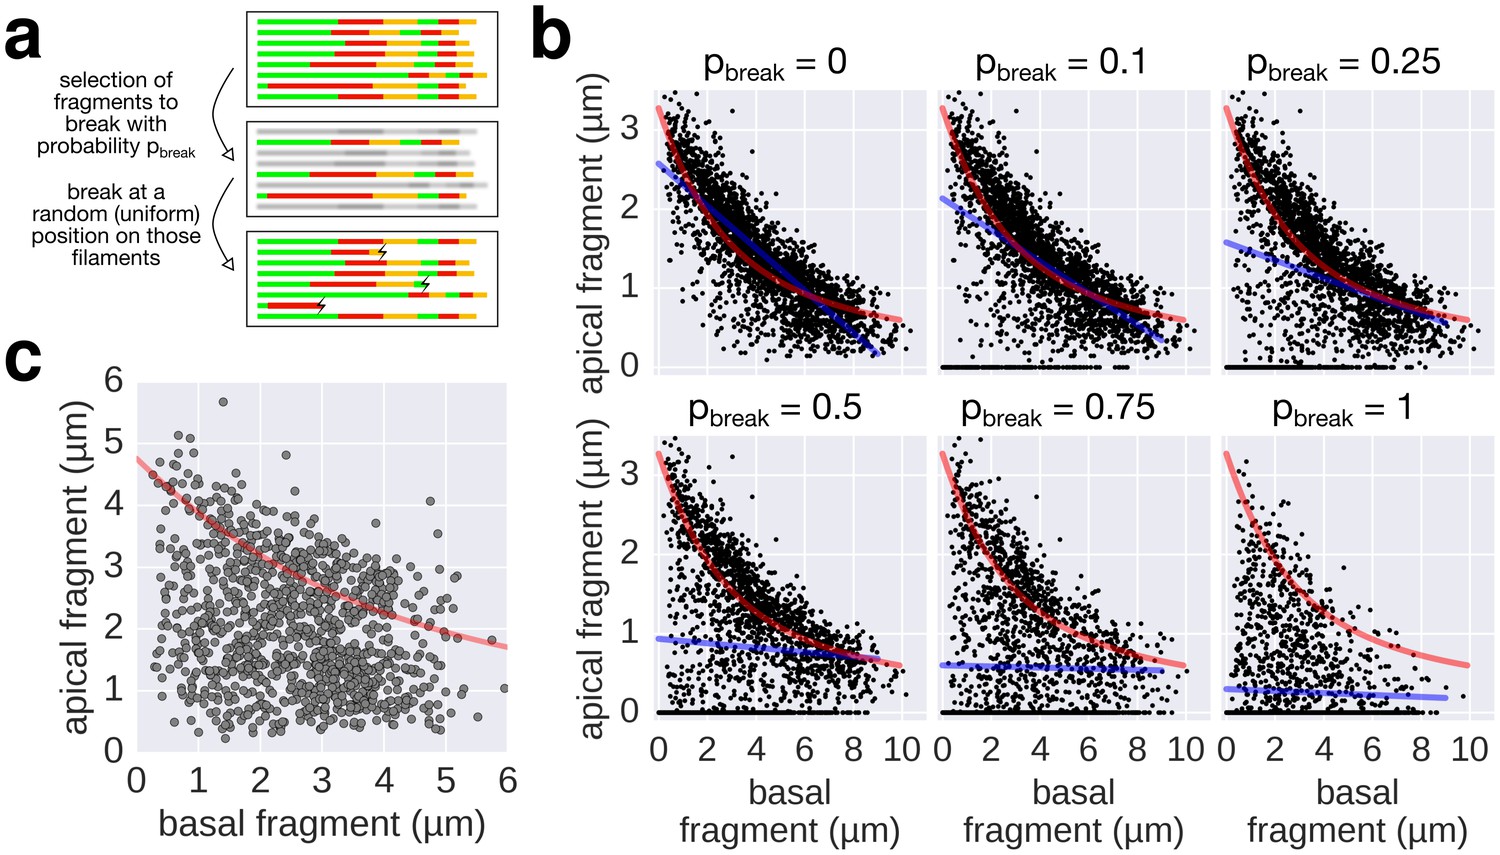
Filament breaking/stalling events and heterogeneous injection rates decrease the quality of the data required to fit the injection-diffusion model.
(a) The combined multiple-labelling approach and the in vitro labelling protocol ensured minimal filament breaks in our dataset (Figure 3—figure supplement 1a, compared to breaks induced by shearing in Figure 4). Each filament of the dataset was subjected to a virtual breakage/stalling event with a probability pbreak (pbreak = 0, 0.1, 0.25, 0.5, 0.75 or 1). The position of the breakage/stalling event was chosen randomly along the length of the filaments with a uniform probability. (b) Simulation of random filament breakage (of probability p) using the multiple labelling dataset presented in Figure 3. The random filament breakage simulation demonstrates that data points accumulate on the x-axis and below the fit curve (in red). It is crucial to note that a high fraction of broken filaments masks the obvious length-dependency of filament growth and prevents an accurate fit on the complete set of points (linear fit in blue; compare with Figure 3 of Turner et al. [2012]). (c) Combination of the data obtained in Figure 6a for the 0, 10, and 20 µM CCCP concentrations to simulate a heterogeneous injection rate. A variable injection rate within the population would mask the length-dependency of filament growth (compare with Figure 3A of Turner et al. [2012]).
Figure 4 with 1 supplement
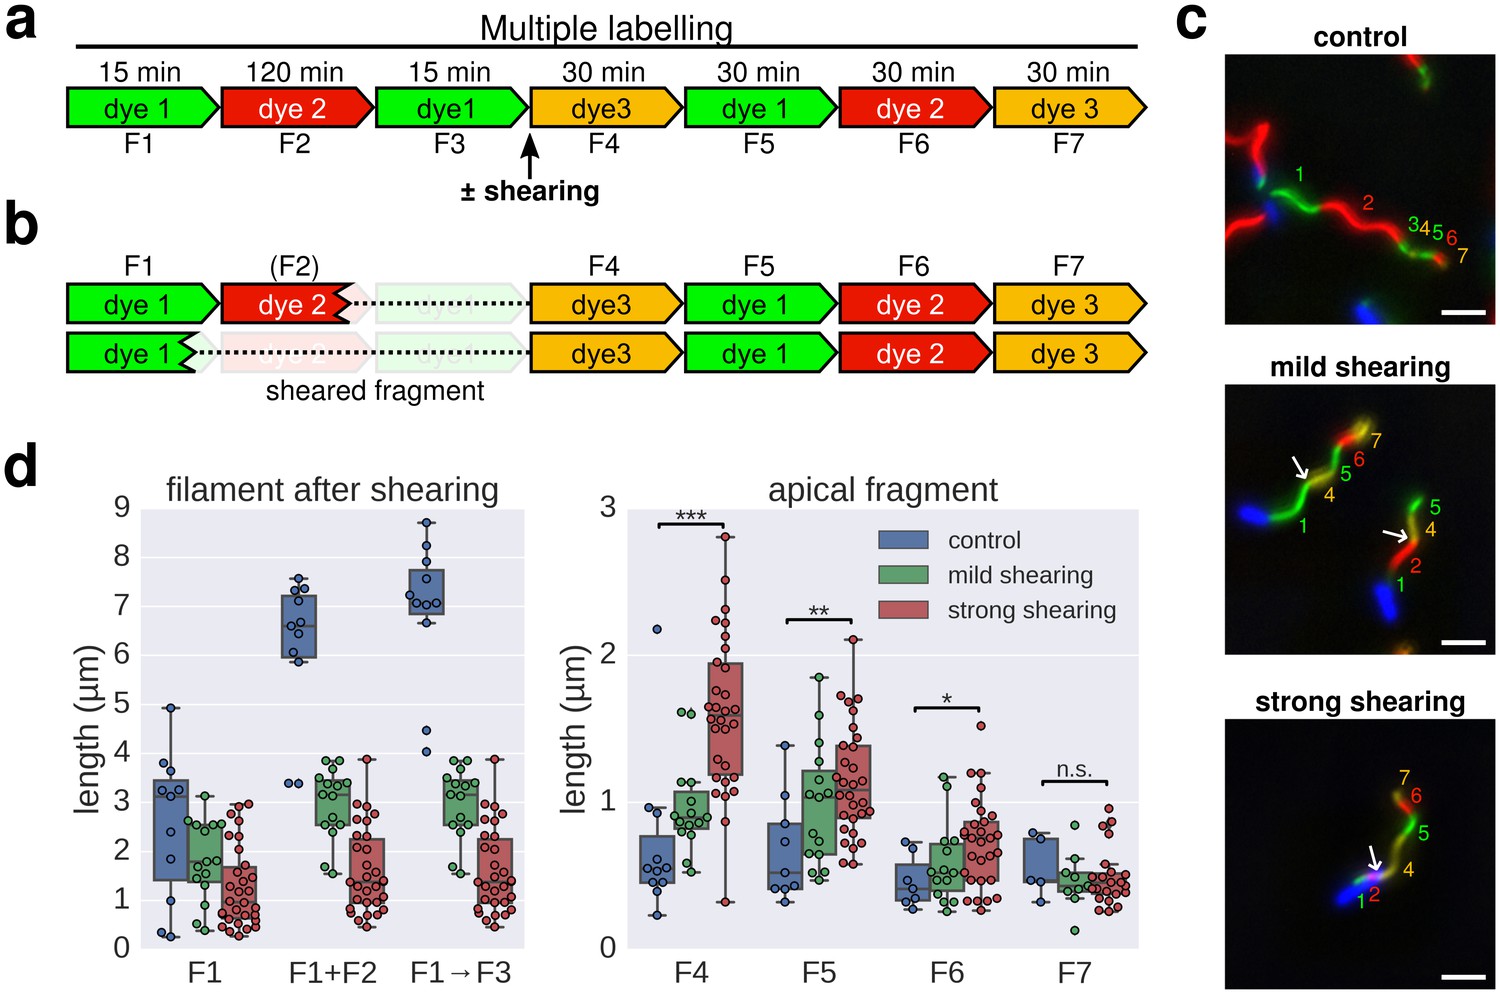
Elongation rate of re-growing filaments increases after mechanical shearing.
(a) Experimental design to determine filament elongation rate after mechanical shearing using multicolour labelling. (b) A successful shearing event removed fragment F3 and partially or completely fragment F2. (c) Representative example images of control filaments and filaments broken using mechanical shearing forces. Flagellar filaments were sheared by passing the bacterial culture five times (mild shearing) or up to 30 times (strong shearing) in and out of a 22-gauge needle. Scale bar 2 µm. (d) Left panel: length of the basal, cell-attached filament after mechanical shearing demonstrating successful filament breakage. Right panel: length of apical, re-growing filament fragments demonstrating a length-dependent increase in filament elongation rate. The box plots reports the median, the 25th and 75th quartiles and the 1.5 interquartile range. Data points represent individual filament fragments. Statistical significance according to a two-tailed Student’s t-test is indicated. F4 strong vs. control: p-value=0.000026 (***); F5 strong vs. control: p-value=0.002452 (**); F6 strong vs. control: p-value=0.034514 (*); F7 strong vs. control: not significant (n.s.).
Figure 4—figure supplement 1
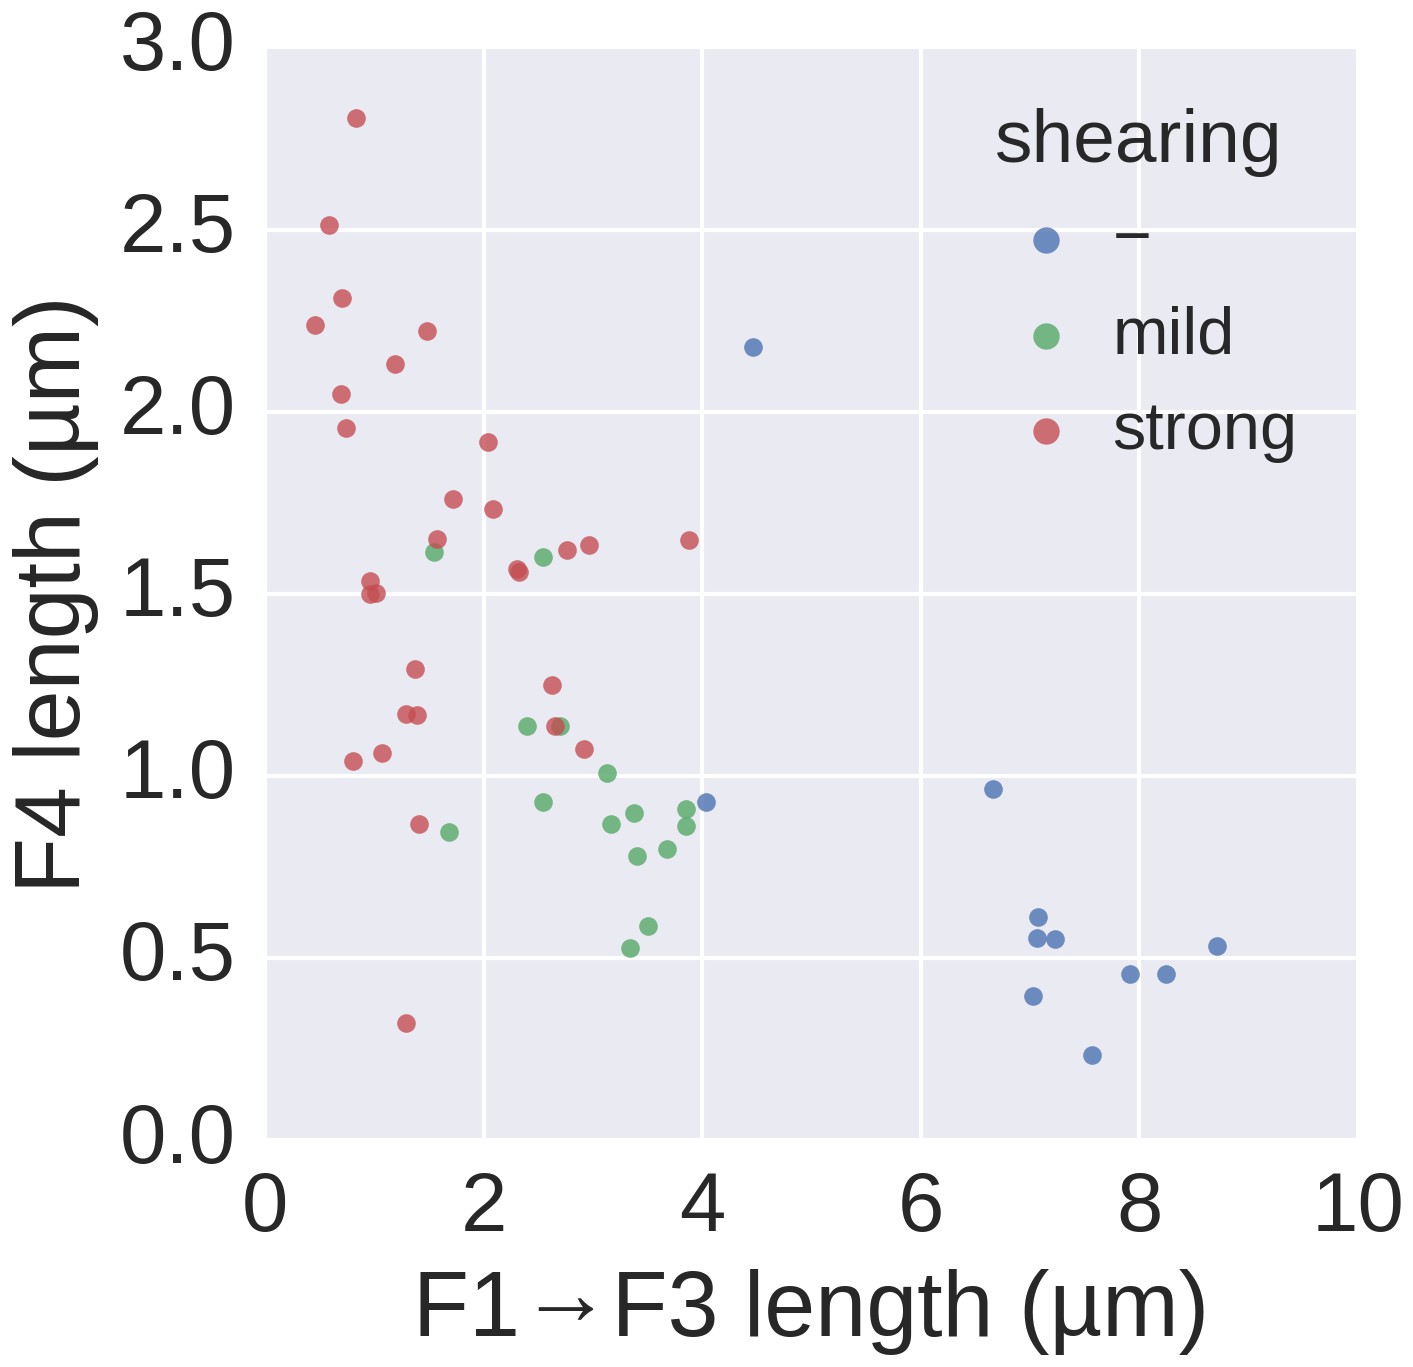
Basal/apical coordinates of sheared and control filaments showing the dispersion of the filament growth data.
Basal/apical coordinates of the data shown in Figure 4d of control filaments and filaments broken using mechanical shearing forces. The length of the apical F4 fragment (post-shearing) is shown in relation to the length of the basal fragment pre-shearing (F1→F3) and highlights the increased elongation rate of short filaments after shearing.
Figure 5 with 3 supplements
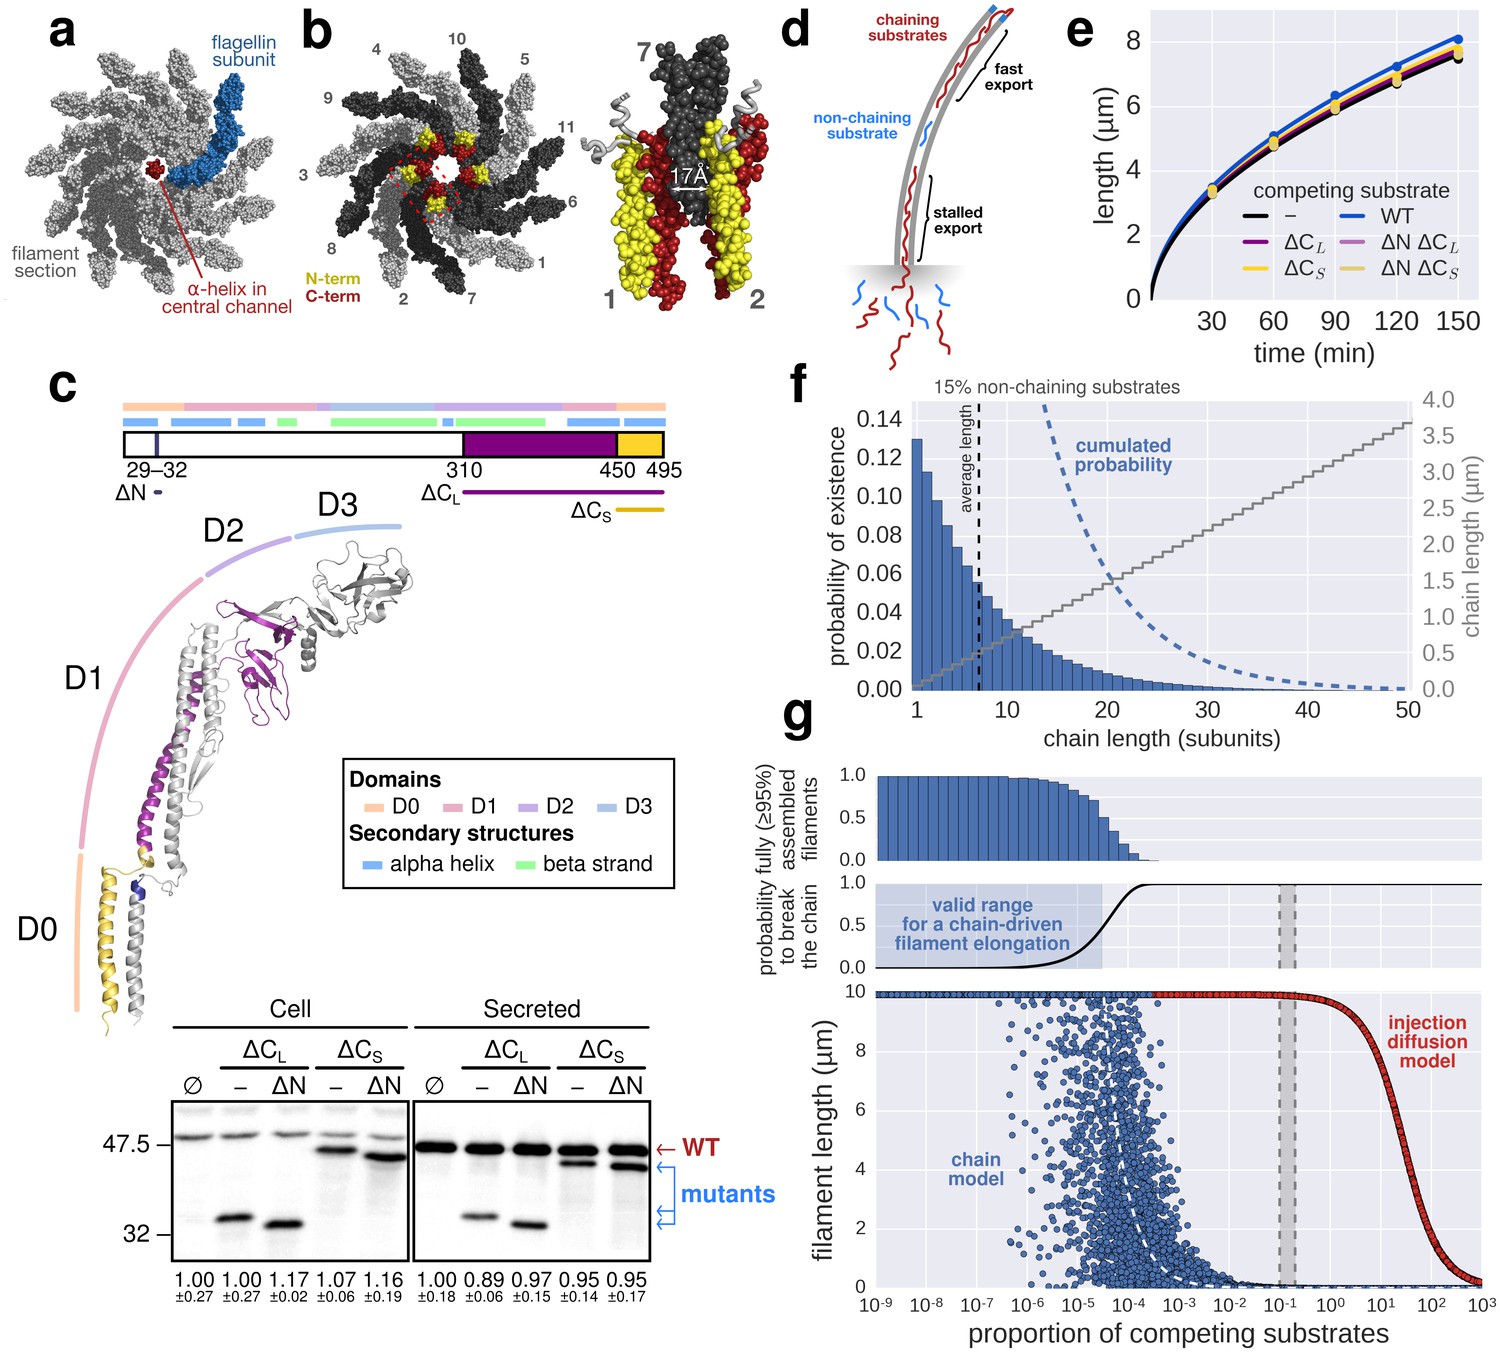
The contribution of inter-subunit chains for filament elongation rate.
(a) The 2 nm wide filament channel only accommodates one folded α-helix. (b) The N- and C-termini of successive flagellin molecules are anti-parallel and far apart in the polymerized filament structure. (c) Top: Structure, domains, and secondary structures of flagellin FliC (PDB: 1UCU). Mutant flagellins lacking combinations of the N- and C-terminal domains required for head-to-tail coiled-coil chaining (ΔN, ΔCS, ΔCL) were co-expressed together with endogenous flagellin (FliC) to disrupt chain formation. Bottom: Flagellin immunoblotting on cellular and secreted fractions (relative full-length flagellin levels report mean ± s.d., n = 3). (d) Simultaneous secretion of non-chaining substrates breaks a filament-spanning chain of flagellin molecules. A strict chain model requires the chain to span the entire filament and does not allow for disruptions of the chain. A chain model with the possibility of recovery by diffusion of broken chains is discussed in Figure 5—figure supplement 1. (e) In situ, multicolour labelling of flagellar filaments during competitive co-expression of chain-disrupting mutant flagellins. The average growth of fits computed from basal/apical coordinates presented in Figure 5—figure supplement 3c and as described in Figure 3c is shown as a function of time. Basal/apical coordinates were derived from multiple labelling data of individual filaments: n = 399 from 89 filaments (−), n = 271 from 58 filaments (WT), n = 278 from 62 filaments (∆CL), n = 412 from 93 filaments (∆N ∆CL), n = 209 from 46 filaments (∆CS), n = 312 from 73 filaments (∆N ∆CS). The fits represent the injection-diffusion model and parameters kon and D are given in Figure 5—source data 1. (f) Probability of existence of n-long chains defined by the binomial law. Long chains are highly improbable for a 15% proportion of competing substrates (i.e. formation of a more than 2.4 µm long chain (n > 33) has a probability of 1%). The bars show the individual probability of existence, the dotted blue line the cumulated probability of existence of chains longer than the number on the x-axis. The grey curve indicates the chain length in µm, which reflects that filaments cannot grow longer than a few hundred nanometres with a chain-based mechanism. (g) Simulation of filament growth dependent on inter-subunit chains or the injection-diffusion model in presence of random proportion of competing substrate. The injection-diffusion model fit represents the mean of the multi-labelling data set of Figure 3 with parameters kon ≈ 27.25 s−1and D ≈ 5.46 × 10⁻¹³ m2 ⋅ s−1. Dashed white line: median length of the filament for chain-model dependent growth. Grey box: expression range of chain-disrupting mutant flagellins used in panel e and Figure 5—figure supplement 1a.
-
Figure 5—source data 1
Parameters kon and D of the injection-diffusion model fits of Figure 5—figure supplement 3.
- https://doi.org/10.7554/eLife.23136.016
Figure 5—figure supplement 1
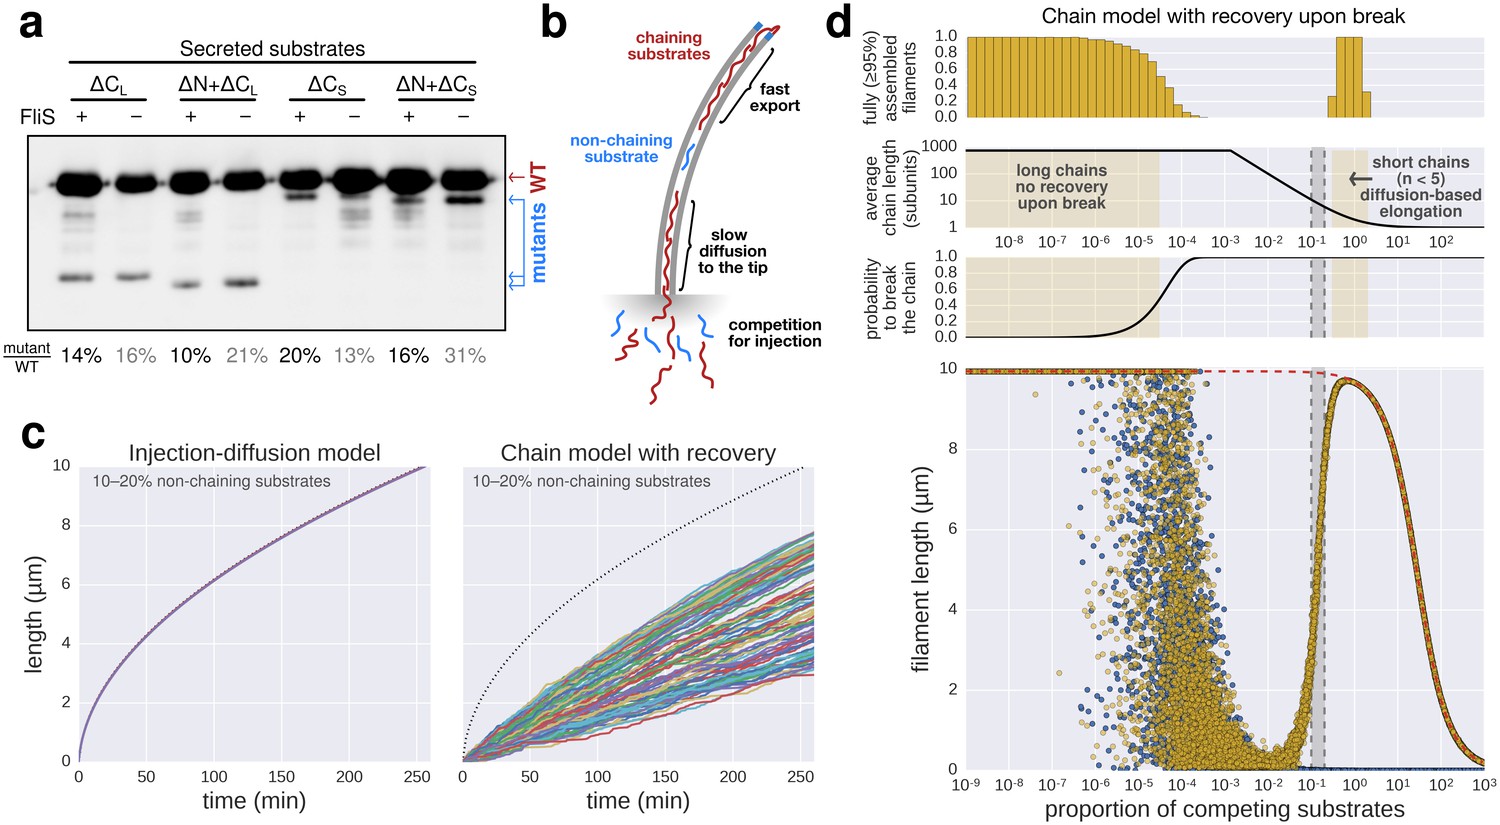
Filament growth dynamics in the presence of competing non-chaining substrate.
(a) Effect of deletion of fliS on secretion of flagellin truncation mutants. Anti-flagellin immunoblotting of secreted wild-type flagellin and flagellin truncation mutants. The flagellin truncation mutants additionally missing the FliS binding site (ΔN = ∆29–32, ΔCS = ∆450–495, ΔCL = ∆310–495) were secreted in similar quantity in both the wild-type and ∆fliS mutant. Full-length flagellin was expressed from its native promoter. (b) Schematic illustration of chain-model dependent filament growth. Unlike the simulation presented in Figure 5, we assume here that filament growth can resume after the basal part of the chain diffused to the tip. The diffusion coefficient depends on the number of flagellin subunits in the chain. (c) Simulation (n = 100) of filament growth in the presence of 10–20% competing substrate. At this proportion of competing substrates, chains would constantly be broken and have an average size of 6–11 subunits. This would induce significant delays in growth, which is not observed experimentally (Figures 1f and 5e). The dynamics of filament growth dependent on the injection-diffusion mechanism would not be perceptibly altered by this proportion of competing substrates and is consistent with the experimental observations (Figure 5e). (d) Simulation of chain-model dependent filament growth. In contrast to the simulation presented in Figure 5g, here we allow for recovery upon a chain-breaking event by diffusion of the basal chain fragment to the tip, where it resumes growth. This simulation reveals two ranges of possible chain model dependent filament growth. The first one (proportion of competing substrate p<10−4) is identical to the model without possibility to recover upon chain-breakage and requires a non-physiological low proportion of competing substrates. In this case chains are so long that it is virtually impossible to diffuse to the tip within the time frame of the simulation, thus effectively arresting filament elongation. The second range where a chain model dependent growth is valid (p>0.3) postulates frequent chain-breakage events. Here, short chains (1–5 flagellin subunits) are able to diffuse to the tip in a reasonable time frame, however, the contribution of the pulling force of such short chains to drive elongation of the filament is negligible and secretion of substrates is almost entirely driven by diffusion. The simulation of Figure 5g is shown in blue for comparison. The simulation with the injection-diffusion model is shown as a red dashed line. In all models, export starts to be affected by competition for injection when the number of competing substrates is significantly higher than the number of secreted flagellin molecules.
Figure 5—figure supplement 2
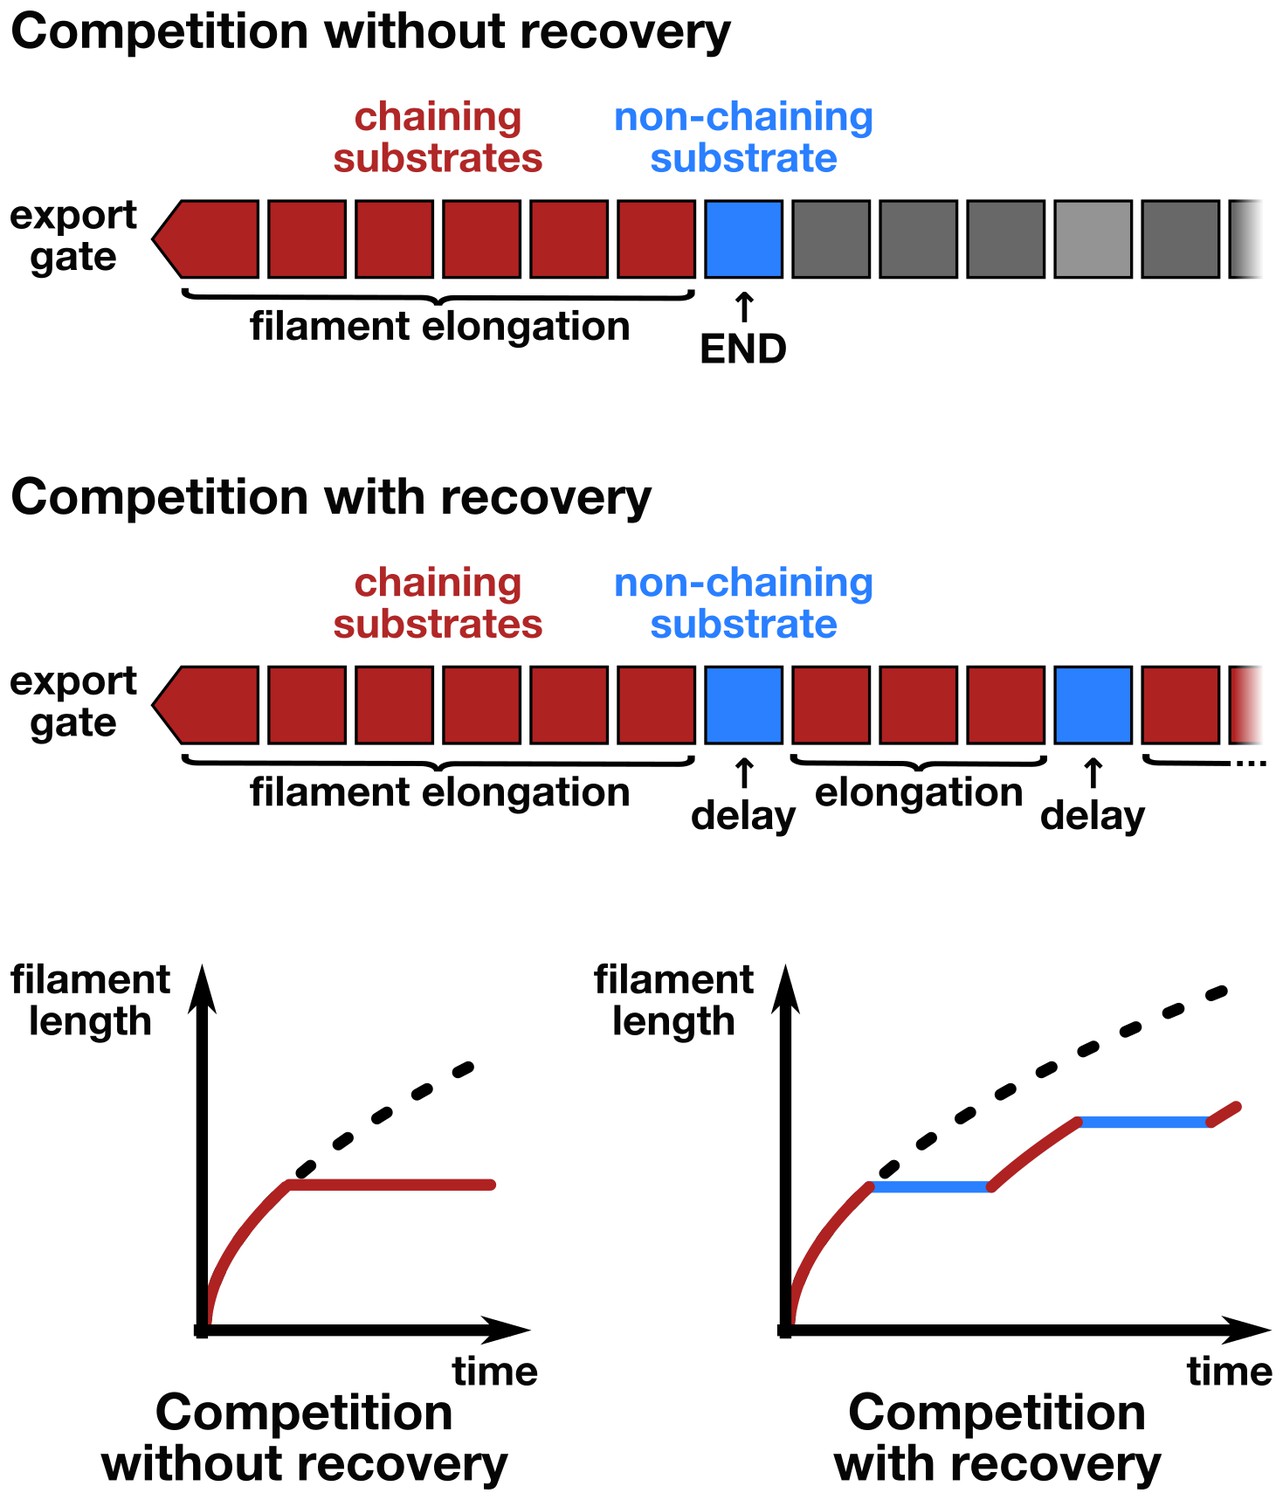
Schematic illustration of the chain-model dependent simulation of filament growth.
The simulation generates a random succession of substrates with a certain probability of non-chaining substrates incorporated into the chain of substrates that arrive at the export gate. If flagellin substrates arrive, they participate in filament elongation with the observed rate of growth. If, however, a non-chaining substrate arrives at the gate, then the simulation does either not allow for recovery of growth (top and bottom left) or introduces an elongation delay based on the time required for the newly formed basal chain to reach the tip through diffusion, where it then can resume rapid growth (middle and bottom right).
Figure 5—figure supplement 3
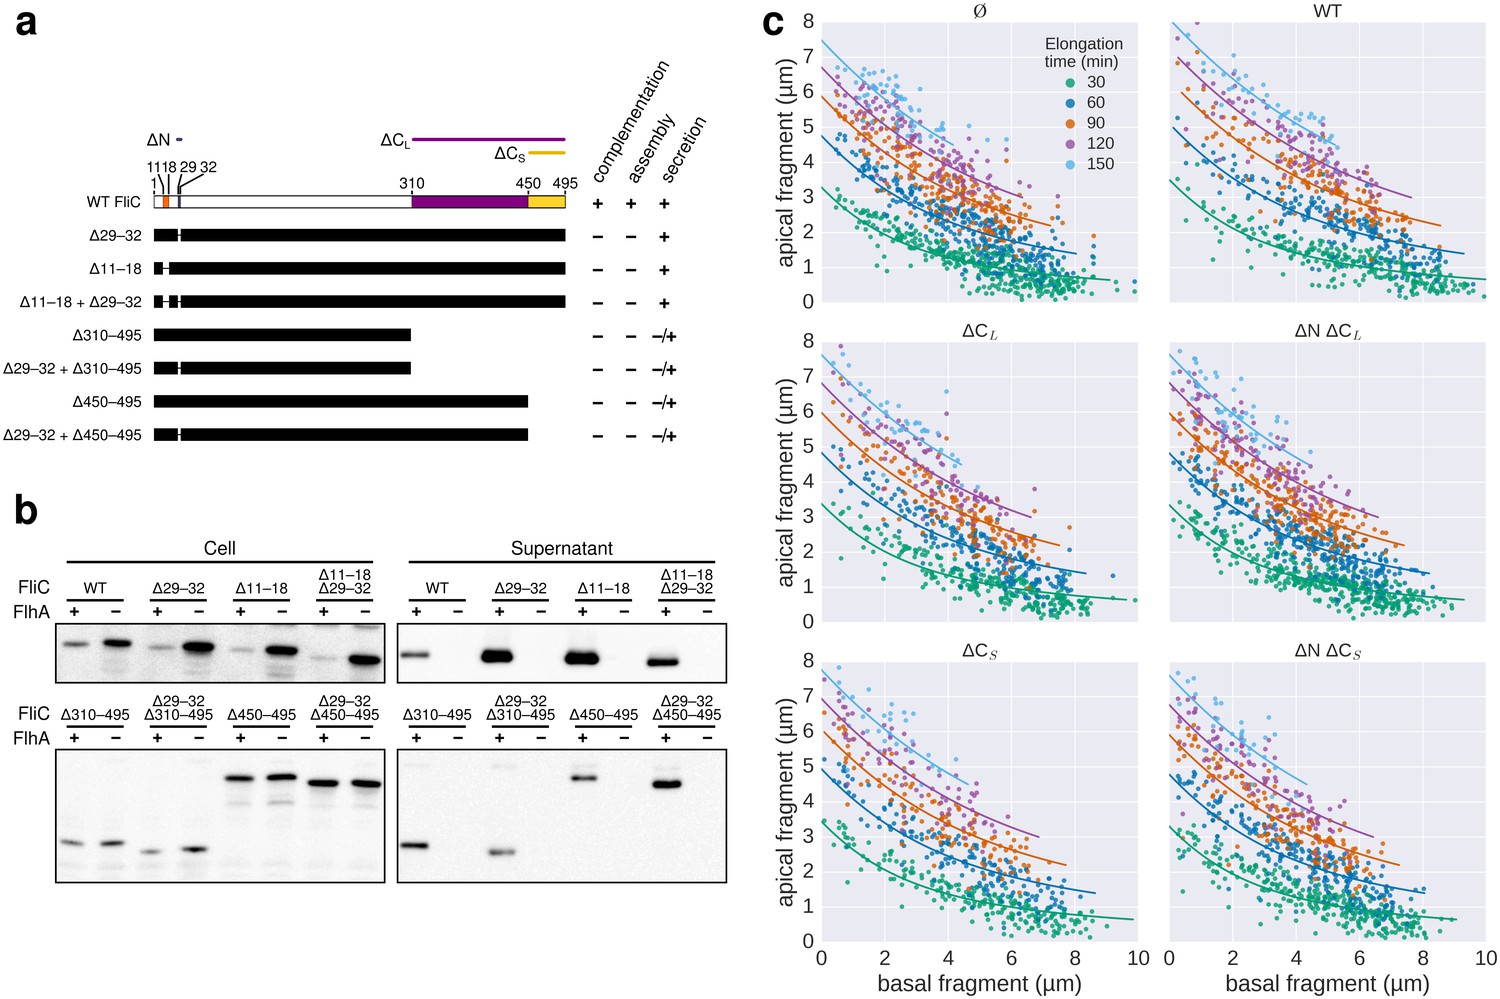
Characterization of chain-disrupting flagellin truncation mutants.
(a) Schematic of flagellin FliC truncation constructs used to disrupt subunit chain formation. Overview of various flagellin mutants lacking parts and/or combinations of N- and C-terminal domains required for head-to-tail chain formation. Qualitative assessments of the ability to complement a fliC mutant strain (labelled ‘complementation’), the ability to form functional flagellar filaments (labelled ‘assembly’) and the secretion levels are indicated. Truncations in the D0 domain were expected to prevent flagellin polymerization and thus the truncation mutants do not assemble filaments and are unable to complement a fliC mutant strain. Overproduction of N-terminal domain truncation mutants that retain the C-terminal chaperone-binding domain competes with wild-type flagellin for the available pool of flagellin-specific chaperone FliS (Figure Supplement S6a). The absence of FliS impairs filament formation (Figure 1b) and thus overproduction of ∆29–33, ∆11–18 and ∆11–18 + ∆29–33 results in a dominant-negative motility phenotype. N.D. = not determined. (b) Expression and secretion profile of flagellin truncation mutants. Western blot analysis of cellular and supernatant fractions of strain TM113 (∆fliC) or strain NH001 (∆flhA) expressing various flagellin truncation variant as outlined in panel a. All flagellin mutants are secreted in the presence of a functional flagellar export apparatus. (c) Mutant flagellins lacking parts or combinations of the N- and C-terminal domains required for head-to-tail chain formation (ΔN = ∆29–32, ΔCS = ∆450–495, ΔCL = ∆310–495) or wild-type flagellin (WT) were co-expressed together with endogenous flagellin in strain EM2400 as shown in Figure 5. Multicolour labelling of flagellar filaments was performed and basal/apical coordinates were computed for various durations of apical growth and plotted as outlined in Figure 3c. Successive fragments of individual filaments were combined to obtain n basal/apical coordinates as follows: n = 399 from 89 filaments (−), n = 271 from 58 filaments (WT), n = 278 from 62 filaments (∆CL), n = 412 from 93 filaments (∆N ∆CL), n = 209 from 46 filaments (∆CS), n = 312 from 73 filaments (∆N ∆CS). The fits represent the injection-diffusion model. Parameters kon and D are given in Figure 5—source data 1.
Figure 6 with 1 supplement

The effect of pmf on flagellin injection and filament growth rate.
(a) Top: Experimental design. Carbonyl cyanide m-chlorophenyl hydrazone (CCCP) reduces the proton motive force (pmf) and was present during growth of the second fragment (60 min) and removed during growth of the third fragment, which allowed the pmf to regenerate. TB: tryptone broth without dye, AnTc: anhydrotetracyline induction of flagella genes. Bottom: Fragment lengths represented as basal/apical (F1/F2) coordinates (n = 255 for 0 µM CCCP, n = 395 for 10 µM CCCP, n = 371 for 20 µM CCCP, n = 353 for 30 µM CCCP). The fits represent the injection-diffusion model with parameters D ≈ 5.25 × 10⁻¹³ m2 ⋅ s−1, and kon ≈ 26.10, 3.19, 1.19, 0.70 s−1 for 0 µM, 10, 20, 30 µM CCCP respectively. Representative fluorescent microscopy images of labelled flagella and matching coordinates are highlighted by coloured frames and arrows. Scale bar 2 µm. (b) Filament length as a function of time for decreasing values of kon. For small values of kon, the injection rate but not flagellin transport is rate-limiting, which results in a quasi-linear growth. (c) Growth curves for the CCCP raw data of panel a determined by fitting the data to the injection-diffusion model with a fixed parameter a. The values for kon decrease by a factor of 8 (10 µM CCCP), 22 (20 µM CCCP), and 38 (30 µM CCCP), compared to the untreated control. (d) Equation and biophysical parameters of the injection-diffusion model.
Figure 6—figure supplement 1

Supporting data for effect of CCCP inhibition of the pmf-dependent protein export on flagella growth rate.
(a) Raw data of triple-labelled flagella after inhibition of the pmf-dependent export apparatus by treatment with increasing concentrations of CCCP were measured and sorted according to the length of F1. Each vertical line represents an individual filament (n = 255 for 0 µM CCCP, n = 395 for 10 µM CCCP, n = 371 for 20 µM CCCP, n = 353 for 30 µM CCCP). (b) Basal/apical relationship (30 min elongation) for decreasing values of kon, which result in linear-like growth rate. (c) Fragment lengths from the triple labelling data of Figure 6a presented as the average individual fragment size. Error bars represent the 95% confidence interval of mean estimation. (d) Minor population of CCCP-resistant flagella display filament elongation kinetics similar to the untreated control. Left panel: distribution of the second (F2) fragments for the untreated and 30 µM CCCP conditions. The presence of long filaments (F2 >2 µM) is characteristic for resistance to the uncoupler. Middle panel: the filaments with long F2 fragments follow a kinetic similar to the untreated population (blue curve). The fit curve for the 30 µM CCCP treatment is shown in orange for comparison. Right panel: the CCCP-sensitive population undergoes an increase in elongation speed after recovery from the CCCP treatment (F3 > F2) while the elongation speed of the CCCP-resistant population follows the normal kinetic (F3 < F2, see Figure 2c). The dotted lines mark a threshold of 2 µm for F2. The points above this threshold are shown in purple.
Author response image 1
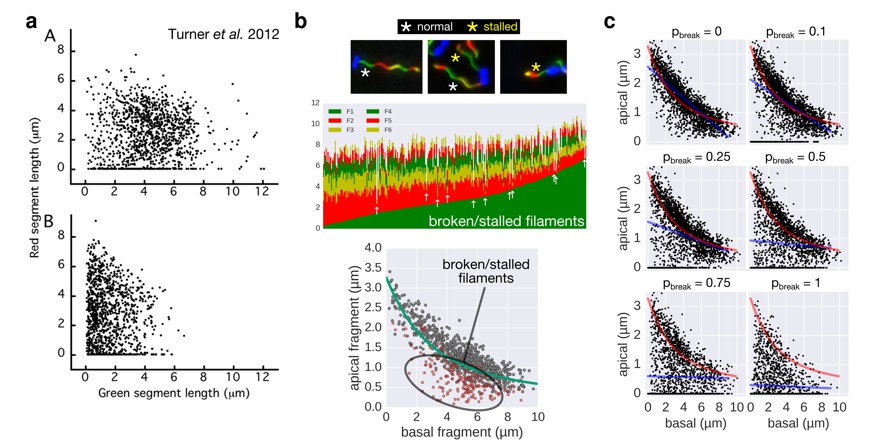
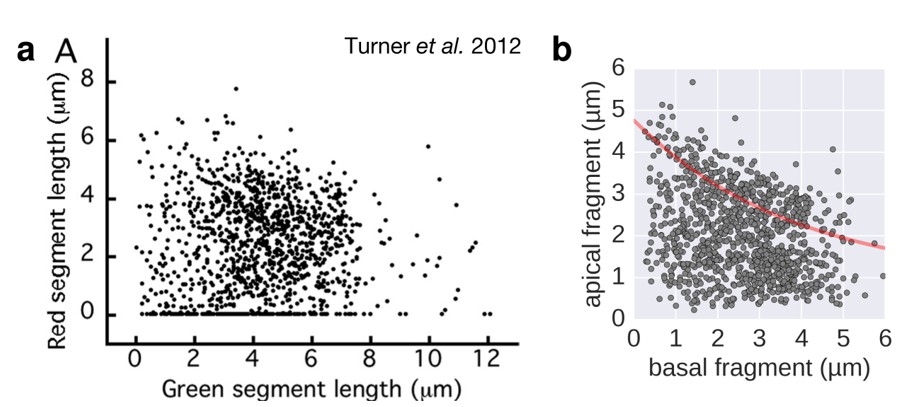
Comparison of the 2-color filament growth rate measurement of Turner et al. 2012 with our multi-colour filament growth rate data.
a. 2-color growth rate data reported in Figure 3 of Turner et al. 2012; (A) represents unsheared filaments and (B) represents data from sheared filaments. The high number of points on the x-axis suggests that many filaments are broken or stalled. b. Raw data of our multi-colour filament growth rate measurements. Upper left panel represents the raw multi-colour data reported in the present manuscript and highlights apparently stalled or broken filaments. Lower panel represents the basal-apical growth coordinates from the multi-colour data and highlights as red dots the data derived from apparently stalled or broken filaments. Importantly, those data points accumulate below the fit curve, which prevents an accurate fit when the proportion of broken/stalled filaments is too high. c. Simulation of random filament breakage (of probability pbreak) on our dataset demonstrate that data points accumulate on the x-axis and below the fit curve (in red). It is crucial to note that a high fraction of broken filaments masks the obvious length-dependency of filament growth and prevents an accurate fit on the complete set of points (linear fit in blue; compare with Figure 3 of Turner et al. 2012).
Author response image 2
Filament growth rate under conditions of reduced proton motive force.
a. Basal-apical length coordinates based on the 2-color filament length data reported in Figure 3 of Turner et al. 2012. b. Basal-apical length coordinates of our growth rate experiment under conditions of reduced proton motive force. The curve in red represents the observed filament growth under physiological proton motive force. We presume that the length data reported in Figure 3 of Turner et al. 2012 comprises sub-populations of bacteria with decreased proton motive force due to extensive experimental manipulations. Please note that the duration of apical fragment growth was 60 minutes in our experiment, in contrast to 90 minutes in Turner et al. 2012.
Videos
Video 1
Real-time flagellum growth observed using in situ continuous flow immunostaining.
The animation represents the raw data of the filament length measurements of five representative flagella as a function of time. The inset depicts a 400× time-lapse movie of the corresponding microcolony grown in a CellASIC microfluidic device in the presence of 10 nM anti-HA fluorochrome-coupled primary antibodies. Elapsed time is depicted in min’sec’’. Coloured circles highlight the onset of filament assembly of the respective length measurement data. Arrows denote growth or measurement incidents (e.g. filament flipped out of focus or broke off). Scale bar 1 µm.
Tables
Table 1
Strains and plasmids used in this study.
| Strain | Relevant characteristics | Source or reference |
|---|---|---|
| SJW1103 | Salmonella enterica serovar Typhimurium wild-type strain SJW1103 for motility and chemotaxis | (Yamaguchi et al., 1984) |
| TM113 | SJW1103 ∆fliC | T. Miyata, unpublished |
| NH001 | SJW1103 ∆flhA | (Hara et al., 2011) |
| MM1103iS | SJW1103 ∆fliS::km | (Furukawa et al., 2016) |
| MM1103gK | SJW1103 flgK::Tn10 | This study |
| MM1103gKiS | SJW1103 ∆fliS::km flgK::Tn10 | This study |
| MM1103CPOP | SJW1103 ∆PfliC::tetRA-62 | This study |
| TH437 | Salmonella enterica serovar Typhimurium wild-type strain LT2 | lab collection |
| TH15801 | LT2 PflhDC5451::Tn10dTc[del-25] ∆hin-5717::FCF | lab collection |
| EM1237 | LT2 ∆araBAD1026::fliC ∆fliC7861::FRT ∆hin-5717::FCF PflhDC5451::Tn10dTc[del-25] | This study |
| EM2046 | LT2 ∆hin-5717::FRT fliC6500 (T237C) PflhDC5451::Tn10dTc[del-25] | This study |
| EM2400 | LT2 ∆hin-5717::FRT fliC6500(T237C) ∆araBAD1005::FRT PflhDC5451::Tn10dTc[del-25] | This study |
| EM4076 | LT2 ∆hin-5717::FRT fliC7746::3xHA (∆aa201-213::3xHA) motA5461::MudJ PflhDC5451::Tn10dTc[del-25] ∆sseA-ssaU::FCF (deletes Spi-2) | This study |
| Plasmids | Relevant characteristics | Source or reference |
| pBAD24 | Expression vector | Invitrogen |
| pAOA001 | pBAD24/FliC | This study |
| pAOA002 | pBAD24/FliC(∆29–32) | This study |
| pAOA003 | pBAD24/FliC(∆11–18) | This study |
| pAOA004 | pBAD24/FliC(∆11–18/∆29–32) | This study |
| pAOA005 | pBAD24/FliC(∆310–495) | This study |
| pAOA006 | pBAD24/FliC(∆29–32/∆310–495) | This study |
| pAOA007 | pBAD24/FliC(∆450–495) | This study |
| pAOA008 | pBAD24/FliC(∆29–32/∆450–495) | This study |
Download links
A two-part list of links to download the article, or parts of the article, in various formats.
Downloads (link to download the article as PDF)
Open citations (links to open the citations from this article in various online reference manager services)
Cite this article (links to download the citations from this article in formats compatible with various reference manager tools)
Bacterial flagella grow through an injection-diffusion mechanism
eLife 6:e23136.
https://doi.org/10.7554/eLife.23136


