Measuring the sequence-affinity landscape of antibodies with massively parallel titration curves
- Laboratoire de Physique Théorique, UMR8549, CNRS, École Normale Supérieure, France
- Cold Spring Harbor Laboratory, United States
- Laboratoire de Physique Statistique, UMR8550, CNRS, École Normale Supérieure, France
Figures
Figure 1
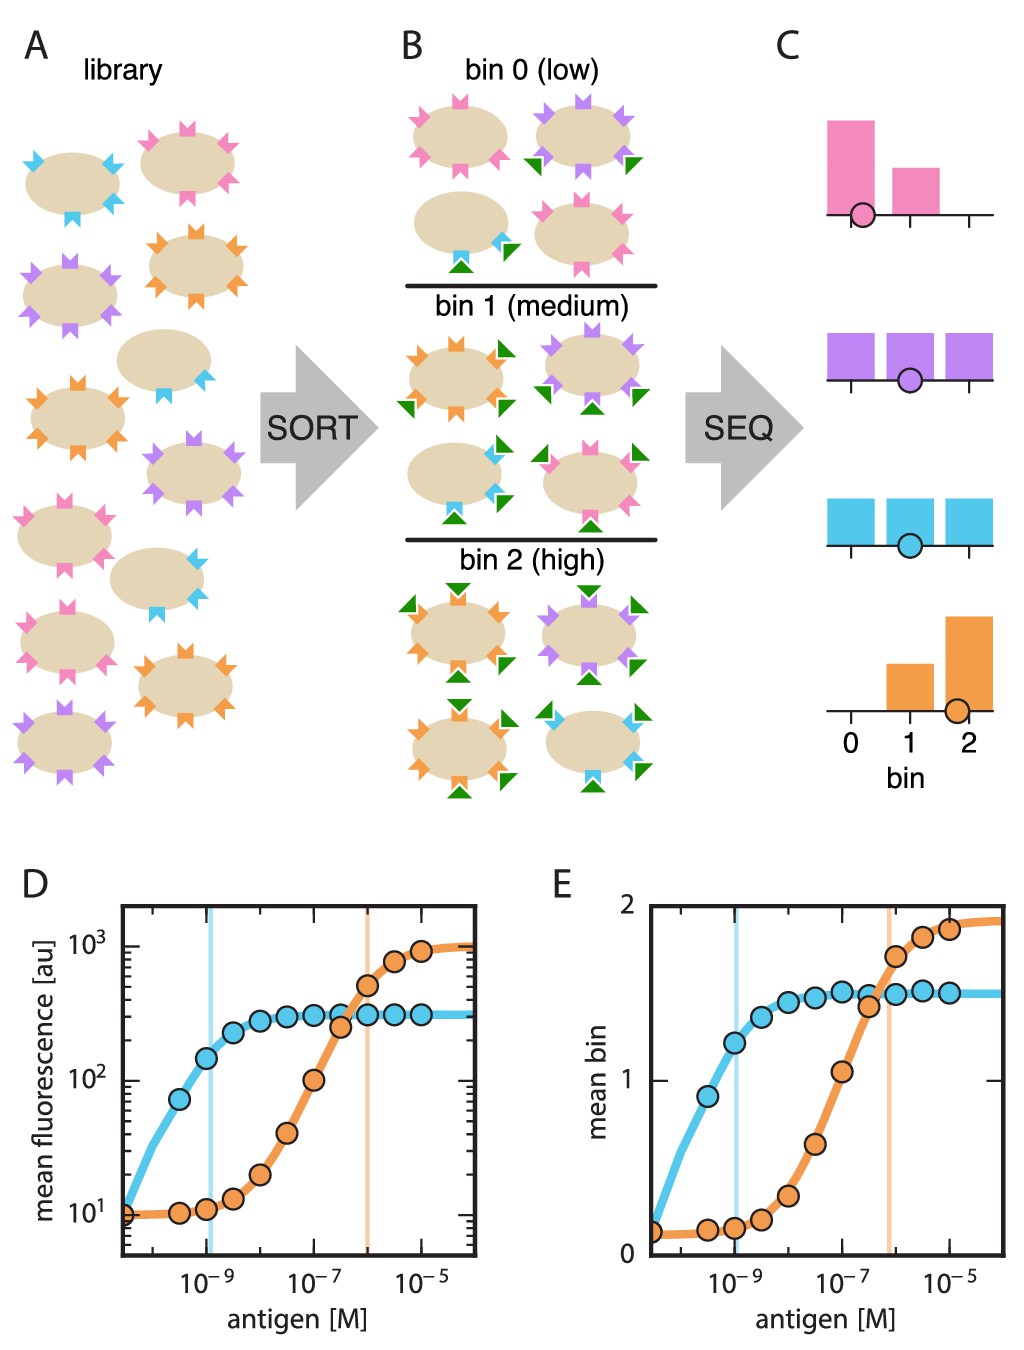
Schematic illustration of Tite-Seq.
(A) A library of variant antibodies (various colors) are displayed on the surface of yeast cells (tan). (B) The library is exposed to antigen (green triangles) at a defined concentration, cell-bound antigen is fluorescently labeled, and FACS is used to sort cells into bins according to measured fluorescence. (C) The antibody variants in each bin are sequenced and the distribution of each variant across bins is computed (histograms; colors correspond to specific variants). The mean bin number (dot) is then used to quantify the typical amount of bound antigen per cell. (D) Binding titration curves (solid lines) and corresponding values (vertical lines) can be inferred for individual antibody sequences by using the mean fluorescence values (dots) obtained from flow cytometry experiments performed on clonal populations of antibody-displaying yeast. (E) Tite-Seq consists of performing the Sort-Seq experiment in panels A–C at multiple antigen concentrations, then inferring binding curves using mean bin number as a proxy for mean cellular fluorescence. This enables measurements for thousands of variant antibodies in parallel. We note that the Tite-Seq results illustrated in panel E were simulated using three bins under idealized experimental conditions, as described in Appendix 1. The inference of binding curves from real Tite-Seq data is more involved than this panel might suggest, due to the multiple sources of experimental noise that must be accounted for.
Figure 2 with 1 supplement
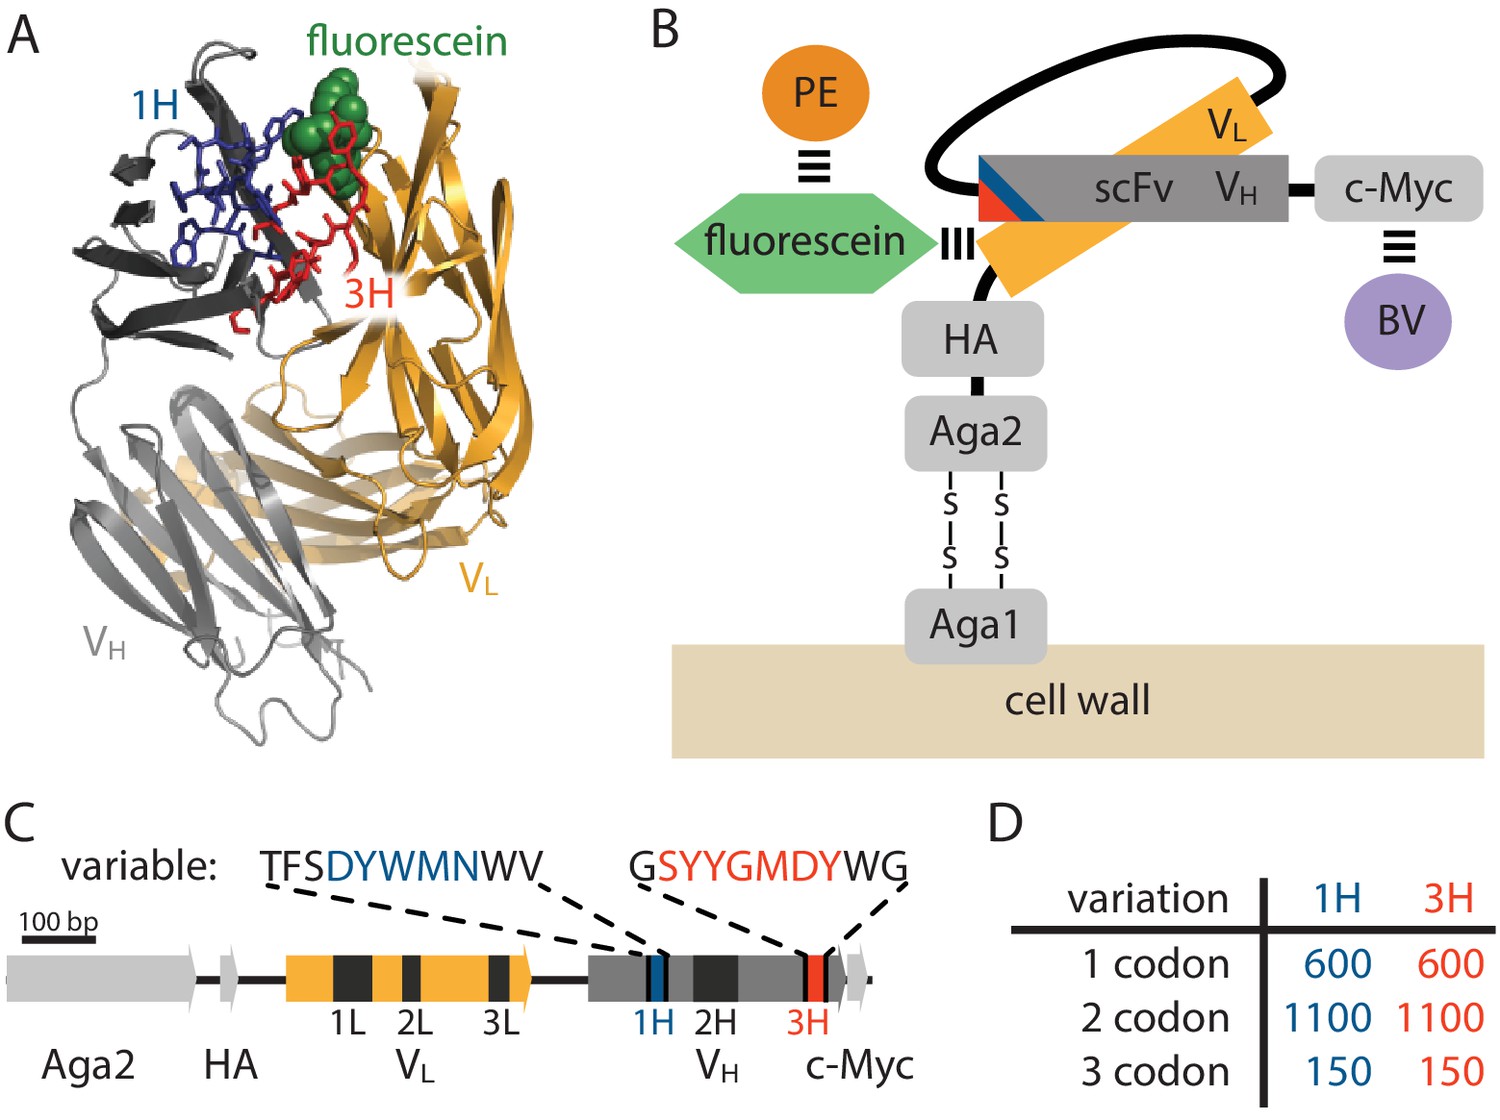
Yeast display construct and antibody libraries
(A) Co-crystal structure of the 4-4-20 (WT) antibody from Whitlow et al. (1995) (PDB code 1FLR). The CDR1H and CDR3H regions are colored blue and red, respectively. (B) The yeast display scFv construct from Boder and Wittrup (1997) that was used in this study. Antibody-bound antigen (fluorescein) was visualized using PE dye. The amount of surface-expressed protein was separately visualized using BV dye. Approximate location of the CDR1H (blue) and CDR3H (red) regions within the scFv are illustrated. (C) The gene coding for this scFv construct, with the six CDR regions indicated. The WT sequence of the two 10 aa variable regions are also shown. (D) The number of 1-, 2-, and 3-codon variants present in the 1H and 3H scFv libraries. Figure 2—figure supplement 1 shows the cloning vector used to construct the CDR1H and CDR3H libraries, as well as the form of the resulting expression plasmids.
Figure 2—figure supplement 1
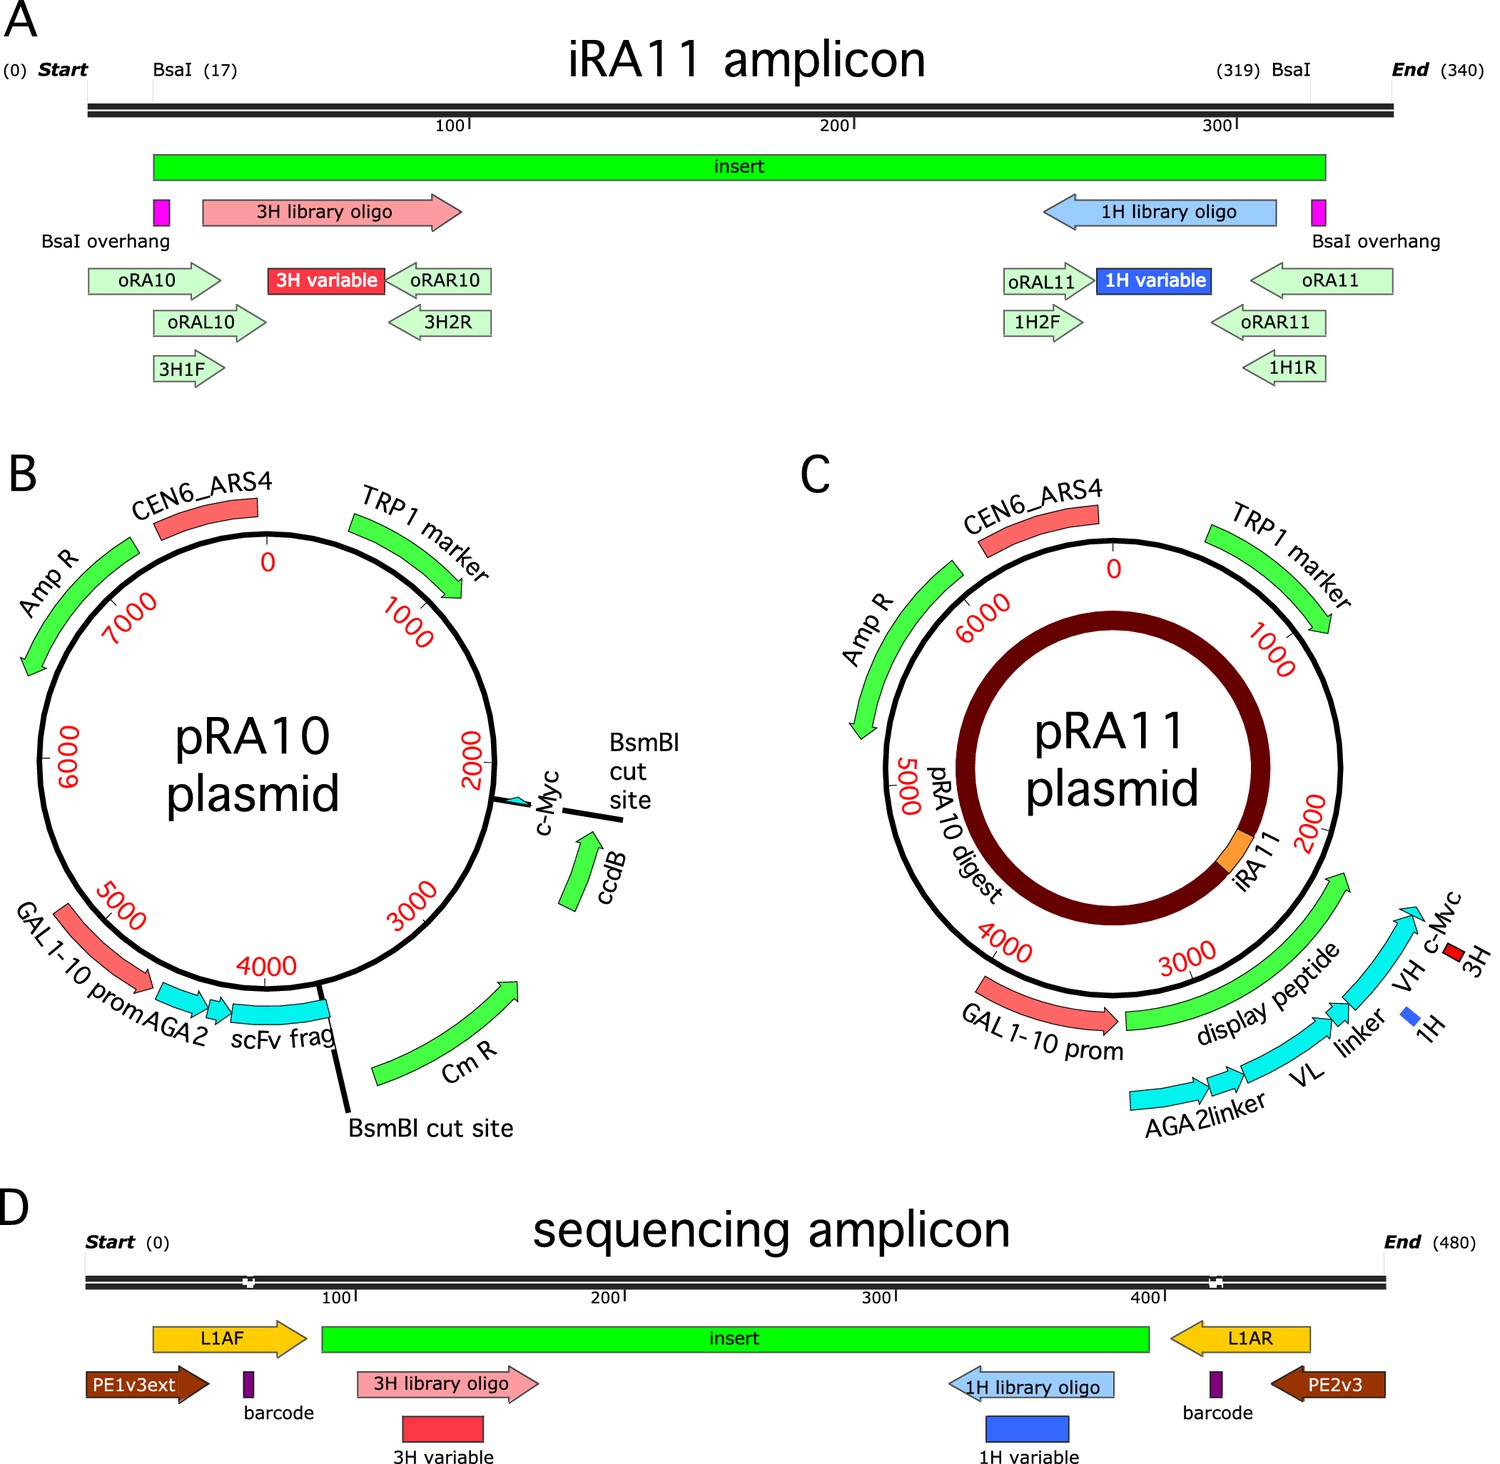
Cloning strategy.
(A) The iRA11 amplicon library, which was prepared from microarray-synthesized oligos containing variant CDR1H or variant CDR3H regions. This amplicon is flanked by inward-facing BsaI restriction sites. (B) The pRA10 cloning vector, which contains the ccdB selection gene within a cassette flanked by outward-facing BsmBI restriction sites. (C) The pRA11 plasmid library, which was cloned by ligating BsaI-digested iRA11 amplicons and BsmBI-digest pRA10 vector. (D) The sequencing amplicon that was amplified from sorted cells after Tite-Seq and Sort-Seq experiments and submitted for ultra-high-throughput DNA sequencing. Appendix 3 provides more details about iRA11 amplicons, the pRA10 vector, and the pRA11 plasmid library. Appendix 4 provides more information about the creation of sequencing amplicons.
Figure 3 with 2 supplements
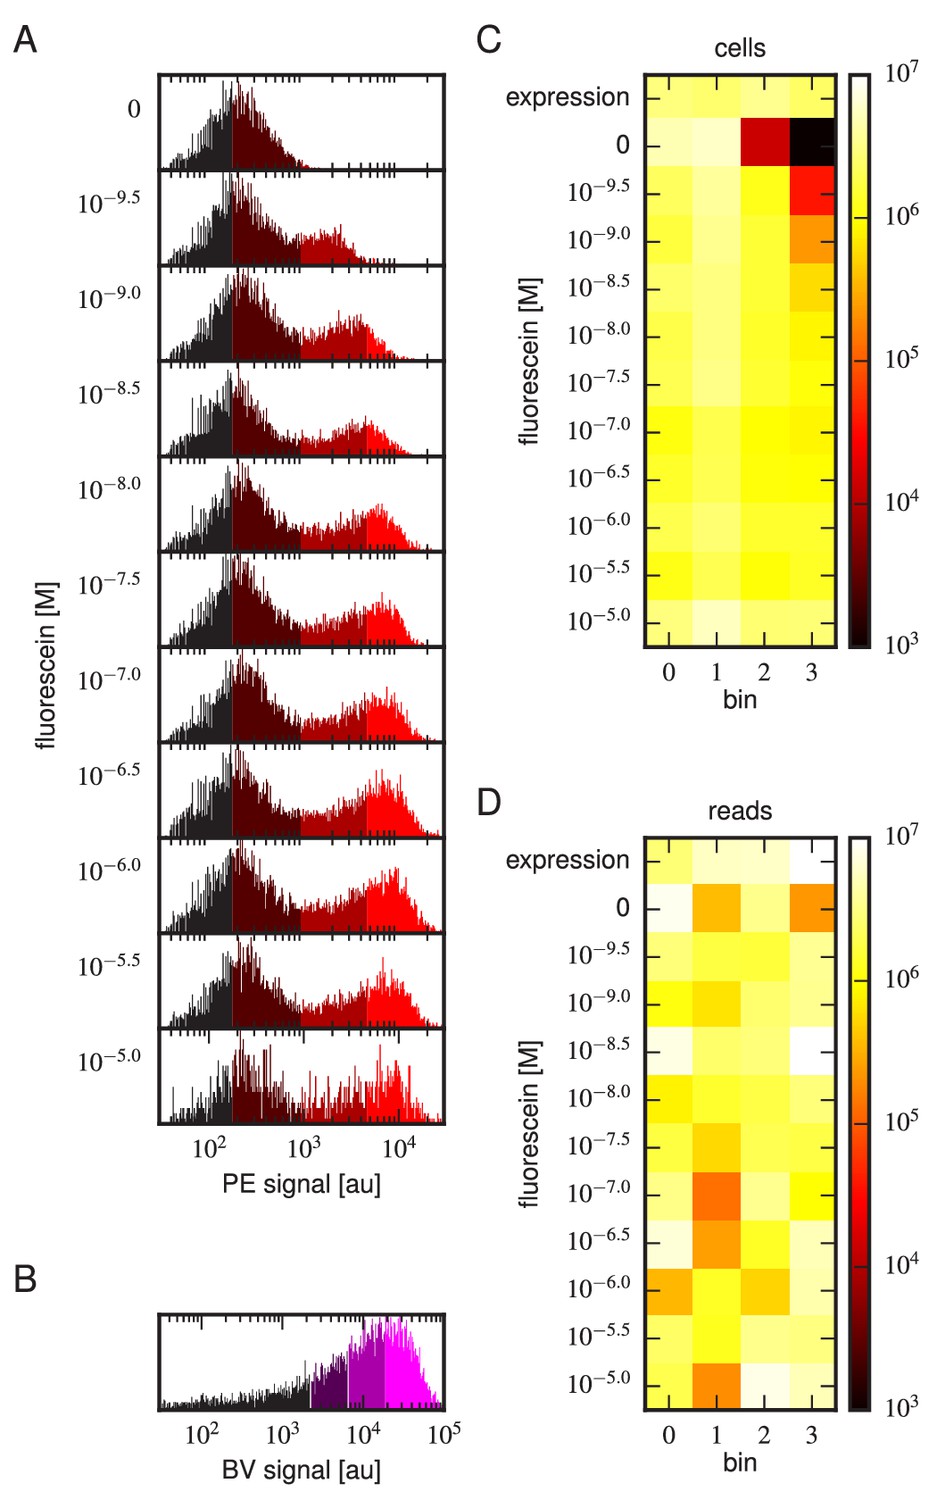
Details of our Tite-Seq experiments.
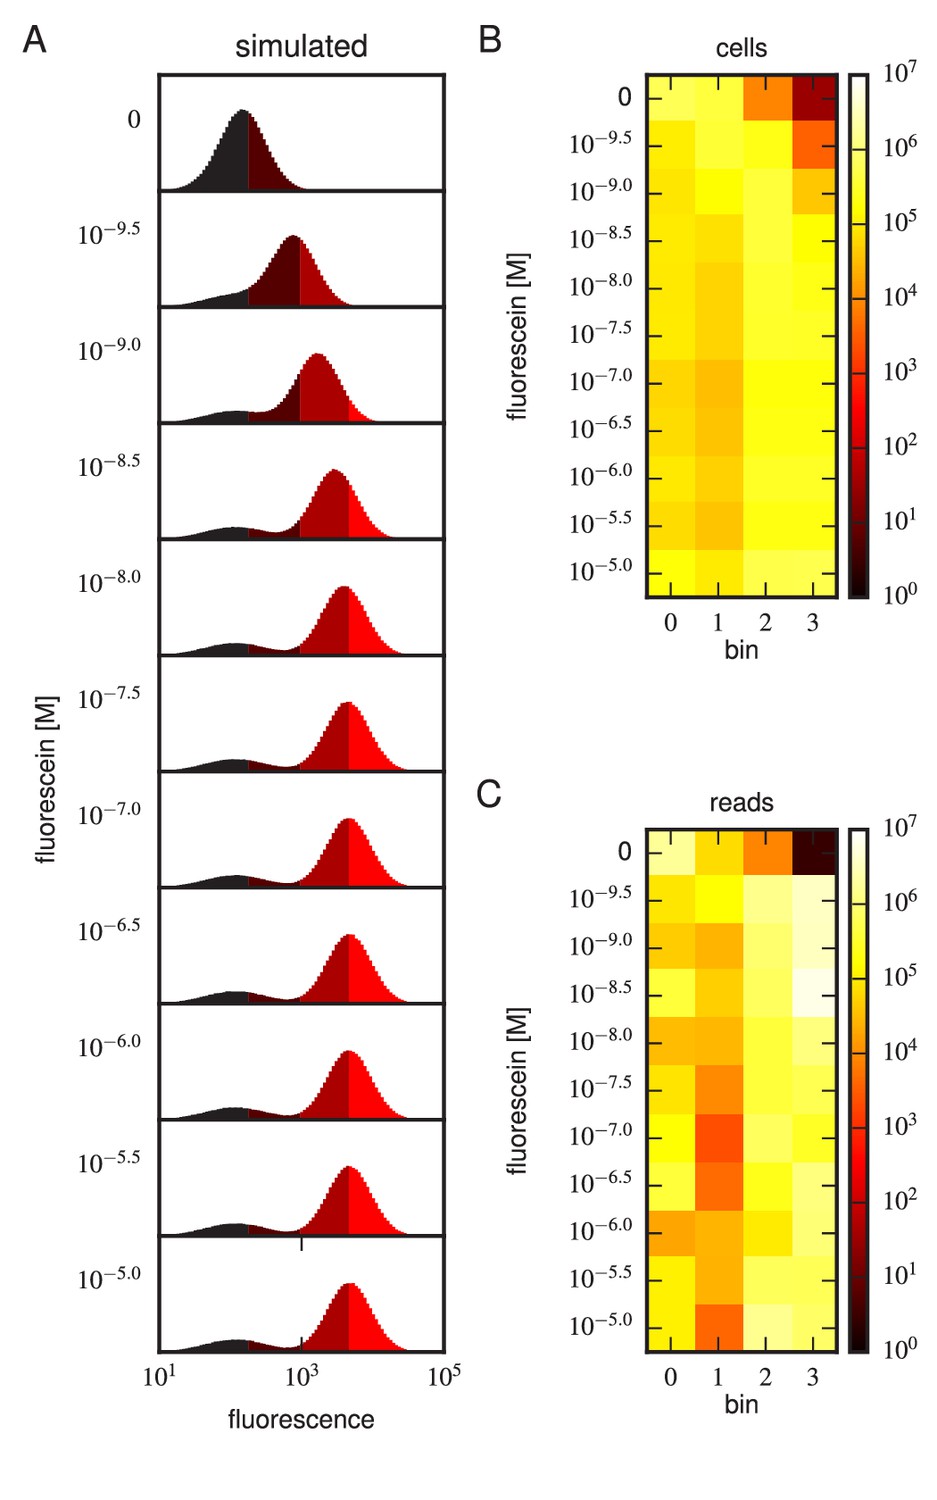
(A) Gates used to sort cells based on PE fluorescence, which provides a readout of bound antigen. Cells were labeled at the eleven different antigen concentrations. Shades of red indicate the four fluorescence gates used to sort cells; these correspond to bins 0, 1, 2, and 3 (from left to right). (B) Gates, indicated in shades of purple, used to sort cells based on BV fluorescence, which provides a readout of antibody expression. (C) The number of cells sorted into each bin. (D) The number of Illumina reads obtained from each bin of sorted cells after quality control measures were applied. The data shown in this figure corresponds to a single Tite-Seq experiment. Figure 3—figure supplement 1 and Figure 3—figure supplement 2 show data for two independent replicates of this experiment.
Figure 3—figure supplement 1
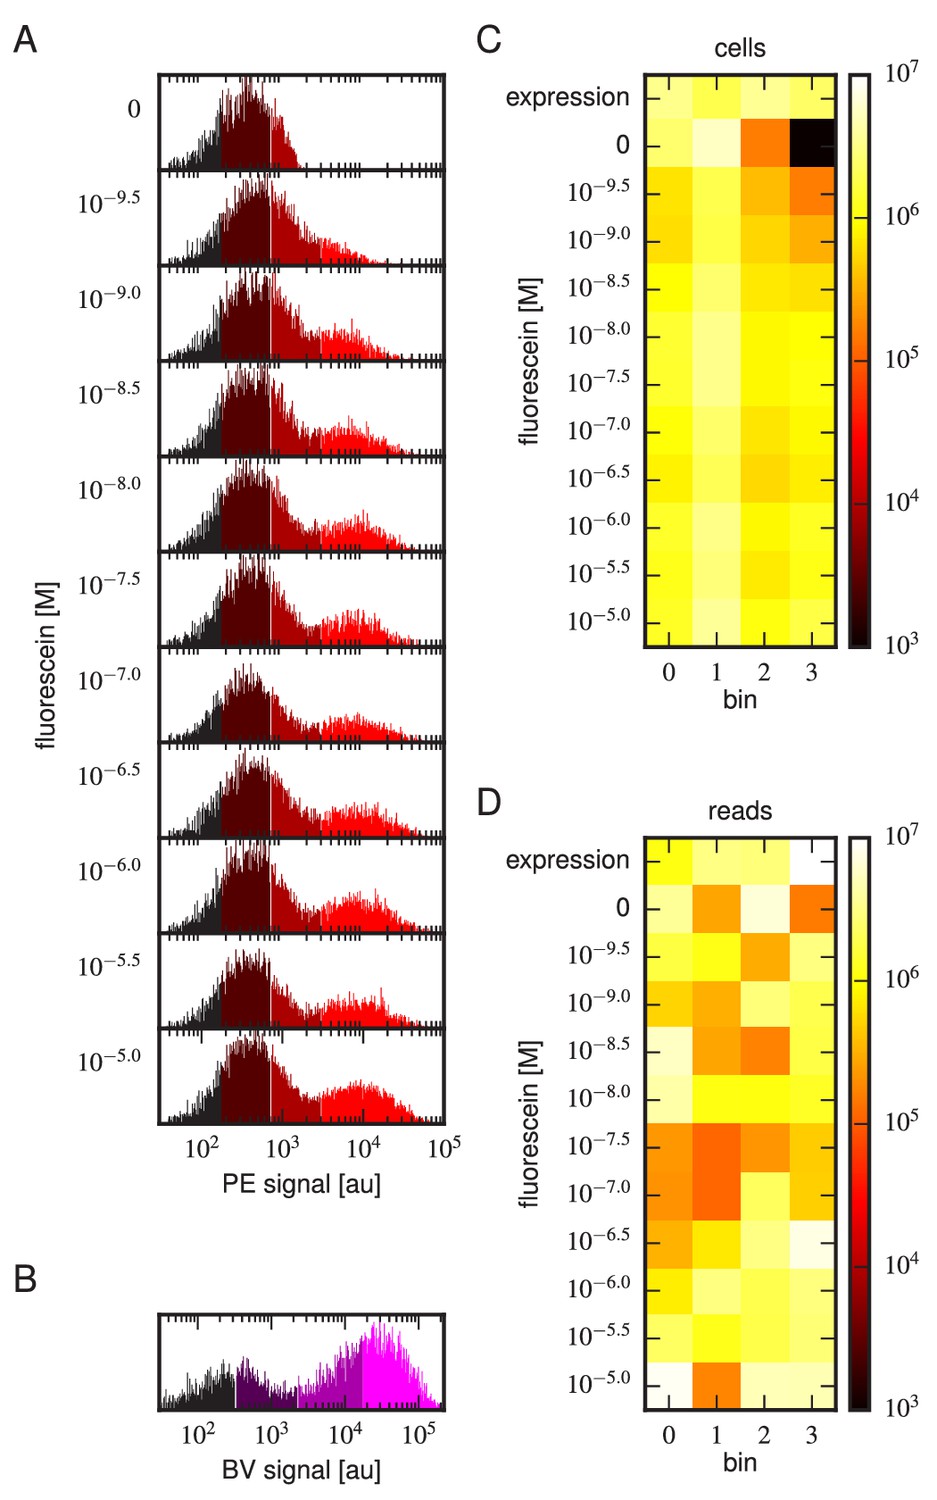
Tite-Seq experiment, replicate 2.
Analog of Figure 3 in the main text, but for the replicate 2 Tite-Seq experiment.
Figure 3—figure supplement 2
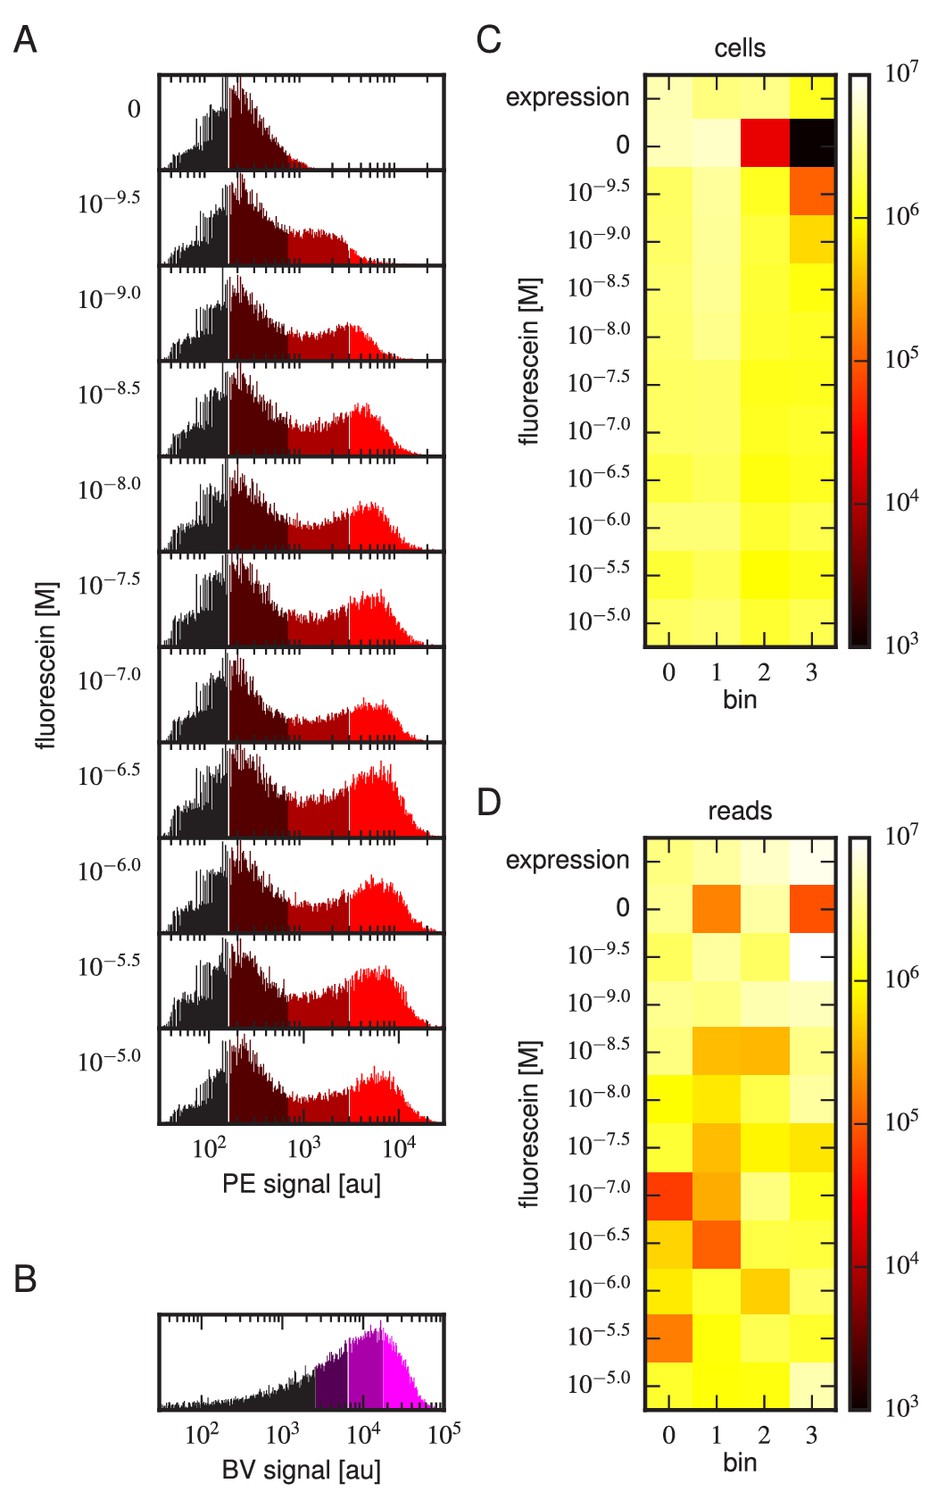
Tite-Seq experiment, replicate 3.
Analog of Figure 3 in the main text, but for the replicate 3 Tite-Seq experiment.
Figure 4 with 8 supplements
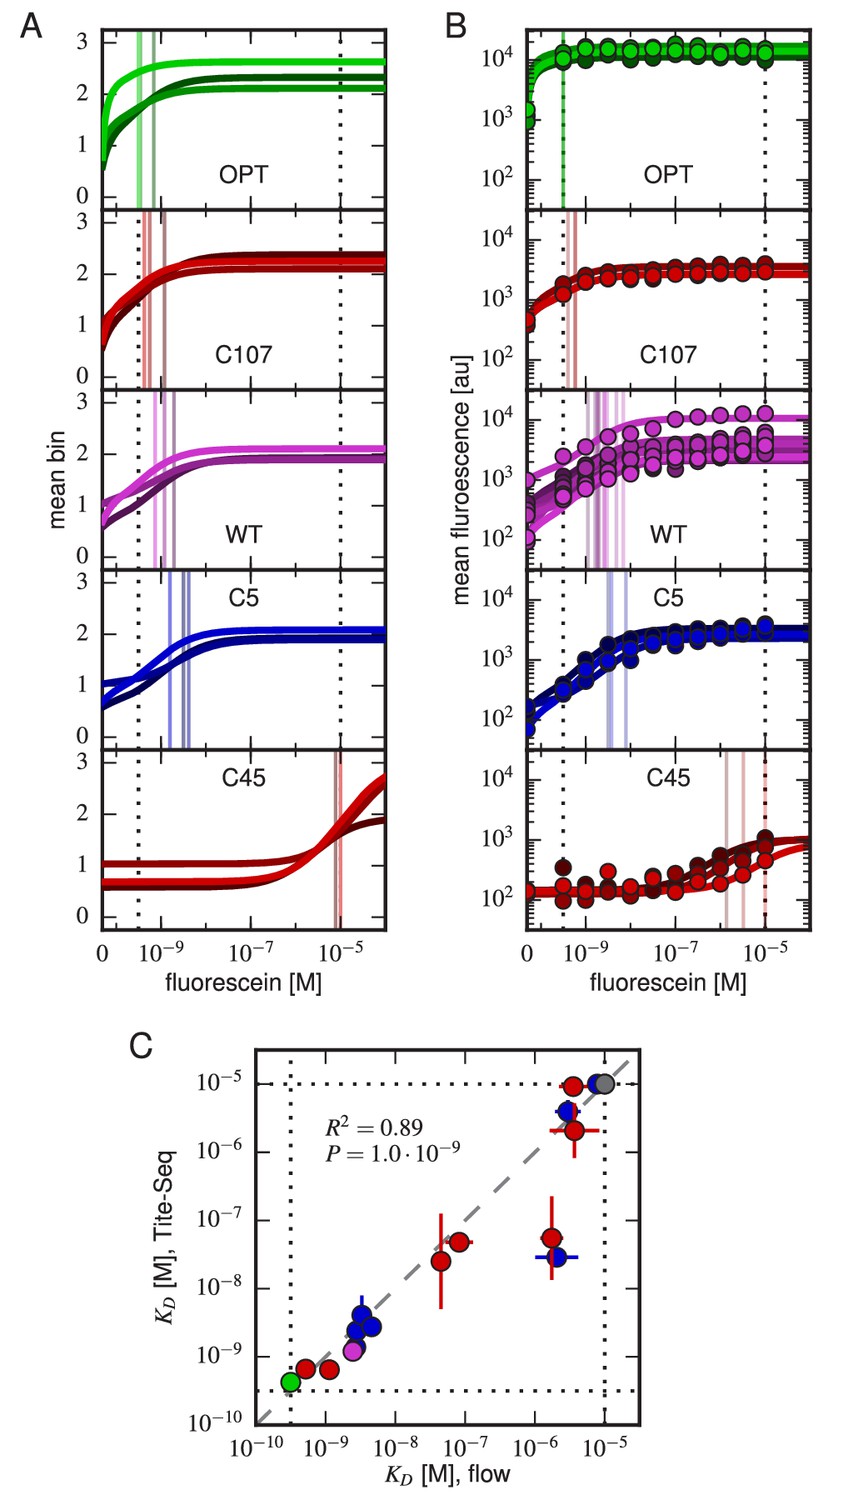
Accuracy and precision of Tite-Seq.
(A) Binding curves and measurements inferred from Tite-Seq data. (B) Mean fluorescence values (dots) and corresponding inferred binding curves (lines) obtained by flow cytometry measurements for five selected scFvs (WT, OPT, C5, C45, and C107). In (A,B), values corresponding to 0 M fluorescein are plotted on the left-most edge of the plot, dotted lines show the upper ( M) and lower ( M) limits on sensitivity, vertical lines show inferred values, and different shades correspond to different replicate experiments. (C) Comparison of the Tite-Seq-measured and flow-cytometry-measured values for all clones tested. Colors indicate different scFv protein sequences as follows: WT (purple), OPT (green), (black), 1H clones (blue), and 3H clones (red). Each value indicates the mean value obtained across all replicates, with error bars indicating standard error. Clones with outside of the affinity range are drawn on the boundaries of this range, which are indicated with dotted lines. The coefficient of determination () between log Tite-Seq values and log flow values includes clones outside of the affinity range; in such cases, the corresponding boundary value ( M or M) has been used. The amino acid sequences and measured values for all clones tested are provided in Table 1. Figure 4—figure supplement 1 provides plots, analogous to panels A and B, for all of the assayed clones. Figure 4—figure supplement 2 compares and values obtained across all three Tite-Seq replicates. Figure 4—figure supplement 3 quantifies measurement error using synonymous mutants. Figure 4—figure supplement 4 provides information about library composition. Figure 4—figure supplement 5 illustrates the poor correlation between scFv enrichment and Tite-seq measured values. Figure 4—figure supplement 6 shows a 2-fold difference in the specific activities of OPT and WT scFvs. Figure 4—figure supplement 7 illustrates the simulations we used in Figure 4—figure supplement 8 to validate the ability of our analysis to infer correct values.
Figure 4—figure supplement 1
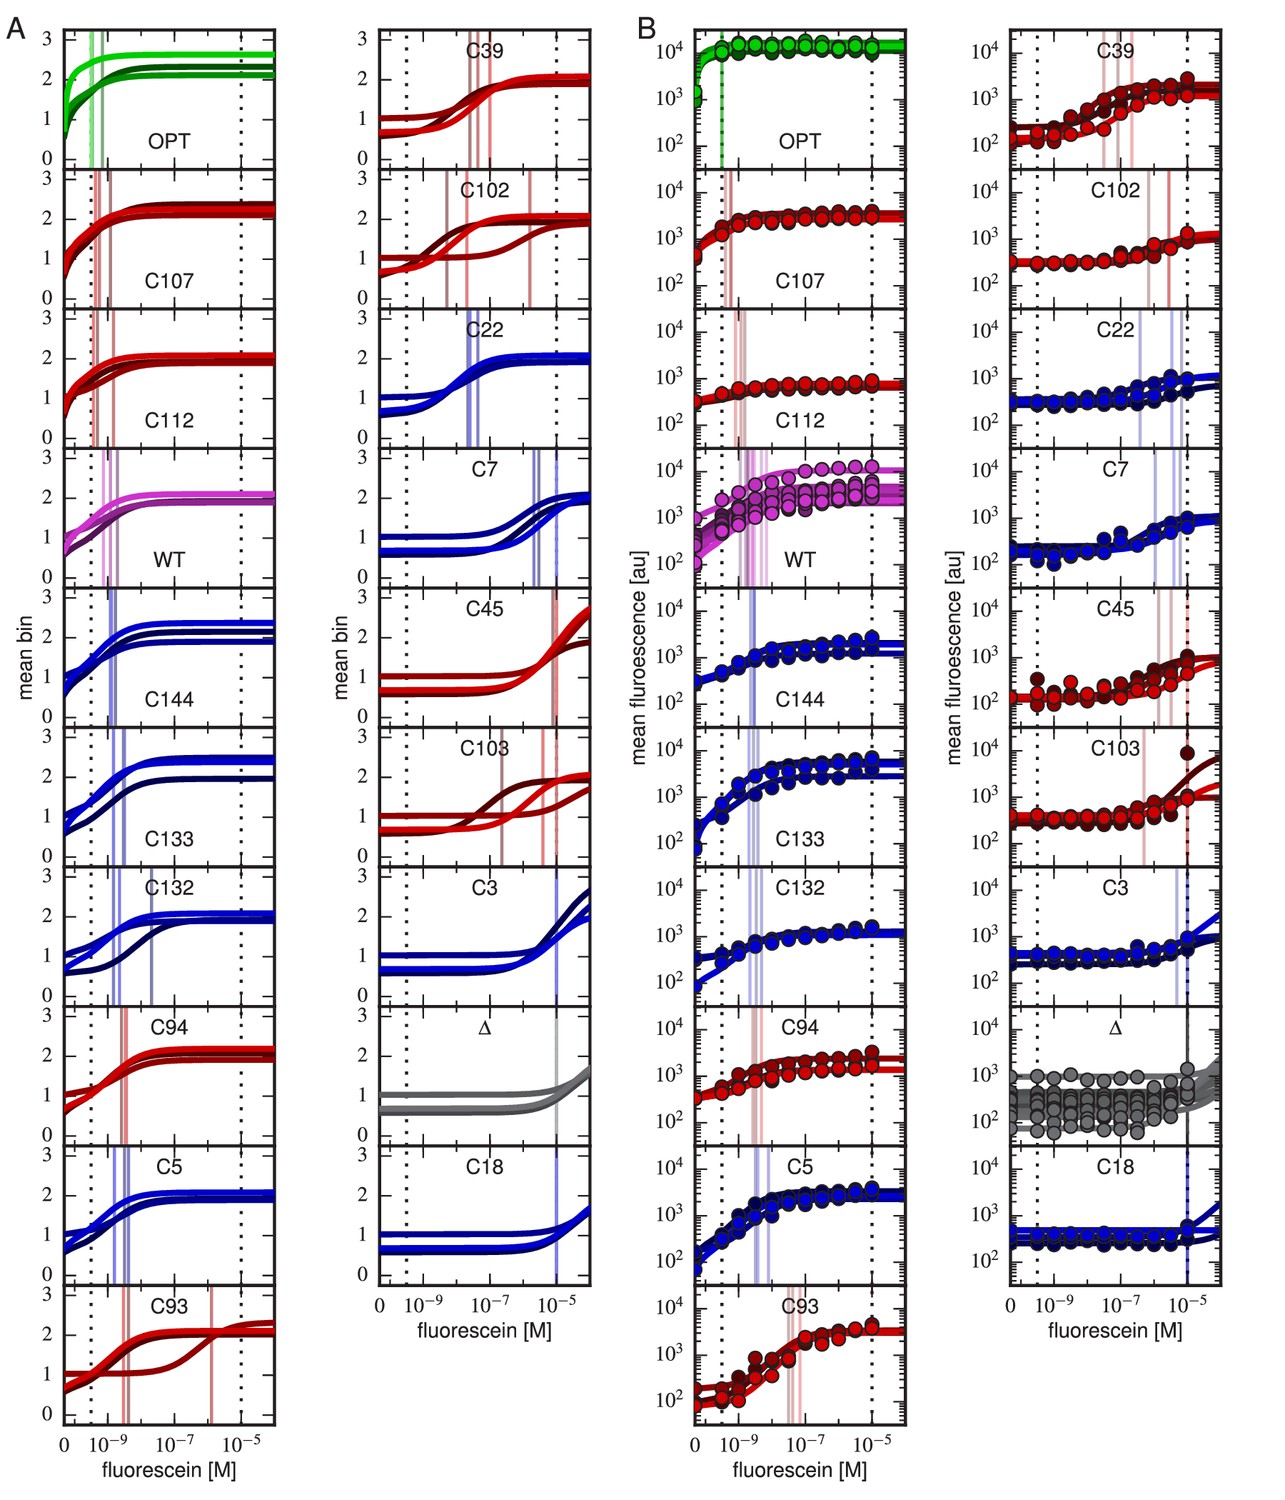
Binding curves for all clones.
Binding curves, measured using (A) Tite-Seq or (B) flow cytometry, for all clones analyzed in this paper and described in Table 1. Plots are drawn as in Figure 4, panels A and B.
Figure 4—figure supplement 2
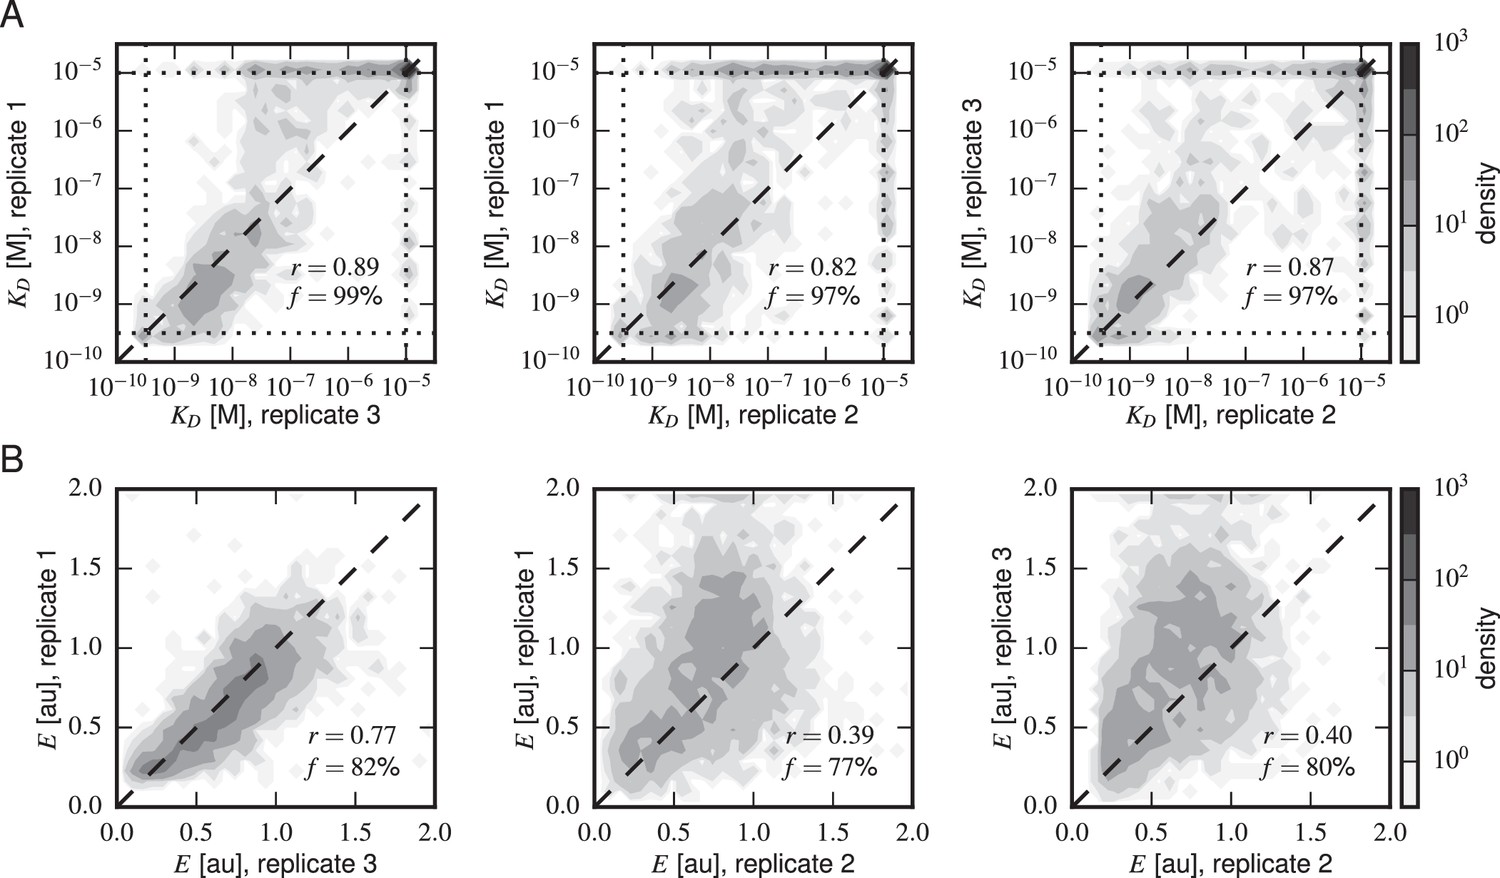
Concordance between replicate experiments.
Density plots of (A) Tite-Seq-measured values and (B) Sort-Seq-measured values between all pairs of replicate experiments. Measurements for these quantities that were judged to be of low precision due to low sequence counts are not plotted. indicates the percentage of total assayed sequences plotted; is the Pearson correlation and includes clonal measurements outside the boundaries of our measurable ranges ( M for , 0–2 for expression). Clones outside of these ranges were given values at the closest boundary.
Figure 4—figure supplement 3
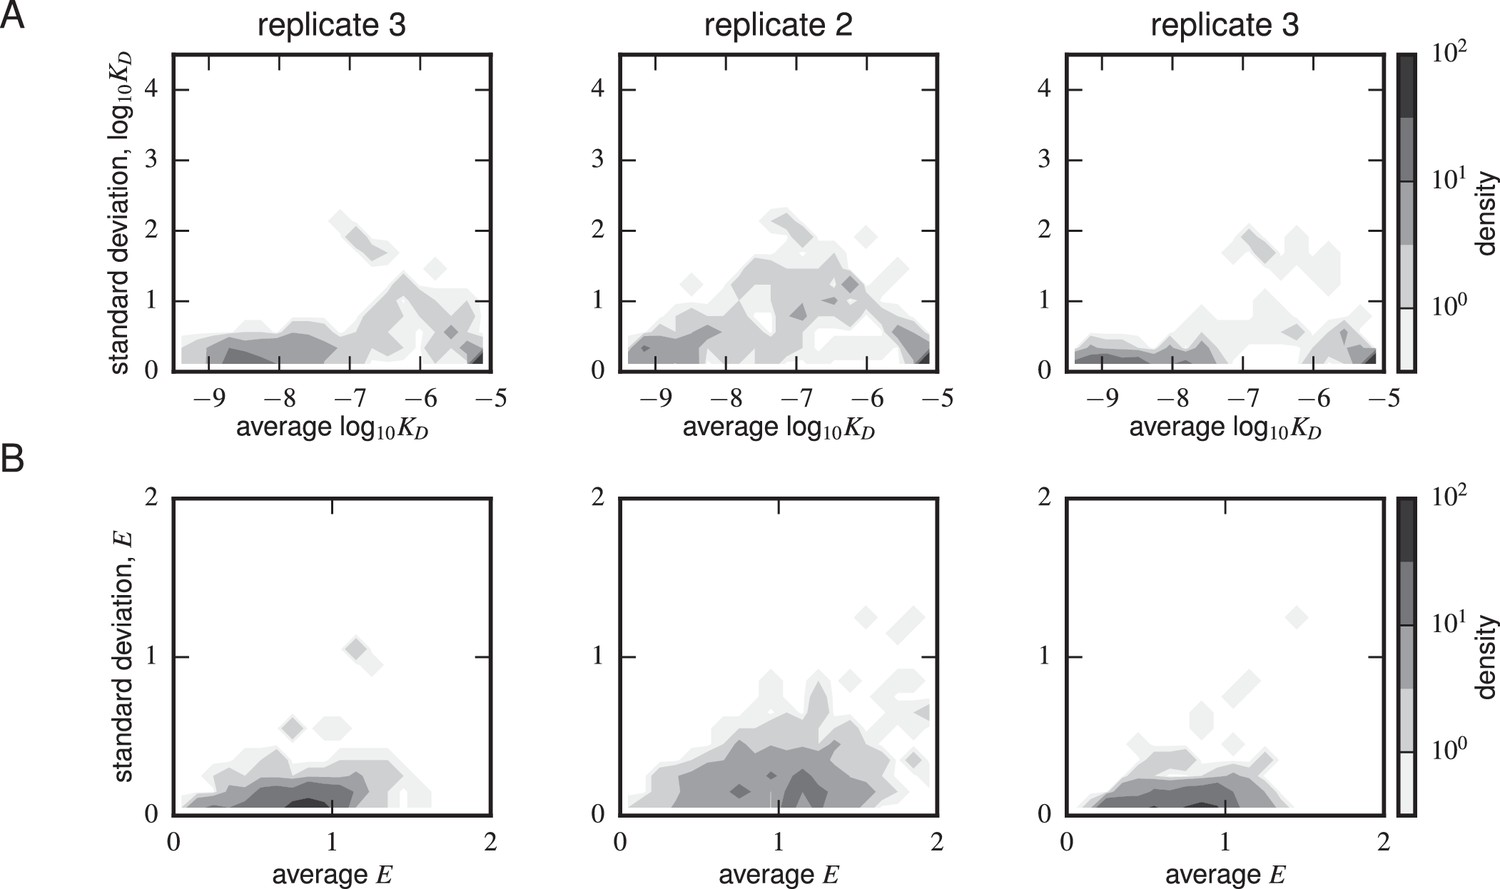
Error estimates from synonymous mutants.
Density plots for (A) Tite-Seq-measured log standard deviation and average log and (B) Sort-Seq-measured standard deviation and average are shown for each scFv sequence with more than one synonymous mutant for each of the replicate experiments. The error peaked between M. The expression error peaked at or above WT expression (i.e. 1) levels.
Figure 4—figure supplement 4

Composition of scFv libraries.
(A) Comparison of library composition between all pairs of replicate experiments. (B) Zipf plots showing the library composition in each replicate experiment. In both panels, the prevalence of each scFv sequence in each replicate experiment was determined as part of the Tite-Seq curve fitting procedure, as described in Appendix 5.
Figure 4—figure supplement 5
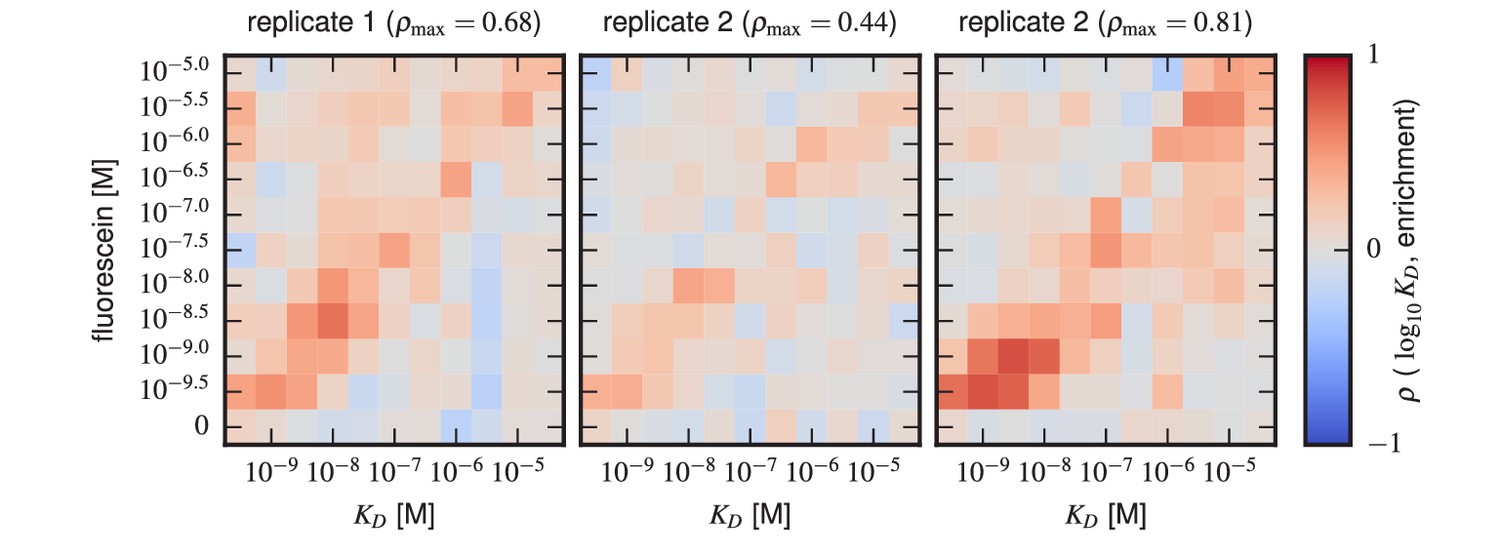
Sort-Seq enrichment correlates poorly with Tite-Seq-measured affinity.
To assess how well simple enrichment calculations might reproduce the values measured by Tite-Seq, we did the following calculation. For each of the two libraries (1 H and 3 H), we partitioned scFvs into seven groups based on their measured s (columns). For each group at each antigen concentration (rows), we then computed the enrichment of each scFv in the high PE bins (bins 2,3) relative to the low PE bins (bins 0,1). In these enrichment calculations, the number of counts in each bin was re-weighted to accurately reflect the fraction of library cells falling within the fluorescence range of that bin. This figure shows the resulting Spearman rank correlation between enrichment and log values computed for each scFv group at each antigen concentration. In both libraries, we see that correlation values above background (which can be assessed from the values in the 0 M fluorescein row) only occur close to the diagonal, i.e., when is close to the fluorescein concentration used.
Figure 4—figure supplement 6
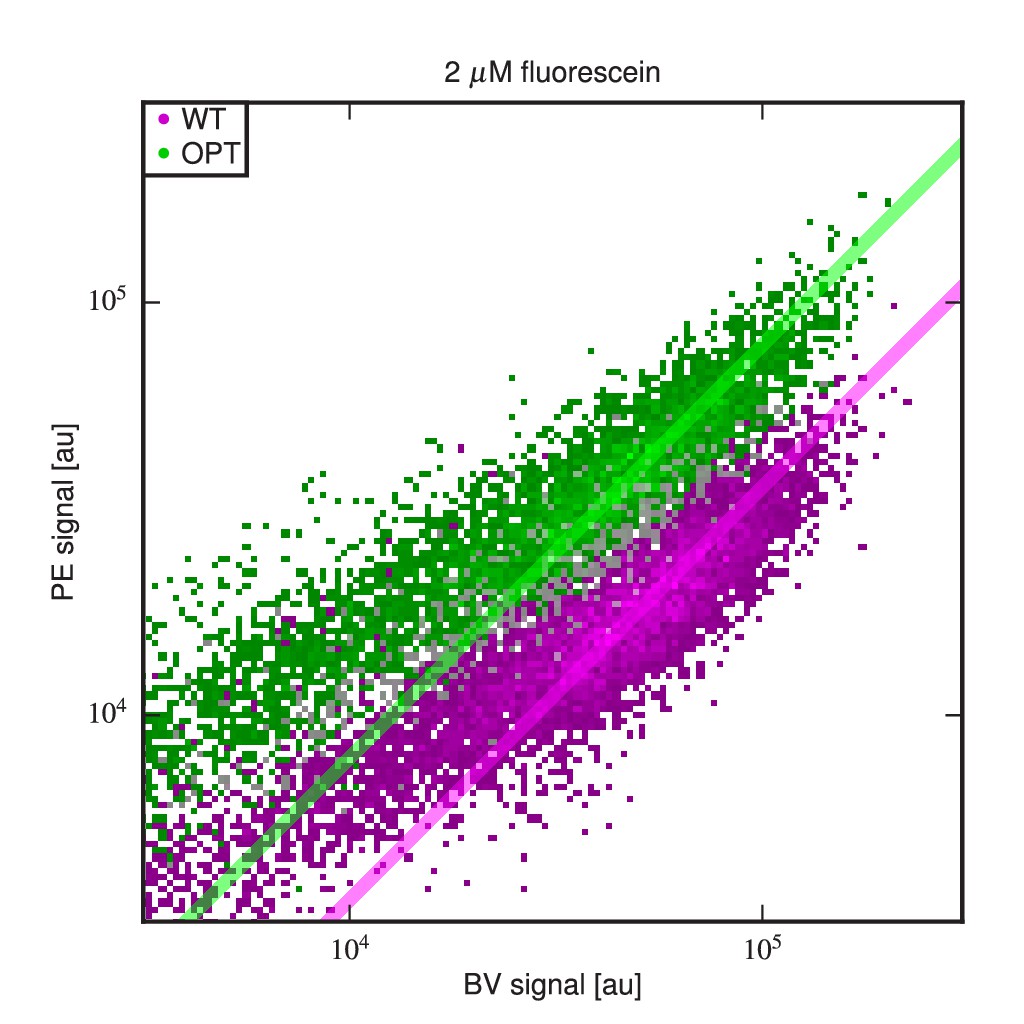
Differing specific activities of OPT and WT.
2D flow cytometry histograms showing both OPT- and WT-expressing cells labeled with PE and BV after incubation at 2 M fluorescein. At this fluorescein concentration, nearly all functional WT and OPT scFvs are bound. Regression lines (fixed to have slope 1) were fit to data points with BV signal between and . The vertical shift of the OPT data relative to the WT data indicates a factor of difference (computed from four replicate experiments) in the amount labeled antigen. This difference is not due to a difference in the number of surface-displayed scFvs, as this would cause the OPT and WT clouds to lie along the same diagonal. Rather, this difference between WT and OPT is due to variation in specific activity.
Figure 4—figure supplement 7
Realistic Tite-Seq simulations.
Realistic Tite-Seq data were simulated separately for each distinct pair of affinity () and amplitude () values, as described in Appendix 7. This figure shows simulated data, akin to the data displayed in Figure 4—figure supplement 6, for WT values of and .
Figure 4—figure supplement 8

Validation of analysis pipeline.
values were inferred for Tite-Seq data simulated using (green) the same number of cells, (light green) times as many cells, or (black) times as many sorted cells as in our experiments. Areas indicate approximately plus or minus one standard deviation in the fitted values obtained for each true value.
Figure 5 with 2 supplements
Effects of substitution mutations on affinity and expression.
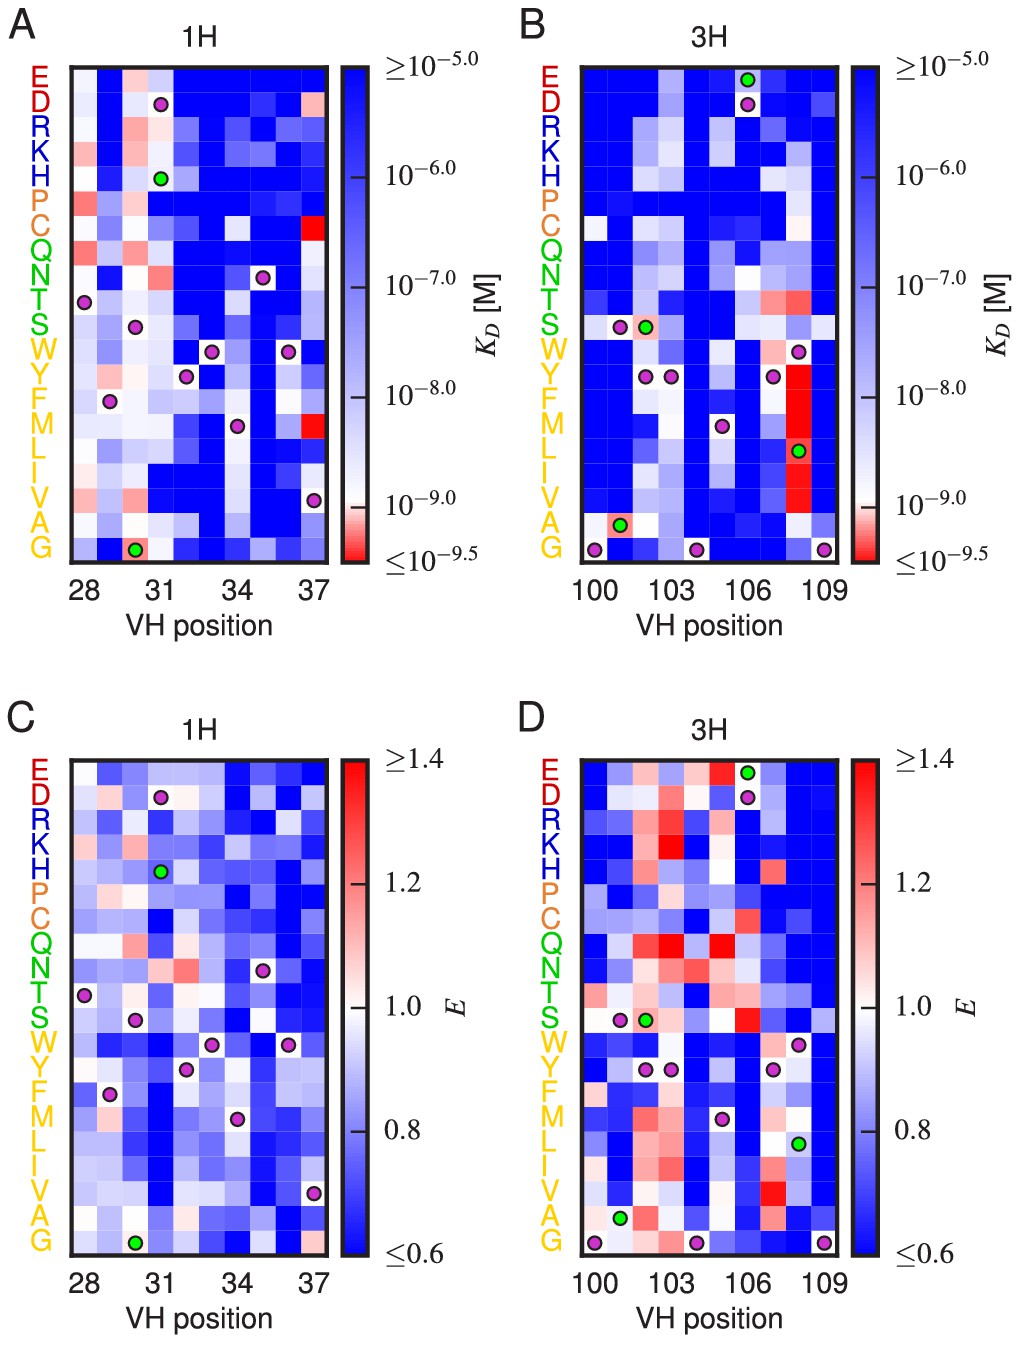
Heatmaps show the measured effects on affinity (A,B) and expression (C,D) of all single amino acid substitutions within the variables regions of the 1H (A,C) and 3H (B,D) libraries. Purple dots indicate residues of the WT scFv. Green dots indicate non-WT residues in the OPT scFv. Figure 5—figure supplement 1 provides histograms of the non-WT values displayed in panels A–D. Figure 5—figure supplement 2 compares the effects on of both single-point and multi-point mutations.
Figure 5—figure supplement 1
Histograms of substitution effects on affinity and expression.
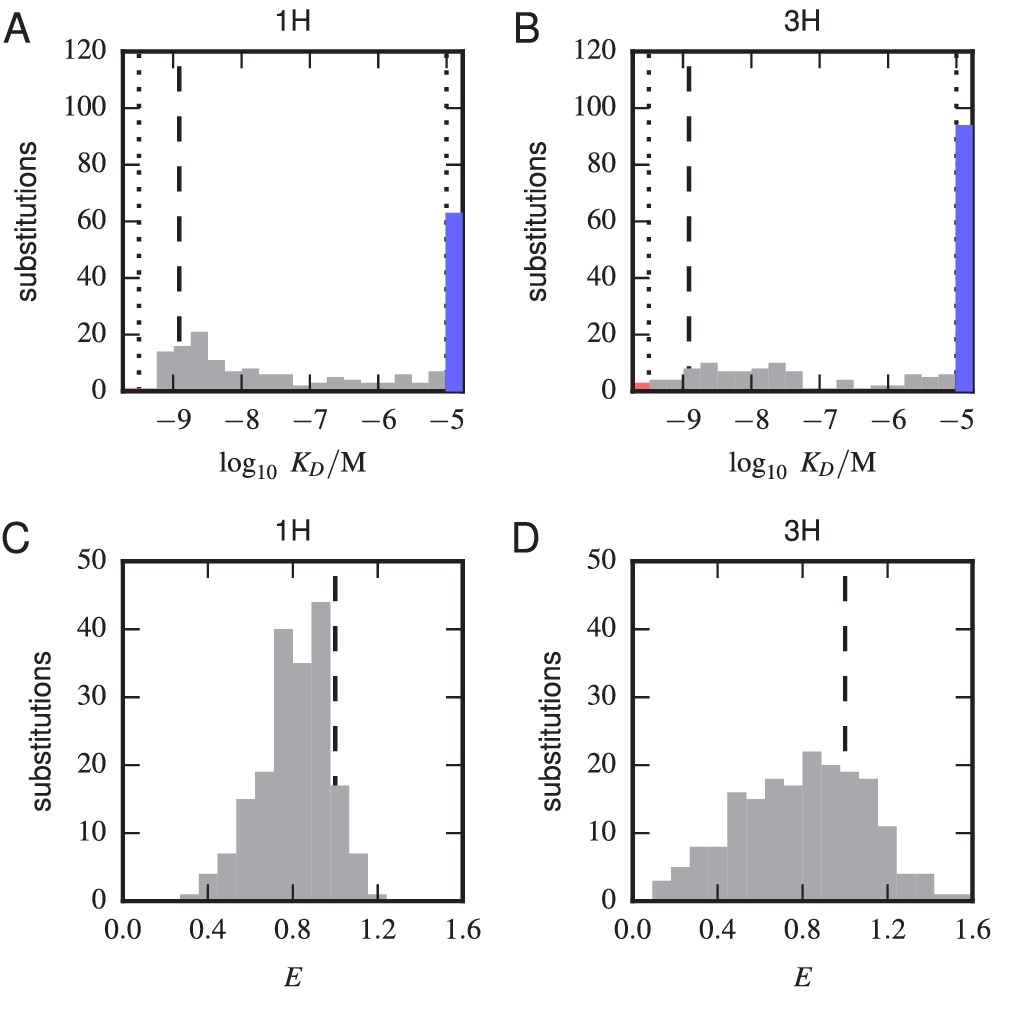
(A,B) Histogram showing the values measured for all substitution mutations in the 1 H (A) and 3 H (B) libraries. Note that these are the values plotted in panels A and B of Figure 5, except that the WT value is not included. Dashed lines indicate the of the WT scFv; dotted lines indicate thresholds just within our detection boundaries, M and M, while the colored bars outside this interval indicate the number of substitution mutations with above (blue) and below (red) this range. (C,D) Histogram of values for all single-substitution variants in the 1 H (C) or 3 H (D) libraries. These values, save those of the WT scFv, are plotted in panels C and D of Figure 5. Dashed lines indicate the WT expression level of .
Figure 5—figure supplement 2
Effects of multi-point mutations on affinity and expression.
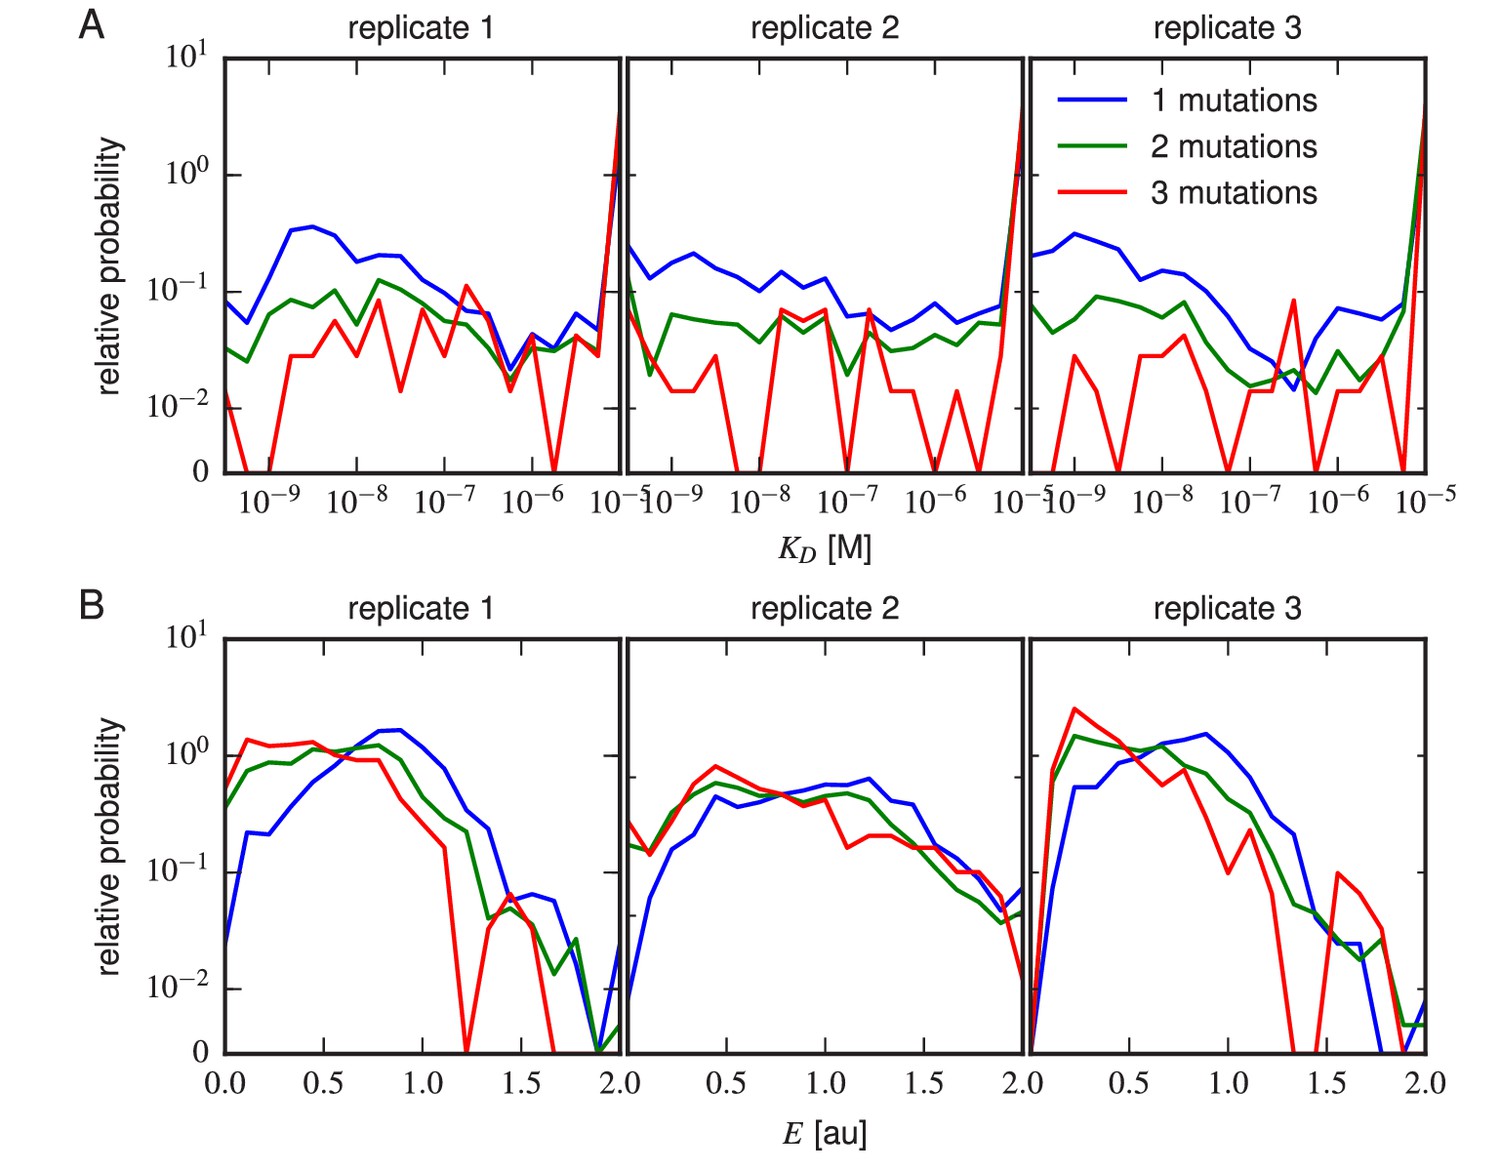
The effect of 1, 2, or three mutations on (A) Tite-Seq-measured values or (B) Sort-Seq-measured values. Plots show the relative probability density (over 30 bins along the or axes) observed for variants in each class.
Figure 6
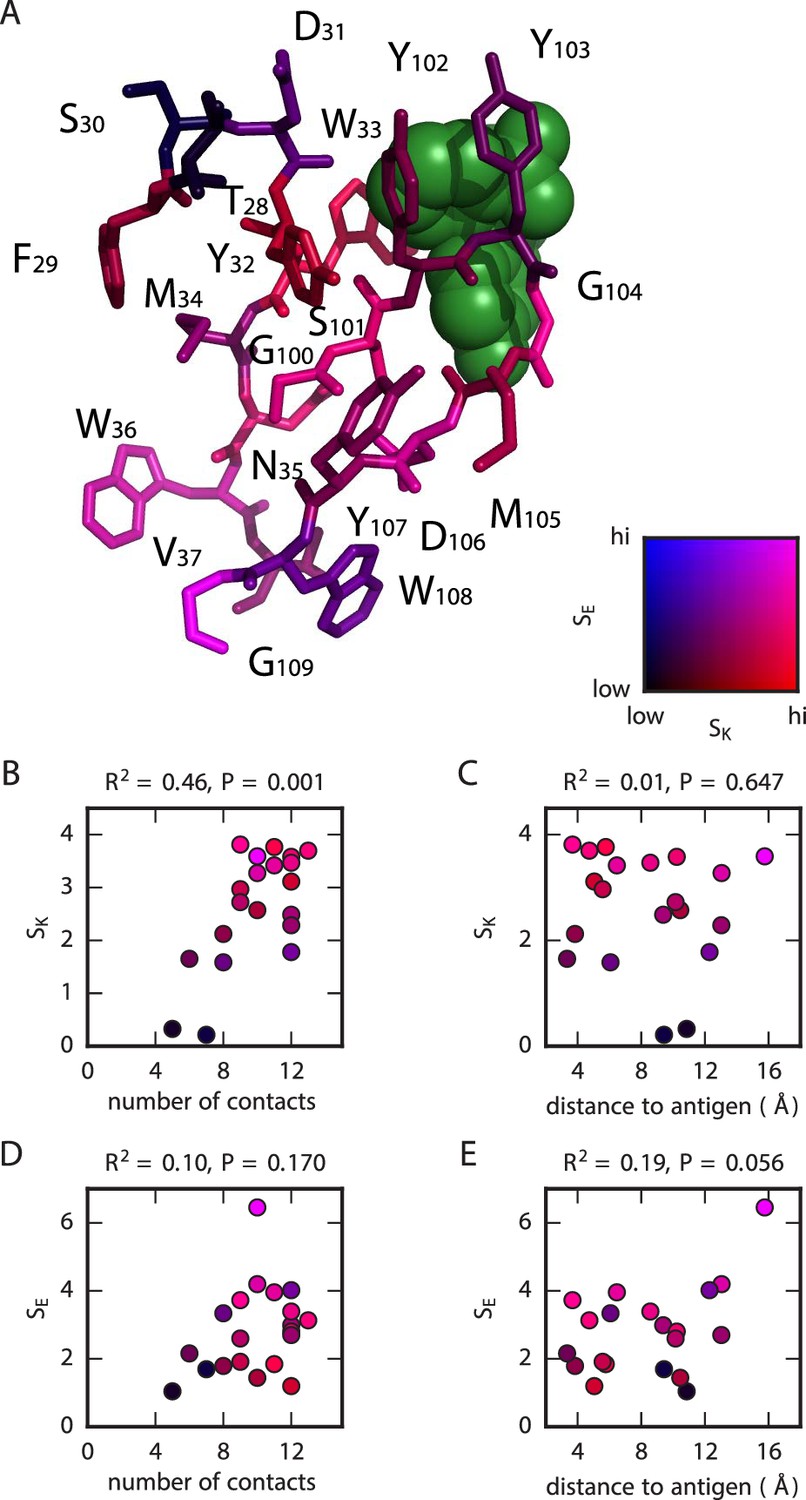
Structural context of mutational effects.
(A) Crystal structure (Whitlow et al., 1995) of the CDR1H and CDR3H variable regions of the WT scFv in complex with fluorescein (green). Each residue (CDR1H: positions 28–37; CDR3H: positions 100–109) is colored according to the and values computed for that position. These variables, and , respectively quantify the sensitivity of and to amino acid substitutions at each position, with larger values corresponding to greater sensitivity; see Equations 2 and 3 for definitions of these quantities. (B,C) For each position in the CDR1H and CDR3H variable regions, is plotted against either (B) the number of contacts the WT residue makes within the protein structure, or (C) the distance of the WT residue to the fluorescein molecule. (D,E) Similarly, is plotted against either (D) the number of contacts or (E) the distance to the antigen. is the coefficient of determination.
Tables
Table 1
Clones measured using flow cytometry and Tite-Seq. List of scFv clones, ordered by their flow-cytometry-measured values. With the exception of OPT and , these clones differed from WT only in their 1H and 3H variable regions. WT amino acids within these regions are capitalized; variant amino acids are shown in lower case. No sequence is shown for because this clone contained a large deletion, making identification of the 1H and 3H variable regions meaningless. values saturating our lower detection limit of M or upper detection limit of M are written with a or sign to emphasize the uncertainty in these measurements. Tite-Seq values indicate mean and standard errors computed across the three replicate Tite-Seq experiments; they are not averaged across synonymous variants.
| Name | 1H variable region | 3H variable region | No. replicates (flow) | [M] (flow) | [M] (Tite-Seq) |
|---|---|---|---|---|---|
| OPT | TFghYWMNWV | GasYGMeYlG | 3 | ≲10−9.5 | ≲10−9.5 |
| C107 | TFSDYWMNWV | GaYYGMDYWG | 3 | 10−9.28±0.04 | 10−9.18±0.11 |
| C112 | TFSDYWMNWV | GSYYGMDYcG | 3 | 10−8.95±0.07 | 10−9.19±0.14 |
| WT | TFSDYWMNWV | GSYYGMDYWG | 10 | 10−8.61±0.07 | 10−8.92±0.10 |
| C144 | vFSDYWMNWV | GSYYGMDYWG | 3 | 10−8.57±0.03 | 10−8.86±0.04 |
| C133 | aFSDYWMNWV | GSYYGMDYWG | 3 | 10−8.55±0.06 | 10−8.62±0.09 |
| C132 | TFmDYWlNWV | GSYYGMDYWG | 3 | 10−8.48±0.08 | 10−8.38±0.29 |
| C94 | TFSDYWMNWV | GSYYGMDsWG | 3 | 10−8.46±0.06 | 10−8.50±0.04 |
| C5 | TFSDYWiNWV | GSYYGMDYWG | 3 | 10−8.34±0.10 | 10−8.55±0.09 |
| C93 | TFSDYWMNWV | GSYrGMDYWG | 3 | 10−7.35±0.08 | 10−7.60±0.70 |
| C39 | TFSDYWMNWV | GSYYGMDYWa | 3 | 10−7.08±0.20 | 10−7.28±0.17 |
| C102 | TFSDYWMNWV | sSkYGMDYWG | 3 | 10−5.76±0.16 | 10−7.25±0.60 |
| C22 | ssSDYWMNWV | GSYYGMDYWG | 3 | 10−5.69±0.31 | 10−7.53±0.07 |
| C7 | hFSDYWMNWl | GSYYGMDYWG | 3 | 10−5.53±0.18 | 10−5.39±0.18 |
| C45 | TFSDYWMNWV | GSYdGnDYWG | 3 | 10−5.40±0.24 | ≳10−5.0 |
| C103 | TFSDYWMNWV | GSYYGMDlWG | 3 | 10−5.15±0.47 | 10−5.44±0.55 |
| C3 | TFSDYWMsWV | GSYYGMDYWG | 3 | ≳10−5.0 | ≳10−5.0 |
| C18 | TFSDYsMNWV | GSYYGMDYWG | 3 | ≳10−5.0 | ≳10−5.0 |
| Δ | – | – | 12 | ≳10−5.0 | ≳10−5.0 |
Table 2
Primers. Oligonucleotide sequences are written 5 to 3. Bold sequences indicate variable regions. The ‘1H library’ and ‘3H library’ primers respectively contained the 1H and 3H variable regions (bold) analyzed in this paper. These primer libraries were synthesized by LC Biosciences using microarray-based DNA synthesis. All other primers were ordered from Integrated DNA Technologies. The ‘[XX]’ portion of L1AF_XX and L1AR_XX indicates the location of each of 64 different barcodes (i.e., XX = 01, 02, , 64), which ranged in length from 7 bp to 10 bp and which differed from each other by at least two substitution mutations.
| Name | Sequence |
|---|---|
| 1H library | GTGTTGCCTCTGGATTCACTTTTAGTGACTACTGGATGAACTGGGTCCGCCAGTCTCCAGA |
| 3H library | GTGACTGAGGTTCCTTGACCCCAGTAGTCCATACCATAGTAAGAACCCGTACAGTAATAGATACCCAT |
| oRAL10 | TTCTGAGGAGACGGTGACTGAGGTTCCTTG |
| oRAR10 | TGAAGACATGGGTATCTATTACTGTACG |
| oRAL11 | CAGTCCTTTCTCTGGAGACTGGCG |
| oRAR11 | ATGAAACTCTCCTGTGTTGCCTCTGGATTC |
| 3H1F | TTCTGAGGAGACGGTGACT |
| 3H2R | TGAAGACATGGGTATCTATTACTGTAC |
| 1H2F | CAGTCCTTTCTCTGGAGACTG |
| 1H1R | ATGAAACTCTCCTGTGTTGCCT |
| oRA10 | GCATATCTAAGGTCTCGTTCTGAGGAGACGGTGAC |
| oRA11 | GCCGATTGTTGGTCTCCATGAAACTCTCCTGTGTTGC |
| PE1v3ext | AATGATACGGCGACCACCGAGATCTACACTCTTTCCCTACACGACG |
| PE2v3 | AAGCAGAAGACGGCATACGAGATCGGTCTCGGCATTCCTGCT |
| L1AF_XX | ACACTCTTTCCCTACACGACGCTCTTCCGATCT[XX]AGTCTTCTTCAGAAATAAGC |
| L1AR_XX | CTCGGCATTCCTGCTGAACCGCTCTTCCGATCT[XX]GCTTGGTGCAACCTG |
Download links
A two-part list of links to download the article, or parts of the article, in various formats.
Downloads (link to download the article as PDF)
Open citations (links to open the citations from this article in various online reference manager services)
Cite this article (links to download the citations from this article in formats compatible with various reference manager tools)
Measuring the sequence-affinity landscape of antibodies with massively parallel titration curves
eLife 5:e23156.
https://doi.org/10.7554/eLife.23156


