Similar synapse elimination motifs at successive relays in the same efferent pathway during development in mice
- Harvard University, United States
Figures
Figure 1
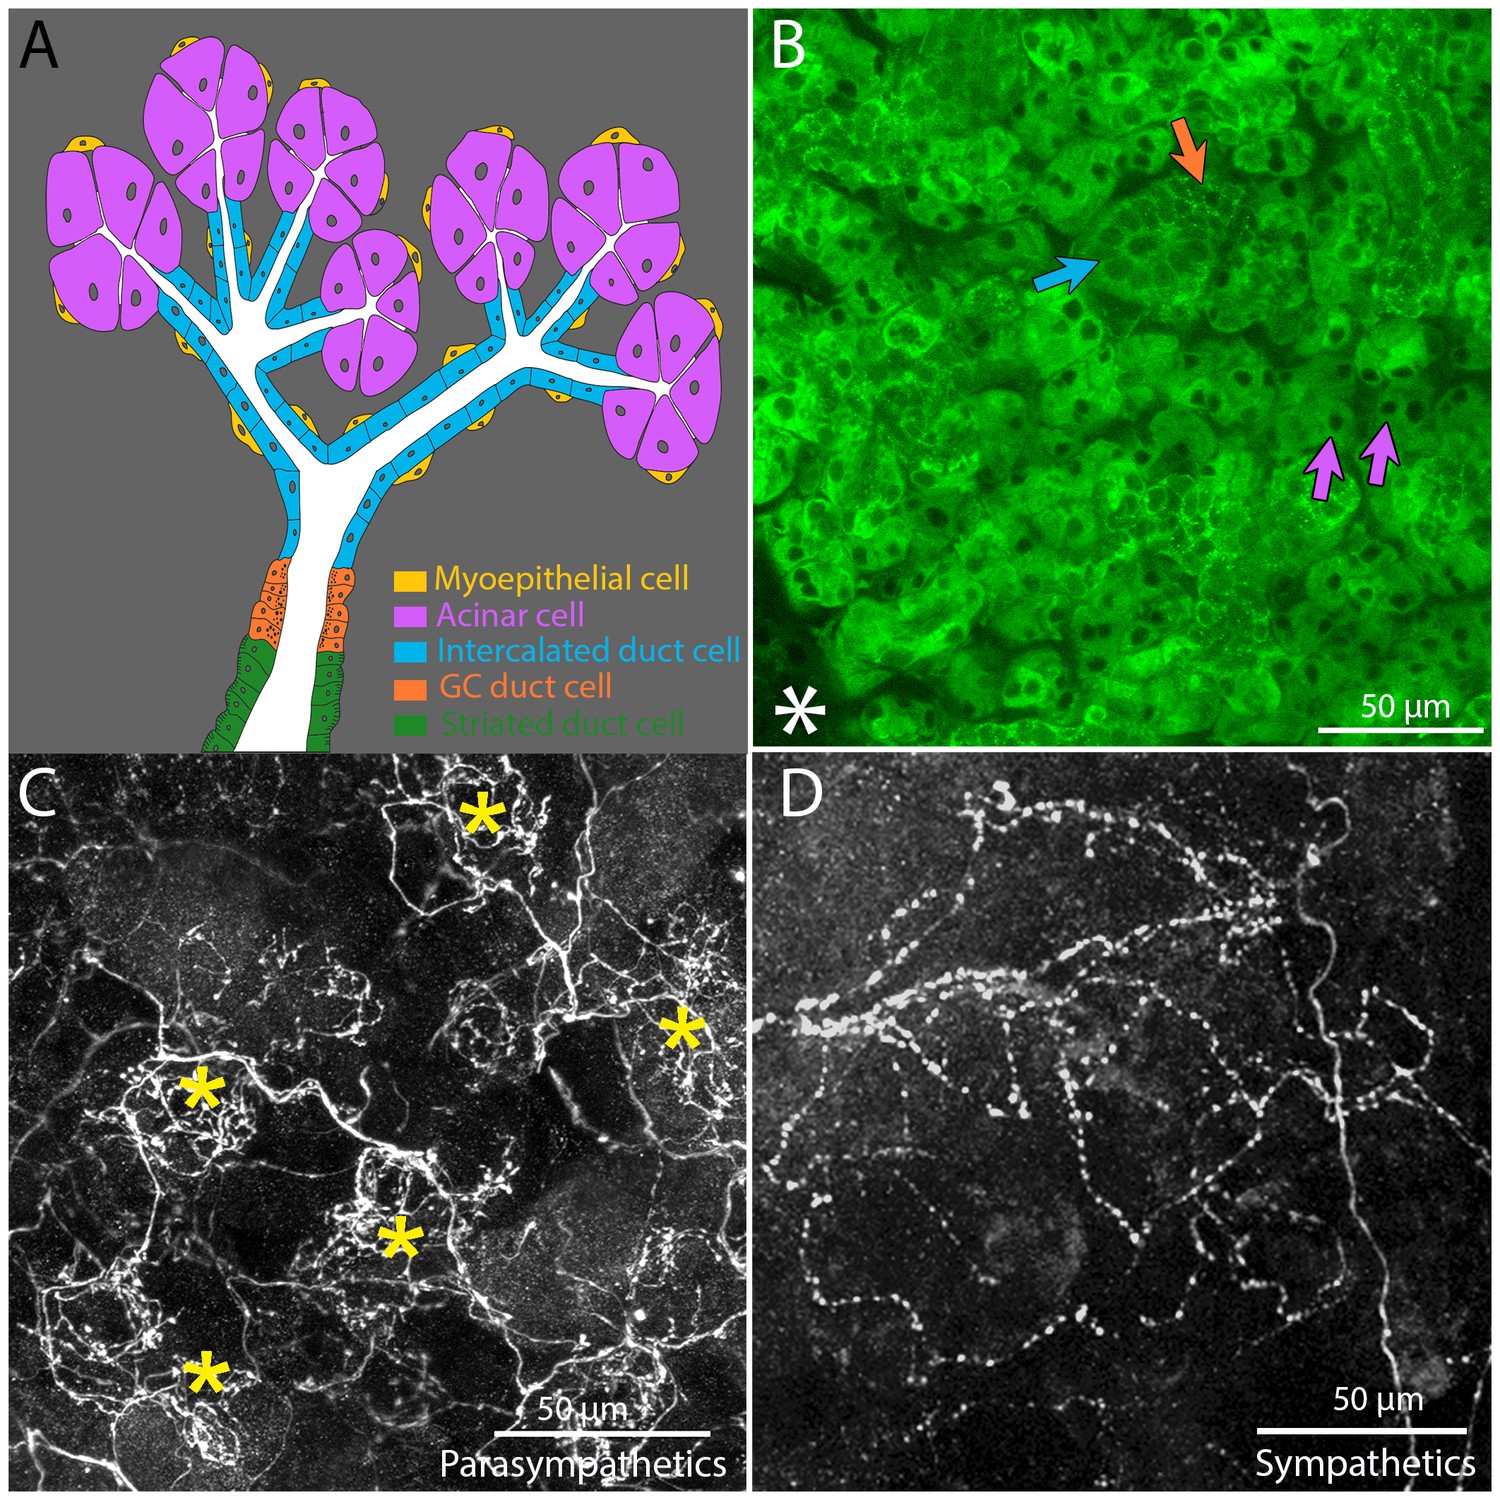
Architecture and innervation of the mouse submandibular gland.
(A) Diagram showing acinar cells (lavender) that secrete saliva into the lumens (white) of intercalated ducts (blue), which converge onto a granular convoluted duct (orange) which empties into a striated duct (green). Myoepithelial cells (yellow) are adjacent to acinar cells and intercalated duct cells. (B) Confocal image of an optical section of a P21 mouse submandibular gland stained with FITC-conjugated hairy vetch lectin (green). The majority of the cells (those with dark nuclei) are serous acinar cells (purple arrows). Intercalated duct cells (blue arrow) and granular convoluted duct cells (orange arrow) are also visible. The nearby sublingual gland (lower left asterisk), which is composed of mucinous cells, are only weakly labeled by this lectin. (C) The terminal axonal arbors of adult parasympathetic postganglionic axons (from Thy1 CFP-D mouse line), showing multiple basket-like structures (asterisks) each with dense agglomerations of boutons. (D) Sympathetic postganglionic axons (Thy1 YFP16) exhibit sparse terminal arbors with multiple varicosities rather homogenously distributed, resulting in a punctate appearance.
Figure 2
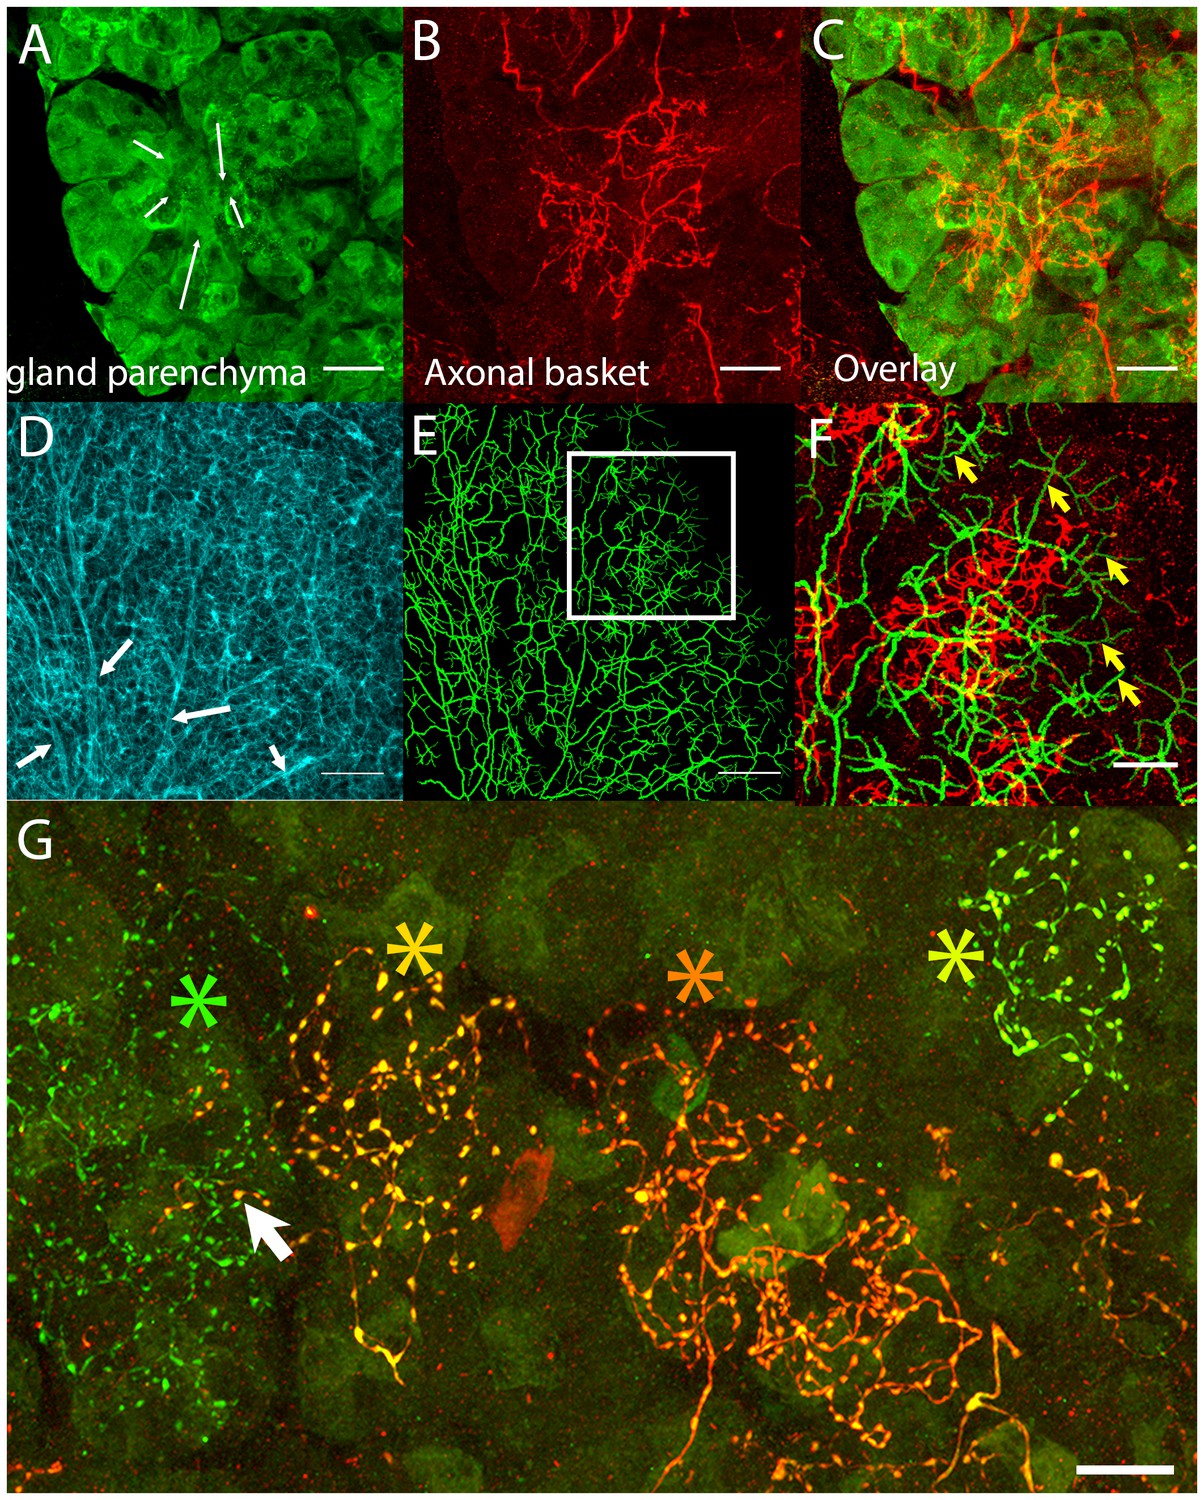
Postganglionic parasympathetic axons are associated with intercalated ducts.
(A–C) Confocal stack showing that the basket endings of parasympathetic axon terminals (red, see also Figure 1C) are centered on the intercalated ducts and spread only sparsely to the nearby acinar cells (gland parenchyma labeled green with lectin- see Figure 1B). The direction of the salivary flow within the intercalated duct is illustrated by arrows. (D–F) Evidence showing that parasympathetic axons predominantly innervate intercalated ducts. The entire luminal surface was stained (with anti-ZO1, cyan, D, arrow shows major duct branches) and traced (green, E). The distal luminal surface could be divided into thin and thick regions that corresponds to interstitial spaces between the acinar cells and regions enclosed by intercalated duct cells, respectively (arrows in F point to thin regions) (see Figure 1A). Duct tracing superimposed on the axonal terminal arbors (red, F) shows the selective association of parasympathetic axons with intercalated ducts. (G) Labeling of four different parasympathetic axonal terminal arbors with different fluorescent colors (using Brainbow AAV injection) shows that individual baskets of different axons segregate onto non-overlapping regions (yellow green, dark orange, orange and green asterisks). Some apparent overlap is actually segregated in the depth axis (arrow). Scale bars: (A-C and F–G) 20 µm. (D–E) 50 µm.
Figure 3

Serial electron microscopy reconstruction of a parasympathetic terminal arbor in the gland shows segregation and primary innervation of myoepithelial cells.
(A) The salivary gland is mostly comprised of acinar cells with large secretory vacuoles. These cells are labeled lavender in this panel and in the 3-dimensional reconstruction (panel E). Scale bar: 5 µm. (B) The salivary outflow leaves the gland through the lumens of ducts (labeled white in this panel and the 3D reconstruction). The ducts are surrounded by intercalated duct cells (labeled light blue). Scale bar: 5 µm. (C) Myoepithelial cells (beige) have complex shapes sending branches around both duct and acinar cells. A small cross-section of an axon (green) and acinar cell (lavender) were also present in this panel. Scale bar: 5 µm. (D) Axonal varicosities (green) filled with mitochondria and synaptic vesicles (arrows) directly contact myoepithelial cells (beige) and more rarely acinar cells (lavender). This synaptic bouton is shown by arrow in panel E. Scale bar: 1 µm (E) Rendering of the reconstructed image data shows that all the vesicle laden boutons in this region derive from a single axon that has elaborated a basket-like terminal arbor (green) with multiple varicosities each containing clusters of synaptic vesicles (bluish purple). In the immediate vicinity are several intercalated duct cells (light blue), acinar cells (lavender), and myoepithelial cells (beige). The duct’s lumen is white. There is one additional short axonal segment (light yellow, red arrrow), whose origin is not known. Synaptic vesicles were rendered three times larger than their original size for clarity.
Figure 4
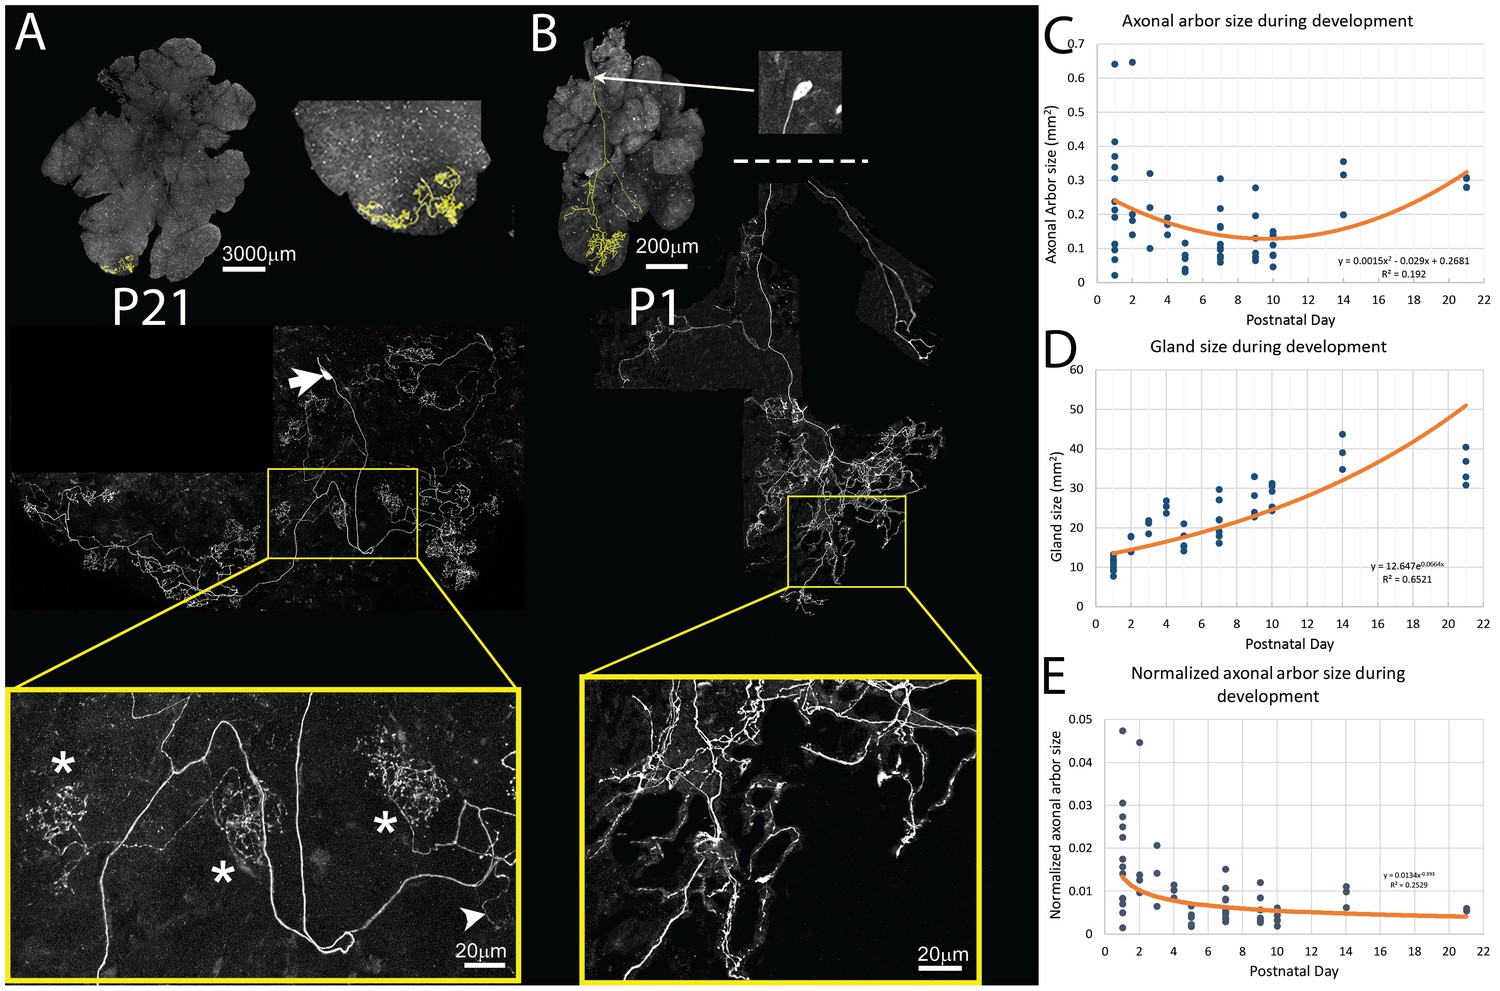
Pruning of postganglionic parasympathetic axonal arbors during postnatal development.
(A) Top left: A single P21 postganglionic axon (Thy1 YFP-H, yellow) superimposed on an image of the entire gland (grey). This region is magnified in the top right image. The axonal arbor occupies only a small area of the gland. Middle: A further magnified view shows the axon’s projection and its cell soma (lacking any dendrites, arrow). Bottom: The boxed region (yellow) shows that the arbor is composed of dense basket shaped terminal branches (*’s show three), plus a few unbranched non-basket endings (arrowhead). (B) Top: In contrast to the arbors at older ages, at P1 single axons innervate a larger proportion of the gland (yellow). Middle: Shown is the entire terminal arbor of the axon and it soma that is in this case located a far distance away on the salivary duct. Bottom: The boxed region shows a magnified view of part of the terminal arbor. Unlike older mice, the parasympathetic arbors at this age show no baskets but instead diffuse axon branches that cover considerable amounts of the gland’s territory (C–E): Quantitative analysis of axonal arbor size as a function of age in many samples collected during the first three weeks of postnatal life. The sample size required to acquire sufficient statistical power is based upon the initial observation that normalized axonal arbor size is about three times larger in neonates compared to that in adults. (C) The absolute axonal arbor size gradually decreased from P1 to P10, followed by a gradual increase to reach the adult sizes. (D) During the same period, the size of the gland grew progressively. To accommodate sample variations, the calculated gland size based on the fitted curve is used in subsequent analysis. (E) Normalizing axonal arbor size against the gland size indicates that the axonal arbor size relative to the gland size decreases from P1 to P10 and then stabilizes thereafter.
Figure 5
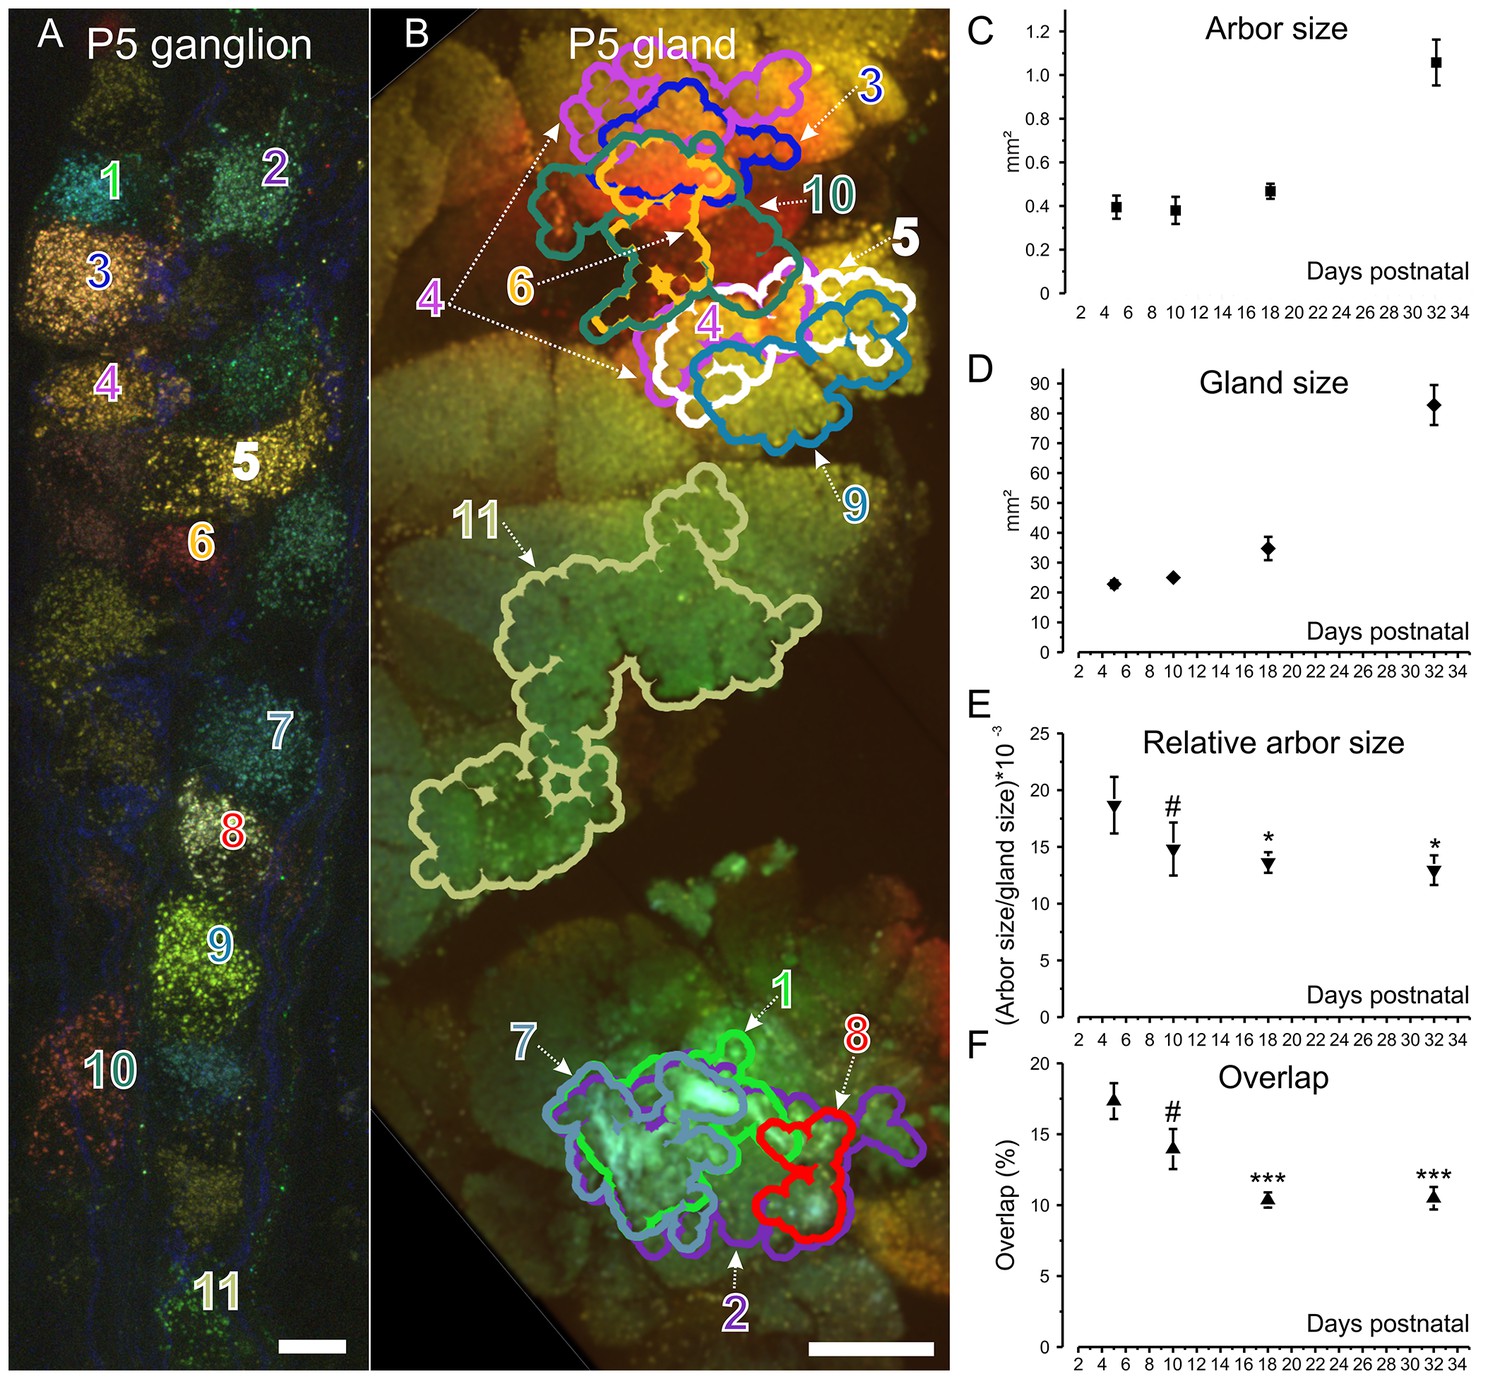
Retrograde labeling technique corroborates pruning and shows progressive segregation postganglionic parasympathetic axon arbors.
(A) Ganglion cells in a P5 submandibular ganglion that were retrogradely labeled following injection of 4 different colored fluorescent labels into nearby regions of the gland B. Scale bar = 10 µm. Eleven of these cells were analyzed (B) Based on the color of the retrogradely labeled vesicles, the axonal arbor projections of the eleven cells in panel A are shown. Some arbors that appear to overlap in this two-dimensional projection, do not overlap in the full three-dimensional image. Scale bar = 500 µm. (C) Average axon arbor area at four postnatal developmental ages. (D) The average gland area at four postnatal developmental ages. (E) The relative arbor sizes normalized to gland sizes demonstrate a significant drop in the area between p5 compared to p18 and p32. However, there was no significant change between P10 and older ages indicating that axon arbors stop decreasing in size after P10. One way ANOVA; n = 192 neurons. (F) Arbors also are significantly more overlapped in early life and become less so after P10. One way ANOVA; n = 2213 pairs. *= p<0.05; *** = p<0.001. Arbor overlap is not associated with the position of the cell bodies. For example, cells 6 and 10 overlap extensively in the gland, but their cell bodies are not adjacent (A and B). Conversely adjacent cells often project to non-overlapping areas (cell 8 and 9 in A and their projects in B).
Figure 6

Maturation of parasympathetic postganglionic arbors in the submandibular gland mostly during the first postnatal week.
(A) A single P1 ganglion cell with small dendritic branches and a large diffusely branched axon that possessed no basket endings (from Thy1 YFP-H line). Orange box is a magnified view of one portion of the arbor (B) A single P7 ganglion cell with no dendritic branches and an axon that has an organization similar to arbors in adult animals with basket terminals (orange arrows and box; inset shows magnified view of the box). As in adults, there are a few non-basket relatively unbranched endings (blue arrows and box; inset shows magnified view of the box) (C) Graph showing a decrease in non-basket endings (green) and increase in basket terminals (red) as a function of age. Note the number of non-basket terminals at P1 was greater than the total number of terminals at P21. (D) Histogram showing the greater complexity (higher branch order) of terminal arbors at P7 compared to P1 (n = 3 for each). Representative arbors from P1 and P7 are also shown in a schematized way to see branch order in the vertical axis.
Figure 7
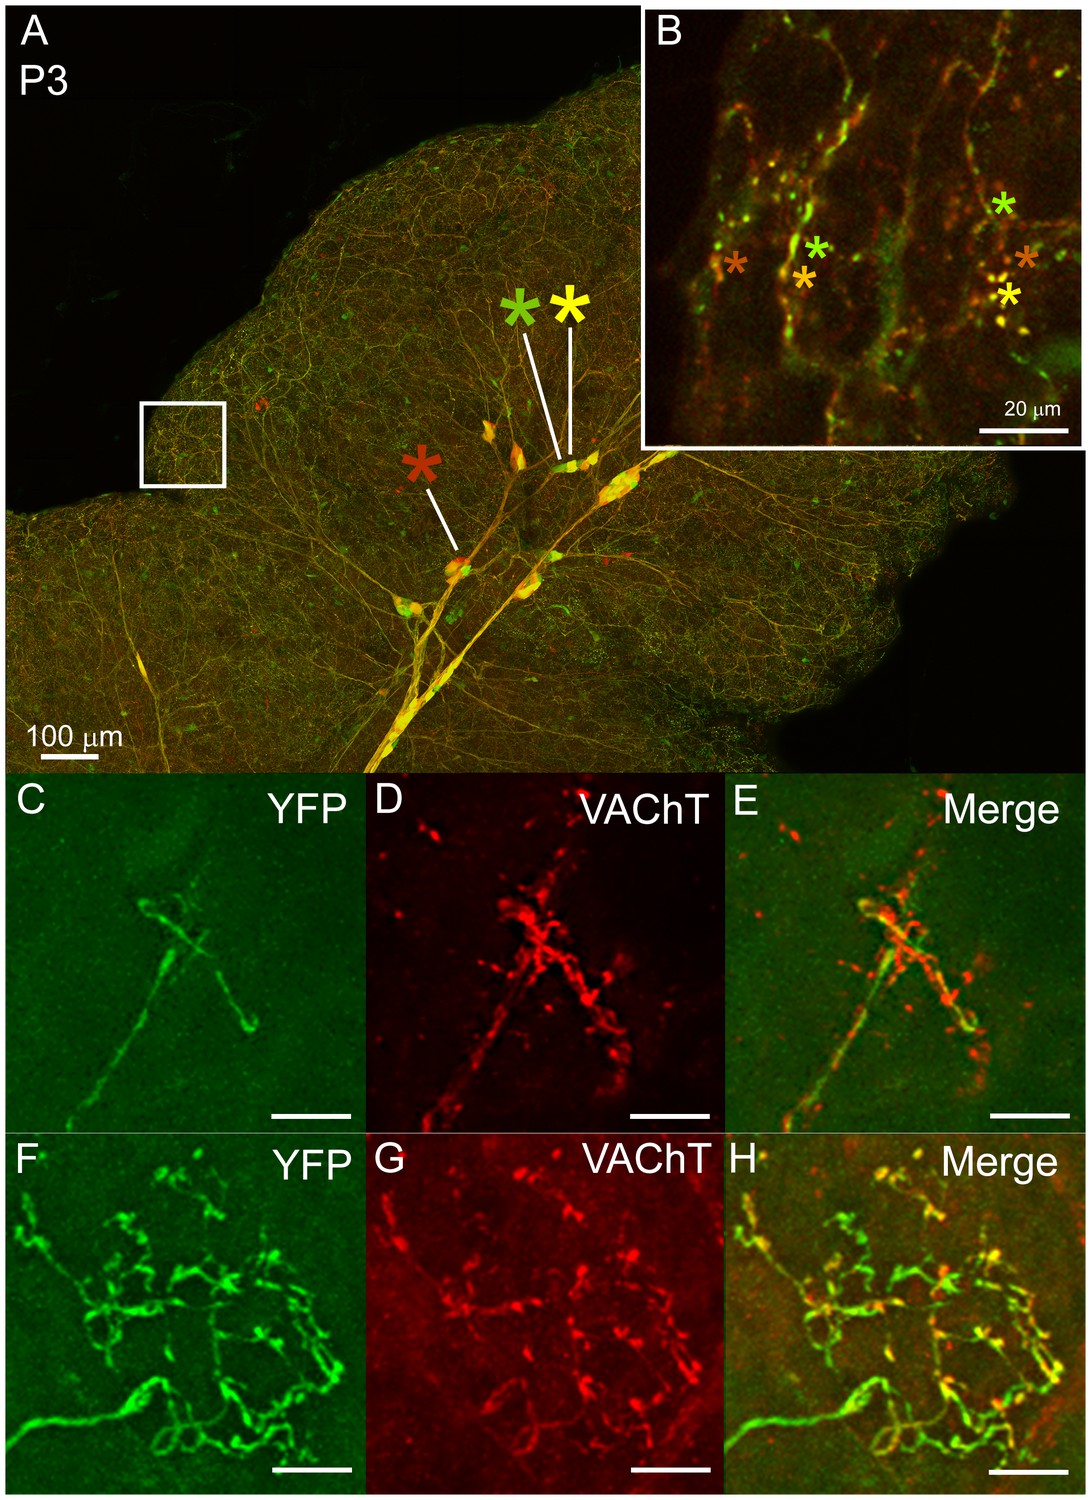
Multiple to single innervation of the submandibular gland.
(A–B) Low magnification view of the parasympathetic innervation to P3 submandibular gland labeled by intra-uterine multicolor fluorescent protein AAV injection. The inset (B) and (C) shows an optical section through the gland where boutons of neurons expressing different color combinations of red and green fluorescent proteins are intermixed. The mixing contrasts with the segregation seen at later ages (see Figure 2). (C) Non-basket terminal in a P3 axon. (D) This tissue was also immuno-labeled for VAChT to reveal all the cholinergic parasympathetic terminals in the gland (red). (E) The non-basket terminal overlaps with other axons as demonstrated by the presence of red fluorescence that was not contained in the YFP labeled axon. (F) Occasional basket-shaped terminals are present in YFP-labeled P3 axonal arbors. In this case a branch of the ganglion cell axon (entering panel from the lower left) terminated in a basket-shaped arbor. (G) This tissue was also immuno-labeled for VAChT to reveal all the cholinergic parasympathetic terminals in the gland (as in D) (H) There was no evidence of any other parasympathetic axon within the region of the basket-shaped arbor because all the VAChT labeling was superimposed on the YFP labeled axon. Hence this terminal was segregated from other parasympathetic axons. Scale bar (A) 100 µm, (B) 20 µm. (C–H) 10 µm.
Figure 8
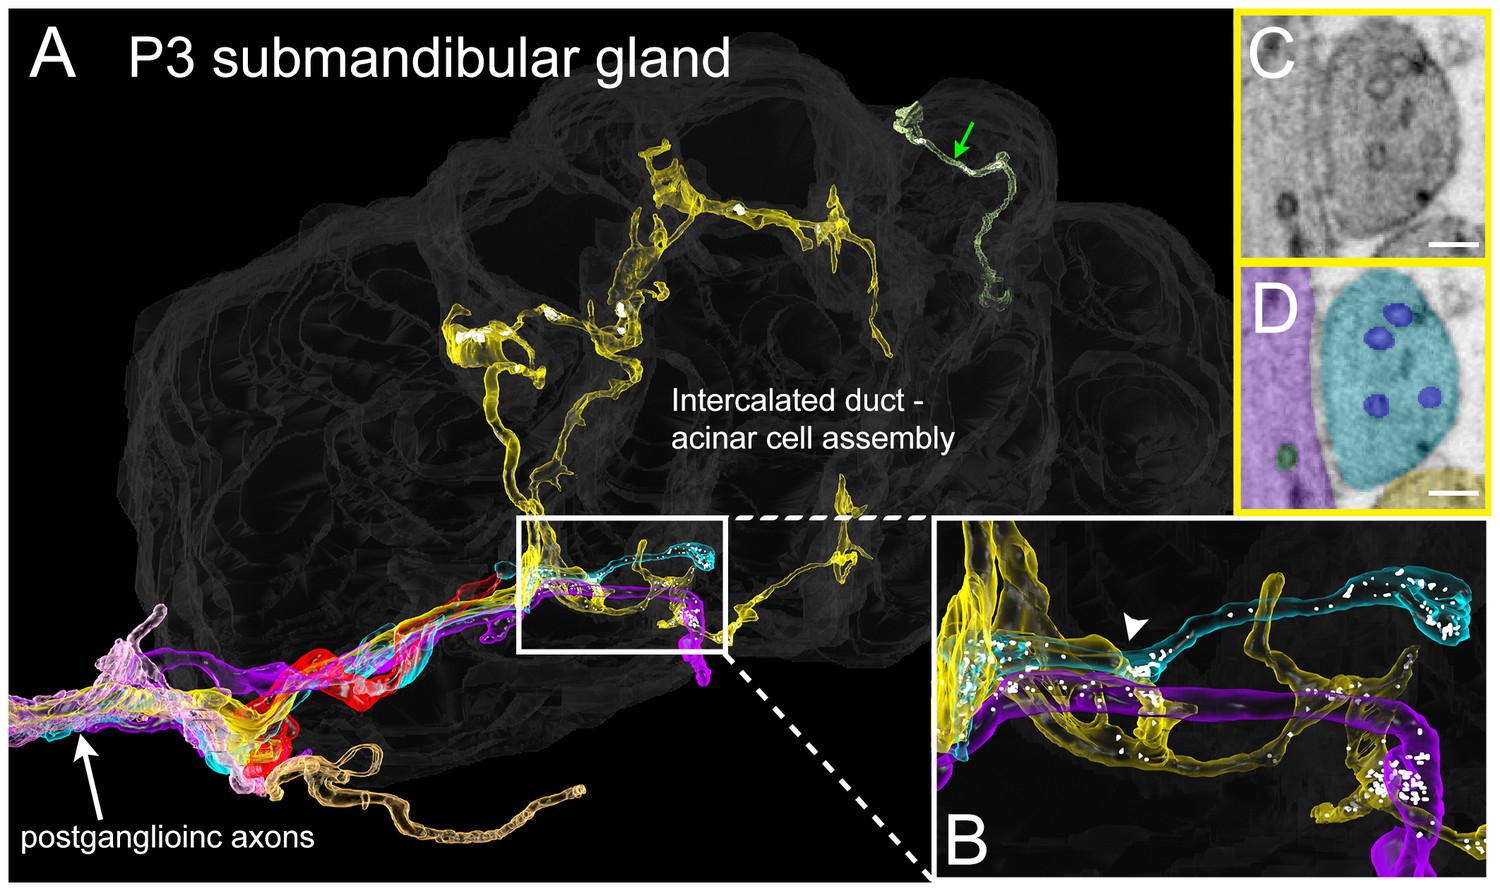
Serial electron microscopy reconstruction of P3 submandibular gland.
(A) Six axons (white arrow) approach the vicinity of an intercalated duct – acinar cell assembly (rendered in dark gray). Three of these axons (cyan, yellow and violet) elaborate terminal arbors with synaptic vesicles in the volume. An additional axonal branch can be seen entering from the other end of the gland assembly (green arrow). (B) Inset in A magnified, showing multiple nearby branches containing vesicles. Both of the vesicle-containing sites are en passant boutons (C–D) A single electron microscopy image from the area depicted by an arrowhead in B, showing several synaptic vesicles in different axons (original image shown in C, pseudo-colored in D). Scale bar: C-D: 100 nm.
Figure 9

Maturation of parasympathetic preganglionic arbors in postnatal life.
(A) Confocal montaged reconstruction of an adult preganglionic axon that exited the lingual nerve to innervate submandibular ganglia. The preganglionic axon bifurcates to give rise to terminal branches that make synaptic contacts (basket structures) on ~25 ganglion neurons (inset) within two ganglion cell clusters. Occasionally non-basket terminals are present (arrow). Dotted circles represent cells that are innervated by other axons (not innervated by the labeled axon). (B) In contrast, a preganglionic neural unit from a P3 mouse branched extensively to come into close contact with most of the ganglion cells within the ganglia to which it projects.
Figure 10
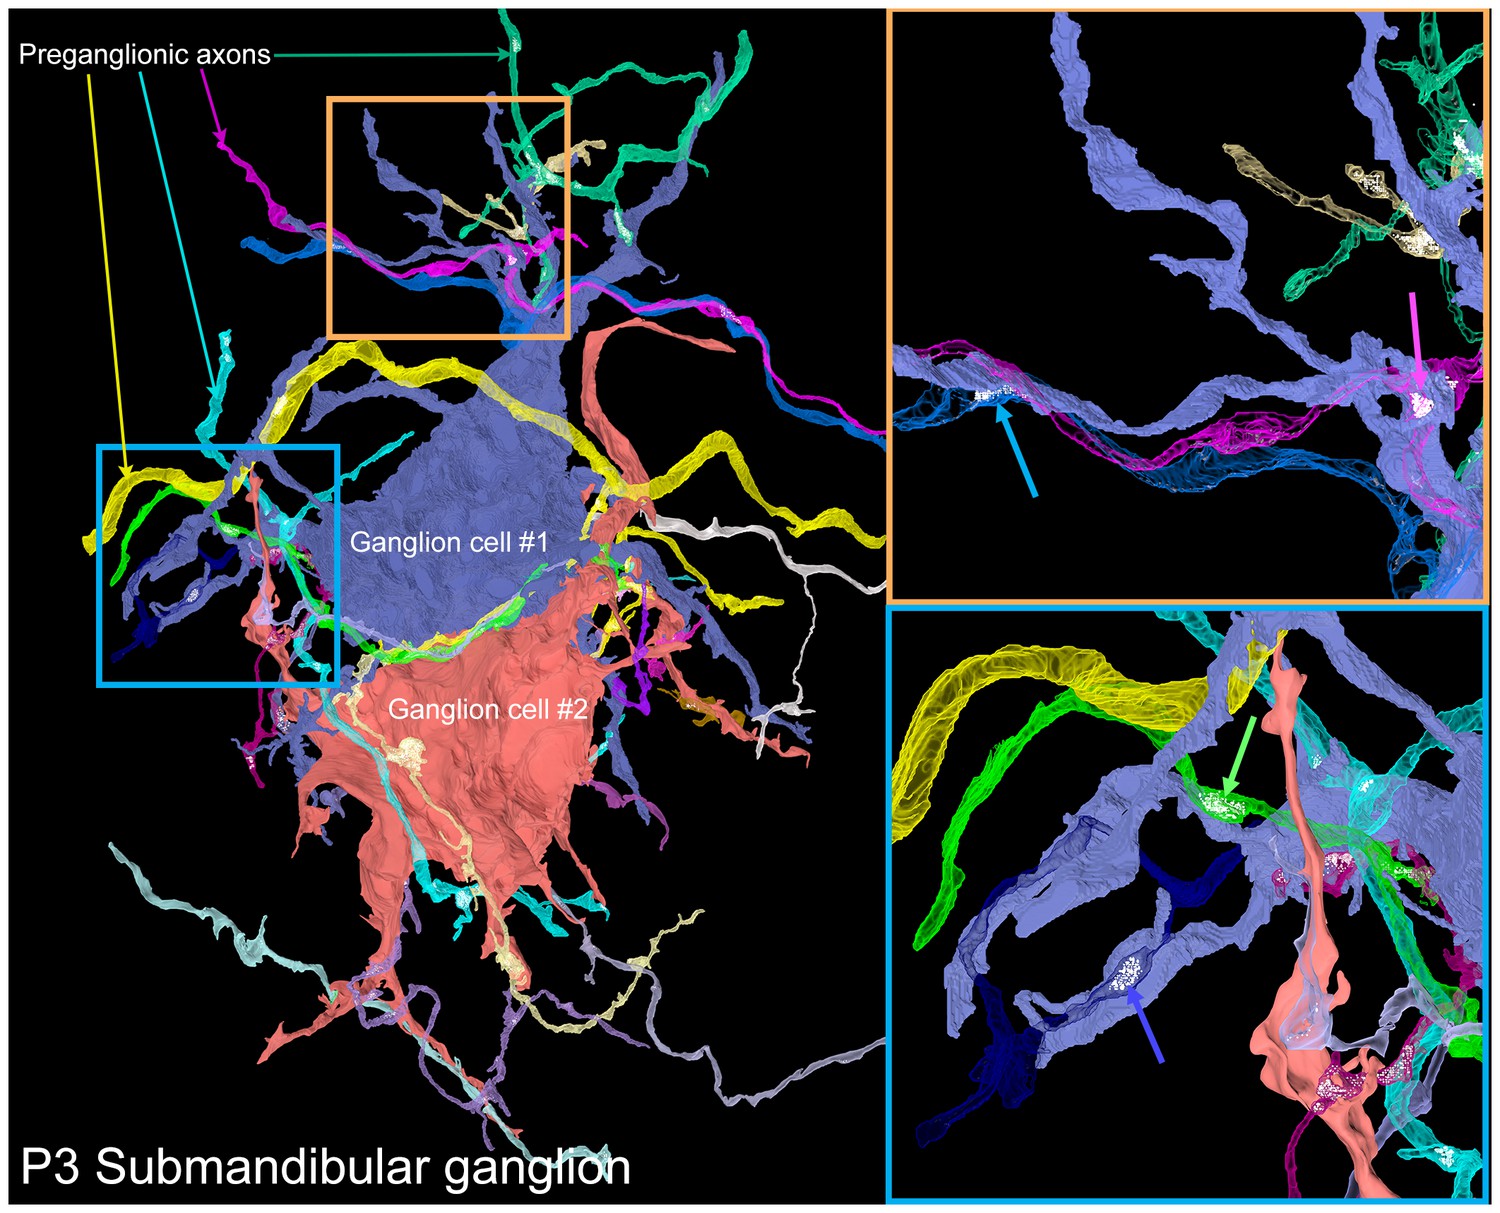
A serial electron microscopy reconstruction of two P3 submandibular ganglion cells.
Two adjacent ganglion neurons (blue and red) both had multiple dendrites at this young age. Multiple preganglionic axons innervate each of these cells. In some cases, different axons innervate the same dendrite (orange inset, blue and pink arrows), and sometimes different dendrites (blue inset, blue and green arrows).
Figure 11

Two alternative ways neural circuits could reach the mature state in a developing efferent pathway.
Our evidence suggests that at birth ganglion cells are multiply innervated by preganglionic axons from the brainstem and gland intercalated duct – acinar cell assemblies are multiply innervated by ganglion cells. We assume that the brainstem neurons have different firing patterns at birth (hence presented in blue and red, respectively). The activity patterns of each ganglion cell at birth are thus different because they are each multiply innervated by preganglionic axons that have different synaptic strengths (hence at birth the ganglion cells are each shown in a different color). Analogously, because the gland targets are also multiply innervated, their activity patterns are each different (presented here in different colors). During early postnatal life, these axonal projections begin to be trimmed away. (Left) If synaptic pruning occurred earlier in the ganglion than in the gland (a central to peripheral sequence of maturation) then many ganglion cells would come to have identical activity patterns (by virtue of being singly innervated by the same preganglionic neuron; represented in blue and red, respectively) at a time when their target gland cells are still multiply innervated. Activity dependent competition in the gland could eliminate asynchronous inputs to gland cells (i.e. red and blue inputs to the same target) but could not lead to activity dependent competition between axons driven by the same preganglionic input (i.e. red vs. red or blue vs. blue inputs). This would prevent the emergence of singly innervated gland targets (the gland cells would either have two blue inputs or two red inputs but not only one axon). (Right) However because gland targets are ultimately singly innervated, it seems more likely that the maturation sequence starts in the gland and then progresses centrally. In this alternative, synapse elimination in the gland occurs first, resulting in activity dependent pruning of the inputs of all but one ganglion cell on each gland target. This simplification of circuitry in the gland is then followed by a reorganization and simplification of innervation in the ganglion. This peripheral to central maturation could also extend further upstream into the CNS. Singly innervated ganglion cells and gland cells in the peripheral to central scheme (right) would result in a substantial reduction in axonal branches when compared to the central to peripheral scheme with identical activation precision from the brainstem (left; see text for details).
Videos
Video 1
Brainbow labeling of postganglionic axons in adult submandibular gland.
https://doi.org/10.7554/eLife.23193.004
Video 2
3D rendering of serial section electron microscopy dataset of adult submandibular gland.
https://doi.org/10.7554/eLife.23193.006
Video 3
3D rendering of serial section electron microscopy dataset of P3 submandibular gland.
https://doi.org/10.7554/eLife.23193.012
Video 4
3D rendering of serial section electron microscopy dataset of P3 submandibular ganglion.
https://doi.org/10.7554/eLife.23193.015Download links
A two-part list of links to download the article, or parts of the article, in various formats.
Downloads (link to download the article as PDF)
Open citations (links to open the citations from this article in various online reference manager services)
Cite this article (links to download the citations from this article in formats compatible with various reference manager tools)
Similar synapse elimination motifs at successive relays in the same efferent pathway during development in mice
eLife 6:e23193.
https://doi.org/10.7554/eLife.23193


