Prosurvival long noncoding RNA PINCR regulates a subset of p53 targets in human colorectal cancer cells by binding to Matrin 3
- National Cancer Institute, National Institutes of Health, United States
- University of Illinois at Urbana-Champaign, United States
- National Library of Medicine, National Institutes of Health, United States
- National Institute of Child Health and Human Development, National Institutes of Health, United States
- Ionis Pharmaceuticals, United States
- University of Minnesota, United States
Abstract
Thousands of long noncoding RNAs (lncRNAs) have been discovered, yet the function of the vast majority remains unclear. Here, we show that a p53-regulated lncRNA which we named PINCR (p53-induced noncoding RNA), is induced ~100-fold after DNA damage and exerts a prosurvival function in human colorectal cancer cells (CRC) in vitro and tumor growth in vivo. Targeted deletion of PINCR in CRC cells significantly impaired G1 arrest and induced hypersensitivity to chemotherapeutic drugs. PINCR regulates the induction of a subset of p53 targets involved in G1 arrest and apoptosis, including BTG2, RRM2B and GPX1. Using a novel RNA pulldown approach that utilized endogenous S1-tagged PINCR, we show that PINCR associates with the enhancer region of these genes by binding to RNA-binding protein Matrin 3 that, in turn, associates with p53. Our findings uncover a critical prosurvival function of a p53/PINCR/Matrin 3 axis in response to DNA damage in CRC cells.
https://doi.org/10.7554/eLife.23244.001eLife digest
Though DNA contains the information needed to build the proteins that keep cells alive, only 2% of the DNA in a human cell codes for proteins. The remaining 98% is referred to as non-coding DNA. The information in some of these non-coding regions can still be copied into molecules of RNA, including long molecules called lncRNAs. Little is known about what lncRNAs actually do, but growing evidence suggests that these molecules are important for a number of vital processes including cell growth and survival.
When the DNA in an animal cell gets damaged, the cell needs to decide whether to pause growth and repair the damage, or to kill itself if the harm is too great. One of the best-studied proteins guiding this decision is the p53 protein, which increases the number of protein-coding genes needed to carry out either option in this decision. That is to say that, p53 regulates the genes needed to kill the cell and the genes needed to temporarily pause its growth and repair the damage, which instead keeps the cell alive. So, how does the p53 protein guide the decision, and are lncRNA molecules involved?
Using human colon cancer cells, Chaudhary et al. now report that when DNA is damaged, the levels of a specific lncRNA increase 100-fold. Further experiments showed that this lncRNA – named PINCR, which refers to p53-induced noncoding RNA – promotes the survival of cells. Chaudhary et al. showed that PINCR molecules do this by recruiting a protein called Matrin 3 to a certain region in the DNA called an enhancer and then links it to promoter region in the DNA of specific genes that temporarily pause cell growth but keep the cell alive. This in turn activates these ‘pro-survival genes’. In further experiments, when the PINCR molecules were essentially deleted, p53 was not able to fully activate these genes and as a result more of the cells died.
Together these findings increase our knowledge of how lncRNAs can work, especially in the context of DNA damage in cancer cells. A next important step will be to uncover other roles for the PINCR molecule in both cancer and healthy cells.
https://doi.org/10.7554/eLife.23244.002Introduction
The tumor suppressor p53 functions as a sequence-specific master regulatory transcription factor that controls the expression of hundreds of genes (Riley et al., 2008; Vogelstein et al., 2000) and is mutated at a high frequency in human cancer types (Oren, 1992; Vogelstein et al., 2000; Vousden and Lane, 2007). Although p53 exerts its tumor suppressor effects by regulating a wide variety of cellular processes, it has context-dependent functions (Aylon and Oren, 2016; Vousden, 2000; Zilfou and Lowe, 2009) that are determined by various factors including cell-type, genetic background of the cell, extracellular environment, and the nature and duration of stress. Depending on the cellular context, p53 can have opposite effects on cell survival, cell migration, differentiation and metabolism (Aylon and Oren, 2016; Kruiswijk et al., 2015; Zilfou and Lowe, 2009).
Consistent with these pleiotropic effects of p53, the expression of genes that have opposing effects on the above-mentioned processes are regulated by p53 (Aylon and Oren, 2016; Riley et al., 2008). For example, in the context of DNA damage, p53 induces the expression of prosurvival genes such as CDKN1A (p21), 14-3-3σ and BTG2 (Chan et al., 1999; Polyak et al., 1996; Rouault et al., 1996) that cause cell cycle arrest, as well as proapoptotic genes such as PUMA, BAX and NOXA (Riley et al., 2008) that cause cell death. Interestingly, these prosurvival and proapoptotic genes are all upregulated by p53 in a cell regardless of the effect of p53 on cellular outcome. Therefore, it is important to investigate the function of a p53 target gene in the appropriate cellular context.
While the protein-coding genes regulated by p53 have been extensively studied and we and others have identified critical roles of microRNAs (miRNAs) in the p53 pathway (Chang et al., 2007; Hermeking, 2012; Lal et al., 2011; Raver-Shapira et al., 2007), the function of the newly discovered long noncoding RNAs (lncRNAs) in p53 signaling remains largely unknown. LncRNAs are transcripts > 200 nucleotides (nt) long that lack a functional open reading frame. Growing evidence suggests critical roles of lncRNAs in multiple cellular processes including differentiation, dosage compensation, genomic stability, metabolism, metastasis and DNA repair (Arun et al., 2016; Dey et al., 2014; Fatica and Bozzoni, 2014; Lee, 2012; Lee et al., 2016; Ling et al., 2013; Mueller et al., 2015; Redis et al., 2016; Sharma et al., 2015; Tripathi et al., 2013). Some p53-regulated lncRNAs including lincRNA-p21, PANDA, PINT, LED, NEAT1 and DINO have been shown to function as downstream effectors of p53 (Adriaens et al., 2016; Blume et al., 2015; Dimitrova et al., 2014; Huarte et al., 2010; Hung et al., 2011; Léveillé et al., 2015; Marín-Béjar et al., 2013; Schmitt et al., 2016). However, the function and mode of action of most p53-regulated lncRNAs has yet to be elucidated.
In this study, we focused on a previously uncharacterized lncRNA that we named PINCR (p53-induced noncoding RNA). We show that during DNA damage, PINCR has a context-dependent function. RNA pulldowns from cells expressing endogenous PINCR fused to an S1-RNA aptamer show that PINCR binds to the RNA-binding protein Matrin 3 to regulate the induction of a subset of prosurvival p53 targets by associating with the enhancers of these genes via a Matrin 3-p53 complex. Our results identify PINCR as a lncRNA that functions as a context-dependent prosurvival gene in the p53 pathway.
Results
Identification of PINCR, a p53-regulated lncRNA
To identify lncRNAs regulated by p53 in multiple cell lines, we performed microarray analysis (Affymetrix HT2.0) from three colorectal cancer (CRC) cell lines (HCT116, RKO and SW48) following activation of p53 with Nutlin-3 (Figure 1—figure supplement 1A and Figure 1—figure supplement 1—source data 1), a pharmacological inhibitor of MDM2. Using a cut-off of 1.50-fold change, 66 transcripts were upregulated in all three lines (Figure 1—figure supplement 1B,C and Supplementary file 1). Forty-eight of the 66 transcripts were also identified in a recent p53 GRO-seq study in HCT116 cells (Allen et al., 2014) indicating that they may be direct p53 targets. The 66 transcripts included several known p53 targets including BTG2, BAX, CDKN1A (p21), GADD45A, MDM2 and RRM2B. Four out of 66 transcripts were annotated lncRNAs (Supplementary file 2).
Among the four lncRNAs, RP3-326I13.1, a ~2.2 kb long spliced intergenic lncRNA with unknown function, transcribed from the X-chromosome, was strongly induced upon p53 activation (Supplementary file 2). We validated this result by quantitative reverse transcription PCR (qRT–PCR) after Nutlin-3 treatment (Figure 1A). Due to this strong induction upon p53 activation, we named this lncRNA PINCR. Notably, although this lncRNA was also strongly and directly upregulated by p53 upon ectopic overexpression of p53 in a mutant p53-expressing CRC line (Hünten et al., 2015), its function has not been elucidated. Therefore, we decided to investigate the role of PINCR in the p53 network.
Figure 1 with 6 supplements see all
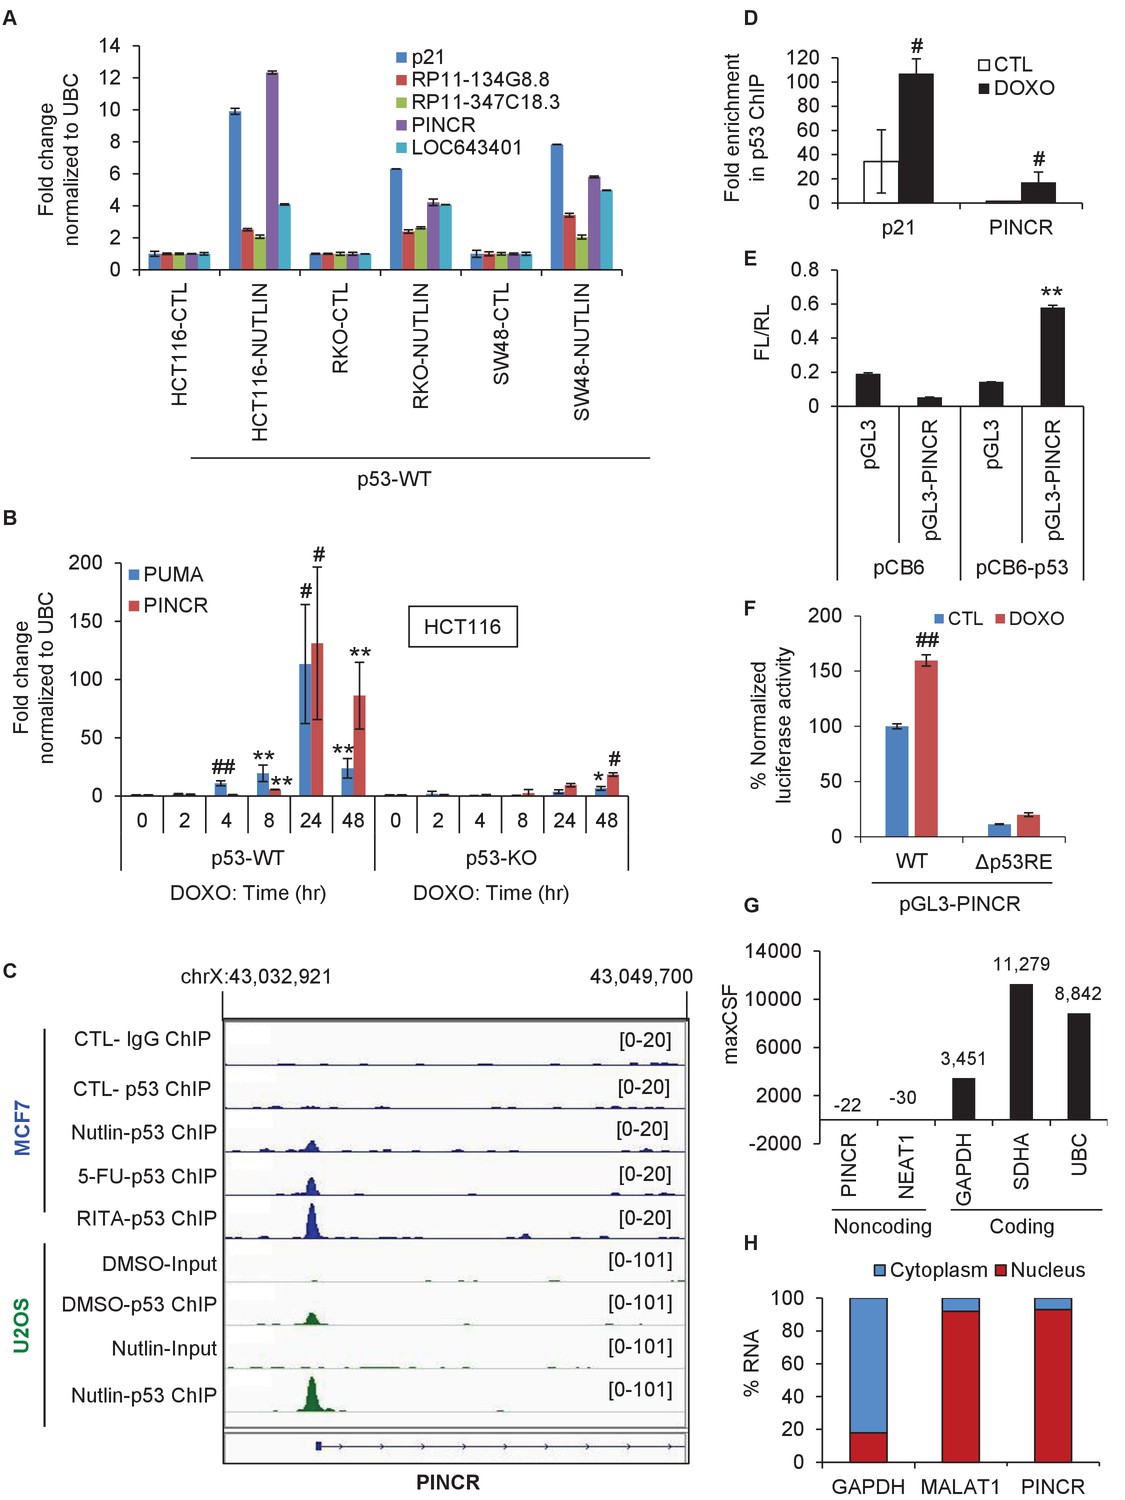
PINCR is a nuclear lncRNA directly induced by p53 after DNA damage.
(A) qRT-PCR analysis from HCT116, SW48 and RKO cells untreated or treated with Nutlin-3 for 8 hr. Error bars represent SD from two independent experiments. (B) qRT-PCR analysis for PINCR and the known p53 target PUMA from isogenic p53-WT and p53-KO HCT116 cells untreated or treated with DOXO for the indicated times. (C) Snapshot of p53 ChIP-seq data of the PINCR promoter from MCF7 and U2OS cells untreated or treated with Nutlin or 5-FU or RITA. (D) HCT116 cells were untreated or treated with DOXO for 16 hr and qPCR using primers spanning the p53RE of p21 and PINCR was performed from Input and p53-ChIP. (E) HCT116 cells were co-transfected for 48 hr with pGL3 or pGL3 containing the PINCR promoter, and pCB6 or pCB6-p53. Luciferase assays were performed using pRL-TK as internal control. (F) Luciferase assays were performed from untreated (CTL) or DOXO-treated HCT116 cells co-transfected for 48 hr with the internal control pRL-TK and pGL3 containing the PINCR wild-type (WT) promoter or pGL3 containing the PINCR promoter in which the p53RE was deleted (△p53RE). (G) Maximum CSF scores of PINCR as well as other coding and noncoding RNAs determined by analysis with PhyloCSF. (H) qRT-PCR analysis from nuclear and cytoplasmic fractions of DOXO-treated HCT116 cells; the cytoplasmic GAPDH mRNA and the nuclear lncRNA MALAT1 were used as controls. Error bars in B, D-F represent SD from three independent experiments. #p<0.01; **p<0.005; ##p<0.001.
PINCR is a nuclear lncRNA directly regulated by p53
Given the well-established role of p53 after DNA damage, we next assessed changes in PINCR expression during DNA damage induced by Doxorubicin (DOXO) in isogenic p53 wild-type (p53-WT) and p53 knockout (p53-KO) HCT116 and SW48 cells. The final concentration of DOXO in this and all subsequent experiments was 300 nM, unless stated otherwise. The known p53 target PUMA (Nakano and Vousden, 2001) was used as a positive control. Although PINCR was almost undetectable at the basal level, after DNA damage it was significantly induced as early as 8 hr after DOXO treatment and was induced >100 fold after 24 hr, in a p53-dependent manner in both lines (Figure 1B and Figure 1—figure supplement 2A).
To determine if PINCR is a direct target of endogenous p53, we first utilized publicly available p53 ChIP-seq (Chromatin immunoprecipitation sequencing) data (Menendez et al., 2013; Nikulenkov et al., 2012). Upon p53 activation, we observed a single p53 ChIP-seq peak in a region ~118 bp upstream of the first exon of PINCR in MCF7 (breast cancer) and U2OS (osteosarcoma) cells (Figure 1C and Figure 1—figure supplement 2B). We validated this result in HCT116 cells by ChIP-qPCR (Figure 1D). We next inserted a ~2 kb region of the PINCR promoter into a promoterless luciferase reporter vector (pGL3) and co-transfected this construct in HCT116 cells along with a mammalian expression vector (pCB6) or pCB6 overexpressing p53 (pCB6-p53). We found that the PINCR promoter drives luciferase expression upon p53 overexpression (Figure 1E). Deletion of the p53-response element (p53RE) in the PINCR promoter resulted in significant decrease in luciferase activity (Figure 1F). These results suggest that PINCR is a direct target of p53.
A detailed subsequent analysis of PINCR revealed many features of this lncRNA: (1) PINCR is a noncoding RNA because its coding potential was comparable to the noncoding RNA NEAT1 (Figure 1G); (2) PINCR is highly enriched in the nucleus (Figure 1H), similar to the nuclear-retained lncRNA MALAT1 (Hutchinson et al., 2007); (3) the 5’and 3’ends of PINCR matched the annotated transcript based on analysis of our RNA-seq data from HCT116 cells (Li et al., unpublished) (Figure 1—figure supplement 3); (4) analysis of the length of the PINCR transcript by RT-PCR revealed two closely migrating bands (Figure 1—figure supplement 4) that matched the expected size of the amplicon (~1.8 kb); (5) PINCR is expressed at ~13–26 molecules per HCT116 cell after DNA damage and less than one molecule per cell without DNA damage (Figure 1—figure supplement 5A–C) based on comparison of the FPKM of PINCR with the lncRNA NORAD, known to be expressed at 500–1000 molecules per HCT116 cell (Lee et al., 2016). As an alternative approach, qRT-PCR using in vitro transcribed PINCR RNA showed that PINCR is expressed at ~27 molecules per HCT116 cell after DNA damage (Figure 1—figure supplement 5D); (6) PINCR promoter including the p53RE, mature PINCR transcript and the transcription start site are quite conserved among primates but poorly conserved between human and mouse (Figure 1—figure supplement 6, Figure 1—figure supplement 6—source data 1 and Figure 1—figure supplement 6—source data 2).
Targeted deletion of PINCR impairs G1 arrest and results in increased cell death after DNA damage
The strong p53-dependent induction of PINCR after DNA damage led us to hypothesize that PINCR mediates the effect of p53 by regulating G1 and/or G2/M arrest after DNA damage. To begin to test this hypothesis, we used the CRISPR/Cas9 technology to delete the PINCR genomic locus in HCT116 cells (Figure 2—figure supplement 1A and B). Targeted deletion of PINCR in 2 PINCR-KO clones (KO#1 and KO#2) was confirmed by Sanger sequencing (Figure 2—figure supplement 1C and D) and loss of PINCR expression was validated by qRT-PCR (Figure 2A). As negative controls, we selected two clones that were WT for PINCR (WT#1 and WT#2). The p53RE in the PINCR promoter was partially deleted in PINCR-KO#1 but fully intact in PINCR-KO#2 (Figure 2—figure supplement 1C and D) and as expected, we observed significantly impaired p53 binding in PINCR-KO#1 but not in PINCR-KO#2 (Figure 2—figure supplement 2).
Figure 2 with 5 supplements see all

Loss of PINCR impairs G1 arrest and results in increased cell death after DNA damage.
(A) qRT-PCR analysis from PINCR-WT (WT#1 and WT#2) and PINCR-KO clones (KO#1 and KO#2) untreated or treated with DOXO for 16 hr. (B, C) PINCR-WT and PINCR-KO clones were untreated or treated with DOXO for the indicated time points and cell cycle analysis was performed using Propidium iodide (PI) staining followed by flow cytometry analysis (FACS). (D) PINCR-KO cells were stably transfected with pCB6 or pCB6-PINCR and qRT-PCR was performed. (E) PINCR-KO cells stably expressing PINCR were untreated or treated with DOXO in biological duplicates at the indicated times and cell death (sub-G1 cells) was assessed by PI staining followed by FACS. (F) Immunostaining for Nucleoporin and cleaved caspase-3 from PINCR-WT and PINCR-KO clones with or without DOXO treatment for 72 hr. DNA was counterstained with DAPI. (G) PINCR-WT and PINCR-KO clones were untreated or treated with the indicated DOXO concentrations for 4 hr and colony formation assays were performed after 10 days. Error bars in A and D represent SD from three independent experiments. #p<0.01; ##p<0.001.
We next treated the PINCR-WT and PINCR-KO cells with DOXO for 24, 48 and 72 hr and examined the effect on cell cycle arrest. In PINCR-KO cells, G1 arrest was substantially impaired as early as 24 hr after DNA damage (Figure 2B) and these cells displayed increased apoptosis as measured by the elevated sub-G1 population after 48 and 72 hr of DOXO treatment but not at 24 hr (Figure 2C and Figure 2—figure supplement 3A). Notably, loss of PINCR did not alter the cell cycle profile in the absence of DNA damage (Figure 2—figure supplement 3A).
To make sure that the observed phenotypes were not DNA-dependent but due to loss of PINCR RNA, we performed a rescue experiment. We inserted the full-length PINCR RNA into pCB6 and reintroduced PINCR in the PINCR-KO cells by stable transfection. The extent of PINCR overexpression was not supraphysiological; we observed ~40 fold increase in PINCR expression (Figure 2D) which is less than the ~100 fold induction that we had observed for endogenous PINCR. Although, reintroduction of PINCR in the PINCR-KO cells significantly rescued apoptosis at both 48 and 72 hr after DNA damage (Figure 2E), we did not observe a rescue of G1 arrest (Figure 2—figure supplement 3B). The incomplete rescue may be because unlike endogenous PINCR that is induced ~100 fold after DOXO-treatment, the extent of exogenous PINCR overexpression was ~40 fold. Another possibility is that in the rescue experiments, we overexpressed the annotated isoform, whereas we had found that HCT116 cells express at least two isoforms of PINCR.
In response to DOXO treatment, HCT116 cells arrest in G1 but the majority arrest in G2. p53 has been shown to play a critical role in the G1 arrest and in keeping the cells in G2 (Bunz et al., 1998; Kuerbitz et al., 1992; Levine, 1997). To determine if in addition to its role in G1 arrest, PINCR also regulates G2 arrest, we examined the integrity of the nuclear envelope by performing immunostaining for Nucleoporin after treating PINCR-WT and PINCR-KO cells with DOXO for 72 hr. We found that the nuclear membrane was intact in both PINCR-WT and PINCR-KO cells suggesting that loss of PINCR does not result in aberrant entry into mitosis (Figure 2F). Immunostaining for cleaved caspase-3, a marker of apoptosis, further confirmed increased apoptosis after DNA damage upon loss of PINCR (Figure 2F and Figure 2—figure supplement 4A). This hypersensitivity to DNA damage was persistent and also observed in colony formation assays (Figure 2G and Figure 2—figure supplement 4B). In this experiment, we did not observe a difference in clonogenicity upon loss of PINCR in untreated cells, which is consistent with the unaltered cell cycle profile upon loss of PINCR in untreated cells.
To confirm that PINCR is involved in p53-dependent G1 arrest, we performed cell cycle analysis from PINCR-WT and PINCR-KO cells after Nutlin-3 treatment. As expected, in both PINCR-WT and PINCR-KO cells, Nutlin-3 treatment resulted in dramatic reduction in the population of cells in S-phase (Figure 2—figure supplement 5). As compared to PINCR-WT cells, we observed reduced G1 population and increased G2/M population in both PINCR-KO clones after Nutlin-3 treatment. These data indicate that PINCR plays a role in p53-dependent G1 arrest and it has a prosurvival function in response to DNA damage.
PINCR loss results in hypersensitivity to 5-FU and decreased tumor growth
If the major function of PINCR after DNA damage is to arrest cells in G1, the effect of PINCR loss should be more pronounced if the DNA damaging agent mainly causes G1 arrest. We therefore examined the effect on G1 arrest and apoptosis 48 hr after treatment of PINCR-WT and PINCR-KO cells with three chemotherapeutic drugs: DOXO (300 nM), the radiomimetic NCS (Neocarzinostatin, 400 ng/ml) and 5-Fluorouracil (5-FU, 100 µM). After confirming the induction of PINCR in response to NCS and 5-FU treatment (Figure 3—figure supplement 1A and B), we performed cell cycle analysis. In PINCR-WT cells, the percentage of cells arrested in G1 was smallest (11%) for NCS and largest (63%) for 5-FU (Figure 3A). Loss of PINCR resulted in decreased G1 arrest for NCS, DOXO and 5-FU. However, in PINCR-KO cells, the sub-G1 population was highest (36%) after 5-FU treatment indicating that hypersensitivity of PINCR-KO cells to chemotherapeutic drugs is dependent on G1 arrest. Importantly, this impaired G1 arrest and increased apoptosis after 5-FU treatment upon loss of PINCR was observed in both PINCR-KO clones (Figure 3B and C) and was further confirmed by immunoblotting for the apoptosis marker cleaved-PARP (Figure 3D and Figure 3—source data 1). Furthermore, loss of PINCR significantly impaired clonogenicity after 5-FU treatment (Figure 3E and F).
Figure 3 with 7 supplements see all
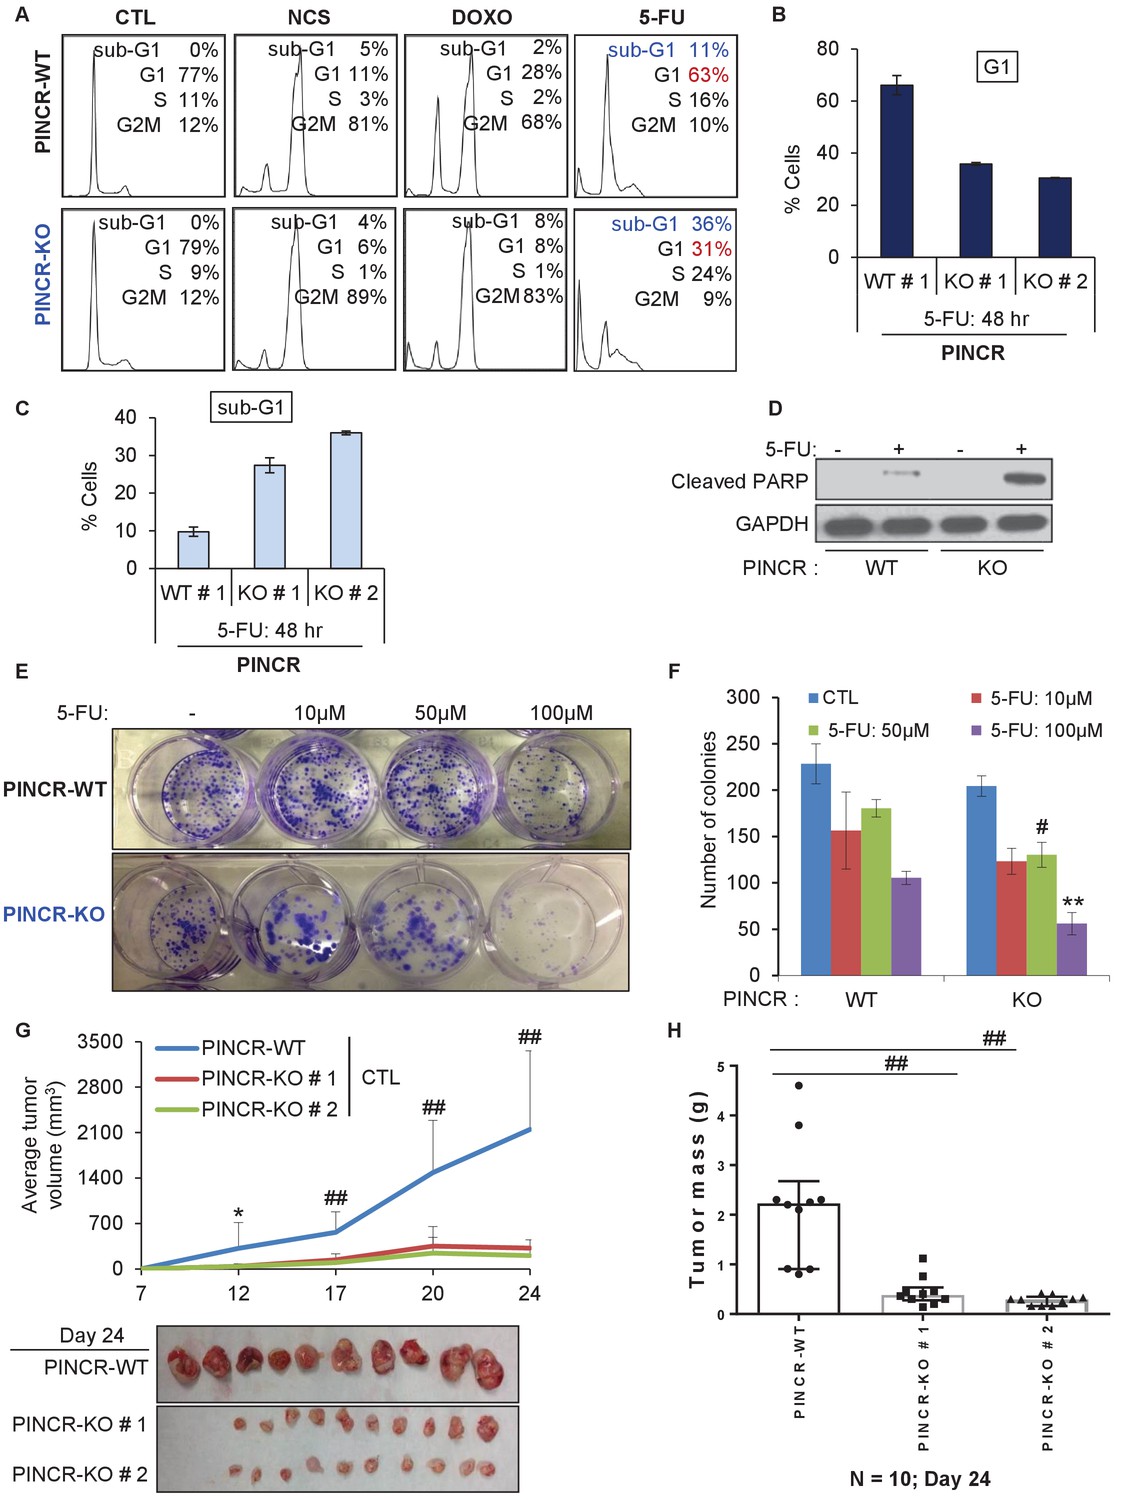
PINCR knockout cells are hypersensitive to 5-FU in vitro and poorly tumorigenic in vivo.
(A) PINCR-WT and PINCR-KO clones were untreated or treated with NCS, DOXO, 5-FU for 48 hr and PI staining followed by FACS analysis was performed. (B, C) PINCR-WT#1 and PINCR-KO (KO#1 and KO#2) clones were untreated or treated with 5-FU in biological duplicates for 48 hr and the effect on G1 arrest and cell death (sub-G1) was assessed by PI staining followed by FACS. (D) PINCR-WT and PINCR-KO cells were untreated or treated with 5-FU for 48 hr and immunoblotting for cleaved PARP and loading control GAPDH was performed. (E, F) PINCR-WT and PINCR-KO cells were untreated or treated with indicated 5-FU concentrations for 4 hr, and colony formation assays were performed after 10 days. (G, H) Untreated PINCR-WT#1 and PINCR-KO (KO#1 and KO#2) cells were injected subcutaneously into the flanks of athymic nude mice (five mice for each group, two tumors per mice). Average tumor volume (G) and tumor mass (H) are shown. Error bars in F represent SD from three experiments. Tumor mass data in H is shown as median +/- interquartile range and p-values were calculated using the Krusal-Wallis test. *p<0.05; #p<0.01; **p<0.005; ##p<0.001.
-
Figure 3—source data 1
Cleaved PARP immunoblot for Figure 3D.
- https://doi.org/10.7554/eLife.23244.020
Next, to determine if the observed phenotypes are not restricted to HCT116, we knocked out PINCR in SW48 cells (Figure 3—figure supplement 2A and B). In response to DNA damage induced by 5-FU, we observed reduced G1 arrest and increased apoptosis in the PINCR-KO clone as compared to PINCR-WT clones (Figure 3—figure supplement 3A–C). Moreover, following extended treatment with 5-FU, the PINCR-KO clone was markedly more sensitive than PINCR-WT clones (Figure 3—figure supplement 4). These data confirm that the phenotypic effects observed upon loss of PINCR are not unique to HCT116.
We next employed several different concentrations of 5-FU (0 to 375 µM) and measured the extent of induction of PINCR and PUMA, and examined the sub-G1 population. Although we found an increase in sub-G1 population with increasing dose of 5-FU, the extent of induction of PINCR or PUMA did not change significantly (Figure 3—figure supplement 5A). At all doses of 5-FU, PINCR-KO cells were more sensitive than PINCR-WT cells (Figure 3—figure supplement 5B). These data indicate that the extent of PINCR induction may not be determinant of the likelihood of the cells to die rather than undergo G1 arrest. In addition, we found that over-expression of PINCR did not significantly affect the cell cycle in untreated cells or in response to DNA damage induced by 5-FU (Figure 3—figure supplement 6).
To determine the function of PINCR in an in vivo setting, we subcutaneously injected NOD-SCID mice with HCT116-PINCR-WT or PINCR-KO cells, untreated or treated with 5-FU for 4 hr followed by a 4-hr recovery. Although mice injected with 5-FU-treated PINCR-WT or PINCR-KO cells did not form tumors, in untreated condition the rate of tumor growth was substantially reduced (7–10-fold) upon loss of PINCR (Figure 3G and H). All mice injected with untreated PINCR-WT cells developed detectable tumors, whereas the untreated PINCR-KO cells displayed significantly reduced tumor growth as early as day 12 post-injection (p<0.05) (Figure 3G). Immunohistochemical staining of the tumors for the proliferation marker Ki67 and the apoptosis marker cleaved caspase-3 revealed that PINCR-WT and PINCR-KO tumors had a high proportion of Ki67-positive cells (>50%) and a very low proportion of cleaved caspase-3-positive cells (<1%) (Figure 3—figure supplement 7). As compared to PINCR-WT tumors, the PINCR-KO tumors had significantly decreased Ki67-positive cells (Figure 3—figure supplement 7A and Figure 3—figure supplement 7—source data 1), suggesting that the observed reduced tumor volume is due to inhibition of cell proliferation.
PINCR regulates the induction of a subset of p53 targets after DNA damage
To determine if PINCR mediates its effect by regulating gene expression, we performed mRNA microarrays from three biological replicates of PINCR-WT and PINCR-KO cells, untreated or treated with 5-FU for 24 hr (Supplementary file 3). Gene set enrichment analysis (GSEA) for the upregulated genes identified the p53 pathway as the top upregulated pathway after DNA damage in both PINCR-WT and PINCR-KO cells (Figure 4—figure supplement 1A and Figure 4—figure supplement 1—source data 1) suggesting that loss of PINCR does not alter global p53 signaling. Consistent with this, we observed comparable p53 induction in both PINCR-WT and PINCR-KO cells after 5-FU treatment (Figure 4—figure supplement 1B) and the majority of known p53 targets including the G1 regulator p21 were induced to similar levels. Interestingly, the normalized enrichment score (NES) for the p53 pathway in PINCR-KO cells was significantly lower (NES = 2.673) than that in PINCR-WT cells (NES = 3.045) indicating that the induction of a subset of p53 targets may be abrogated in PINCR-KO cells (Figure 4—figure supplement 1A). Thus, the induction of a subset of p53 targets appeared to be PINCR-dependent (Figure 4A). Further analysis indicated that the induction of 11 direct p53 targets that were also identified in the p53 GRO-seq study (Allen et al., 2014) including BTG2, GPX1, RRM2B was less pronounced in PINCR-KO cells (Supplementary file 3).
Figure 4 with 6 supplements see all

PINCR regulates the induction of select p53 target genes important for G1 arrest after DNA damage.
(A) Schematic representation of a subset of p53 target genes upregulated after 5-FU treatment in a PINCR-dependent or PINCR-independent manner. (B) qRT-PCR analysis from PINCR-WT and PINCR-KO cells untreated or treated with 5-FU for 24 hr. (C) PINCR-WT and PINCR-KO cells were treated with 5-FU for 24 hr and qPCR for the p53RE of BTG2, RRM2B and GPX1 was performed from IgG-ChIP and p53-ChIP. (D–F) HCT116 cells were reverse transfected with CTL-ASO or PINCR-ASO for 48 hr. The cells were then left untreated or treated with 5-FU for 24 hr (D) or 48 hr (E, F) following which qRT-PCR analysis (D), PI staining and FACS analysis was performed (E, F). Error bars in B-F represent SD from three independent experiments. *p<0.05; #p<0.01; **p<0.005; ##p<0.001.
Among the 11 PINCR-dependent p53 targets, we selected BTG2, RRM2B and GPX1 for further analysis due to evidence in the literature supporting their roles in induction of G1 arrest and inhibition of apoptosis after DNA damage. BTG2 encodes an antiproliferative protein critical in regulation of the G1/S transition (Guardavaccaro et al., 2000; Rouault et al., 1996; Tirone, 2001). Silencing RRM2B in p53-proficient cells reduces ribonucleotide reductase activity, DNA repair, and cell survival after exposure to various genotoxins (Tanaka et al., 2000; Xue et al., 2007; Yanamoto et al., 2005). GPX1 attenuates DOXO-induced cell cycle arrest and apoptosis (Gao et al., 2008).
In subsequent experiments, we sought to use p21 as a negative control because p21 mRNA was induced to similar levels in both PINCR-WT and PINCR-KO cells (Figure 4B). However, given the well-established role of p21 in controlling G1 arrest after DNA damage, it was important to make sure that loss of PINCR did not alter p21 protein levels, p21 subcellular localization and/or Rb-phosphorylation. Indeed, we found similar levels of total, nuclear or cytoplasmic p21 in PINCR-WT and PINCR-KO cells under untreated condition and after 5-FU treatment (Figure 4—figure supplement 2A and B and Figure 4—figure supplement 2—source data 1). The decrease in Rb phosphorylation in response to 5-FU treatment was comparable in PINCR-WT and PINCR-KO cells (Figure 4—figure supplement 2C and Figure 4—figure supplement 2—source data 1). These results indicate that p21 expression is not altered upon loss of PINCR and it can therefore be used as a negative control.
We next asked the question if depletion of the PINCR targets BTG2, GPX1 and RRM2B recapitulated the effects of PINCR depletion. We validated significant knockdown of these genes by qRT-PCR (Figure 4—figure supplement 3A) and found significantly increased apoptosis (sub-G1 cells) upon knockdown of each of these genes followed by 5-FU treatment (Figure 4—figure supplement 3B–3D and Figure 4—figure supplement 4). Significant reduction in G1 arrest after 5-FU treatment was observed after knockdown of GPX1 but not BTG2 or RRM2B. These data indicate that depletion of BTG2, GPX1 or RRM2B recapitulates the effects of PINCR depletion in response to 5-FU treatment.
Consistent with our microarray data, we observed impaired induction of BTG2, GPX1 and RRM2B mRNAs upon loss of PINCR (Figure 4B). Moreover, by p53 ChIP-qPCR, we observed substantial decrease in the binding of p53 to the p53RE of BTG2, GPX1 and RRM2B upon loss of PINCR (Figure 4C). There is evidence in the literature that p53 can directly bind to RNA including a recent report showing direct binding of p53 to the p53-regulated lncRNA DINO (Riley and Maher, 2007; Schmitt et al., 2016). However, we found that PINCR does not directly bind to p53 (data not shown).
To make sure that the altered induction of BTG2, GPX1 and RRM2B reflect a function of the PINCR transcript itself, we measured the induction of these genes after PINCR knockdown using antisense oligonucleotides (ASOs). We tested 5 ASOs that potentially target PINCR RNA (data not shown). Robust knockdown of PINCR in HCT116 cells was observed with one ASO that we designated as PINCR-ASO (Figure 4D). Importantly, as observed with PINCR-KO cells, knockdown of PINCR followed by 5-FU treatment resulted in decreased induction of BTG2, GPX1 and RRM2B but not p21 (Figure 4D) and caused decreased G1 arrest (Figure 4E) and increased apoptosis (Figure 4F) after 5-FU or DOXO treatment (Figure 4—figure supplement 5). In clonogenic survival assays, knockdown of PINCR resulted in reduced colony formation after 5-FU treatment (Figure 4—figure supplement 6A). Surprisingly, unlike PINCR-KO cells that did not show significant difference in proliferation from PINCR-WT cells in untreated condition, decreased colony formation in untreated condition was observed after PINCR knockdown (Figure 4—figure supplement 6B). Although this result indicates that basal PINCR levels can regulate proliferation despite low expression, this growth defect may be restored long-term during genetic deletion of PINCR using CRISPR/Cas9. Taken together, the results from PINCR knockdown experiments corroborates our findings from the PINCR-KO clones.
RNA pulldowns and mass spectrometry identifies Matrin 3 as a PINCR-interacting protein that mediates the effect of PINCR
Because we found that PINCR does not bind to p53, we hypothesized that PINCR binds to an RNA-binding protein that serves as an adaptor protein and mediates this effect of PINCR. To identify this adaptor protein, we incubated in vitro-transcribed biotinylated (Bi)-PINCR (Bi-PINCR) or Bi-Luciferase (Bi-LUC) RNA with untreated or DOXO-treated nuclear extracts and performed streptavidin pulldowns followed by mass spectrometry. Eleven proteins were enriched at least twofold in the Bi-PINCR pulldowns (Supplementary file 4) as compared to Bi-LUC pulldowns in untreated condition as well as after DOXO treatment. Of these 11 proteins, the RNA- and DNA-binding nuclear matrix protein Matrin 3 showed the strongest enrichment (eightfold in untreated condition; 16-fold after DOXO treatment) (Figure 5A and Supplementary file 4). In a recent iCLIP (Individual-nucleotide resolution UV crosslinking and immunoprecipitation) study (Coelho et al., 2015), the consensus RNA motif recognized by Matrin 3 was identified. We found that PINCR has six Matrin 3 binding motifs, and this motif was significantly enriched in the PINCR RNA as compared to the transcriptome (Figure 5—figure supplement 1A and B). We next validated the specific PINCR-Matrin 3 interaction by performing streptavidin pulldowns followed by immunoblotting after incubating Bi-PINCR or Bi-LUC with HCT116 nuclear extracts (Figure 5B and Figure 5—source data 1) or recombinant Matrin 3 (rMatrin 3) (Figure 5C and Figure 5—source data 1). Moreover, we observed ~300-fold enrichment of PINCR in the Matrin 3 IPs from formaldehyde crosslinked HCT116 cells treated with DOXO (Figure 5D); p21 mRNA was not enriched (Figure 5D and Figure 5—source data 1), demonstrating the specificity of the PINCR-Matrin 3 interaction.
Figure 5 with 5 supplements see all
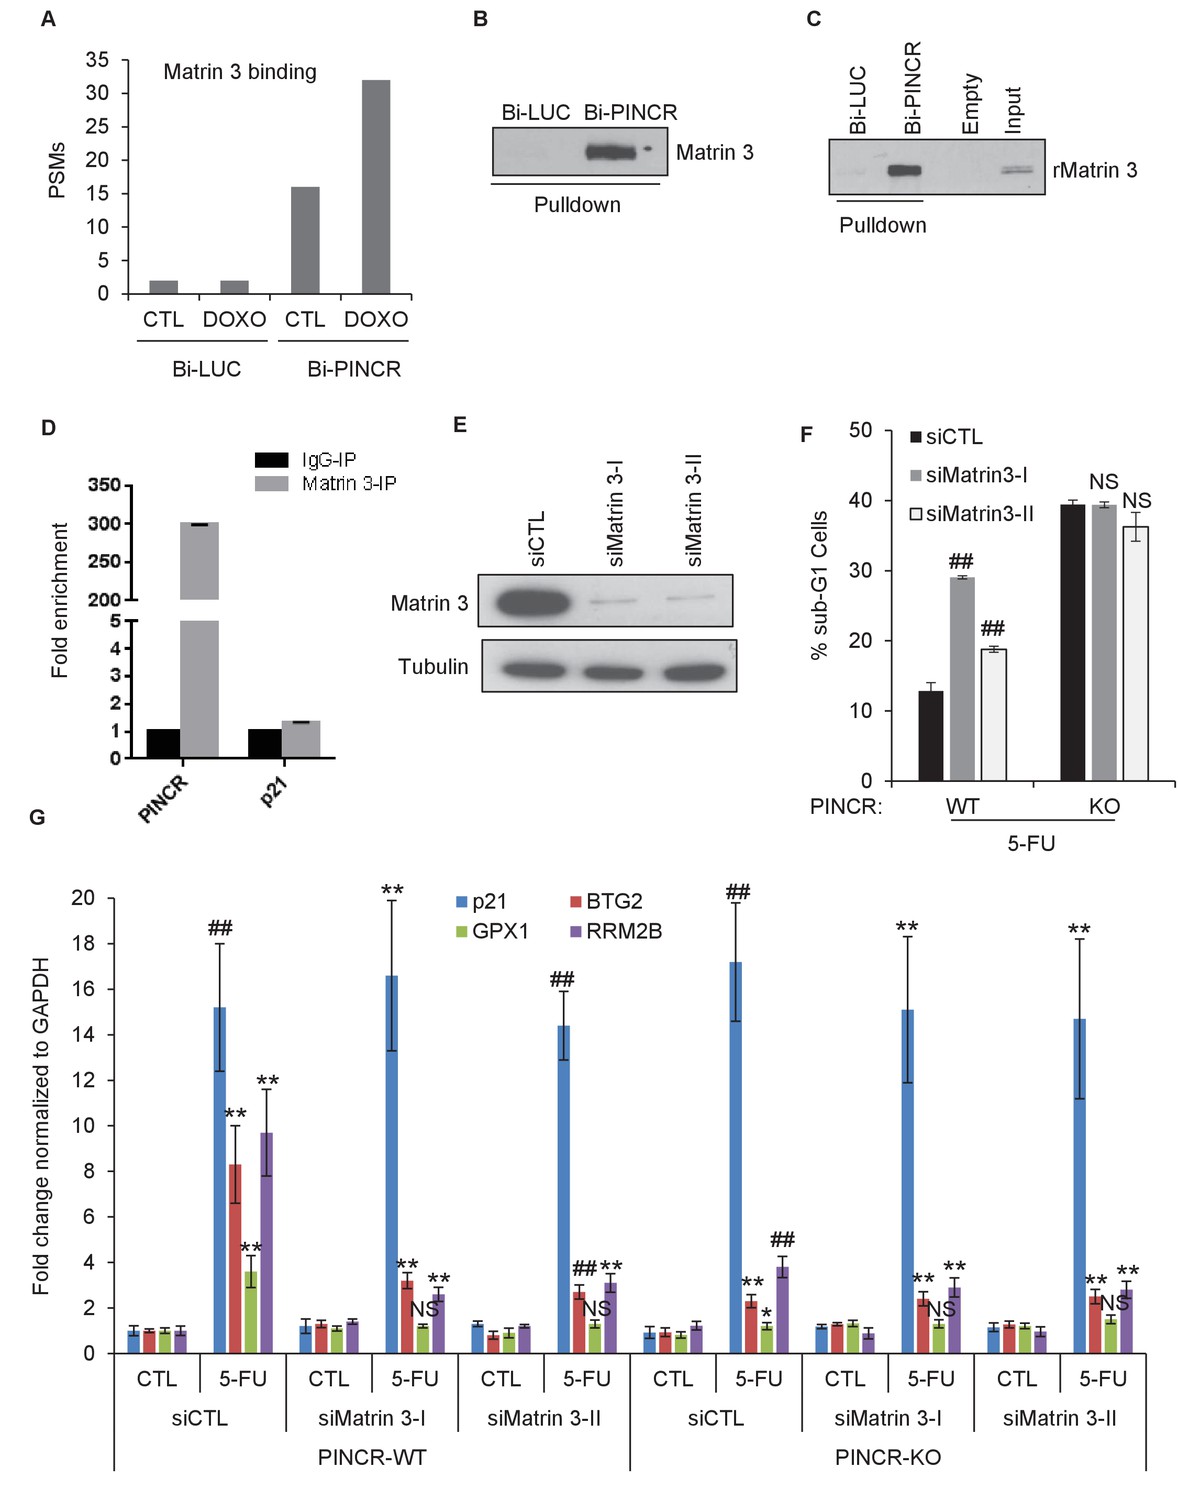
Matrin 3 binds to PINCR and functions as a downstream effector of PINCR.
(A) Peptide spectrum matches (PSMs) corresponding to Matrin 3 in the Bi-LUC and Bi-PINCR pulldowns from mass spectrometry analysis. (B, C) Streptavidin pulldowns followed by immunoblotting was performed following incubation of Bi-LUC and Bi-PINCR RNA with DOXO-treated HCT116 nuclear extracts (B) or recombinant Matrin 3 (rMatrin 3) (C). (D) Specific enrichment of PINCR in the Matrin 3 IPs was assessed by qRT-PCR from 24 hr 5-FU-treated formaldehyde cross-linked HCT116 cells. p21 mRNA was used as negative control. (E) PINCR-WT cells were transfected with CTL or two independent Matrin 3 siRNAs (I and II) for 48 hr and Matrin 3 knockdown was measured by immunoblotting. (F) PINCR-WT and PINCR-KO cells were transfected with CTL or Matrin 3 siRNAs and after 48 hr the cells were untreated or treated with 5-FU for 48 hr. The effect on the sub-G1 population was assessed by PI staining followed by FACS. (G) PINCR-WT and PINCR-KO cells were transfected with CTL or Matrin 3 siRNAs for 48 hr; transfected cells were left untreated or treated with 5-FU for 24 hr and qRT-PCR was performed. Error bars in D, F and G represent SD from three independent experiments. *p<0.05; #p<0.01; **p<0.005.
-
Figure 5—source data 1
Matrin 3 immunoblot for Figure 5B, C and E.
- https://doi.org/10.7554/eLife.23244.039
Next, we knocked down Matrin 3 with two independent siRNAs (Figure 5E and Figure 5—figure supplement 1C) and determined the effect on G1 arrest and apoptosis of PINCR-WT and PINCR-KO. After 5-FU or DOXO treatment, there was more apoptosis upon Matrin 3 knockdown in PINCR-WT but this increase was not observed in the PINCR-KO (Figure 5F and Figure 5—figure supplements 2 and 3) indicating that Matrin 3 is a downstream effector of PINCR. We did not observe a significant difference in G1 arrest, suggesting that Matrin 3 does not mediate the G1 arrest regulated by PINCR. These data indicate that there is an epistatic interaction between PINCR and Matrin 3 as virtually all the apoptotic effects of Matrin 3 after DNA damage are dependent on PINCR. Furthermore, in PINCR-WT cells silencing Matrin 3 resulted in less or no induction of the PINCR targets BTG2, GPX1 and RRM2B but not p21 mRNA after 5-FU treatment (Figure 5G). A role of Matrin 3 in regulating the induction of these p53 targets was also observed in response to Nutlin-3 treatment (Figure 5—figure supplement 4). Immunoblotting from untreated or 5-FU-treated HCT116 whole cell lysates and nuclear and cytoplasmic lysates indicated no change in Matrin 3 levels or subcellular localization (Figure 5—figure supplement 5 and Figure 5—figure supplement 5—source data 1). Collectively, these data suggest that the induction of the PINCR targets BTG2, GPX1 and RRM2B is largely mediated by Matrin 3 and reveal an epistatic interaction between PINCR and Matrin 3.
Matrin 3 interacts with p53 and associates with the p53RE of select PINCR targets
To determine if Matrin 3 mediates the effect of PINCR by functioning as an adaptor protein, we performed co-IP experiments to determine if p53 and Matrin 3 form a complex. We found that p53 interacts with Matrin 3 in both untreated and 5-FU treated cells (Figure 6A and B, Figure 6—figure supplement 1A, Figure 6—source data 1 and Figure 6—figure supplement 1—source data 1). This interaction was not altered in the presence of RNase A or DNase, suggesting that p53 and Matrin 3 form a protein-protein complex (Figure 6B). This result prompted us to examine the association of Matrin 3 on the p53RE of BTG2, GPX1 and RRM2B. Matrin 3 ChIP-qPCR revealed that in untreated PINCR-WT cells, Matrin 3 binds to the p53RE of BTG2 and RRM2B but not GPX1 (Figure 6C). For all three genes, in PINCR-WT cells, there was increased Matrin 3 binding to their p53RE after 5-FU treatment. Loss of PINCR impaired this binding of Matrin 3 to the p53RE of these genes (Figure 6C) but not the p53RE of p21 (Figure 6—figure supplement 1B). Interestingly, after knockdown of Matrin 3 and 5-FU treatment in PINCR-WT cells, we did not observe a significant difference in the binding of p53 to the p53RE of these genes (Figure 6D and Figure 6—figure supplement 2) suggesting that Matrin 3 does not control p53 occupancy at the p53RE in the promoters of these genes.
Figure 6 with 2 supplements see all
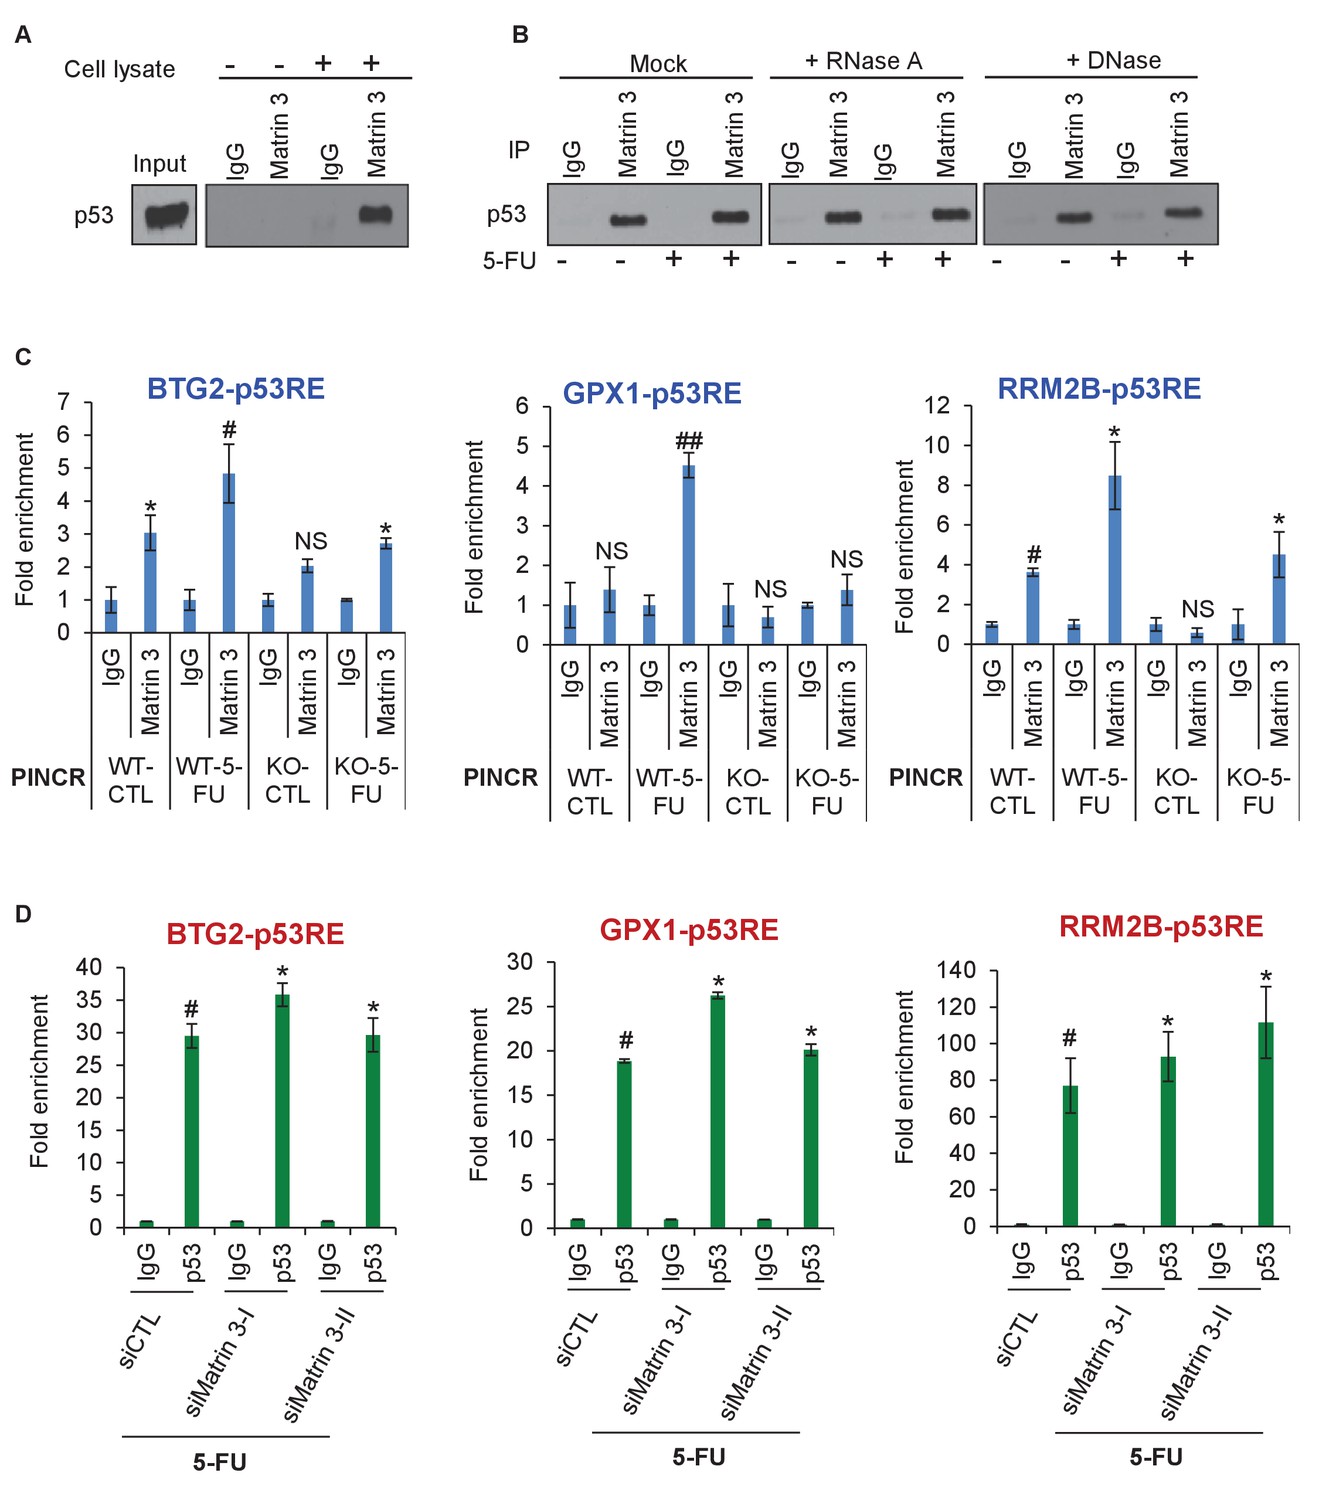
Matrin 3 forms a complex with p53 complex and associates with the p53RE of select PINCR targets.
(A) HCT116 cells were treated with 5-FU for 24 hr and immunoblotting for p53 was performed from input, no cell lysate control and IgG or Matrin 3 IP from whole cell extracts. (B) HCT116 cells were untreated or treated with 5-FU for 24 hr and the interaction between p53 and Matrin 3 was assessed by IPs from Mock (no extract), RNase-treated or DNase-treated whole cell lysates. (C) PINCR-WT and PINCR-KO cells were untreated or treated with 5-FU for 24 hr and qPCR with primers spanning the p53RE of BTG2, RRM2B and GPX1 was performed from IgG-ChIP and Matrin 3-ChIP. (D) PINCR-WT HCT116 cells were reverse transfected with CTL or Matrin 3 siRNAs for 48 hr and then treated with 5-FU for 24 hr. The enrichment of p53 at the p53RE of PINCR targets was determined by ChIP-qPCR. Errors bars in C and D represent SD from three independent experiments. *p<0.05; #p<0.01; ##p<0.001.
-
Figure 6—source data 1
p53 immunoblot for Figure 6A and B.
- https://doi.org/10.7554/eLife.23244.047
Matrin 3 associates with enhancers within insulated neighborhoods of PINCR targets
We next examined how Matrin 3 regulates the induction of the PINCR targets BTG2, GPX1 and RRM2B after DNA damage, without altering p53 binding to their promoters. Given the evidence that Matrin 3 associates with enhancer regions (Skowronska-Krawczyk et al., 2005), we reasoned that Matrin 3 modulates the induction of these genes by binding to their enhancer regions. More recently, it has been shown that proper enhancer-gene pairing is enabled by insulated neighborhoods formed by CTCF anchoring at domain boundaries and cohesion looping (Hnisz et al., 2016) and are mostly conserved across cell types. To test this possibility, we identified insulated neighborhoods around PINCR targets, ChIP-seq data tracks (ENCODE Project Consortium, 2012) in HCT116 cells (Figure 7A, Figure 7—figure supplement 1 and Figure 7—figure supplement 2) for (1) CTCF, a protein known to bind to chromatin domain boundaries, (2) the chromatin loop-enabling cohesion component RAD21, (3) promoter associated histone mark H3K4me3 and (4) active promoter/enhancer associated mark H3K27ac. To determine the overlap of these peaks with p53, we utilized p53 ChIP-seq data from MCF7 and U2OS cells (Figure 7A, Figure 7—figure supplement 1 and Figure 7—figure supplement 2). In addition, to determine potential chromatin looping near these PINCR targets, we utilized Hi-C data (Figure 7A, Figure 7—figure supplement 1 and Figure 7—figure supplement 2). For each of the three PINCR targets, the Hi-C data indicated chromatin looping with appropriate CTCF and cohesion signal consistent with insulated domain structure. Within the loop, we observed the following: (1) a strong p53 ChIP-seq peak corresponding to the p53RE in the promoter of these genes that was also marked by strong signal for H3K4me3 and H3K27ac; (2) a weak p53 ChIP-seq peak that was also marked by strong signal for H3K27ac and weak signal H3K4me3. Promoters are marked by high H3K4me3 and high H3K27ac whereas enhancers typically have low H3K4me3 and high H3K27ac (Ernst et al., 2011). Thus, our Hi-C and ChIP-seq data analysis indicates potential chromatin looping between a weak p53 binding region in the enhancer and strong p53 binding region in the promoter of the PINCR targets BTG2, GPX1 and RRM2B. Notably, whereas the strong ChIP-seq peak at the promoters of these three genes had a canonical p53RE, the weak p53 binding region in their enhancers did not have a canonical p53RE indicating indirect association of p53 at these enhancers.
Figure 7 with 2 supplements see all

PINCR modulates the association of Matrin 3 with enhancers of PINCR targets within insulated neighborhoods.
(A) Topological domain and looping structure indicated by 3D contact domain profile (top) surrounding BTG2 gene and Hi-C data from (Rao et al., 2014). ChIP-seq data tracks (middle) in HCT116 showing CTCF anchors and loop-enabling cohesion (RAD21), as well as promoter associated histone mark H3K4me3 and active promoter/enhancer associated mark H3K27ac. p53 ChIP-seq in untreated or treated MCF7 is also shown. Candidate regulatory enhancers (used for ChIP-qPCR of Matrin3) are highlighted with an orange box at the tail of an arrow pointing toward the putative target gene. The p53 response element is shown, found at the promoter, where stronger ChIP-seq signal was present upon treatments. The one-dimensional genomic distance between the enhancer and the promoter is indicated between the zoomed in boxes (bottom). (B, C) PINCR-WT and PINCR-KO HCT116 cells were treated with 5-FU for 24 hr and the association of Matrin 3 (B) or p53 (C) with the enhancer of PINCR targets was assessed by ChIP-qPCR. (D) PINCR-WT HCT116 cells were reverse transfected with CTL or Matrin 3 siRNAs for 48 hr and then treated with 5-FU for 24 hr. The enrichment of p53 at the enhancer regions of PINCR targets was determined by ChIP-qPCR. (E) A cartoon showing the chromatin looping between the enhancer and promoter region of BTG2. Errors bars in B, C and D represent SD from three independent experiments. *p<0.05; #p<0.01; **p<0.005; ##p<0.001.
Next, we sought to determine if Matrin 3 associates with the enhancer of BTG2, GPX1 and RRM2B and if this association is dependent on PINCR. To test this, we performed ChIP-qPCR for Matrin 3 from PINCR-WT and PINCR-KO cells after 5-FU treatment. In PINCR-WT cells, there was strong enrichment of Matrin 3 at the enhancers of each of these genes (Figure 7B). Loss of PINCR resulted in significant reduction in Matrin 3 occupancy on each of these enhancer regions (Figure 7B). Moreover, after 5-FU treatment, we found significantly reduced p53 binding to these enhancer regions upon loss of PINCR (Figure 7C) or upon knockdown of Matrin 3 (Figure 7D). These results indicate a role of Matrin 3 and PINCR in facilitating the association of p53 with the enhancers of specific p53 targets BTG2, GPX1 and RRM2B and provide evidence of chromatin looping between the enhancers and promoters of these genes (Figure 7E).
PINCR associates with the enhancer regions of select PINCR targets via Matrin 3
We next explored the possibility that PINCR is also a part of the p53-Matrin 3 complex on the p53RE of BTG2, GPX1 and RRM2B. To test this, we used a novel approach in which we tagged endogenous PINCR with an S1-tag and utilized the S1-tag to pulldown PINCR and then performed qPCR for the p53RE of BTG2, GPX1 and RRM2B. The S1-tag is a 44 nt RNA aptamer that binds to streptavidin with high affinity and has been used in vitro to identify proteins that bind to S1-tagged RNAs (Butter et al., 2009; Iioka et al., 2011; Srisawat and Engelke, 2001, 2002). To tag endogenous PINCR, we used CRISPR/Cas9 and knocked-in a single S1-tag at the 3’end of PINCR in HCT116 cells (Figure 8A and Figure 8—figure supplements 1 and 2). Importantly, the PINCR-S1 RNA was strongly upregulated (>20 fold) after DOXO treatment (Figure 8—figure supplement 3A). Like endogenous untagged PINCR, the PINCR-S1 RNA was predominantly nuclear (Figure 8—figure supplement 3B) and expressed at levels comparable to PINCR (Figure 8—figure supplement 3C). PINCR overexpression did not alter the expression of PINCR-S1 or BTG2, GPX1 and RRM2B, suggesting that PINCR does not regulate its own expression and that PINCR over-expression is not sufficient to alter the expression of PINCR targets (Figure 8—figure supplement 4A and B).
Figure 8 with 5 supplements see all

PINCR associates with the enhancer regions of select p53 targets in a Matrin-3-dependent manner.
Schematic showing knock-in of S1-tag at the 3’end of PINCR. (B) The enrichment of PINCR in the streptavidin pulldowns from PINCR and PINCR-S1 cells treated with 5-FU for 24 hr was assessed by qRT-PCR. (C) PINCR and PINCR-S1 cells were treated with 5-FU for 24 hr and followed by streptavidin pulldown. Interaction between PINCR and Matrin 3 was confirmed by immunoblotting for Matrin 3 or the control Tubulin. (D) PINCR and PINCR-S1 cells were treated with 5-FU for 24 hr and qPCR with primers spanning the p53RE of BTG2, RRM2B and GPX1 was performed following streptavidin pulldown. (E) PINCR-S1 cells were reverse transfected with CTL siRNA, p53 siRNAs or two independent Matrin 3 siRNAs and then treated with 5-FU for 24 hr. The enrichment of PINCR-S1 at the p53RE and enhancer regions of PINCR targets was determined by ChIP-qPCR from the streptavidin pulldown material. Error bars represent SD from three independent experiments. *p<0.05; **p<0.005, ##p<0.001.
-
Figure 8—source data 1
Matrin 3 immunoblot for Figure 8C.
- https://doi.org/10.7554/eLife.23244.055
Streptavidin pulldowns from the PINCR-S1 expressing cells treated with 5-FU revealed >10-fold enrichment of the PINCR-S1 RNA (Figure 8B) and specific enrichment of Matrin 3 protein (Figure 8C and Figure 8—source data 1). To determine if PINCR-S1 associates with the p53RE of BTG2, GPX1 and RRM2B, we performed streptavidin pulldowns from formaldehyde-crosslinked parental HCT116 cells (negative control) and the PINCR-S1 cells after 5-FU treatment. We found that the p53RE of each of these three genes but not the p21 p53RE, was specifically enriched in the PINCR-S1 pulldowns (Figure 8D). Finally, we examined the association of PINCR-S1 with the p53RE and enhancer regions of PINCR targets in the presence and absence of p53 or Matrin 3. To do this, we knocked down p53 (Figure 8—figure supplement 5 and Figure 8—figure supplement 5—source data 1) or Matrin 3 with siRNAs and performed streptavidin pulldowns. As compared to the p53RE in the PINCR promoters, in CTL siRNA transfected cells treated with 5-FU, we found stronger association of PINCR-S1 with the enhancers of the PINCR targets (Figure 8E). Silencing Matrin 3 or p53 resulted in dramatic reduction of association of PINCR-S1 with these enhancers and p53REs (Figure 8E). Because p53 is important for PINCR expression, it is likely that the reduced association of PINCR-S1 to these regions after p53 knockdown is due to lack of expression. On the other hand, the observed loss in association of PINCR-S1 to the enhancers and promoters upon knockdown of Matrin 3 indicates that Matrin 3 recruits PINCR-S1 to these regions. Taken together, these results suggest that a p53-Matrin 3-PINCR complex associates with the p53RE and enhancers of BTG2, GPX1 and RRM2B and plays a critical role in modulating the induction of these genes after DNA damage.
Discussion
In this study, we report the first functional characterization of PINCR, an intergenic nuclear lncRNA, strongly induced by p53 after DNA damage. Several p53-regulated lncRNAs have been recently identified and shown to play important roles in the p53 network. However, PINCR is unique from these recently characterized p53-regulated lncRNAs. Firstly, following p53 activation, the p53-regulated lncRNAs LED (Léveillé et al., 2015) and Linc-475 (Melo et al., 2016) regulate G1 arrest and prevent entry of cells into mitosis. However, PINCR-KO cells show a defect in G1 arrest but the cells arrest in the G2 phase after DNA damage. Secondly, the p53-regulated lncRNAs lincRNA-p21 (Dimitrova et al., 2014), LED (Léveillé et al., 2015) and Linc-475 (Melo et al., 2016) regulate the levels of p21. In addition, in a recent study, the p53-induced lncRNA DINO, was shown to directly bind to and regulate p53 levels (Schmitt et al., 2016). However, PINCR does not alter p53 or p21 levels but instead regulates the expression of the p53 targets BTG2, GPX1 and RRM2B that also regulate G1 arrest after DNA damage.
Our study together with other recent studies shows that specific RNA-binding proteins and transcription factors play an important role in mediating the effects of a lncRNA. For example, in the context of p53 activation, lincRNA-p21 interacts with hnRNP-K and functions as a coactivator for p53-dependent p21 transcription (Dimitrova et al., 2014; Huarte et al., 2010). PANDA, another p53-regulated lncRNA upstream of p21, associates with the transcription factor NF-YA to regulate the expression of pro-apoptotic genes during genotoxic stress (Hung et al., 2011). The data presented here indicates that PINCR and Matrin 3 act as coactivators of p53 on a subset of p53 targets. It is known that Matrin 3 interacts with enhancer regions (Romig et al., 1992; Skowronska-Krawczyk et al., 2014), and our data shows that the induction of these genes may be mediated by chromatin looping between Matrin 3 bound to the enhancer regions of these genes and p53 bound to the p53RE in their promoters. PINCR recruits Matrin 3 to enhancers of PINCR-dependent p53 target genes. Future studies on the identification of genome-wide-binding sites of Matrin 3 and p53 and epigenetic marks in PINCR-WT and PINCR-KO cells in the absence or presence of DNA damage will be important. Interestingly, similar intrachromosomal interactions containing enhancer activity have been reported recently and shown to express enhancer RNAs (eRNAs) that are required for efficient transcriptional enhancement of interacting target genes and induction of a p53-dependent cell-cycle arrest (Léveillé et al., 2015; Melo et al., 2013).
The development of new approaches to identify targets of endogenous lncRNAs is an active area of investigation and remains a major challenge in the lncRNA field. We developed a new approach in which we knocked-in an S1 tag at the 3'end of PINCR using CRISPR/Cas9 and determined the association of PINCR-S1 with the p53RE of specific p53 targets by qPCR following streptavidin pulldowns from crosslinked cells. Our results show a Matrin-3-dependent association of PINCR-S1 with the enhancer region of BTG2, RRM2B and GPX1 and indicate a direct and specific role of PINCR in regulating these genes in response to DNA damage. Given the strong interaction between the S1 tag and streptavidin and studies utilizing transfected S1-tagged RNAs (Vasudevan and Steitz, 2007) or in vitro transcribed S1-tagged RNAs (Butter et al., 2009; Iioka et al., 2011; Srisawat and Engelke, 2001, 2002) for the identification of interacting RNA-binding proteins or miRNAs, this method has the potential to identify the genome-wide targets of PINCR and other lncRNAs.
In summary, our study suggests that PINCR is an important modulator of gene expression in the p53 pathway that regulates the induction of a subset of p53 targets and this effect is mediated in part via its interaction with Matrin 3. Future investigations on PINCR in normal cells and in an expanded panel of cell lines will enhance our understanding of its role in tumorigenesis and tumor progression.
Materials and methods
Cell culture, treatments and siRNA transfections
Request a detailed protocolThe colorectal cancer cell lines HCT116 (ATCC Number: CCL-247), SW48 (ATCC Number: CCL-231) and RKO (ATCC Number: CRL-2577) and HEK293T (ATCC Number: CRL-11268) cells were purchased from ATCC. The isogenic p53-WT and p53-KO HCT116, RKO and SW48 were previously generated by Bert Vogelstein’s lab (Johns Hopkins University). All cell lines were maintained in Dulbecco's modified Eagle's medium (DMEM) (Thermo Fisher Scientific) supplemented with 10% fetal bovine serum (Thermo Fisher Scientific) and 1% penicillin-streptomycin at 37°C, 5% CO2. All cell lines were routinely checked for mycoplasma using the Venor Gem Mycoplasma detection kit (Sigma-Aldrich, Catalog # MP0025-1KT). Cells were treated with 10 µM Nutlin-3 (Skelleckchem, Catalog # S1061), 300 nM Doxorubicin (DOXO, Catalog # D1515), 100 µM 5-Fluorouracil (5-FU; Calbiochem, Catalog # 343922) or 400 ng/ml NCS (Sigma-Aldrich, Catlog#N9162) for the indicated time.
The Allstars Negative (CTL) siRNAs were purchased from Qiagen and siRNAs for p53 (SMARTpool siRNAs, Catalog # L-003329–00), BTG2 (I-Catalog # J-012308–06 and II-Catalog # J-012308–07), GPX1 (I-Catalog # J-008982–05 and II-Catalog # J-008982–07), RRM2B (I-Catalog # J-010575–05 and II-Catalog # J-010575–06) and Matrin 3 (Catalog # J-017382–05 and J-017382–07) were purchased from Dharmacon. CTL-ASO and PINCR-ASO were designed and provided by Ionis Pharmaceuticals (Supplementary file 5). All siRNA and ASO transfections were performed by reverse transfection at a final concentration of 20 nM and 50 nM, respectively, using Lipofectamine RNAiMAX (Life technologies) as directed by the manufacturer. For gene expression analysis after PINCR or Matrin 3 knockdown, all the reverse transfections were performed for 48 hr followed by 24 hr DOXO or 5-FU or Nutlin-3 treatment.
RNA isolation and qRT-PCR
Request a detailed protocolTotal RNA from cell lines was isolated using RNeasy mini kit (Qiagen). For qRT-PCR analysis, 500 ng total RNA was reverse-transcribed using iScript Reverse Transcription kit (Bio-Rad), and qPCR was performed using Fast SYBR Green Master Mix (Life technologies) per the manufacturer’s instructions. Primer sequences are detailed in Supplementary file 5.
Nuclear and cytoplasmic extract preparations
Request a detailed protocolNuclear and cytoplasmic extracts were prepared from HCT116 cells expressing PINCR or PINCR-S1, PINCR-WT and PINCR-KO, untreated or treated with DOXO or 5-FU for 16 hr or as indicated in figure legend, using Digitonin as previously described (Lal et al., 2004). RNA was isolated from cytoplasmic and nuclear fractions using Trizol reagent (Invitrogen) following the manufacturer’s protocol.
Comparative genomic analysis and evaluation of coding potential with PhyloCSF
Request a detailed protocolStrand-specific genomic coordinates for all exons of human PINCR and NEAT1, GAPDH, SDHA and UBC genes were downloaded from the UCSC Genome Browser (GRCh37/hg19) in BED format. A Multiz alignment of 46 vertebrates aligned to GRCh37/hg19 (http://hgdownload.soe.ucsc.edu/goldenPath/hg19/multiz46way/maf/, in MAF format) was downloaded separately for each gene based on the extracted coordinates for mature transcript accordingly to the UCSC annotation and uploaded to Galaxy (https://usegalaxy.org/). FASTA alignments were generated for each mature transcript separately using «reformat» and «concatenate» options in Galaxy for overlapping list of 29 mammals specified by the PhyloCSF phylogeny (http://mlin.github.io/PhyloCSF/29mammals.nh.png). PhyloCSF was applied to generated FASTA alignments for assessing the coding potential (the Codon Substitution Frequencies score - CSF) of mature transcripts and individual exons of analyzed genes. The CSF score assigns a metric to each codon substitution observed in the input alignment based on relative frequency of that substitution in known coding and non-coding regions. The following parameters were used for analysis: PhyloCSF 29mammals input fasta_file --orf=ATGStop --frames=6 removeRefGaps --aa –allScores. Comparative analysis of all possible reading frames and estimation of the potential to encode any recognizable protein domains was created by BLASTX. Multiple alignments for complete PINCR mature transcripts and promoter regions were built using the Muscle program with default parameters (Edgar, 2004). Genome rearrangements were analyzed using the Owen program for pair-wise alignments (Ogurtsov et al., 2002).
CRISPR/Cas9-mediated deletion of PINCR
gRNAs targeting the 5’ and 3’ ends of PINCR were designed using Zifit software (http://zifit.partners.org/ZiFiT/) and were cloned into U6-gRNA vector (Moriarity et al., 2014) having BsmB1 restriction enzyme site. gRNAs sequence information is provided in Supplementary file 6. gRNA oligos were ligated and phosphorylated using T4 ligation buffer (NEB) and T4 Polynucleotide Kinase (NEB) using a thermocycler with following parameter: 37°C for 30 min, 95°C for 5 min and then ramp down to 25°C at 5 °C/min. Annealed oligos were ligated with BsmB1 digested U6-gRNA vector (2.9 kb fragment) using quick DNA ligase (NEB). Ligation mix was transformed into E. coli DH5-alpha chemical competent cells and transformants were sequenced to confirm the presence of gRNAs. The efficiency of gRNAs was tested in HEK293T cells by transfecting Cas9 with the gRNAs.
CRISPR-mediated PINCR-KO HCT116 or SW48 cells were then generated using piggyBac co-transposition method as previously described (Moriarity et al., 2014). Cells were cotransfected with 2 μg each of hpT3.5Cagg5-FLAG-hCas9 and the 5′ and 3′ PINCR gRNAs cloned in U6-gRNA vector in addition to the 500 ng each of pcDNA-pPB7 transposase and pPBSB-CG-LUC-GFP (Puro)(+CRE) transposon vector using Lipofectamine 2000. After 48 hr, transfected cells were treated with puromycin and incubated at 37°C for 1 week. Cells were then seeded at one cell per well in 96-well plates with puromycin containing DMEM media. Wells that produced single colonies were expanded and DNA was extracted. Clones were then genotyped for deletion of PINCR using standard PCR genotyping (PINCR deletion analysis primer in Supplementary file 5). Identified wild-type (WT) clones were used as controls. PCR products were sequenced to confirm the deletion of PINCR genomic locus. Also, total RNA was extracted from individual clones, with and without treatment with DOXO or 5-FU, and expression of PINCR was analyzed using qRT-PCR.
Xenograft assays
Request a detailed protocolAnimal protocols were approved by the National Cancer Institute Animal Care and Use Committee following AALAAC guidelines and policies. PINCR-WT#1, PINCR-KO#1 and PINCR-KO#2 cells were untreated or treated with 100 µM 5-FU for 4 hr, following which the drug was washed-off and fresh medium was added. After a 4 hr recovery, live cells were counted with trypan blue exclusion assays and equal numbers of live cells were injected for each sample. Cells (1 × 10⁶) were mixed with 30% matrigel in PBS on ice, and the mixture was injected into the flanks of 6- to 8 week-old female athymic nude mice (Animal Production Program, Frederick, MD) (each group N = 10). Tumor volume was measured twice a week after 1 week of injection.
To evaluate the effect of proliferation and/or apoptosis in the tumors, the xenograft tumors were collected from four PINCR-WT and PINCR-KO tumors and fixed in 10% neutral buffered formalin (Sigma, St. Louis, MO). Paraffin sectioning, hematoxylin and eosin staining (H and E), Ki67 staining and Cleaved Caspase-3 staining were performed by Histoserv, Inc (Gaithersburg, MD). The following antibodies were used for immunohistochemistry staining: anti-Ki67 (Abcam, Catalog # Ab16667) and anti-Cleaved Caspase-3 (Cell Signaling, Catalog # 9661). The images were acquired at 40× magnification.
RNA pulldowns and mass spectrometry
Request a detailed protocolFull-length fragment of PINCR was PCR amplified from a pCB6 vector expressing full length PINCR using a forward primer containing the T7-promoter sequence at its 5’end and a gene-specific reverse primer (Supplementary file 5). The control luciferase cDNA was generated from vector pRL-TK (Addgene) linearized by BamH1 digestion. We then performed in vitro transcription to generate biotinylated PINCR (Bi-PINCR) and the control luciferase (Bi-LUC) RNAs using MEGAscript in vitro transcription kit (Ambion) and biotin RNA labeling mix (Roche). The in vitro transcribed RNA was purified with RNeasy mini kit (Qiagen). The biotinylated RNA was run on the bioanalyzer to check the quality. Nuclear extracts were prepared from HCT116 cells untreated or treated with DOXO for 24 hr as described above. The nuclear lysate was resuspended in RIP buffer (150 mM KCl, 25 mM Tris pH 7.4, 0.5 mM DTT, 0.5% NP40, 1 mM PMSF and protease Inhibitor) and sonicated three times for 5 s and centrifuged at 14,000 x g at 4°C for 30 min. The nuclear lysate was precleared by incubation with Dynabeads M-280 Streptavidin (Thermo Fisher Scientific) for 4 hr at 4°C. In parallel, 40 µl Dynabeads were blocked with 1 mg BSA (company) and 50 µg tRNA (company) for 4 hr at 4°C. Twenty-five pmole Bi-PINCR or Bi-LUC RNA was incubated with 1 mg precleared nuclear lysate prepared above for 4 hr at 4°C. The biotinylated RNA-protein complexes were pulled down by incubation with preblocked Dynabeads for overnight at 4°C. Interacting proteins were fractionated by SDS-PAGE and each lane cut into 10 slices. The protein bands were then in-gel digested with trypsin (Thermo) overnight at 37°C. The peptides were extracted following cleavage and lyophilized. The dried peptides were solubilized in 2% acetonitrile, 0.5% acetic acid, 97.5% water for mass spectrometry analysis. They were trapped on a trapping column and separated on a 75 µm x 15 cm, 2 µm Acclaim PepMap reverse phase column (Thermo Scientific) using an UltiMate 3000 RSLCnano HPLC (Thermo Scientific). Peptides were separated at a flow rate of 300 nl/min followed by online analysis by tandem mass spectrometry using a Thermo Orbitrap Fusion mass spectrometer. Peptides were eluted into the mass spectrometer using a linear gradient from 96% mobile phase A (0.1% formic acid in water) to 55% mobile phase B (0.1% formic acid in acetonitrile) over 30 min. Parent full-scan mass spectra were collected in the Orbitrap mass analyzer set to acquire data at 120,000 FWHM resolution; ions were then isolated in the quadrupole mass filter, fragmented within the HCD cell (HCD normalized energy 32%, stepped ±3%), and the product ions analyzed in the ion trap. Proteome Discoverer 2.0 (Thermo) was used to search the data against human proteins from the UniProt database using SequestHT. The search was limited to tryptic peptides, with maximally two missed cleavages allowed. Cysteine carbamidomethylation was set as a fixed modification, and methionine oxidation set as a variable modification. The precursor mass tolerance was 10 ppm, and the fragment mass tolerance was 0.6 Da. The Percolator node was used to score and rank peptide matches using a 1% false discovery rate.
Generation of S1-tagged PINCR line
Request a detailed protocolFor PINCR tagging, we used integration by Non-homologous end joining, which was accomplished by introducing a simultaneous double-strand break in genomic DNA and in the targeting vector at the 5’ of the S1-tag (Brown et al., 2016). Plasmids encoding spCas9 and sgRNAs were obtained from Addgene (Plasmids #41815 and #47108). Oligonucleotides for construction of sgRNAs were obtained from Integrated DNA Technologies, hybridized, phosphorylated and cloned into the sgRNA plasmid or targeting vector using BbsI sites (Brown et al., 2017). Target sequences for sgRNAs are provided in Supplementary file 6.
We prepared the targeting vector by first synthesizing two complementary oligonucleotides (IDT) with the sequence of the S1 tag followed by the sequence of RP3-326I13.1 located at the 3’ of the sgRNA-binding site, which potentially contains the native elements for termination of transcription. The oligonucleotides were dimerized, phosphorylated and cloned into the targeting vector using T4 ligase. Subsequently, we introduced at the 5’ of the S1 tag the sequence targeted by the RP3-326I13.1 sgRNA. The targeting vector also contained an independent PuroR expression cassette driven by a PGK promoter for facile isolation of clonal populations of cells that integrate the plasmid within the genome. The sequence of the targeting vector is provided in Figure 8—figure supplement 2. HCT116 cells were transfected with 300 ng Cas9, 300 ng of sgRNA and 300 ng of targeting vector using Lipofectamine 2000 (Invitrogen) according to the manufacturer’s instructions in 24-well plates. Three days after transfection, the cells were selected with 0.5 µg/ml Puromycin to generate clonal populations.
Genomic DNA from each clone was isolated using DNEasy Blood and Tissue Kit (Qiagen). PCRs to detect integration of the targeting vector at the target site were performed using KAPA2G Robust PCR kits (Kapa Biosystems) according to the manufacturer’s instructions. A typical reaction contained 20–100 ng of genomic DNA in Buffer A (5 µl), Enhancer (5 µl), dNTPs (0.5 µl), primers forward (PINCR Det FP, 1.25 µl) and reverse (Targeting vector Det RP, 1.25 µl) and KAPA2G Robust DNA Polymerase (0.5 U). The DNA sequences of the primers for each target are provided in Supplementary file 5. PCR products were visualized in 2% agarose gels and images were captured using a ChemiDoc-It2 (UVP). The PCR products were cloned into TOPO-TA cloning (ThermoFisher) and sequenced.
RNA pulldowns from S1-tagged PINCR cells
Request a detailed protocolFor immunoprecipitation experiments, HCT116 clonal cell lines expressing PINCR or PINCR-S1 RNA were treated with 5-FU for 24 hr to induce PINCR expression. 2 × 10⁷ cells were lysed in lysis buffer (150 mM NaCl, 50 mM Tris-HCl pH 7.5, 0.5% Triton X-100, 1 mM PMSF, Protease inhibitor cocktail and RNase inhibitor). Lysates were sonicated three times for 5 s and centrifuged at 14,000 x g at 4°C for 30 min. For IP, 500 µg of cellular extract was incubated overnight at 4°C with 25 µl Dynabeads M-280 Streptavidin (Thermo Fisher Scientific). Beads were washed twice with high salt buffer (0.1% SDS, 1% Triton-X-100, 2 mM EDTA, 20 mM Tris-HCl pH 8 and 500 mM NaCl) followed by low salt buffer (0.1% SDS, 1% Triton-X-100, 2 mM EDTA, 20 mM Tris-HCl pH 8 and 150 mM NaCl) and TE buffer (10 mM Tris-HCl pH 8 and 2 mM EDTA). Bound proteins were eluted by boiling the samples for 5 min in SDS-PAGE sample buffer. Eluted proteins were subjected to SDS-PAGE and immunoblotting with Matrin 3 (Bethyl labs) or β-Tubulin (Cell Signaling, Catalog # 2146S). Enrichment of PINCR RNA levels in the pulldown material was evaluated by directly adding Trizol to the beads, followed by RNA extraction and qRT-PCR.
To test the binding of PINCR to the chromatin, PINCR and PINCR-S1 cells were treated with 5-FU for 24 hr to induce PINCR expression. Chromatin was cross-linked with 1% formaldehyde, and cells were lysed and sonicated in Buffer B (1% SDS, 10 mM EDTA, 50 mM Tris-HCl pH 8, Protease inhibitor and RNase inhibitor). RNA-DNA-protein complexes were immunoprecipitated with Dynabeads M-280 Streptavidin, overnight using IP buffer (0.01% SDS, 0.5% Triton-X-100, 1.2 mM EDTA, 16.7 mM Tris-HCl pH 8 and 167 mM NaCl). Beads were washed twice with high-salt buffer followed by TE buffer. Bound RNA-DNA-protein complexes were eluted from the beads using elution buffer (100 mM NaCl, 50 mM Hepes pH 7.4, 0.5% NP40, 10 mM MgCl2 and 5 mM Biotin), at room temperature for 20 min. Eluted material was incubated at 65°C for 2 hr (200 mM NaCl) to reverse crosslink the bound proteins. The samples were treated with Proteinase K and eluted DNA was column purified (Qiagen) and analyzed by qPCR using primers flanking the p53-binding sites of different genes (Supplementary file 5).
To test if PINCR binding to the chromatin is p53 and/or Matrin-3-dependent, PINCR-S1 cells were reverse transfected with CTL siRNAs, p53 siRNAs or two independent Matrin 3 siRNAs. After 48 hr, the cells were treated with 5-FU for 24 hr. The enrichment of PINCR-S1 at the promoter and enhancer regions of PINCR targets was determined by ChIP-qPCR followed by streptavidin pulldown as described above.
Microarray analysis
Request a detailed protocolFor lncRNA profiling HCT116, SW48 and RKO cells were untreated or treated with Nutlin-3 in duplicate for 8 hr. Total RNA was isolated using the RNeasy Mini kit (Qiagen) and hybridized to Affymetrix HT2.0 arrays that contain probes for ~11,000 lncRNAs. To identify the PINCR-regulated transcriptome PINCR-WT and PINCR-KO cells were untreated or treated with 5-FU (100 uM) for 24 hr. RNA samples were prepared as described above in triplicates and labeled using the IlluminaTotalPrep RNA amplification kit (Ambion) and microarrays were performed with the HumanHT-12 v4 Expression BeadChip kit (Illumina). After hybridization, raw data were extracted with Illumina GenomeStudio software. Raw probe intensities were converted to expression values using the lumi package in Bioconductor with background correction, variance stabilization and quantile normalization. Differential expression between different conditions was computed by an empirical Bayes analysis of a linear model using the limma package in Bioconductor. Adjusted p-values were calculated with the Benjamini and Hochberg method, and differentially expressed genes were selected with adjusted p-value≤0.05 and a fold change ≥1.50.
All the microarray data for this study has been deposited in GEO. The Accession number is GSE90086 and the URL is https://www.ncbi.nlm.nih.gov/geo/query/acc.cgi?acc=GSE90086. The unpublished RNA-seq data (Li et al., unpublished) used in this study has been deposited in GEO. The Accession number is GSE79249 and the URL is https://www.ncbi.nlm.nih.gov/geo/query/acc.cgi?acc=GSE79249.
Luciferase reporter assays
Request a detailed protocolA 2 kb region upstream of the first exon of PINCR was PCR amplified (primer sequences in Supplementary file 5) using 100 ng genomic DNA from HCT116 cells and inserted into upstream of Firefly luciferase of pGL3 luciferase vector (Promega). To measure PINCR promoter activity, HCT116 cells were co-transfected with 100 ng of pGL3-empty vector or pGL3 expressing the PINCR promoter, along with pCB6-empty vector or pCB6 expressing p53, and 10 ng pRL-TK expressing Renilla luciferase. After 48 hr, luciferase activity was measured using the dual-luciferase reporter system (Promega).
A 2 kb PINCR promoter region (chrX: 43,034,255–43,036,255) with (WT-p53RE) and without (Δp53RE) the 20 bp p53RE (GCCCTTGTCTGGACATGCCC) was synthesized in pGL3 luciferase vector by GenScript. HCT116 cells were co-transfected with 100 ng of pGL3 expressing the WT or Δp53RE PINCR promoter and 10 ng pRL-TK expressing Renilla luciferase. After 48 hr, cells were left untreated or treated with DOXO for 24 hr and luciferase activity was measured using the dual-luciferase reporter system (Promega).
Flow cytometry, caspase-3 immunostaining, colony formation and cell proliferation assays
Request a detailed protocolFor cell cycle analysis, 3.0 × 10⁵ PINCR-WT and PINCR-KO cells were seeded per well of a 6-well plate. After 24 hr, cells were untreated or treated with 300 nM DOXO or 100 µM 5-FU or 400 ng/ml NCS or 10 µM Nutlin-3 and the samples were collected at the indicated times. Cells were fixed with ice-cold ethanol for 2 hr and stained with propidium iodide (Sigma) in the presence of RNase A (Qiagen). Cell cycle profiles were captured using FACS Calibur flow cytometer (BD Biosciences), and the data were analyzed using FlowJo software (FloJo, LLC).
To perform cell cycle analysis after Matrin 3 knockdown, PINCR-WT and PINCR-KO cells were reverse transfected with siCTL and two independent Matrin 3 siRNAs using RNAiMAX at a final siRNA concentration of 20 nM. After 48 hr, cells were untreated or treated with 300 nM DOXO or 100 µM 5-FU and cell cycle profiles were captured as described above. For cell cycle analysis after BTG2/GPX1/RRM2B knockdown, PINCR-WT HCT116 cells were reverse transfected with siCTL and two individual siBTG2, siGPX1 and siRRM2B using RNAiMAX at a final siRNA concentration of 20 nM. After 48 hr, cells were untreated or treated with 100 µM 5-FU and cell cycle profiles were captured as described above. Cell cycle analysis after PINCR knockdown using ASOs, HCT116 cells were reverse transfected with 50 nM CTL-ASO or PINCR-ASO. After 48 hr, cells were untreated or treated with 300 nM DOXO or 100 µM 5-FU and cell cycle profiles were captured as described above.
For caspase-3 immunostaining, 3.0 × 10⁵ PINCR-WT and PINCR-KO cells were seeded per well of a six-well plate. After 24 hr, cells were untreated or treated with DOXO for 72 hr and fixed with 4% paraformaldehyde for 10 min and permeabilized by 0.5% Triton X-100 for 10 min. Fixed cells were stained for 1 hr with primary antibodies anti-Mab414 (Covance, Catalog # MMS120P) for nuclear envelope and active caspase-3 (Cell Signaling, Catalog # 9661S) for apoptotic cells, followed by further staining with DAPI (blue) and secondary antibodies, anti-mouse 586 (orange; Alexa Fluor 586 goat anti-mouse IgG, Life Technology, Catalog # A11031) and anti-rabbit 488 (green; Alexa Fluor 488 donkey anti-rabbit IgG, life Technology, Catalog # A21206) for 1 hr. Images were taken by Ziess immunofluorescence microscope with x63 lens.
For colony formation on plastic, 3 × 10⁵ PINCR-WT and PINCR-KO HCT116 cells were seeded per well in six-well plates. After 24 hr, cells were untreated or treated with 100 nM or 300 nM DOXO or 10 µM, 50 µM or 100 µM 5-FU for 4 hr, following which the drug was washed-off and fresh medium was added. After a 4 hr recovery, cells were seeded in a 12-well plate at a density of 500 cells per well. After 2 weeks, colonies were fixed with ice-cold 100% methanol for 5 min, stained with crystal violet, and colonies were counted. For colony formation after ASO transfections, HCT116 cells were transfected with CTL-ASO and PINCR-ASO. After 48 hr, cells were untreated or treated with 100 µM 5-FU for 4 hr, following which the drug was washed-off and fresh medium was added. After a 4 hr recovery, cells were seeded in a 12-well plate at a density of 500 cells per well. After 2 weeks, colonies were fixed as described above. For long-term cell proliferation assays on plastic, 3 × 10⁵ PINCR-WT and PINCR-KO SW48 cells were seeded in 12-well plate. After 24 hr, cells were untreated or treated with 100 µM 5-FU for 7 days. After 7 days, cells were fixed with ice-cold 100% methanol for 5 min and stained with crystal violet.
PINCR overexpression lines and cell cycle analysis
Request a detailed protocolThe 2.2 kb transcript corresponding to PINCR RNA (NR_110387.1) was cloned into pCB6 vector using EcoR1/Xba1 restriction enzyme cloning sites. PINCR-KO cells were transfected with pCB6 empty vector (EV) or pCB6 vector expressing PINCR. After 48 hr, the cells were treated with neomycin and incubated at 37°C for 4–5 days, for selection of stably transfected cells. Total RNA was extracted from the pool of cells and expression of PINCR was analyzed using qRT-PCR. For cell cycle analysis, 3.0 × 10⁵ PINCR-KO cells expressing pCB6-EV or pCB6-PINCR were seeded per well in six-well plates. After 24 hr, cells were untreated or treated with 300 nM DOXO and the samples were collected at indicated times. FACS analysis was performed as described above.
To determine the effect of PINCR overexpression on cell cycle and gene regulation, HCT116 cells expressing PINCR or PINCR-S1 were transfected with pCB6 or pCB6-PINCR expressing PINCR. After 48 hr, cells were treated with DOXO or 5-FU for indicated times. Expression of PINCR and other target genes was analyzed using qRT-PCR and FACS was performed as described above.
Immunoblotting and immunoprecipitation
Request a detailed protocolTo measure apoptosis after 5-FU treatment PINCR-WT and PINCR-KO cells were untreated or treated with 5-FU (100 µM) for 48 hr. Similarly, to determine the levels of p53 and/or p21 or phospho-Rb in PINCR-WT and PINCR-KO cells, the cells were untreated or treated with 5-FU for 24 hr. Whole-cell lysates were prepared using radioimmunoprecipitation (RIPA) buffer containing protease inhibitor cocktail (Roche). Proteins were quantified using the bicinchoninic acid protein quantitation (BCA) kit (Thermo Scientific). For immunoblotting, 20 µg whole cell lysate per lane was loaded onto a 12% SDS-PAGE gel, transferred to nitrocellulose membrane and immunoblotted with anti-Cleaved PARP (Cell Signaling, Catalog # 2541), anti-p53 (DO-1) (Santa Cruz, Catalog # sc-126), anti-p21 (Santa Cruz, Catalog # sc-397), anti-Histone H3 (Cell Signaling, Catalog # 4620), anti-phospho-Rb (Cell Signaling, Catalog # 9307P, 9208P, 9301P) and anti-GAPDH (Cell Signaling, Catalog # 14C10).
To determine the p53 and Matrin 3 knockdown efficiency PINCR-WT cells were reverse transfected with CTL siRNAs or p53 siRNAs or Matrin 3 siRNAs (20 nM) respectively, and 48 hr after transfection cell lysates were prepared using RIPA buffer as described above, followed by immunoblotting with anti-p53, Matrin 3 (Bethyl labs Catalog # A300-591A) or GAPDH antibodies.
For co-immunoprecipitation experiments HCT116 cells were untreated or treated with 5-FU (100 µM) for 24 hr and whole cell lysates were prepared in RIPA buffer and centrifuged at 14,000 x g at 4°C for 30 min. For IP, 25 µl Pierce protein A/G magnetic beads (Thermo Scientific, Catalog # 88802) were incubated with 2 µg Matrin 3 antibody or IgG control (Santa Cruz, Catalog # sc-2027), for 4 hr at 4°C. Following this, 500 µg cellular extract was incubated for 4 hr at 4°C with A/G magnetic beads pre-coated with IgG or Matrin 3. Beads were washed 5 times at 4°C with RIPA buffer and samples were untreated or treated with RNase A and DNase for 30 min at 37°C. Bound proteins were eluted by boiling the samples for 5 min in SDS-PAGE sample buffer. Eluted proteins were subjected to SDS-PAGE and immunoblotting using anti-p53 DO-1 antibody. To perform reciprocal IP nuclear lysates were prepared from HCT116 cells as described before and Immunoprecipitation was done as discussed above. IgG control (Santa Cruz, Catalog # sc-2025) and DO-1 p53 antibodies were used for IP and anti-Matrin 3 antibody for immunoblotting.
To determine the association of PINCR to Matrin 3 in intact cells, 2 × 10⁷ HCT116 cells were treated with 5-FU (100 µM) for 24 hr and then cross-linked with 1% formaldehyde. Crosslinked cells were resuspended in Buffer B (1% SDS, 10 mM EDTA, 50 mM Tris-HCl pH 8, Protease inhibitor cocktail and RNAse inhibitor), followed by sonication. An aliquot of the sonicated cell lysates was subjected to IP using 2 µg IgG or Matrin 3 antibodies for 4 hr at 4°C on protein A/G magnetic beads, using IP buffer (0.01% SDS, 1.1% Triton X-100, 1.2 mM EDTA, 16.7 mM Tris-HCl pH 8, 167 mM NaCl). The IP material was washed twice with high salt buffer (0.1% SDS, 1% Triton-X-100, 2 mM EDTA, 20 mM Tris-HCl pH 8 and 500 mM NaCl) followed by TE buffer (10 mM Tris-HCl pH 8 and 2 mM EDTA). Bound RNA-protein complexes were eluted from the beads using elution buffer (0.1% SDS, 0.1M NaHCO3, RNase inhibitor), at 37°C for 15 min followed by reverse cross-linking at 65°C for 2 hr by with 200 mM NaCl. Matrin 3 bound RNAs were isolated by phenol-chloroform extraction (Ambion) followed by ethanol precipitation and qRT-PCR was used to determine the enrichment of p21 (negative control) and PINCR in the Matrin 3 IPs.
To determine the direct binding of PINCR to recombinant Matrin 3 (rMatrin 3), 200 ng of in vitro transcribed Bi-PINCR or Bi-LUC RNA was incubated with 500 ng recombinant Matrin 3 protein (Creative BioMart, Catalog # MATR3-15H) in 1X EMSA buffer (25 mM Tris-HCl pH 7.5, 150 mM KCl, 0.1% Triton-X-100, 100 µg/ml BSA, 2 mM DTT and 5% glycerol) at room temperature for 2 hr. RNA–protein complex was immunoprecipitated at room temperature for 2 hr, by using Dynabeads M-280 Streptavidin. Beads were washed five to six times with 1X EMSA buffer without glycerol and bound material was subjected to SDS-PAGE and immunoblotting for Matrin3. The following antibodies were used: anti-p53 (DO-1) 1: 1000 dilution from Santa Cruz Biotechnology; anti-Matrin 3 1:1000 dilution from Bethyl Laboratories; anti-Cleaved PARP and anti-GAPDH at 1:1000 dilution from Cell Signaling.
Chromatin IP assays
Request a detailed protocolChromatin IP was performed with the Active Motif ChIP kit (Active Motif, Carlsbad, CA, USA) as directed by the manufacturer. Briefly, 5 × 10⁷ HCT116 cells grown in 15-cm plates were untreated or treated with DOXO (300 nM) for 16 hr. Similarly, PINCR-WT and PINCR-KO cells were untreated or treated with 5-FU (100 µM) for 24 hr. Chromatin was cross-linked with 1% formaldehyde, and cells were lysed and sonicated. Protein–DNA complexes were immunoprecipitated with control IgG or anti-p53 (DO1) (Santa Cruz) or anti-Matrin 3 (Bethyl labs) antibody. The IP material was washed and heated at 65°C overnight to reverse crosslinks. ChIP DNA was column purified (Qiagen) and analyzed by qPCR. Primers flanking the p53 binding sites or the enhancer regions of different genes are listed in Supplementary file 5. To test if association of p53 to the promoter and enhancer regions is Matrin-3-dependent 5 × 10⁷ PINCR-WT cells were reverse transfected with CTL siRNAs and two independent Matrin 3 siRNAs. After 48 hr, cells were treated with 5-FU for 24 hr and enrichment of p53 at the promoter and enhancer regions of PINCR targets was determined by ChIP-qPCR as described above.
Bioinformatic analysis of ChIP-seq and Hi-C data
Request a detailed protocolIntegrative Genome Browser (IGV, software.broadinstitute.org/software/igv/) was used to download and visualize relevant ChIP-seq datasets from the ENCODE consortium data repository. Motif identification at CTCF peaks surrounding putative enhancer-gene pairs within insulated neighborhoods was gathered from the HOMER software package (http://homer.ucsd.edu/homer/ngs/). Genomic locations of p53 response elements were determined similarly from HOMER p53 motif datasets. Chromatin folding was inferred from 3D contact matrices calculated from in situ HiC data (Rao et al., 2014) and visualized using the Juicebox desktop application (Durand et al., 2016).
Data availability
-
Prosurvival long noncoding RNA PINCR regulates a subset of p53 targets in colorectal cancer cells by binding to Matrin 3Publicly available at NCBI Gene Expression Omnibus (accession no: GSE90086).
-
Identification of long noncoding RNAs regulated by p53Publicly available at NCBI Gene Expression Omnibus (accession no: GSE79249).
References
-
The Paradox of p53: what, how, and why?Cold Spring Harbor Perspectives in Medicine 6:a026328.https://doi.org/10.1101/cshperspect.a026328
-
Targeted gene activation using RNA-Guided nucleasesMethods in Molecular Biology 1468:235–250.https://doi.org/10.1007/978-1-4939-4035-6_16
-
Long non-coding RNAs: new players in cell differentiation and developmentNature Reviews Genetics 15:7–21.https://doi.org/10.1038/nrg3606
-
Glutathione peroxidase 1-deficient mice are more susceptible to doxorubicin-induced cardiotoxicityBiochimica Et Biophysica Acta (BBA) - Molecular Cell Research 1783:2020–2029.https://doi.org/10.1016/j.bbamcr.2008.05.027
-
MicroRNAs in the p53 network: micromanagement of tumour suppressionNature Reviews Cancer 12:613–626.https://doi.org/10.1038/nrc3318
-
Efficient detection of RNA-protein interactions using tethered RNAsNucleic Acids Research 39:e53.https://doi.org/10.1093/nar/gkq1316
-
p53 in survival, death and metabolic health: a lifeguard with a licence to killNature Reviews Molecular Cell Biology 16:393–405.https://doi.org/10.1038/nrm4007
-
Epigenetic regulation by long noncoding RNAsScience 338:1435–1439.https://doi.org/10.1126/science.1231776
-
MUNC, a long noncoding RNA that facilitates the function of MyoD in skeletal myogenesisMolecular and Cellular Biology 35:498–513.https://doi.org/10.1128/MCB.01079-14
-
PUMA, a novel proapoptotic gene, is induced by p53Molecular Cell 7:683–694.https://doi.org/10.1016/S1097-2765(01)00214-3
-
Insights into p53 transcriptional function via genome-wide chromatin occupancy and gene expression analysisCell Death and Differentiation 19:1992–2002.https://doi.org/10.1038/cdd.2012.89
-
OWEN: aligning long collinear regions of genomesBioinformatics 18:1703–1704.https://doi.org/10.1093/bioinformatics/18.12.1703
-
Genetic determinants of p53-induced apoptosis and growth arrestGenes and Development 10:1945–1952.https://doi.org/10.1101/gad.10.15.1945
-
Transcriptional control of human p53-regulated genesNature Reviews Molecular Cell Biology 9:402–412.https://doi.org/10.1038/nrm2395
-
Characterization of SAF-A, a novel nuclear DNA binding protein from HeLa cells with high affinity for nuclear matrix/scaffold attachment DNA elementsThe EMBO Journal 11:3431–3440.
-
An inducible long noncoding RNA amplifies DNA damage signalingNature Genetics 48:1370–1376.https://doi.org/10.1038/ng.3673
-
A BRCA1-interacting lncRNA regulates homologous recombinationEMBO Reports 16:1520–1534.https://doi.org/10.15252/embr.201540437
-
The basic domain of ATH5 mediates neuron-specific promoter activity during retina developmentMolecular and Cellular Biology 25:10029–10039.https://doi.org/10.1128/MCB.25.22.10029-10039.2005
-
p53 in health and diseaseNature Reviews Molecular Cell Biology 8:275–283.https://doi.org/10.1038/nrm2147
-
Tumor suppressive functions of p53Cold Spring Harbor Perspectives in Biology 1:a001883.https://doi.org/10.1101/cshperspect.a001883
Article and author information
Author details
Funding
National Cancer Institute (NIH IRP)
- Ashish Lal
The funders had no role in study design, data collection and interpretation, or the decision to submit the work for publication.
Acknowledgements
We thank Tom Misteli, Glenn Merlino, Susan Gottesman, Shiv Grewal, Curtis Harris and Javed Khan for their critical comments on the manuscript and Bert Vogelstein for the isogenic cell lines. This research was supported by the Intramural Research Program (AL, LW, LMJ) of the National Cancer Institute (NCI), Center for Cancer Research (CCR), NIH. KVP lab is supported by grants from NIH [GM088252] and American Cancer Society [RSG-11-174-01-RMC].
Ethics
Animal experimentation: This study was performed in strict accordance with the recommendations in the Guide for the Care and Use of Laboratory Animals of the National Institutes of Health. All animal studies were conducted under protocol LC-070 approved by the Animal Care and Use Committee of the National Cancer Institute, The Frederick National Laboratory and the Center for Cancer Research are accredited by AALAC International and follow the Public Health Service Policy for the Care and Use of Laboratory Animals.
Version history
- Received: November 12, 2016
- Accepted: May 20, 2017
- Accepted Manuscript published: June 5, 2017 (version 1)
- Version of Record published: June 14, 2017 (version 2)
Copyright
This is an open-access article, free of all copyright, and may be freely reproduced, distributed, transmitted, modified, built upon, or otherwise used by anyone for any lawful purpose. The work is made available under the Creative Commons CC0 public domain dedication.
Metrics
-
- 3,358
- views
-
- 608
- downloads
-
- 65
- citations
Views, downloads and citations are aggregated across all versions of this paper published by eLife.
Download links
A two-part list of links to download the article, or parts of the article, in various formats.
Downloads (link to download the article as PDF)
Open citations (links to open the citations from this article in various online reference manager services)
Cite this article (links to download the citations from this article in formats compatible with various reference manager tools)
Prosurvival long noncoding RNA PINCR regulates a subset of p53 targets in human colorectal cancer cells by binding to Matrin 3
eLife 6:e23244.
https://doi.org/10.7554/eLife.23244
Further reading
-
- Cancer Biology
Tyrosine kinase inhibitors (TKI) directed against MET have been recently approved to treat advanced non-small cell lung cancer (NSCLC) harbouring activating MET mutations. This success is the consequence of a long characterization of MET mutations in cancers, which we propose to outline in this review. MET, a receptor tyrosine kinase (RTK), displays in a broad panel of cancers many deregulations liable to promote tumour progression. The first MET mutation was discovered in 1997, in hereditary papillary renal cancer (HPRC), providing the first direct link between MET mutations and cancer development. As in other RTKs, these mutations are located in the kinase domain, leading in most cases to ligand-independent MET activation. In 2014, novel MET mutations were identified in several advanced cancers, including lung cancers. These mutations alter splice sites of exon 14, causing in-frame exon 14 skipping and deletion of a regulatory domain. Because these mutations are not located in the kinase domain, they are original and their mode of action has yet to be fully elucidated. Less than five years after the discovery of such mutations, the efficacy of a MET TKI was evidenced in NSCLC patients displaying MET exon 14 skipping. Yet its use led to a resistance mechanism involving acquisition of novel and already characterized MET mutations. Furthermore, novel somatic MET mutations are constantly being discovered. The challenge is no longer to identify them but to characterize them in order to predict their transforming activity and their sensitivity or resistance to MET TKIs, in order to adapt treatment.
-
- Cancer Biology
- Genetics and Genomics
Relapse of acute myeloid leukemia (AML) is highly aggressive and often treatment refractory. We analyzed previously published AML relapse cohorts and found that 40% of relapses occur without changes in driver mutations, suggesting that non-genetic mechanisms drive relapse in a large proportion of cases. We therefore characterized epigenetic patterns of AML relapse using 26 matched diagnosis-relapse samples with ATAC-seq. This analysis identified a relapse-specific chromatin accessibility signature for mutationally stable AML, suggesting that AML undergoes epigenetic evolution at relapse independent of mutational changes. Analysis of leukemia stem cell (LSC) chromatin changes at relapse indicated that this leukemic compartment underwent significantly less epigenetic evolution than non-LSCs, while epigenetic changes in non-LSCs reflected overall evolution of the bulk leukemia. Finally, we used single-cell ATAC-seq paired with mitochondrial sequencing (mtscATAC) to map clones from diagnosis into relapse along with their epigenetic features. We found that distinct mitochondrially-defined clones exhibit more similar chromatin accessibility at relapse relative to diagnosis, demonstrating convergent epigenetic evolution in relapsed AML. These results demonstrate that epigenetic evolution is a feature of relapsed AML and that convergent epigenetic evolution can occur following treatment with induction chemotherapy.


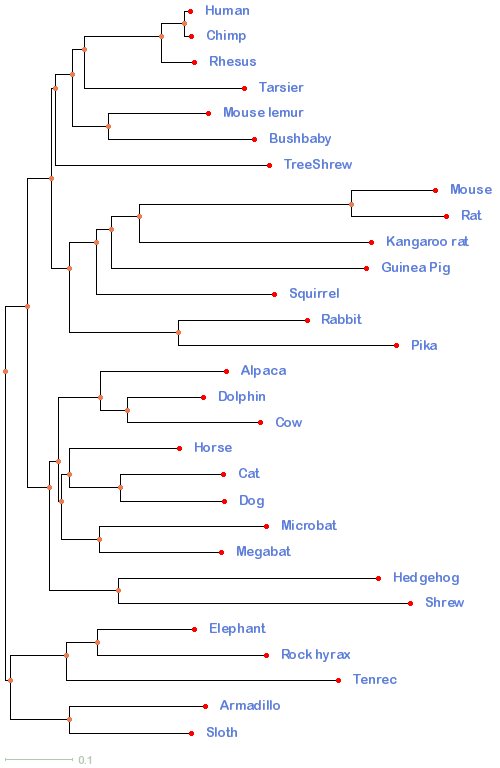