Longitudinal imaging of HIV-1 spread in humanized mice with parallel 3D immunofluorescence and electron tomography
- California Institute of Technology, United States
Figures
Figure 1
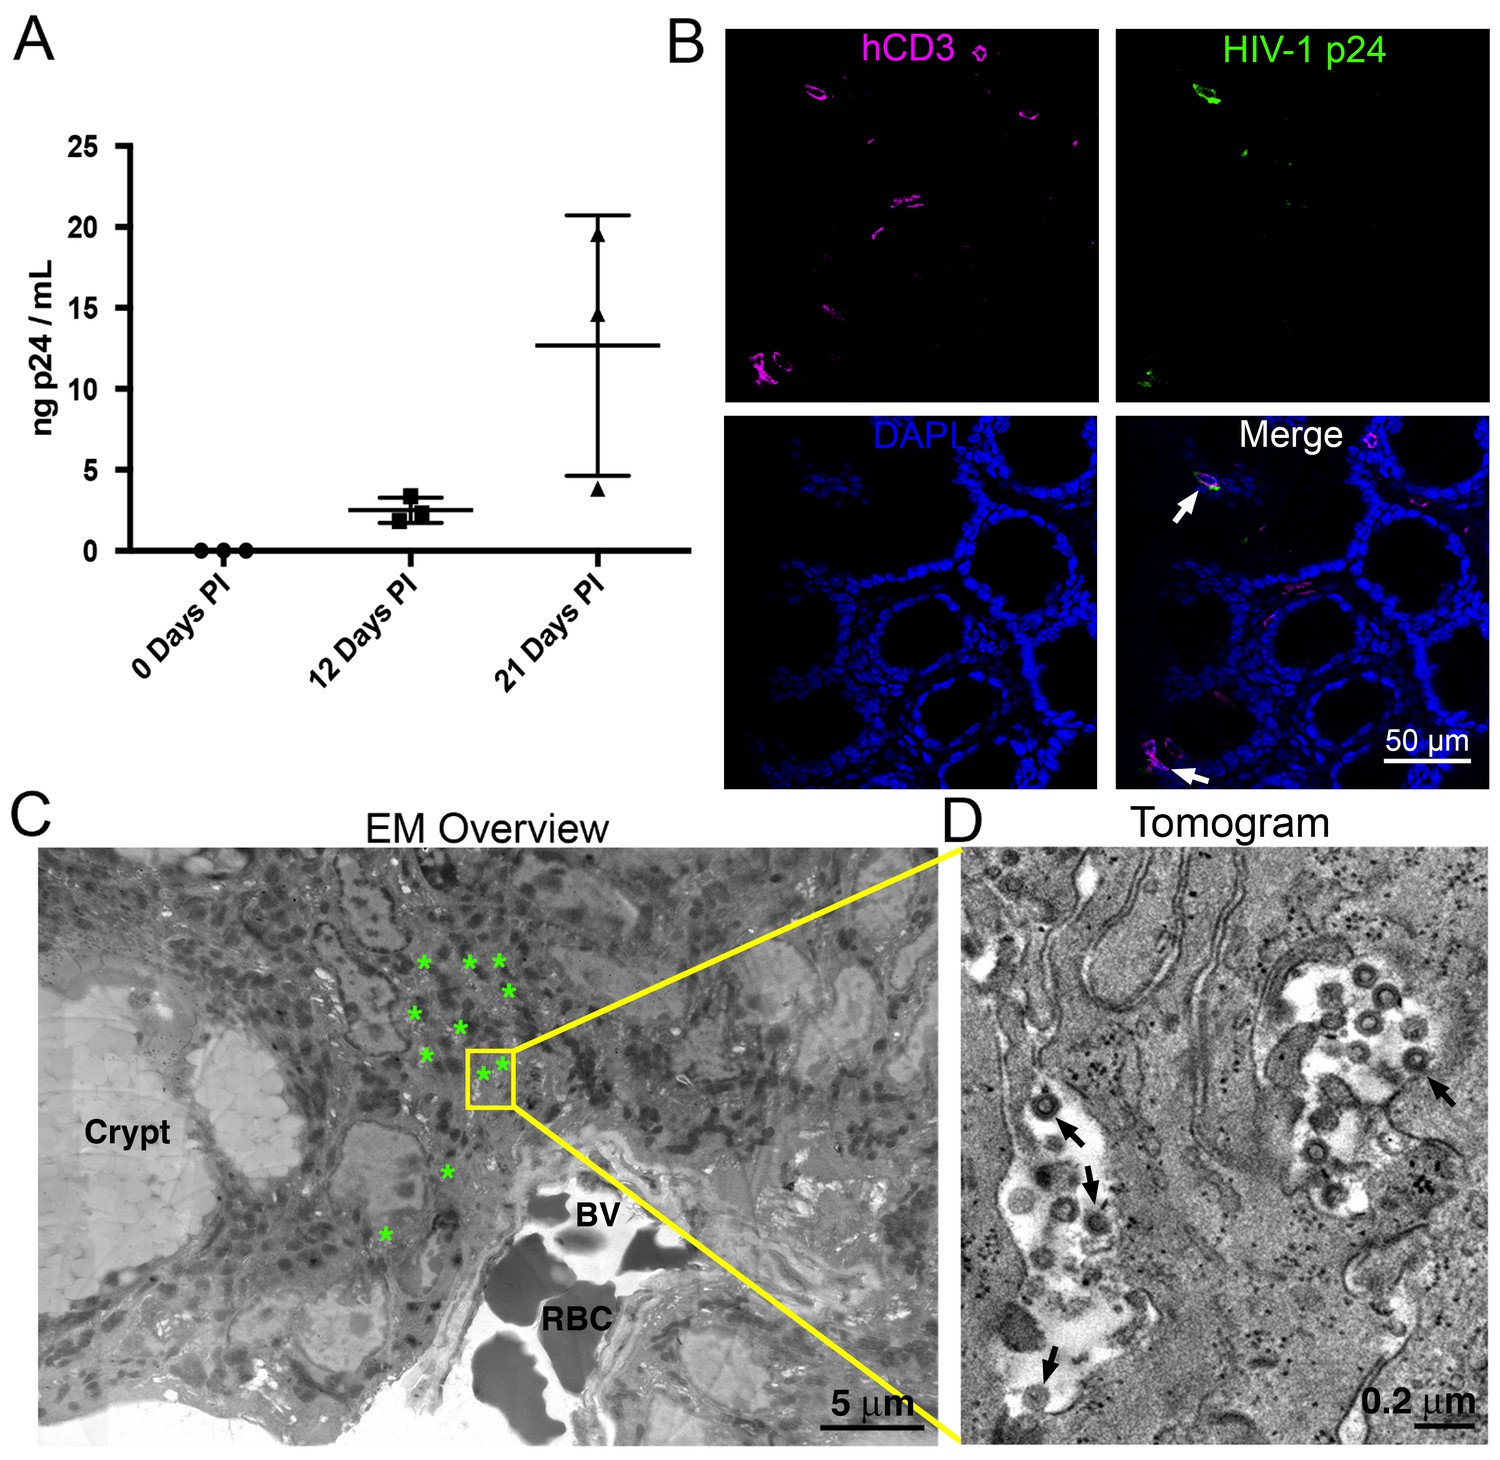
HIV-1 infection and Imaging of hu-mice.
(A) Mean blood p24 levels from three HIV-1–infected PBMC-NSG mice assessed at 0, 12, and 21 days PI. Error bars represent standard deviation. (B) IF of GALT from HIV-infected animal with highest blood p24 level from panel A at 21 days PI. Samples were stained for human CD3 (magenta), HIV-1 p24 (green), and nuclei (blue). White arrows indicate human CD3+/p24+ cells. (C) Montaged projection EM overview of colon crypt region from the same animal. Areas with virus are highlighted (green asterisks) along with a region of interest for imaging by ET (yellow box). Virus was found in close proximity to a blood vessel (BV) containing red blood cells (RBCs). (D) Tomographic slice of region of interest from panel C showing separate pools of free virus on two sides of an infected cell. Black arrows indicate budding virions.
-
Figure 1—source data 1
Source data for Figure 1A.
- https://doi.org/10.7554/eLife.23282.003
Figure 2
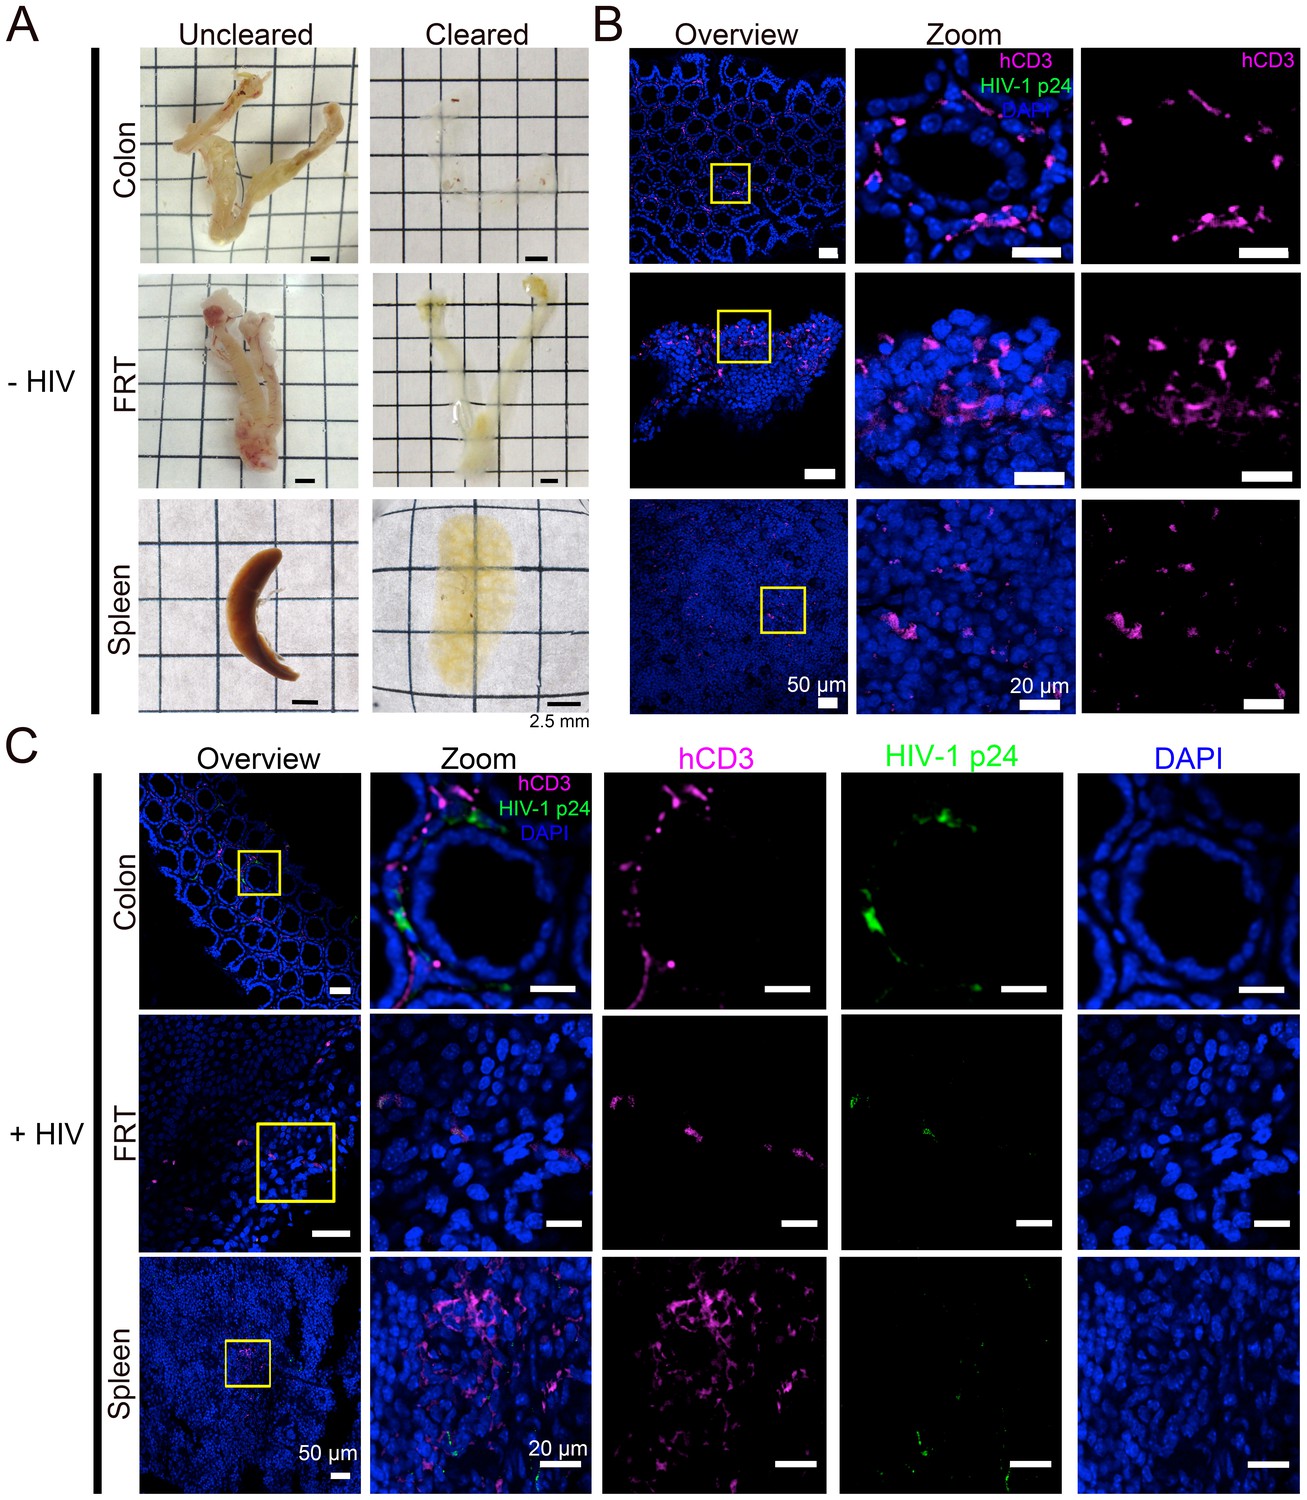
Tissue clearing and IF imaging of lymphoid tissues.
(A) Representative images of uncleared (left) and cleared (right) lymphoid tissues from uninfected hu-mice. (B, C) Confocal images of cleared lymphoid tissues from uninfected (panel B) and HIV-1–infected (28 days PI) (panel C) hu-mice stained with antibodies against human CD3 (magenta) and HIV-1 p24 (green). Nuclei were labeled with DAPI (blue). Scale bars for overview images = 50 μm. Scale bars for zoomed views = 20 μm.
Figure 3 with 1 supplement
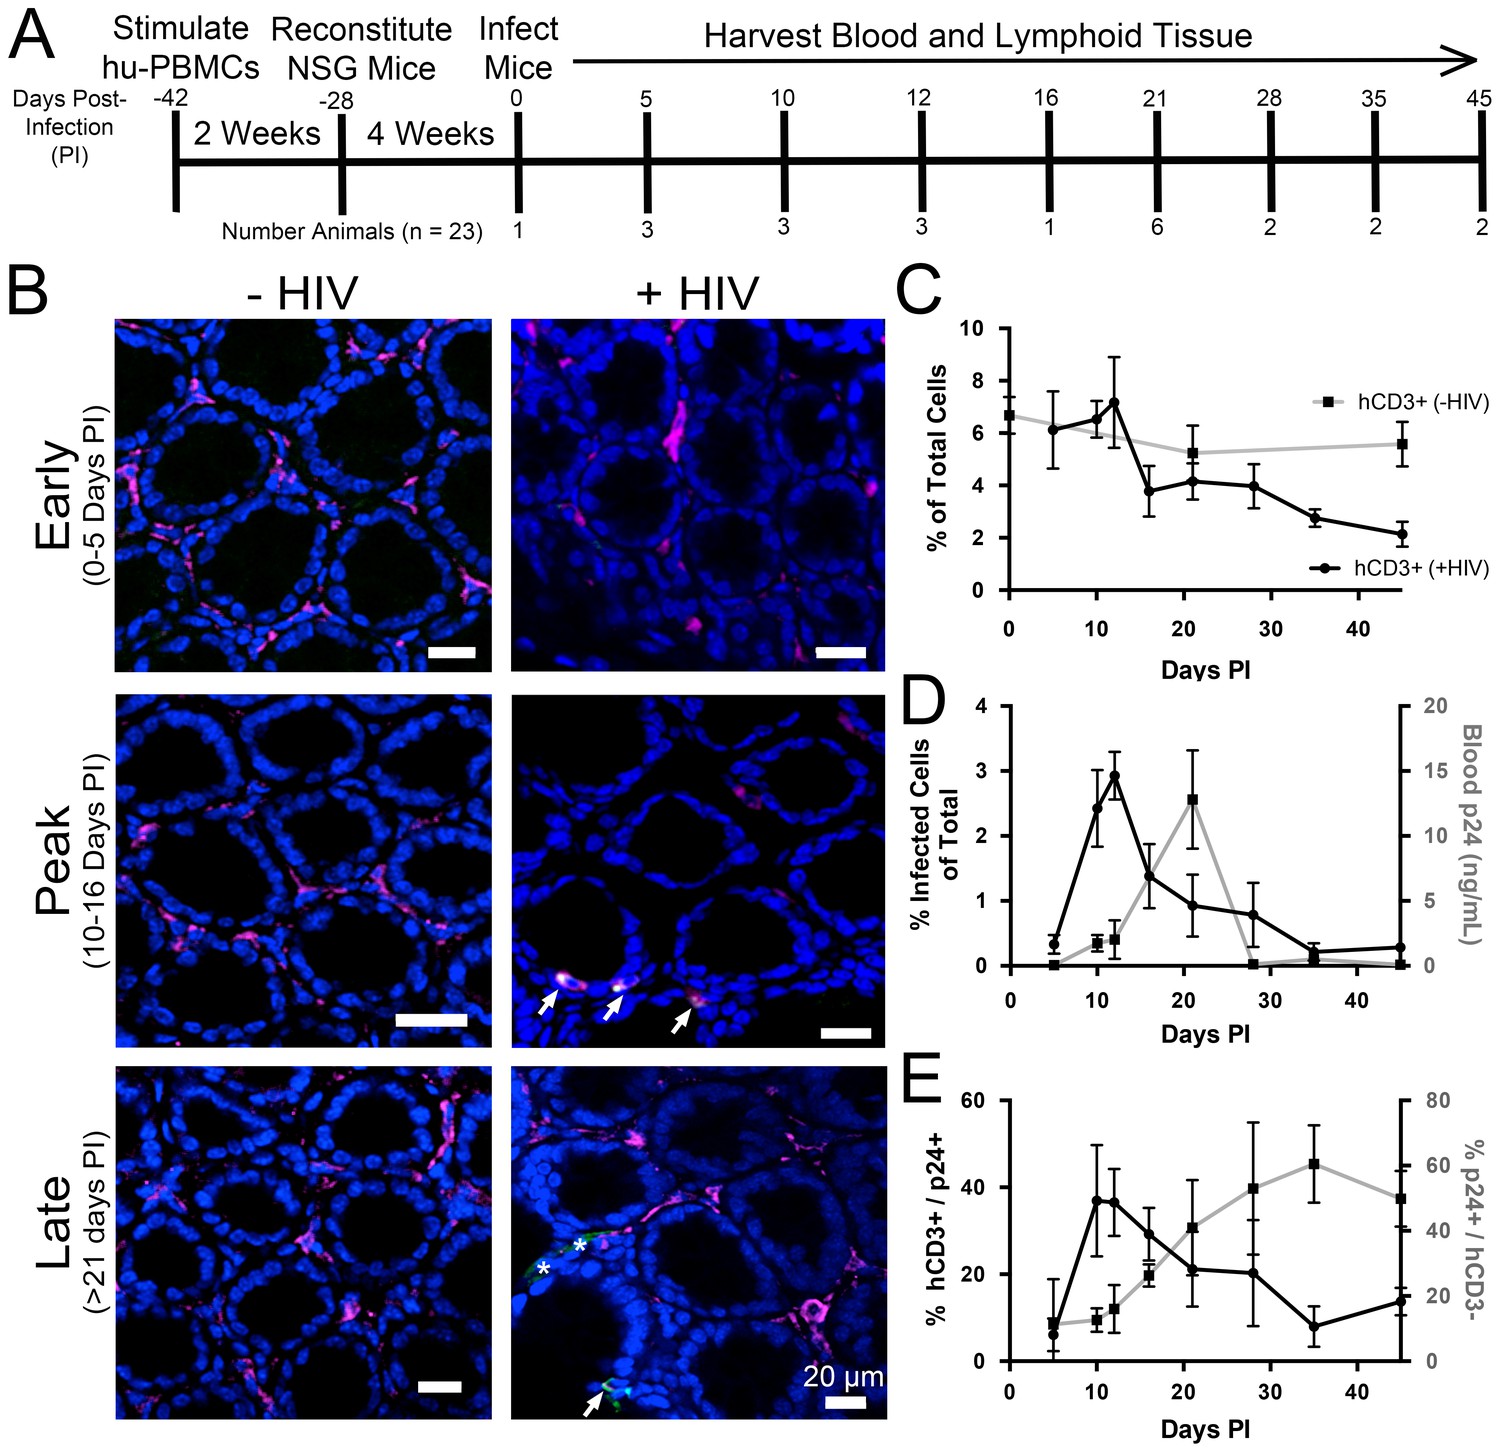
Longitudinal quantification of GALT infectivity.
(A) Timeline of immune cell reconstitution, HIV-1 infection, and tissue harvest from hu-mice. Top numbers depict days PI, bottom numbers show number of animals per timepoint. Single uninfected animals were sacrificed at 0, 21, and 45 days PI. All other animals were infected and sacrificed at the times indicated. (B) Representative images showing human CD3+ T-cells (magenta), HIV-1 p24 (green), and nuclei (blue) in colon at early (0–5-days PI), peak (10–16 days PI), and late (>21 days PI) infectivity. Arrows indicate infected cells. Asterisks show p24 not associated with human CD3+ T-cells. (C–E) Error bars represent standard deviation. n > 5000 cells from 1–3 animals for all time points. (C) Quantification of human CD3+ T-cells as the percent of total cells for HIV-1–infected (black line) or uninfected (gray line) animals. (D) Comparison of GALT infectivity as percent infected cells of total (black line, left Y-axis) with blood p24 (gray line, right Y-axis, ng/mL) levels over time. (E) Longitudinal profile of percent HIV-1 p24-positive human CD3+ T-cells (black line, left Y-axis) and percent of p24 signal not associated with human CD3+ T-cells (gray line, right Y-axis).
-
Figure 3—source data 1
Source data for Figure 3C.
- https://doi.org/10.7554/eLife.23282.006
-
Figure 3—source data 2
Source data for Figure 3D.
- https://doi.org/10.7554/eLife.23282.007
-
Figure 3—source data 3
Source data for Figure 3E.
- https://doi.org/10.7554/eLife.23282.008
Figure 3—figure supplement 1
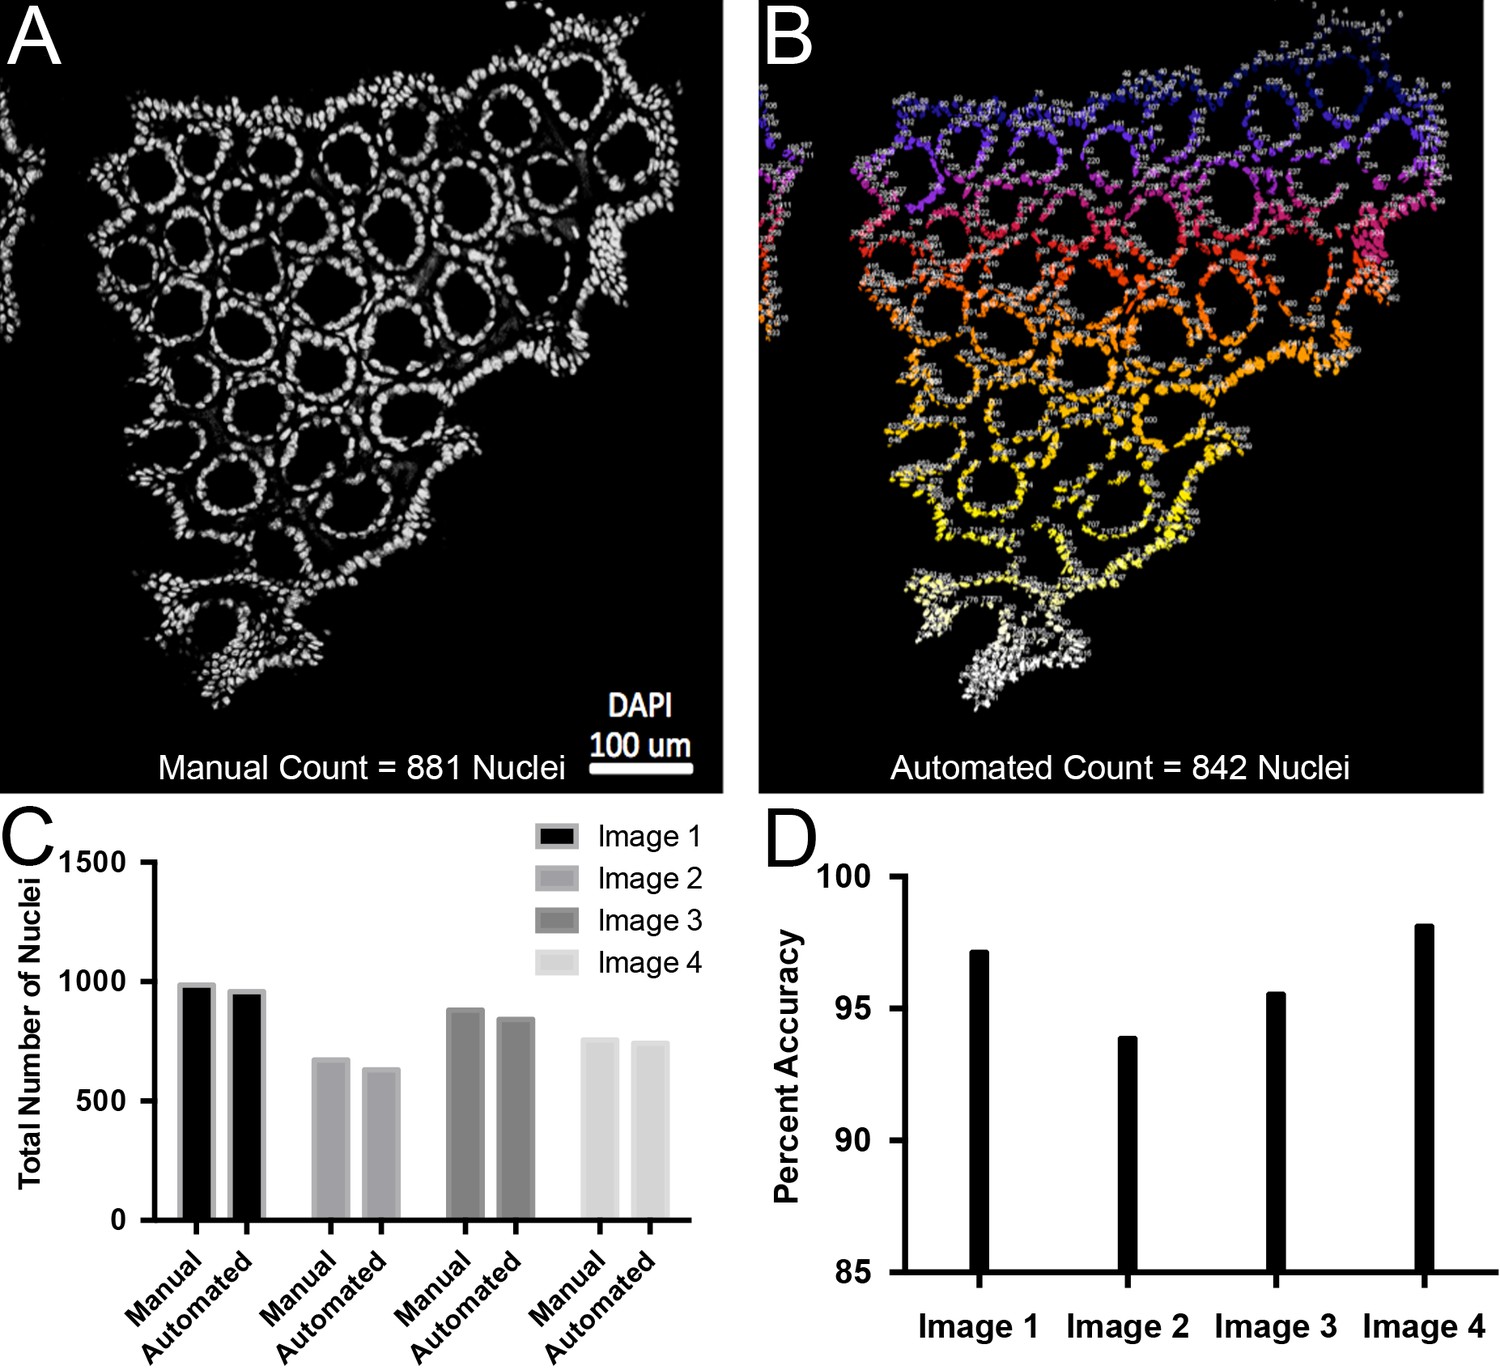
Validation of automated quantification of nuclei.
(A) Representative confocal slice of colon sample. Nuclei are white. 881 nuclei were manually counted. (B) Automated quantification of the image shown in panel A resulting in 842 nuclei. Low numbers in blue that progress to white for higher numbers. (C) Plots of total number of nuclei counted manually or computationally for four separate confocal slices. (D) Percent accuracy between manual and automated quantification for each image.
Figure 4
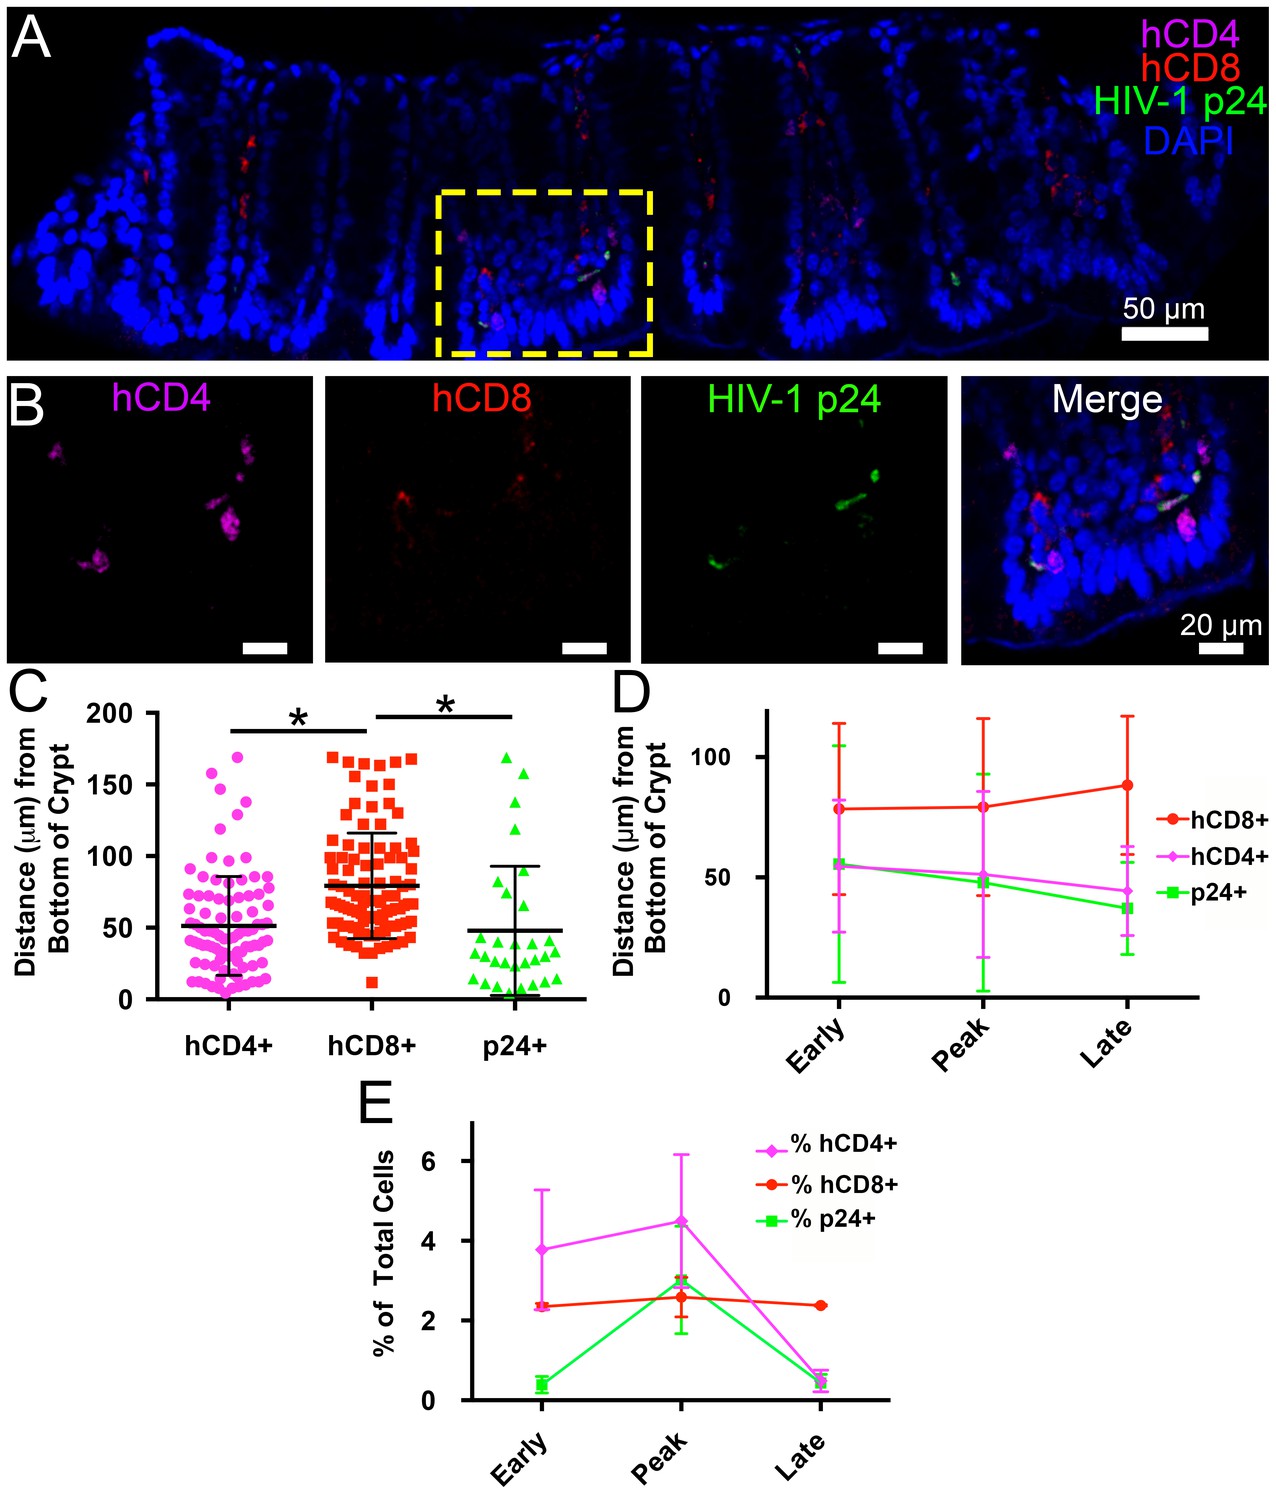
Spatial distribution of HIV-1 infection in GALT over time.
(A) Representative confocal slice from 45 μm Z-stack depicting the distribution of human CD4+ T-cells (magenta), HIV-1 p24 (green), human CD8+ T-cells (red) and nuclei (blue) in colon at 12-days PI. (B) Zoom of boxed region in panel A showing individual channels and merged view for human CD4+ T-cells, human CD8+ T-cells, and p24. (C–E) Error bars represent standard deviation. (C) Quantification of Z-stack from panel A showing the distance (μm) from the base of crypts of human CD4+ T-cells (magenta), human CD8+ T-cells (red), and p24+ T-cells (green) for the volume in panel A. * indicates p<0.0001 (unpaired t-test with Welch's correction, two-tailed). (D) Quantification of distance (μm) from the base of crypts for human CD4+ T-cells (magenta), human CD8+ T-cells (red), and p24+ T-cells (green) for individual volumes during times of early, peak, and late infectivity. n > 2000 total cells for each volume. (E) Quantification of CD4+ T-cells (magenta), human CD8+ T-cells (red), and p24+ T-cells (green) as a percentage of total cells at early, peak, and late infectivity times. n > 5000 total cells for each time point.
-
Figure 4—source data 1
Source data for Figure 4C.
- https://doi.org/10.7554/eLife.23282.011
-
Figure 4—source data 2
Source data for Figure 4D.
- https://doi.org/10.7554/eLife.23282.012
-
Figure 4—source data 3
Source data for Figure 4E.
- https://doi.org/10.7554/eLife.23282.013
Figure 5
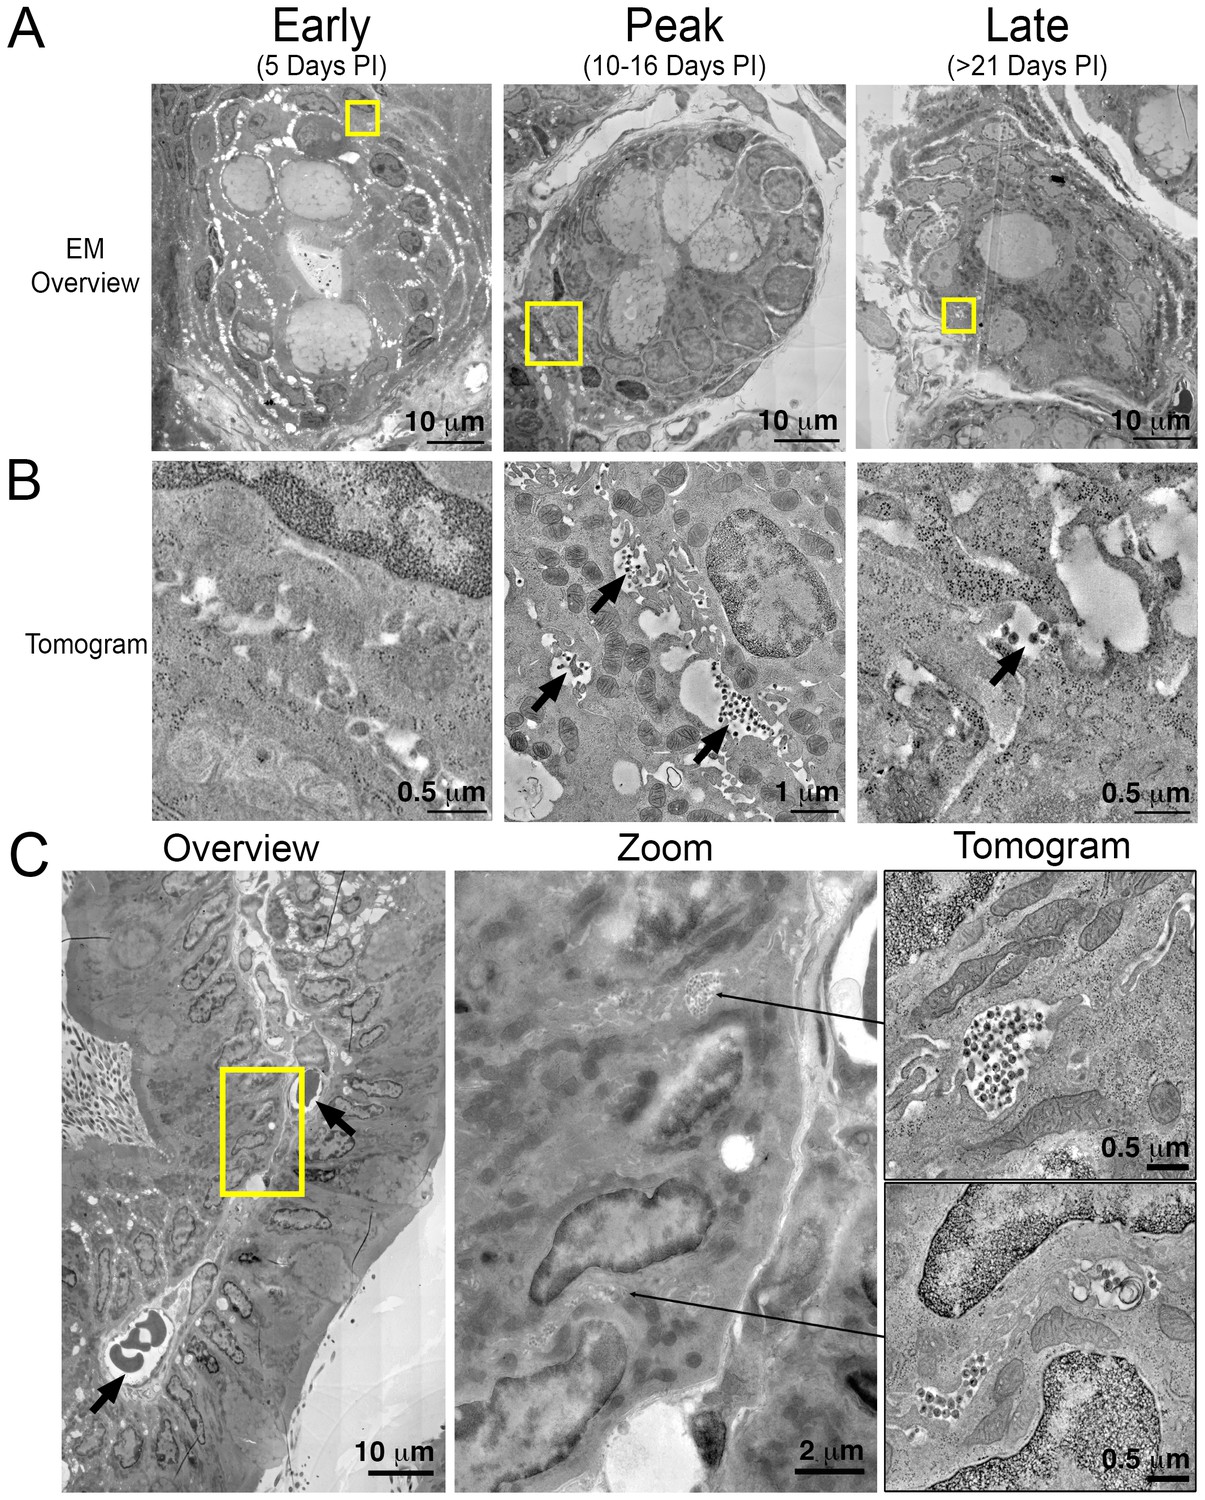
Electron tomography of longitudinal HIV-1 spread in GALT.
(A, B) Montaged overview EM projection images (panel A) and zoomed tomographic slices (panel B) of HIV-1–infected colon crypts from hu-mice from early (5 days), peak (10–16 days), and late (>21 days) time points PI. Arrows indicate pools of free virions between cells. (C) Lamina propria from HIV-1 infected GALT 10 days PI. Left: montaged overview EM projection image showing lamina propria in cross-section. Arrows indicate blood vessels containing red blood cells. Yellow box indicates zoomed region of interest depicted in middle panel. Zoomed region from overview reveals pools of virus adjacent to vasculature. Right: tomographic slices of two indicated regions (arrows) that reveal pools of virus contiguous with blood vessel walls connected by lateral intercellular space.
Figure 6 with 1 supplement
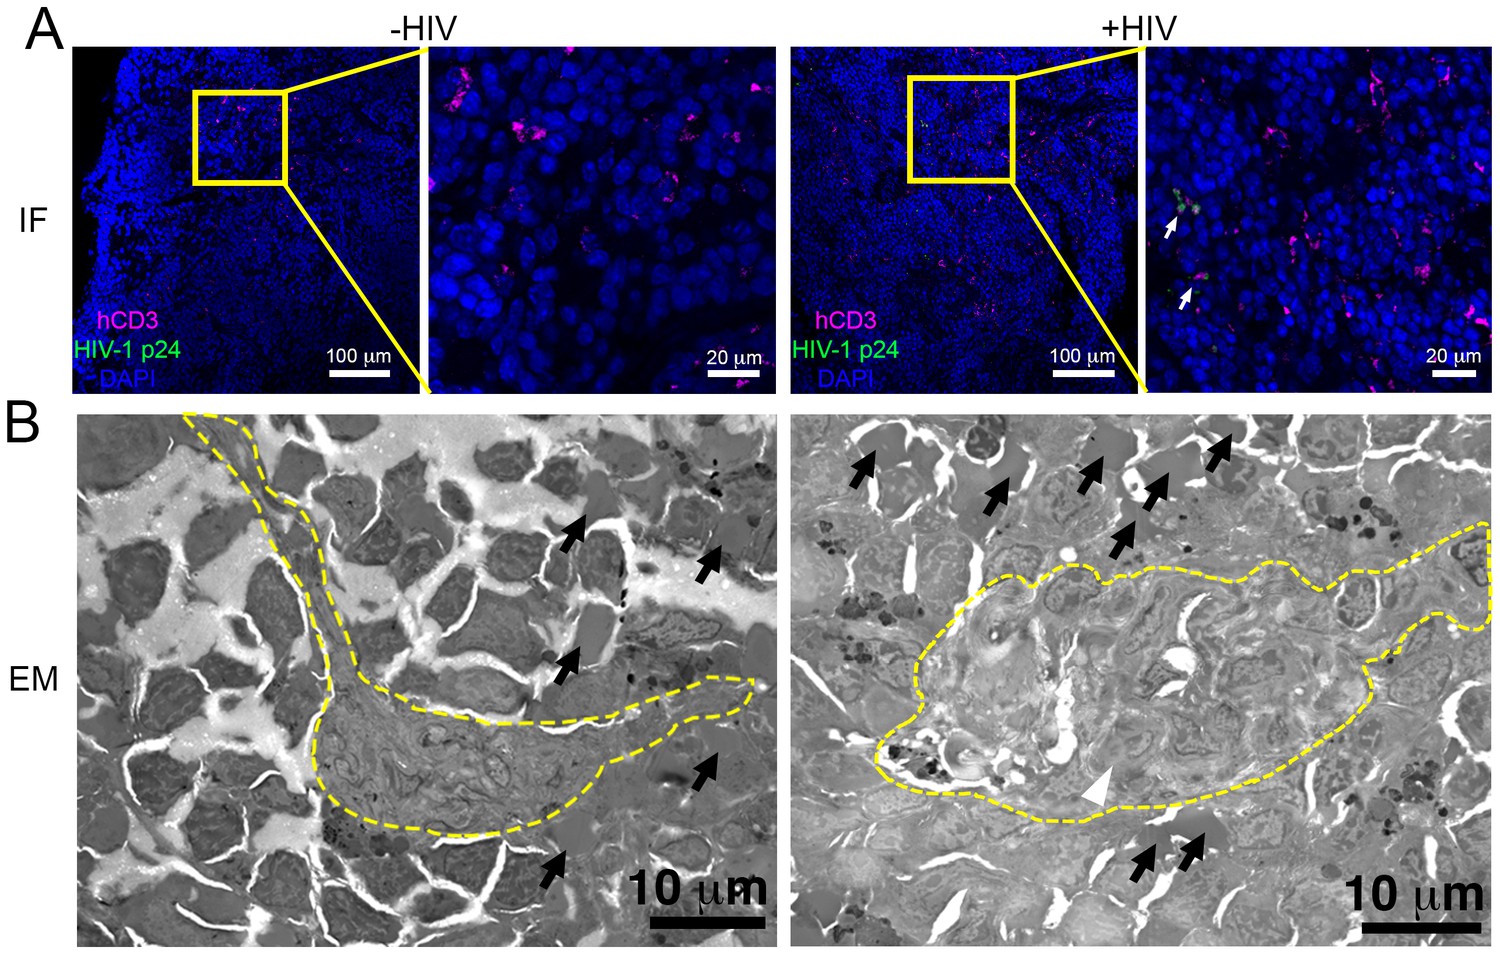
Parallel IF and ET of HIV-1 infection in spleen.
(A) Confocal IF images of cleared spleen showing human CD3+ T-cells (magenta), HIV-1 p24 (green), and nuclei (blue) from an uninfected (-HIV) or infected (+HIV) animal at 12-days PI. Yellow boxes indicate areas of zoomed views. White arrows indicate regions with p24. (B) Montaged overview EM projection images from adjacent regions of spleen from the same animals in A. Yellow dashed lines depict regions of white pulp, black arrows indicate red blood cells in a region of red pulp, white arrowhead shows an HIV-1-infected cell.
Figure 6—figure supplement 1
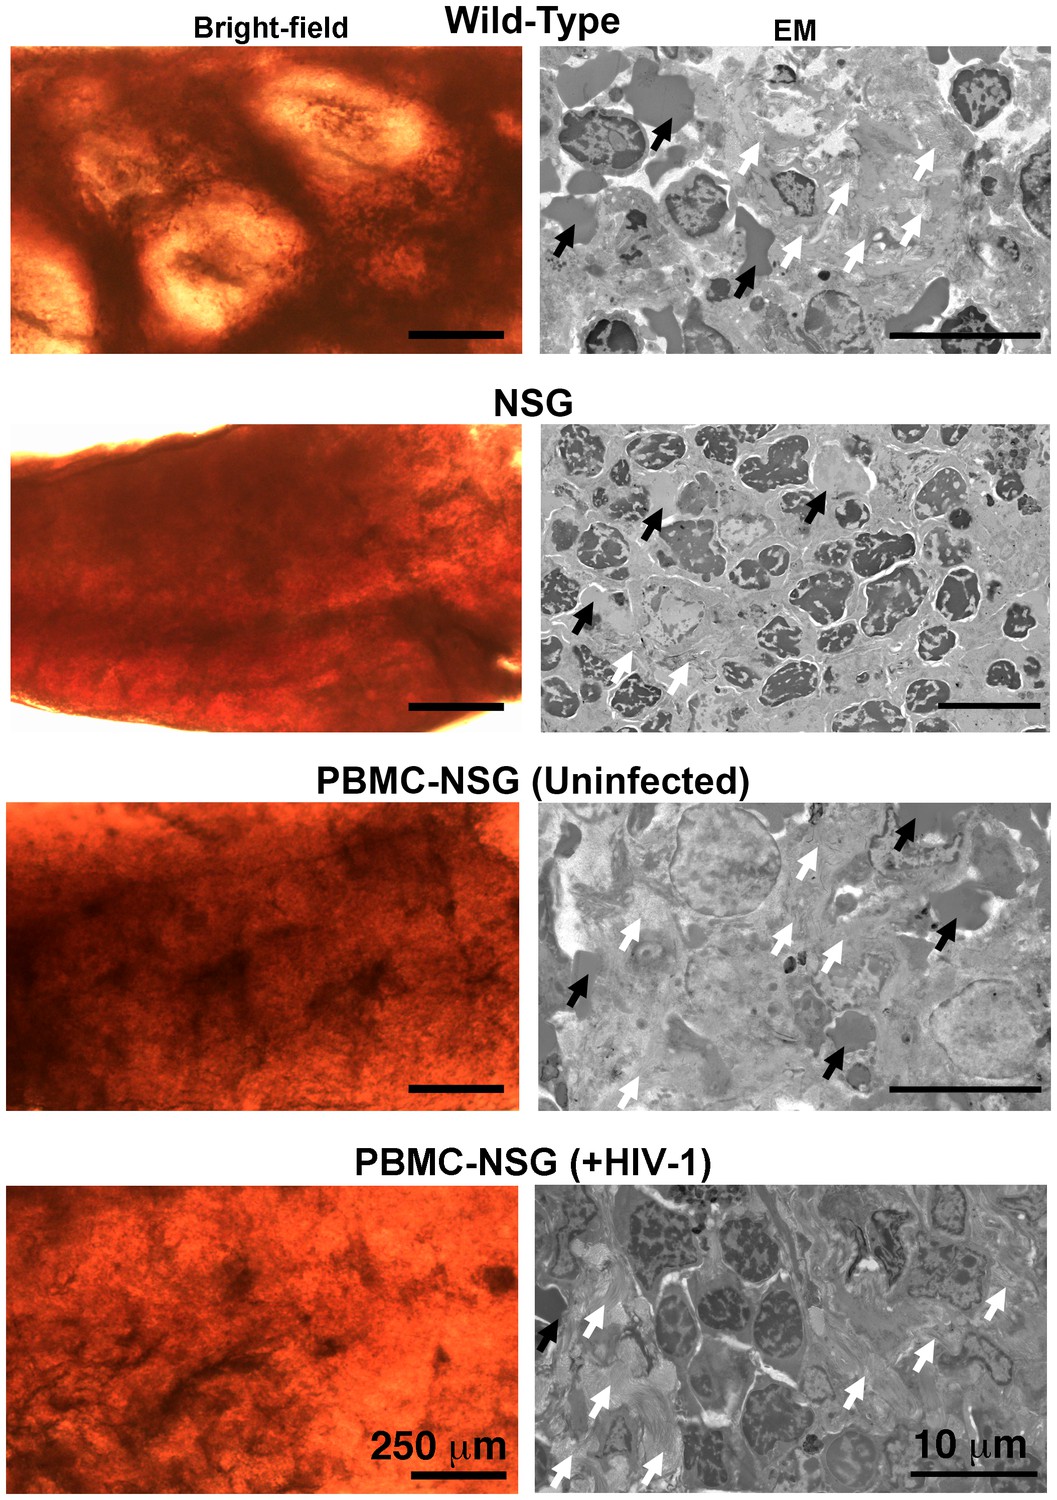
Architecture of the spleen in wildtype, NSG, and PBMC-NSG mice.
Bright-field microscopy images (left panels) of sections of fixed spleen from wildtype, NSG, PBMC-NSG, and HIV-1–infected PBMC-NSG mice. White pulp and red pulp are lighter colored and dark red regions, respectively. HIV-1–infected and uninfected PBMC-NSG animals displayed an intermediate level and organization of white pulp compared to wildtype and NSG animals of the same genetic background. EM images (right panels) from lighter colored white pulp regions of spleen from animals show in left panels. Red blood cells (black arrows) and collagen (white arrows) were identified in all samples. Wildtype spleen contained a greater variety of cell types and more collagen (white arrows) than NSG spleens, which were nearly devoid of white pulp and collagen. Uninfected and HIV-1–infected PBMC-NSG spleens revealed the presence of collagen and numerous cell types within regions of white pulp.
Figure 7
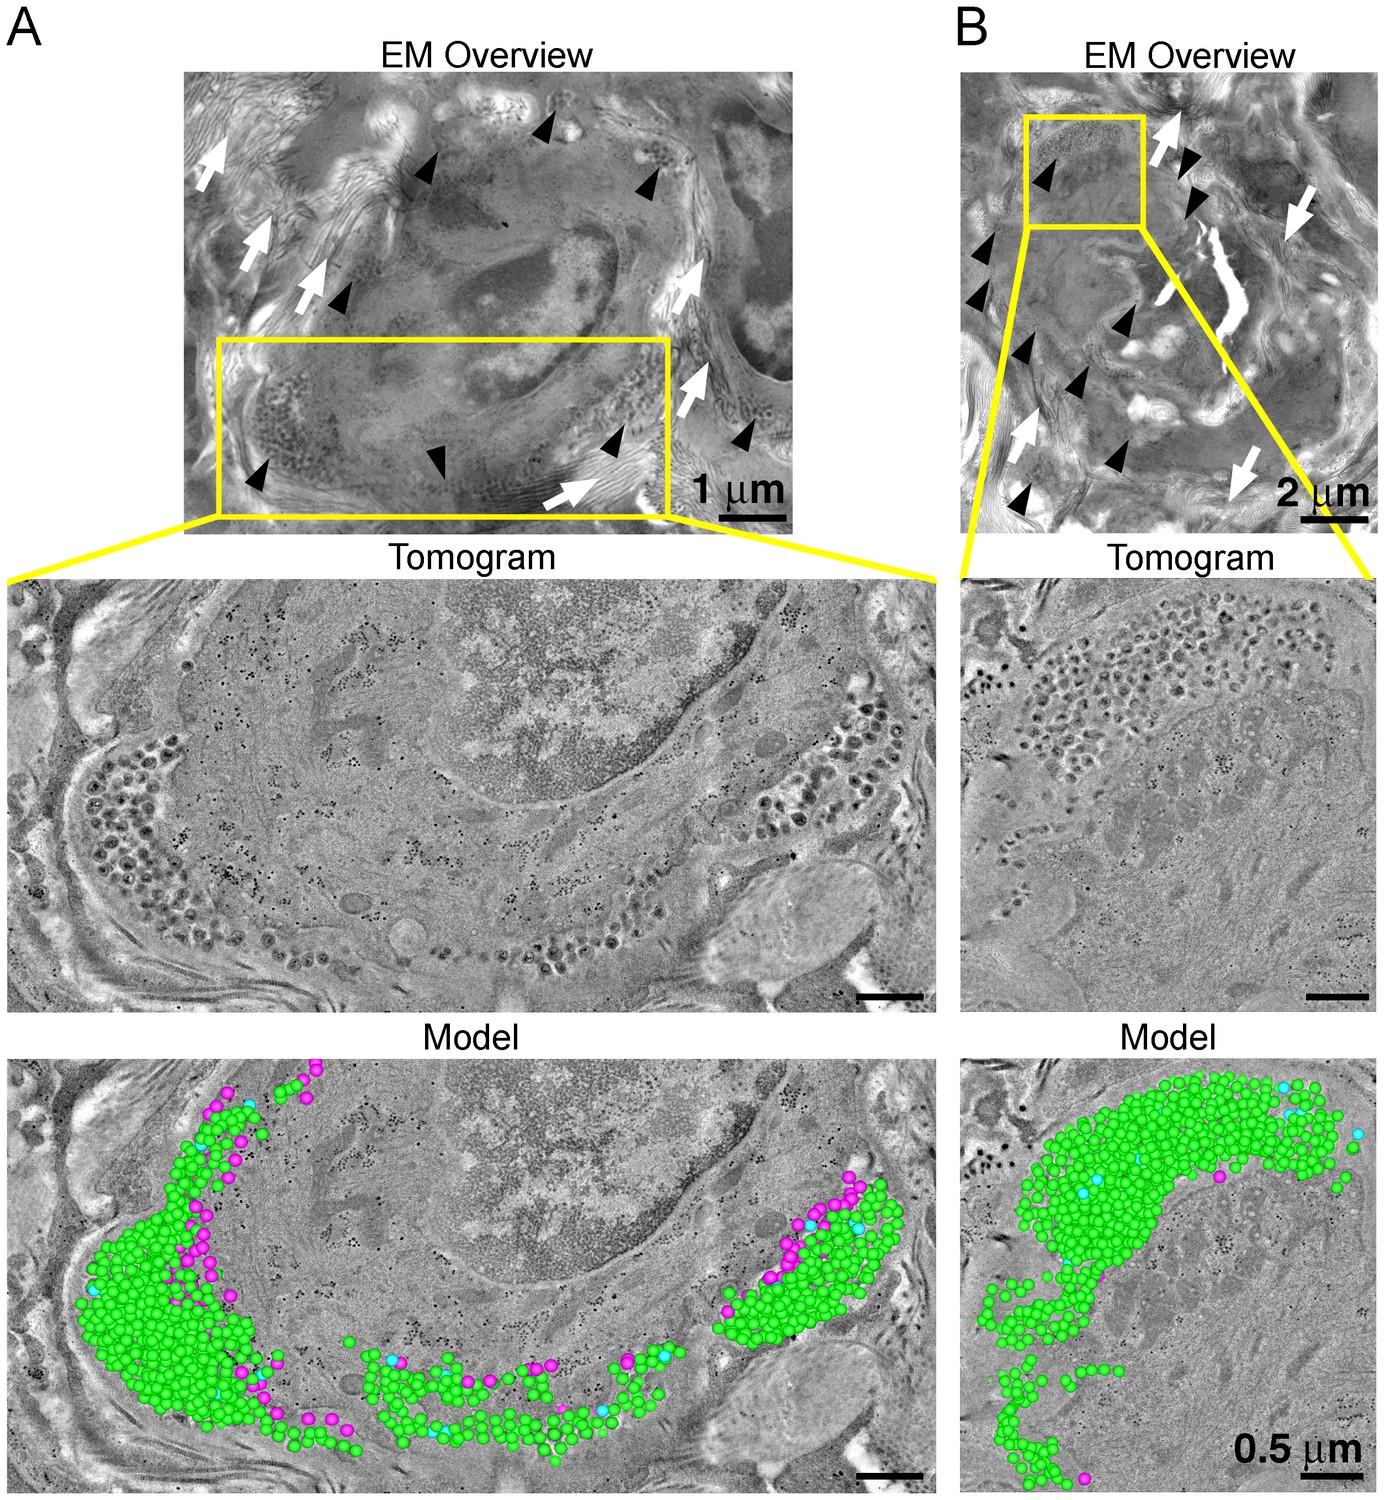
ET and modeling of HIV-1 Infection in spleen.
(A and B) EM projection images of HIV-1-infected cells from regions of spleen from an HIV-1-infected animal 12-days PI (top panels). Collagen fibrils (white arrows) and pools of virions (black arrows) surround the infected cells. Yellow boxes indicate regions of tomographic reconstruction. Tomographic slices show zoomed detail of infected cells (middle panels). Modeled mature (green), immature (blue), and budding (magenta) virions from the full volume of tomographic reconstructions (bottom panels). Scale bars for tomogram and model panels are 0.5 m.
Figure 8
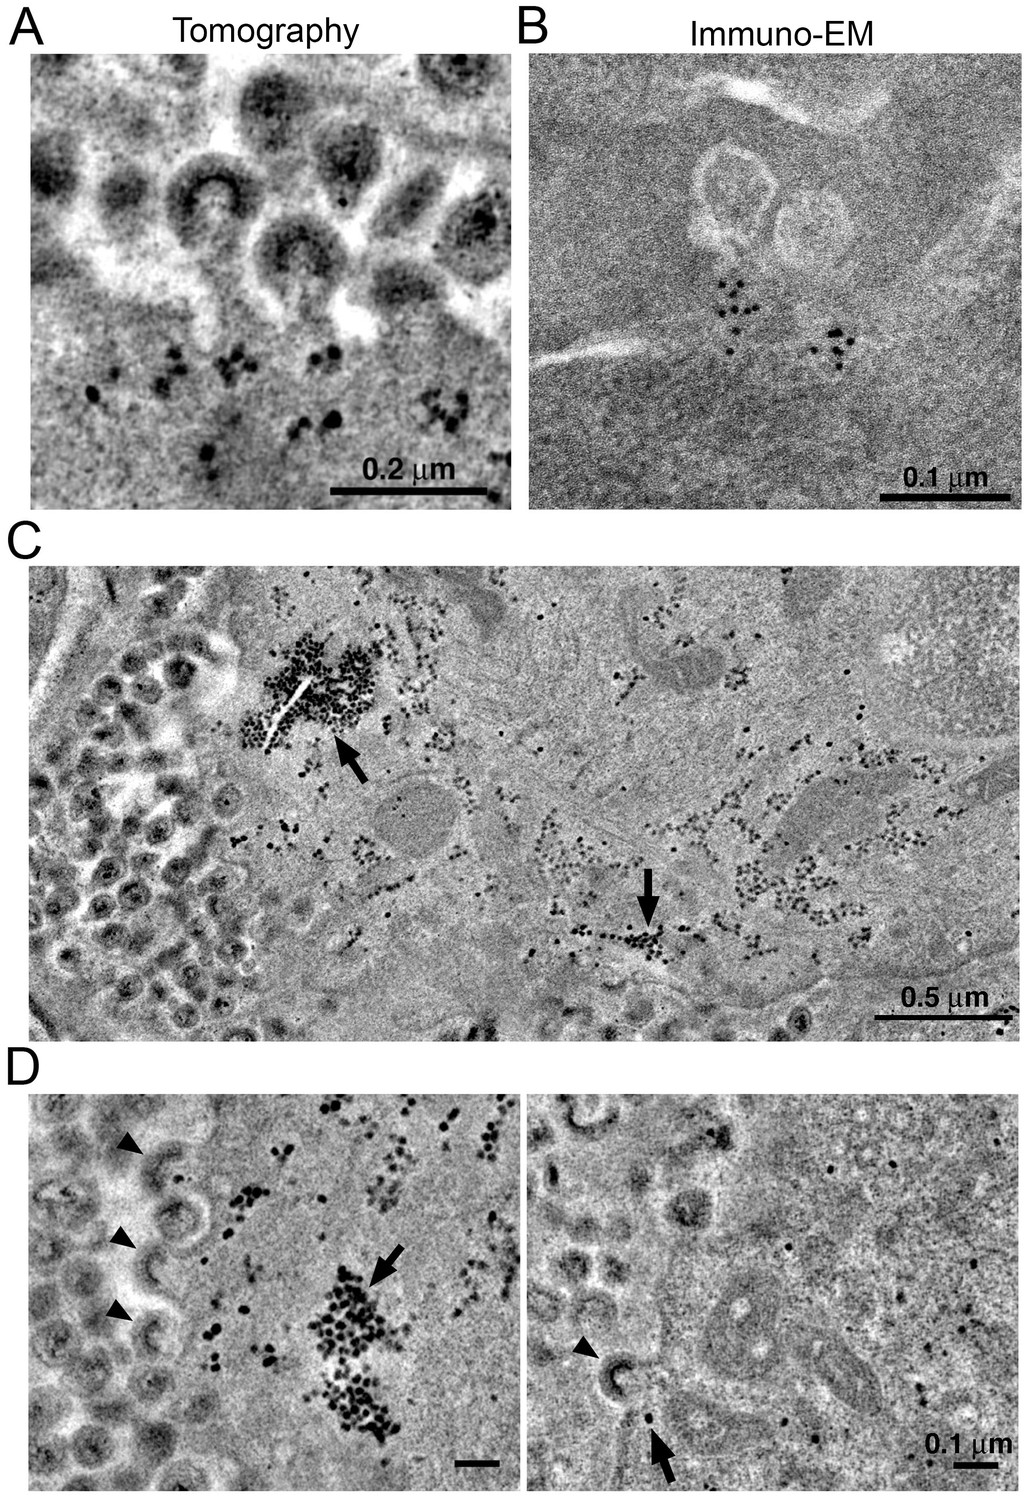
Localization of HIV-1 budding machinery.
(A) Densities localized to the base of budding virions. (B) Anti-VPS4A immuno-EM revealing localization patterns consistent with densities in panel A. (C) Tomographic slice of HIV-1–infected spleen 12 days PI showing large accumulations of densities (black arrows) adjacent to regions of prolific virus release. (D) Tomographic slices showing budding virions from the animal in panel C revealing prolific budding (left) or low levels of budding (right). Arrowheads indicate budding virions and arrows indicate densities.
Figure 9
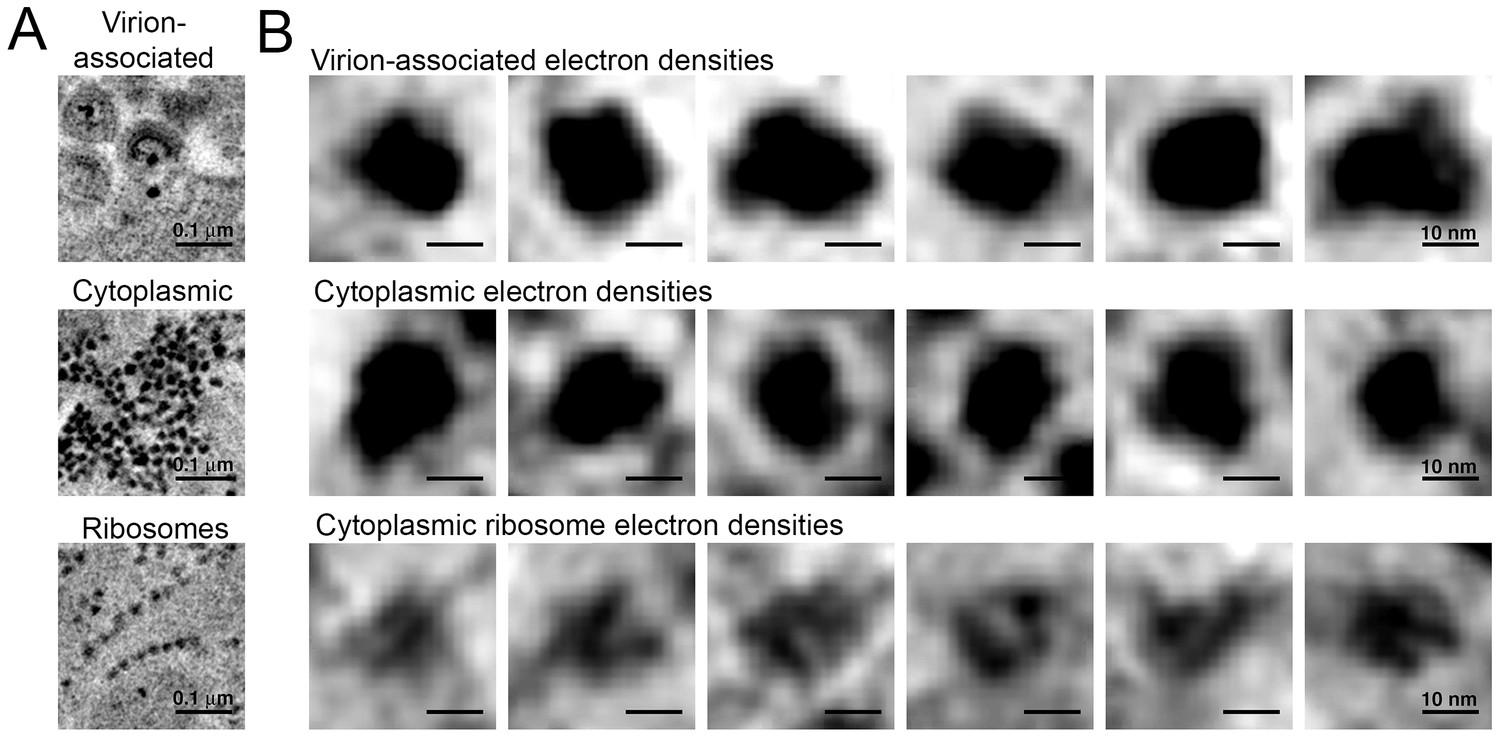
Comparison of virion-associated densities, cytoplasmic densities, and densities corresponding to cytoplasmic ribosomes.
(A) Representative tomographic slices of densities associated with budding virions (top), cytoplasmic pools near budding virions (middle), and cytoplasmic ribosomes. (B) Gallery of images with the same tomographic thickness (9.1 nm) for individual densities associated with budding virions (top), cytoplasmic pools near budding virions (middle), and cytoplasmic ribosomes. Dimensions of virion-associated and cytoplasmic densities were indistinguishable. Ribosomes contain a visible cleft between individual subunits that is absent in the densities associated with budding virions and cytoplasmic pools near areas of prolific virus production.
Author response image 1
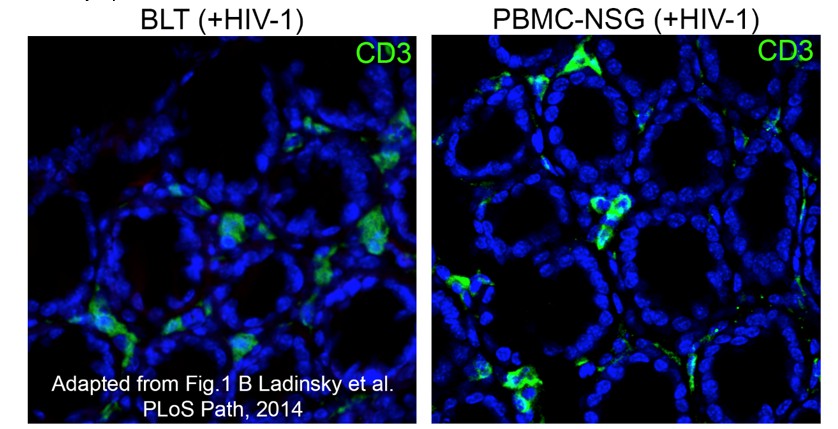
Equivalent IF confocal slices of colon crypts from HIV-1-infected BLT (left) or PBMC-NSG (right) hu-mice.
The density and localization of human CD3+ T cells (green) are similar in both models (blue = DAPI nuclear stain).
Author response image 2
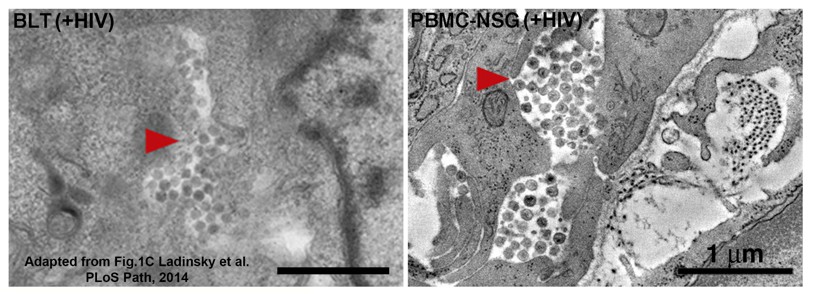
Equivalent tomographic slices of colon crypt regions from HIV-1-infected BLT (left) or PBMC-NSG (right) hu-mice.
Free virions are visible at similar levels and locations in both models (red arrows = pools of free virions).
Author response image 3
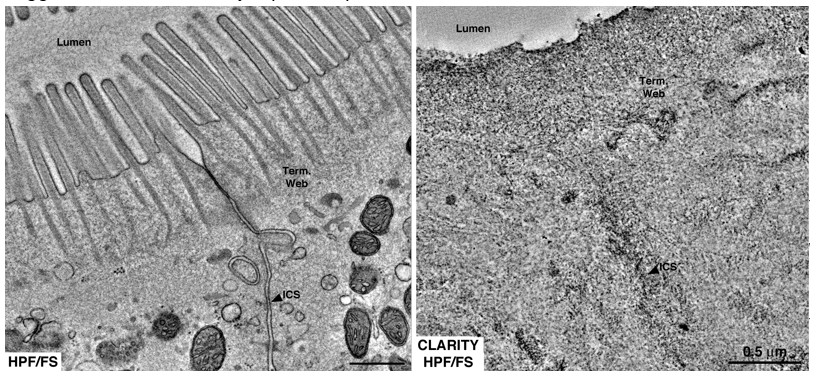
Equivalent tomographic slices of brush border regions of gut epithelial cells from wild-type mice that were optimally preserved for EM imaging by high-pressure freezing/freeze substitution (HPF/FS) fixation (left) or optically cleared using CLARITY prior to HPF/FS (right).
Clearing caused drastic loss of ultrastructural detail, likely due to extraction of lipids from the tissue (Term. web = terminal web; ICS = intercellular space).
Videos
Video 1
Spatial Distribution of HIV-1 and T-cells in GALT
360˚ rotation of a 45 μm thick Z-stack depicting the spatial distribution of human CD4+ T-cells (magenta), HIV-1 p24 (green), human CD8+ T-cells (red) and nuclei (blue) in colon at 12-days PI. Crypts are at the base and villus tips extend toward the top of the volume. Quantification of this volume is reported in Figure 4A–C.
Video 2
ET of a pool of virions in GALT at peak infectivity
Tomographic reconstruction of a volume of two consecutive 400 nm serial sections from colon of a PBMC-NSG animal 10-days PI (Figure 5C, upper right panel). A pool of virions resides in the center with the lateral intercellular space between two cells extending into the upper right portion of the movie and is contiguous with a blood vessel wall (Figure 5C, center panel). Scale bar = 0.5 μm.
Video 3
Modeling of an infected cell and individual virions in spleen
Tomographic reconstruction of a volume of two consecutive 400 nm serial sections of an HIV-1–infected cell from spleen of a PBMC-NSG animal 12-days PI. Virions are modeled as mature (green), immature (blue), and budding (magenta). Coiled fibrils of collagen are evident surrounding the periphery of the cell and free virions. The second half of the movie shows zoomed detail. Scale bar = 1 μm.
Video 4
ET of densities associated with virus budding
Tomographic reconstruction of an accumulation of cytoplasmic densities associated with prolific virus release. Densities were present in cytoplasm immediately adjacent to a region of plasma membrane supporting prolific virus release and at the base of budding virions. Scale bar = 0.2 μm.
Download links
A two-part list of links to download the article, or parts of the article, in various formats.
Downloads (link to download the article as PDF)
Open citations (links to open the citations from this article in various online reference manager services)
Cite this article (links to download the citations from this article in formats compatible with various reference manager tools)
Longitudinal imaging of HIV-1 spread in humanized mice with parallel 3D immunofluorescence and electron tomography
eLife 6:e23282.
https://doi.org/10.7554/eLife.23282


