Polo-like kinase-dependent phosphorylation of the synaptonemal complex protein SYP-4 regulates double-strand break formation through a negative feedback loop.
- Harvard Medical School, United States
- Massachusetts General Hospital, United States
Figures
Figure 1 with 1 supplement
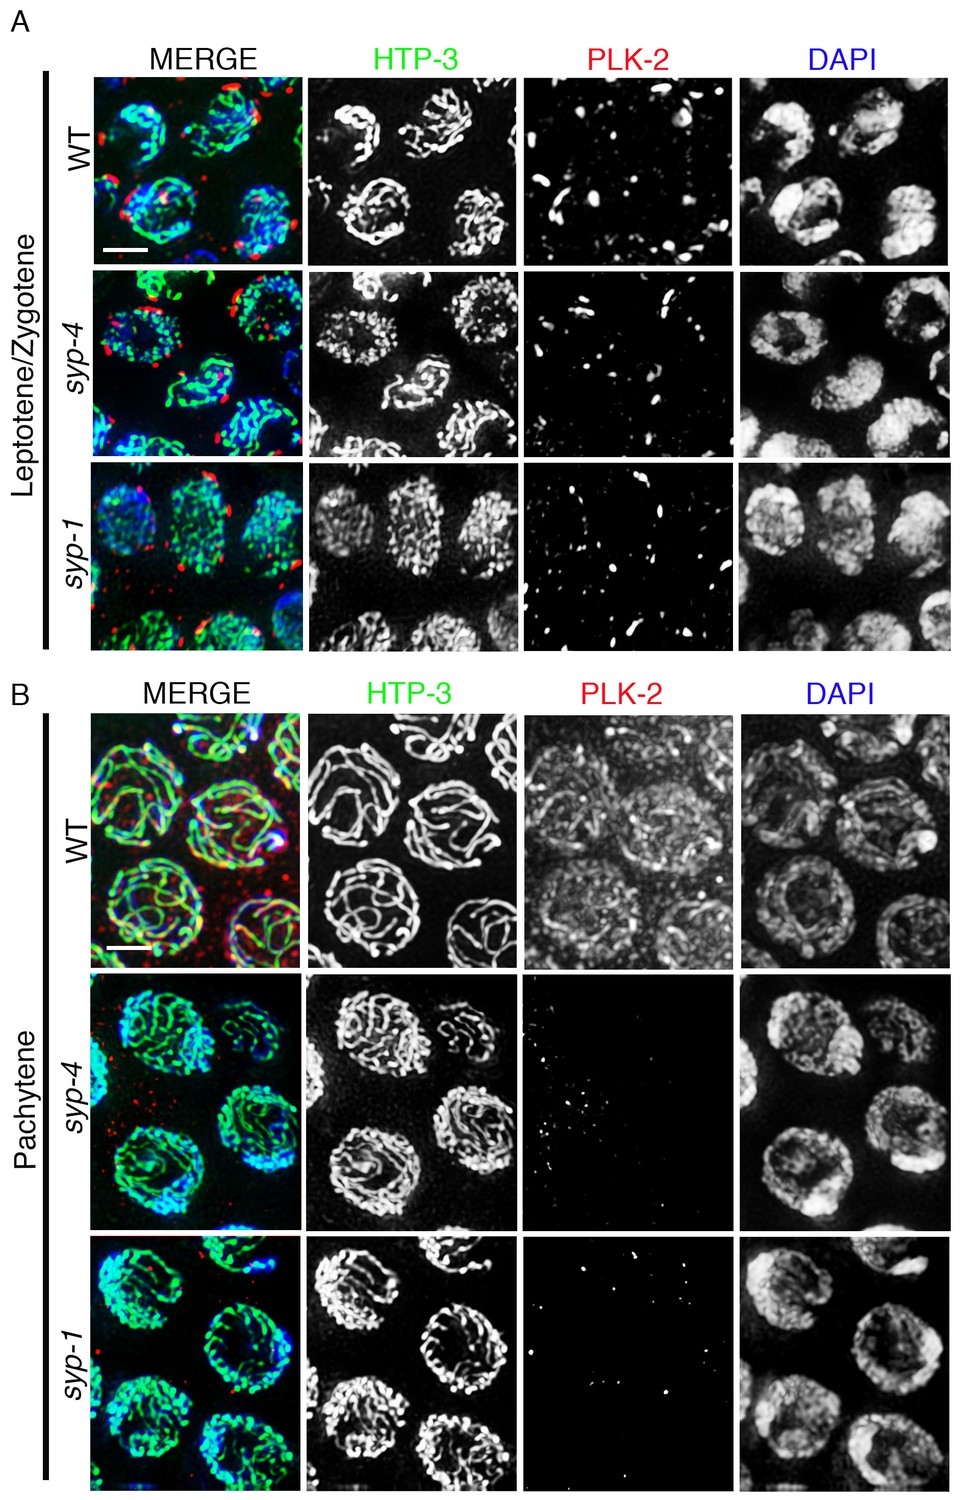
PLK-2 localization on synapsed chromosomes is dependent on the SYP proteins.
High-magnification images of leptotene/zygotene (A) and pachytene stage (B) nuclei from wild type, syp-4, and syp-1 mutant gonads stained with HTP-3 (green), PLK-2 (red), and DAPI (blue). (A) PLK-2 is observed localizing to aggregates at the nuclear periphery during leptotene/zygotene in synapsis-defective mutants. These aggregates, which have been previously shown to correspond to the pairing centers (Labella et al., 2011; Harper et al., 2011), are larger in wild type than in the syp-1 and syp-4 mutants given that the pairing centers of homologous chromosomes are not held in close juxtaposition in these mutants as frequently as in wild type at this stage in meiosis. (B) The more extensive localization of PLK-2 observed along chromosomes during pachytene in wild type is lost in syp-1 and syp-4 mutants. The thinner continuous tracks of HTP-3 staining observed in syp null mutants are due to HTP-3 localizing to unsynapsed axes. 27, 17, and 15 gonad arms were analyzed for wild type, syp-4, and syp-1, respectively. Scale bar, 3 μm.
Figure 1—figure supplement 1
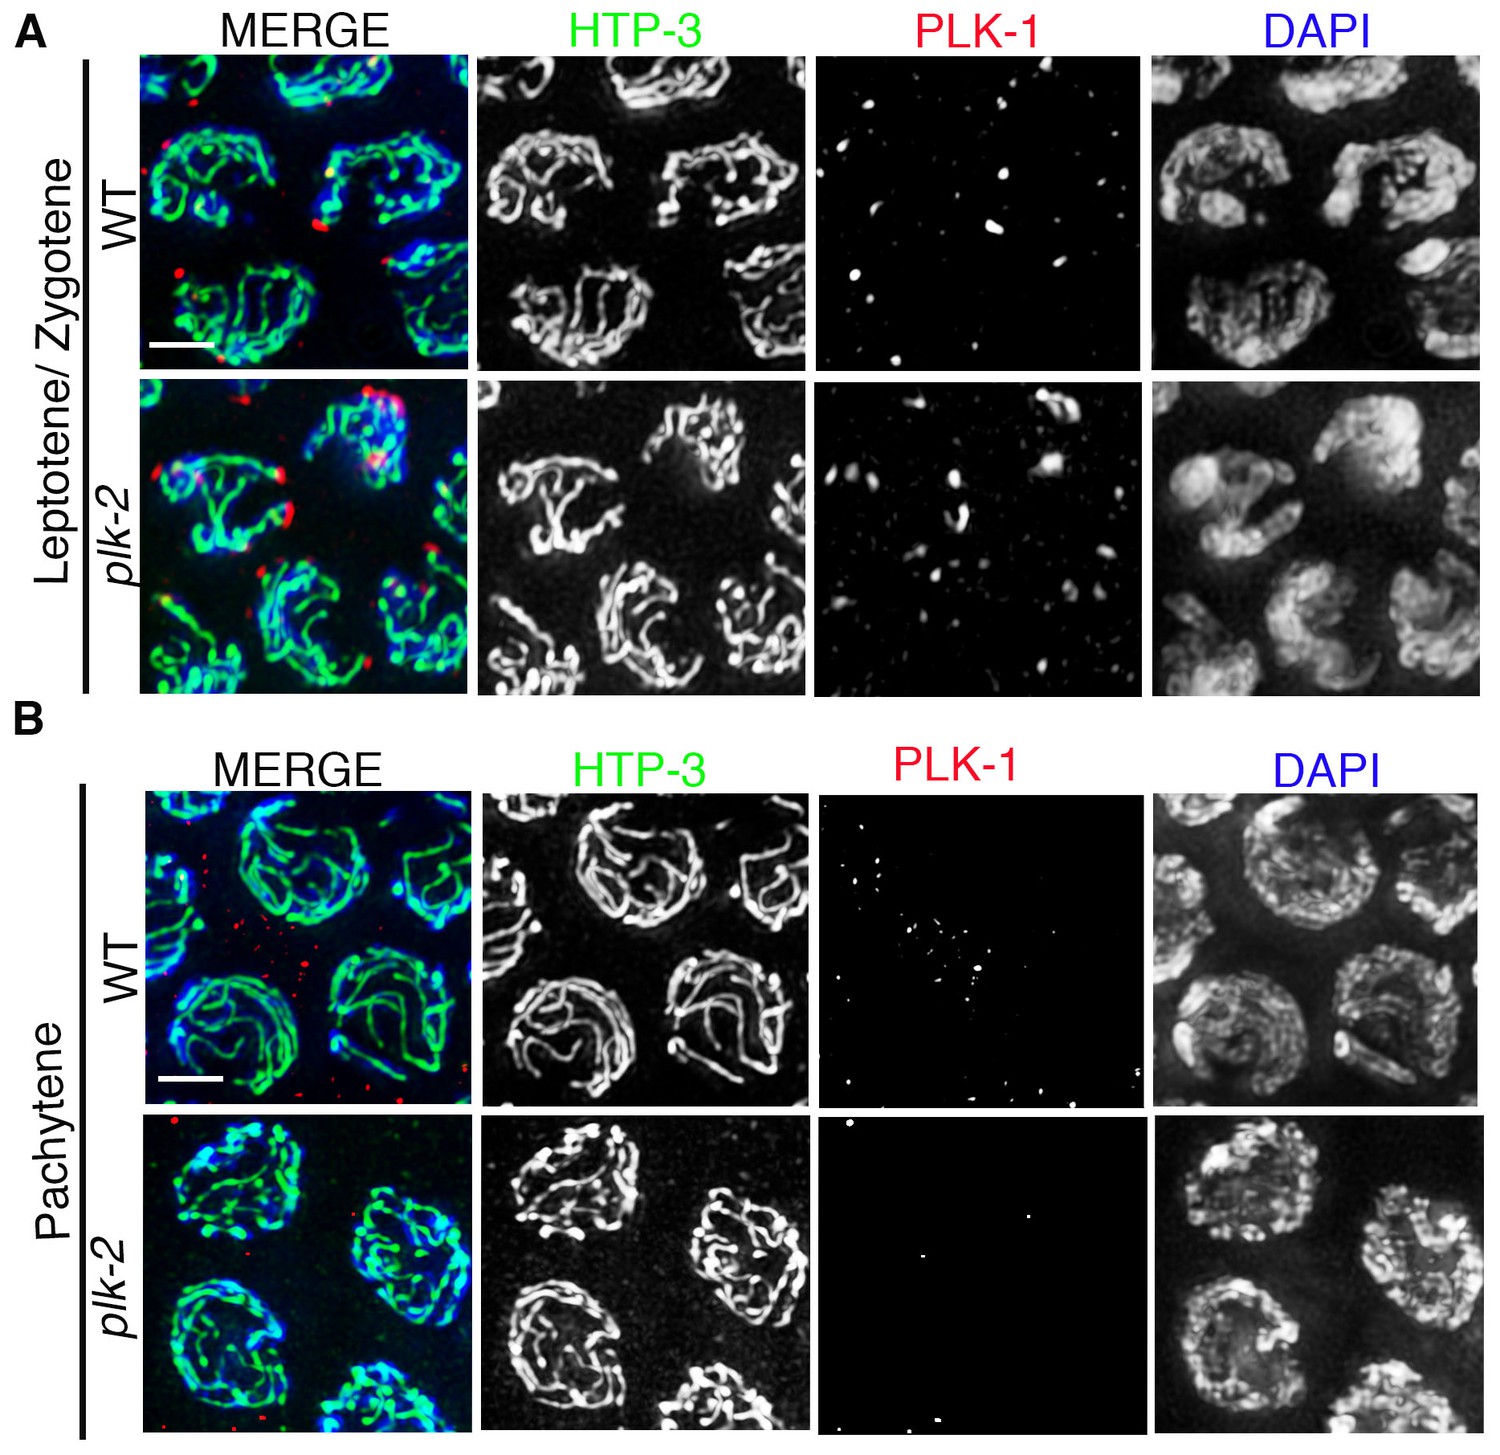
PLK-1 localization in the C. elegans germline.
High-magnification images of leptotene/zygotene (A) and pachytene (B) stage nuclei from wild type and plk-2 mutant gonads stained with HTP-3 (green), PLK-1 (red), and DAPI (blue). While PLK-1 is observed localizing to aggregates at the nuclear periphery during leptotene/zygotene, PLK-1 signal is not detected in pachytene nuclei in either wild type or plk-2 mutants. 14 and 15 gonad arms were analyzed for wild type and plk-2 mutant gonads, respectively. Scale bar, 3 μm.
Figure 2 with 1 supplement
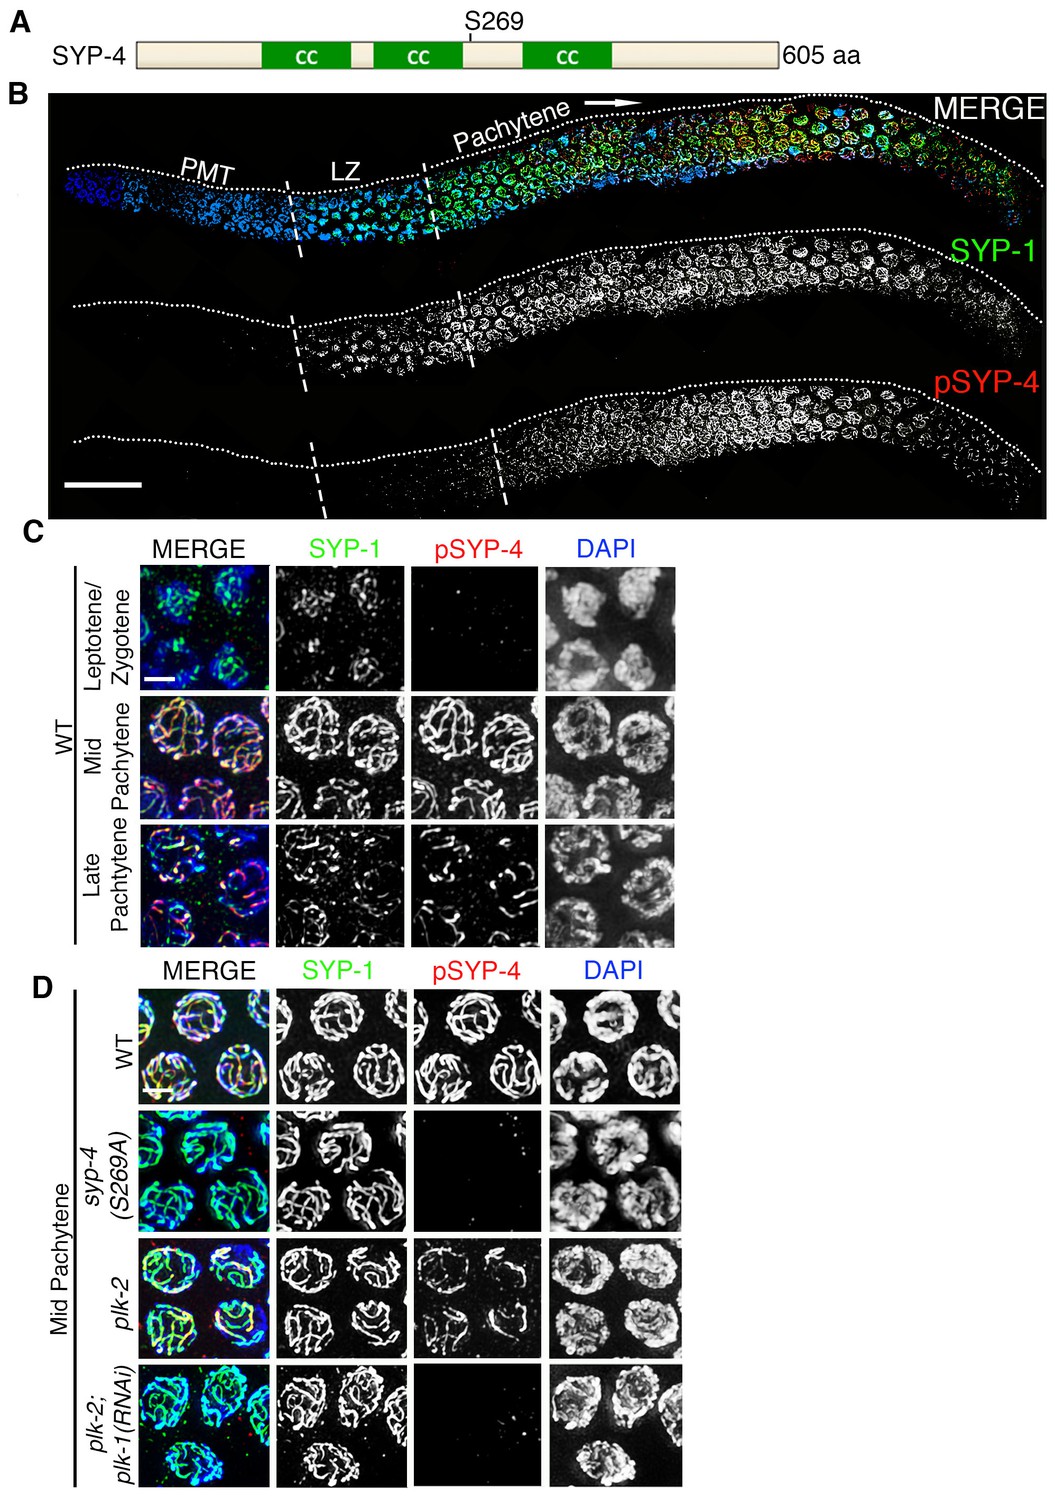
Phosphorylation of SYP-4 at the S269 site is dependent on Polo-like kinase.
(A) Schematic representation of the SYP-4 protein with the predicted Polo-like kinase phosphorylation site (S269) indicated. CC indicates the coiled-coil domains and aa indicates amino acid. (B) Low-magnification images of whole-mounted gonads depicting SYP-1 (green) and phosphorylated SYP-4 (pSYP-4; red) localization in wild type. pSYP-4 signal is observed starting at early-pachytene although SC assembly, as observed here by SYP-1 immunostaining, starts earlier at the leptotene/zygotene stage. PMT (premeiotic tip) and LZ (leptotene/zygotene). (C) High-magnification images of wild type germline nuclei at the indicated stages stained with DAPI (blue), anti-SYP-1 (green) and anti-pSYP-4 (red). 16 gonad arms were analyzed for wild type (B–C). Phosphorylated SYP-4 signal is absent at leptotene/zygotene, observed colocalizing with SYP-1 in mid-pachytene and acquiring a similar restricted localization as SYP-1 during the disassembly of the SC starting at late pachytene. (D) High-magnification images of mid-pachytene nuclei from wild type, plk-2(ok1936), plk-2(ok1936); plk-1(RNAi), and syp-4(S269A) mutants stained with DAPI (blue), anti-SYP-1 (green) and anti-pSYP-4 (red). Phosphorylated SYP-4 signal is absent in the syp-4(S269A) mutant indicating specificity of the phospho-specific antibody. Phosphorylated SYP-4 signal is reduced in mid-pachytene nuclei in plk-2 mutants and absent at that stage in plk-2; plk-1(RNAi) germlines. Note that an uneven SYP-1 signal intensity is observed along chromosomes in plk-2; plk-1(RNAi) germlines, but pSYP-4 signal is not detected even on chromosomes with strong SYP-1 signal. 22, 17, 16, and 18 gonad arms were analyzed for wild type, plk-2(ok1936), plk-2(ok1936); plk-1(RNAi), and syp-4(S269A) mutants, respectively. Scale bar, 20 μm for (B) and 3 μm for (C) and (D).
Figure 2—figure supplement 1
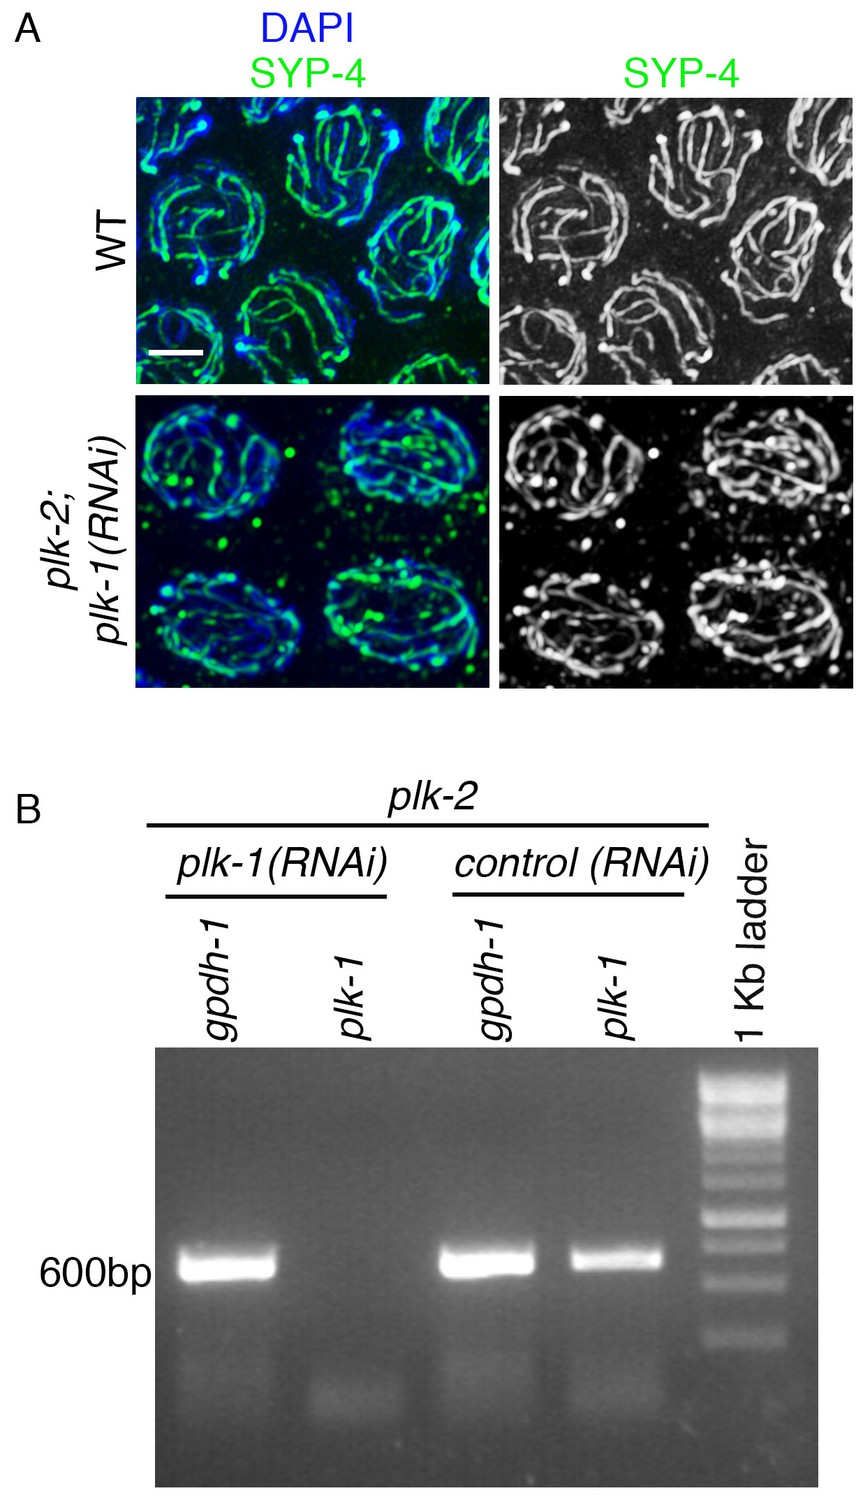
RT-PCR analysis of plk-1 knockdown by RNAi.
(A) High-magnification images of pachytene stage nuclei from wild type and plk-2; plk-1(RNAi) mutant gonads stained with SYP-4 (green) and DAPI (blue). Note that an uneven SYP-4 signal intensity is observed along chromosomes in plk-2; plk-1(RNAi) germlines. Scale bar, 3 μm. 15 gonad arms were analyzed for each genotype. (B) RT-PCR of plk-1(RNAi) compared to control RNAi (empty vector). Both depletions were performed in the plk-2 mutant. gpdh-1 expression was used as a loading control. Each lane corresponds to a pooled worm lysate of ~30 worms and indicates the effective depletion of plk-1 by RNAi.
Figure 3 with 3 supplements
SYP-4 is phosphorylated in response to CO precursor formation.
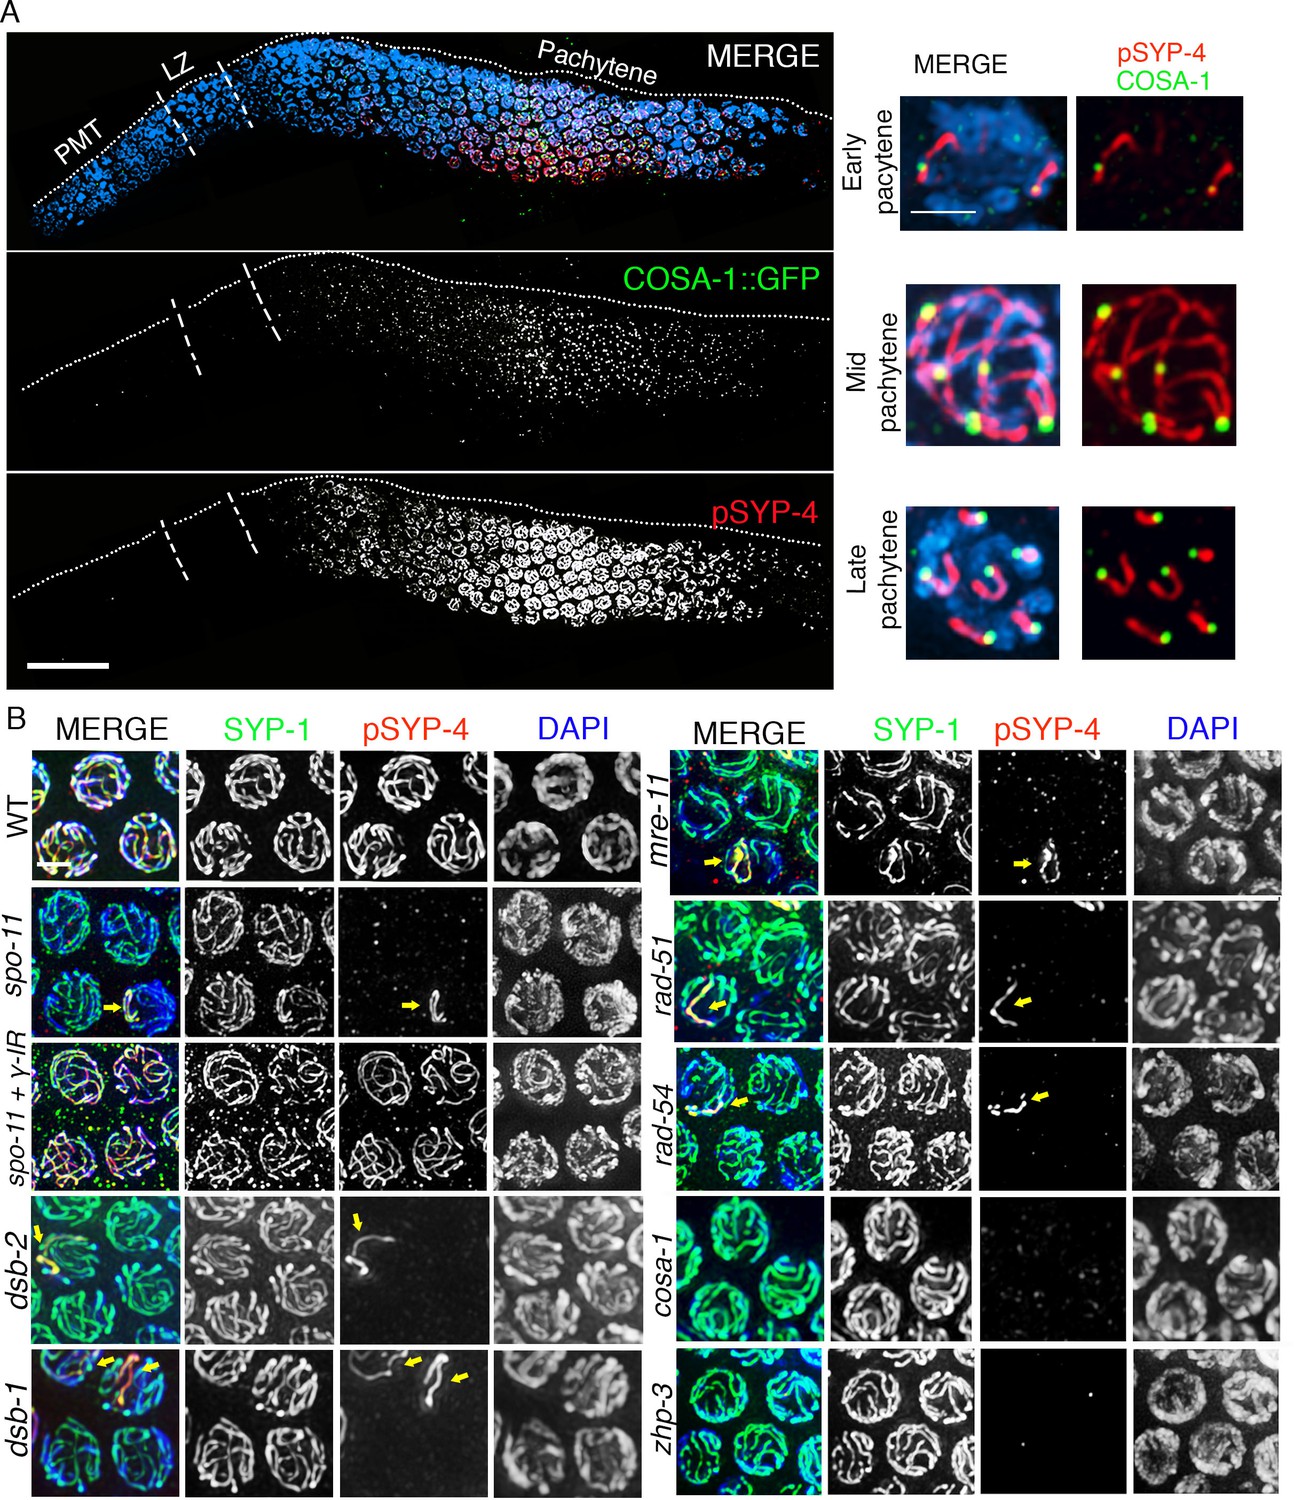
(A) Low-magnification image of a whole-mounted gonad from an animal expressing GFP::COSA-1 stained with anti-GFP (green), anti-pSYP-4 (red), and DAPI (blue). GFP::COSA-1 foci are detected from early to late pachytene, coinciding with the temporal window in which pSYP-4 signal is observed on chromosomes. Insets on the right are high-magnification images showing that stretches of pSYP-4 signal are first observed at early pachytene mainly on chromosomes that have a GFP::COSA-1 focus (top row of insets). pSYP-4 signal is then observed continuously along the length of the chromosomes at mid-pachytene. Finally, pSYP-4 signal starts to be lost from some chromosome subdomains and is retained from the off-centered site of the CO event marked by GFP::COSA-1 through the shortest distance to one end of the chromosomes (this will later become the short arm of the bivalent; bottom row of insets). PMT (premeiotic tip) and LZ (leptotene/zygotene). Scale bar, 20 μm. 21 gonads were analyzed. (B) High-magnification images of pachytene stage nuclei stained with anti-SYP-1 (green), anti-pSYP-4 (red), and DAPI (blue) for the indicated genotypes. pSYP-4 signal is mostly lost in spo-11, dsb-1, dsb-2, mre-11, rad-51 and rad-54 mutants. Arrow points to the chromosome that still shows pSYP-4 localization in these mutants. The extensive localization of pSYP-4 along synapsed chromosomes can be rescued by exogenous induction of DSBs via γ-IR in spo-11 mutants. pSYP-4 signal is not detected in pro-crossover mutants cosa-1 and zhp-3. Scale bar, 20 μm for (A) and 3 μm for (B). At least 15 animals were examined for each genotype.
Figure 3—figure supplement 1
Quantitation of colocalization between COSA-1::GFP foci and pSYP-4 signal on chromosomes in early pachytene.
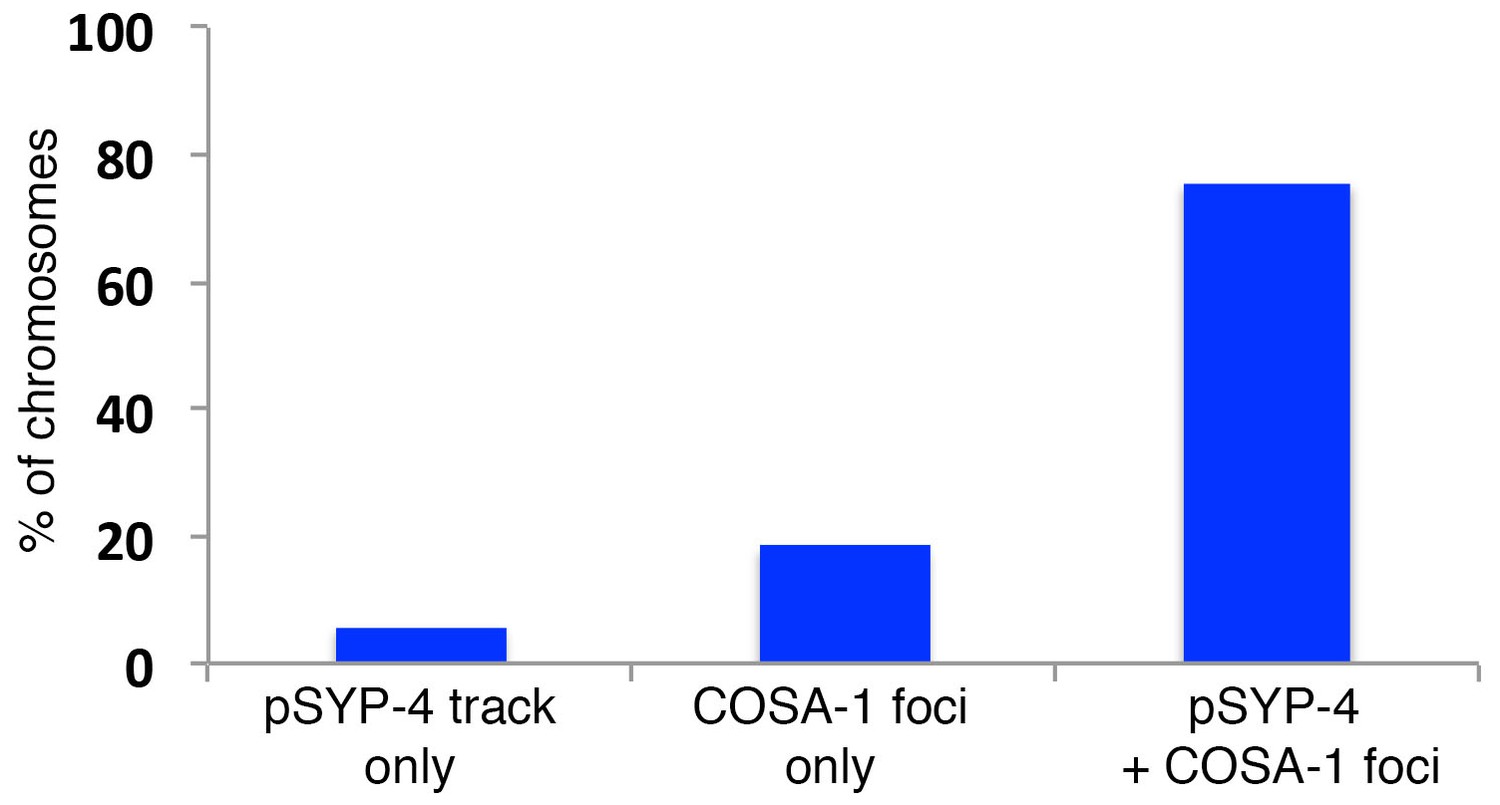
Histogram showing the percentage of chromosomes exhibiting only pSYP-4 signal (5.8%), only COSA-1::GFP foci (18.4%), or COSA-1::GFP foci colocalizing with pSYP-4 signal (75.7%). 84 nuclei from 11 gonads were analyzed. Only nuclei where COSA-1::GFP foci and pSYP-4 tracks first begin to appear (first 2 to 3 rows of nuclei in early pachtyene) were scored. Therefore, nuclei with six COSA-1::GFP foci colocalizing with pSYP-4 tracks were excluded from this analysis.
Figure 3—figure supplement 2
SYP-4 is phosphorylated in response to CO precursor formation.
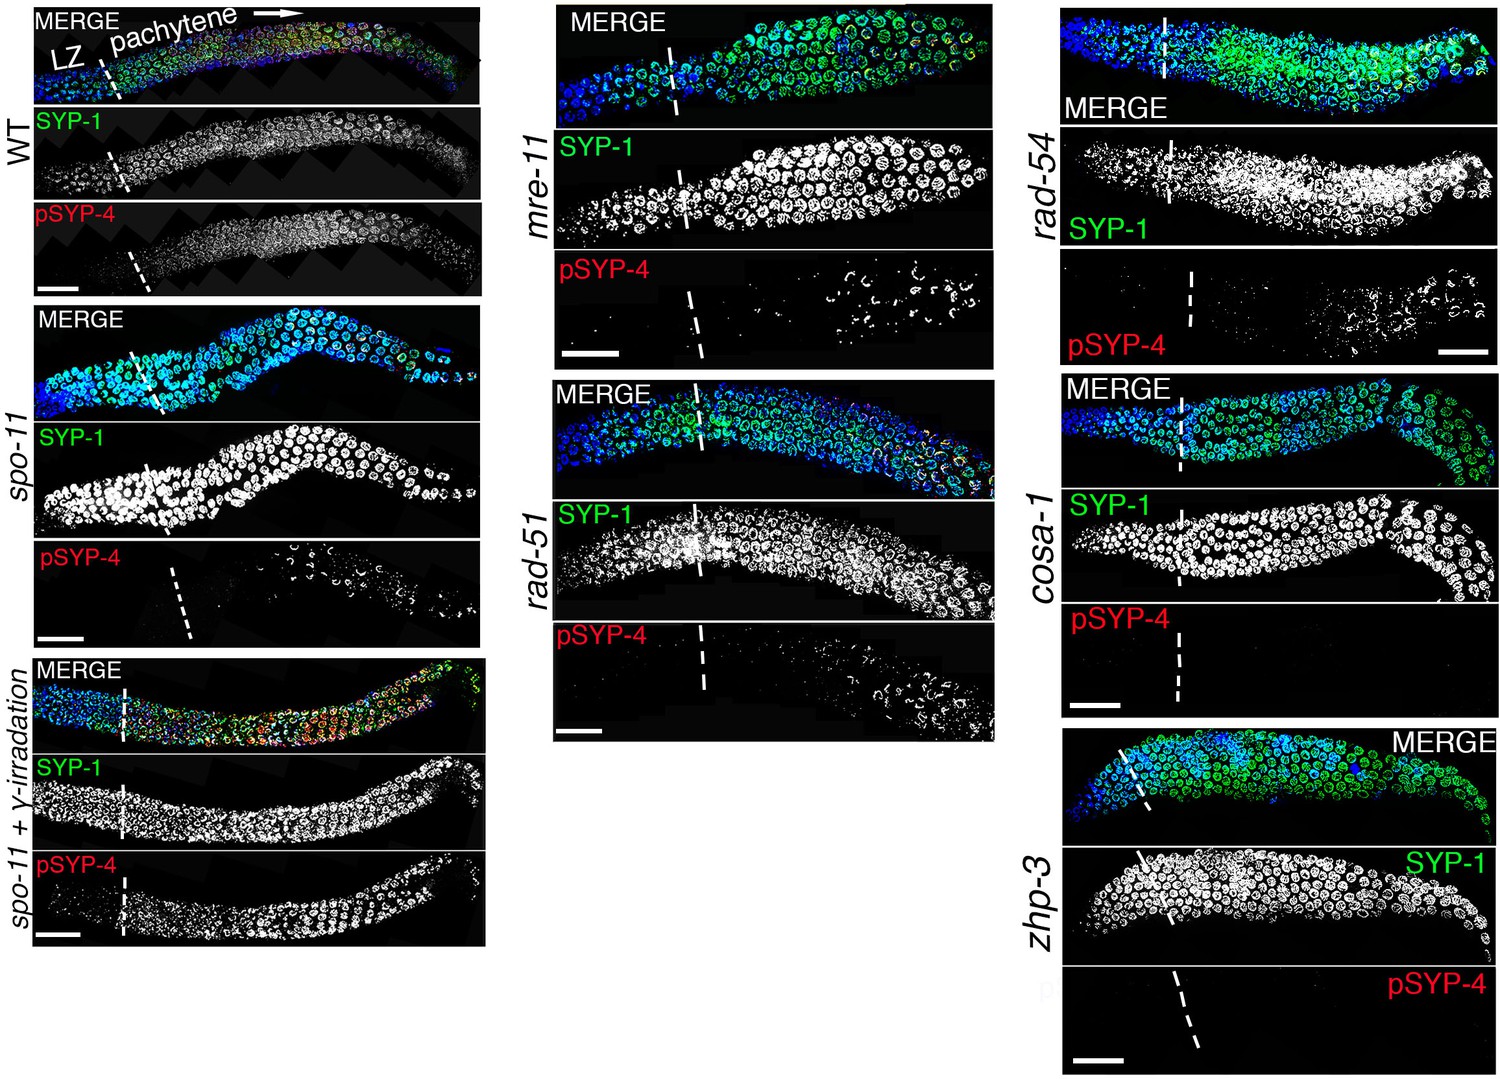
Low-magnification images show portions of the gonads starting at leptotene/zygotene (LZ) and extending through pachytene (boundary between these two stages is indicated by vertical white dotted lines). Gonads were stained with anti-SYP-1 (green), anti-pSYP-4 (red), and DAPI (blue) for the indicated genotype. Images show that pSYP-4 signal starts to be detected on chromosomes by early pachytene, later then when central region components of the SC, such as SYP-1, are observed associating with chromosomes. pSYP-4 signal is mostly, albeit not completely, lost in spo-11 mutants, and can be fully rescued by induction of exogenous DSBs by exposure to γ-irradiation. A similar reduction in pSYP-4 signal is observed in mre-11, rad-51 and rad-54 mutants. pSYP-4 signal is completely lost in pro-crossover mutants, cosa-1 and zhp-3. Scale bars, 20 μm. At least 15 animals were examined for each genotype.
Figure 3—figure supplement 3
Assessing the residual SYP-4 phosphorylation observed in spo-11 mutants.
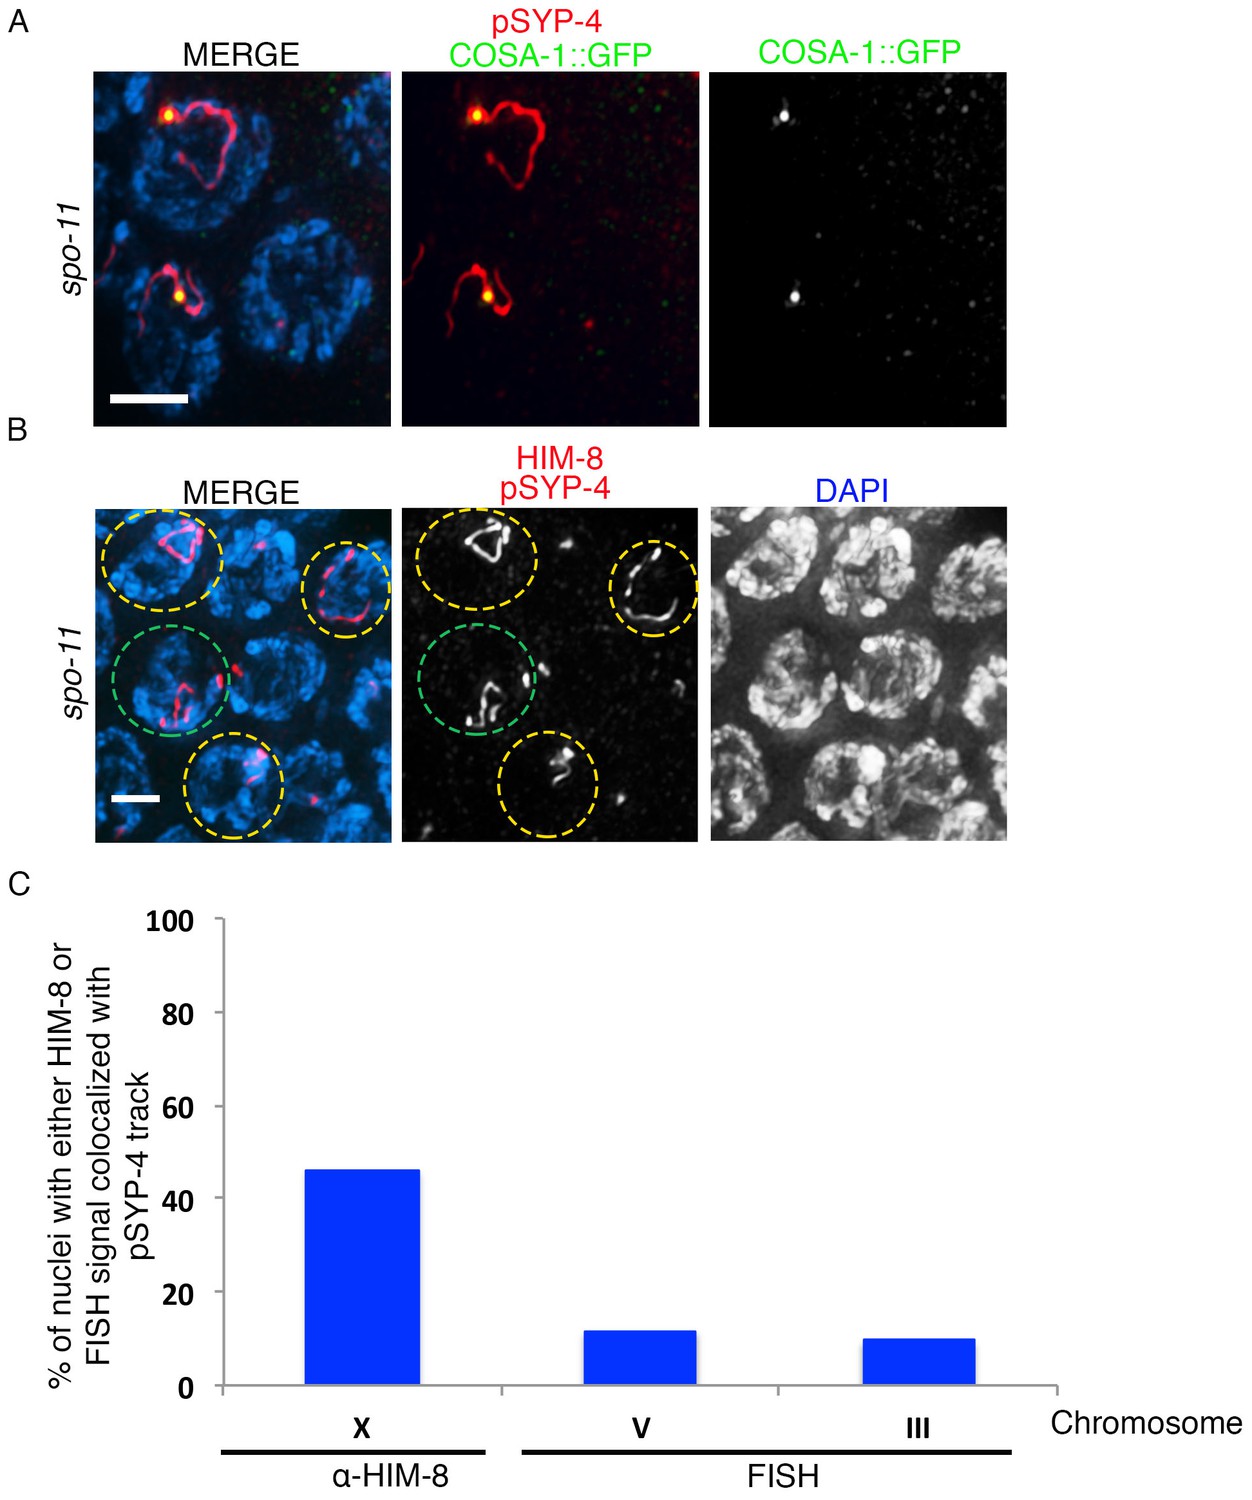
(A) High-magnification image of pachytene stage nuclei from spo-11; COSA-1::GFP mutants stained with anti-pSYP-4 (red), anti-GFP (green), and DAPI (blue). Image shows the colocalization of the single pSYP-4 track observed in <20% of nuclei on chromosomes with a COSA-1 focus. 21 gonad arms were analyzed. Scale bar, 3 μm. (B) Image of pachytene stage nuclei from a spo-11 mutant stained with anti-pSYP-4 (red), anti-HIM-8 (red), and DAPI (blue). Nuclei exhibiting a pSYP-4 track colocalizing with HIM-8, which marks the pairing center end of the X chromosome, are indicated with yellow circles and a nucleus where the pSYP-4 track does not colocalize with HIM-8 is indicated with a green circle to facilitate visualization. 12 gonad arms were analyzed. Scale bar, 3 μm. (C) Histogram showing the quantitation of the percentage of pachytene nuclei in spo-11 mutants in which the pSYP-4 signal was observed on the X chromosome (46.7%), chromosome III (9.5%), and chromosome V (11.6%), where the X chromosome was identified by HIM-8 staining, and chromosomes III and V were identified with chromosome-specific probes by FISH. 117, 42 and 43 nuclei with a pSYP-4 track from at least 10 gonad arms were scored for chromosomes X, III, and V, respectively.
Figure 4
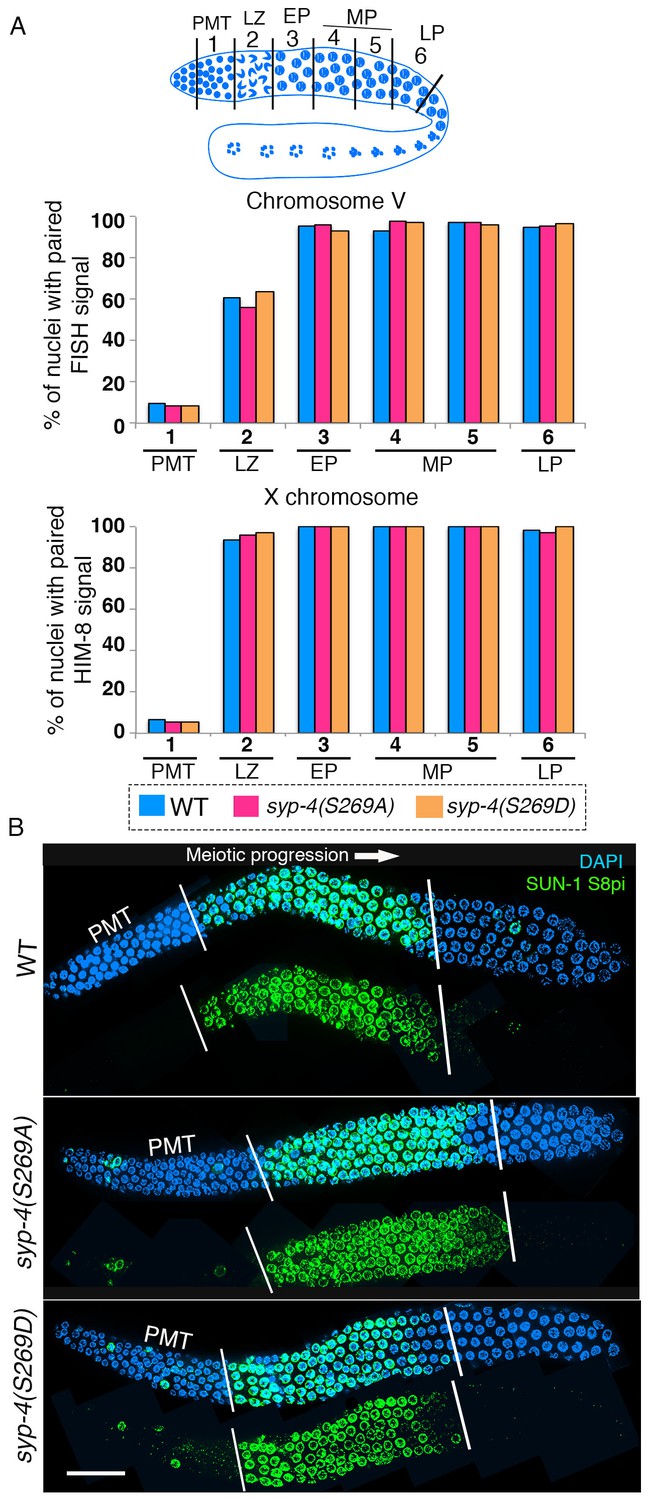
SYP-4 phosphorylation at the S269 site does not affect pairing or SUN-1 S8pi localization.
Homologous pairing for chromosomes V and X was analyzed using FISH and immunostaining against the X chromosome pairing center protein HIM-8, respectively. (A) Schematic representation of the C. elegans germline indicating the different zones scored for homologous chromosome pairing. Graphs depict no statistically significant difference in the percentage of nuclei with paired FISH signals for chromosome V and paired HIM-8 signals for the X-chromosome in the germline of the indicated mutants compared to wild type (signals were scored as paired when separated by ≤0.75 µm). X-axes indicate the position along the germline. PMT- premeiotic tip, L/Z- leptotene/zygotene, EP- early pachytene, MP- mid pachytene, and LP- late pachytene. Six gonad arms were analyzed for each genotype. (B) Low-magnification images of whole-mounted gonads indicate no difference in the length of the germline region stained with anti-SUN-1 S8pi (green) for wild type (top), syp-4(S269A) phosphodead (middle), and syp-4(S269D) phosphomimetic mutants (bottom). Left white vertical bar indicates entrance into meiosis and right vertical bar indicates end of zone where SUN-1 S8pi signal is detected. Scale bar, 15 μm. >18 gonad arms were analyzed for each genotype.
-
Figure 4—source data 1
Numerical data for the percentage of nuclei with paired FISH signals for chromosome V and paired HIM-8 signals for the X-chromosome in the germline of the indicated mutants compared to wild type shown in Figure 4A.
- https://doi.org/10.7554/eLife.23437.012
Figure 5 with 1 supplement
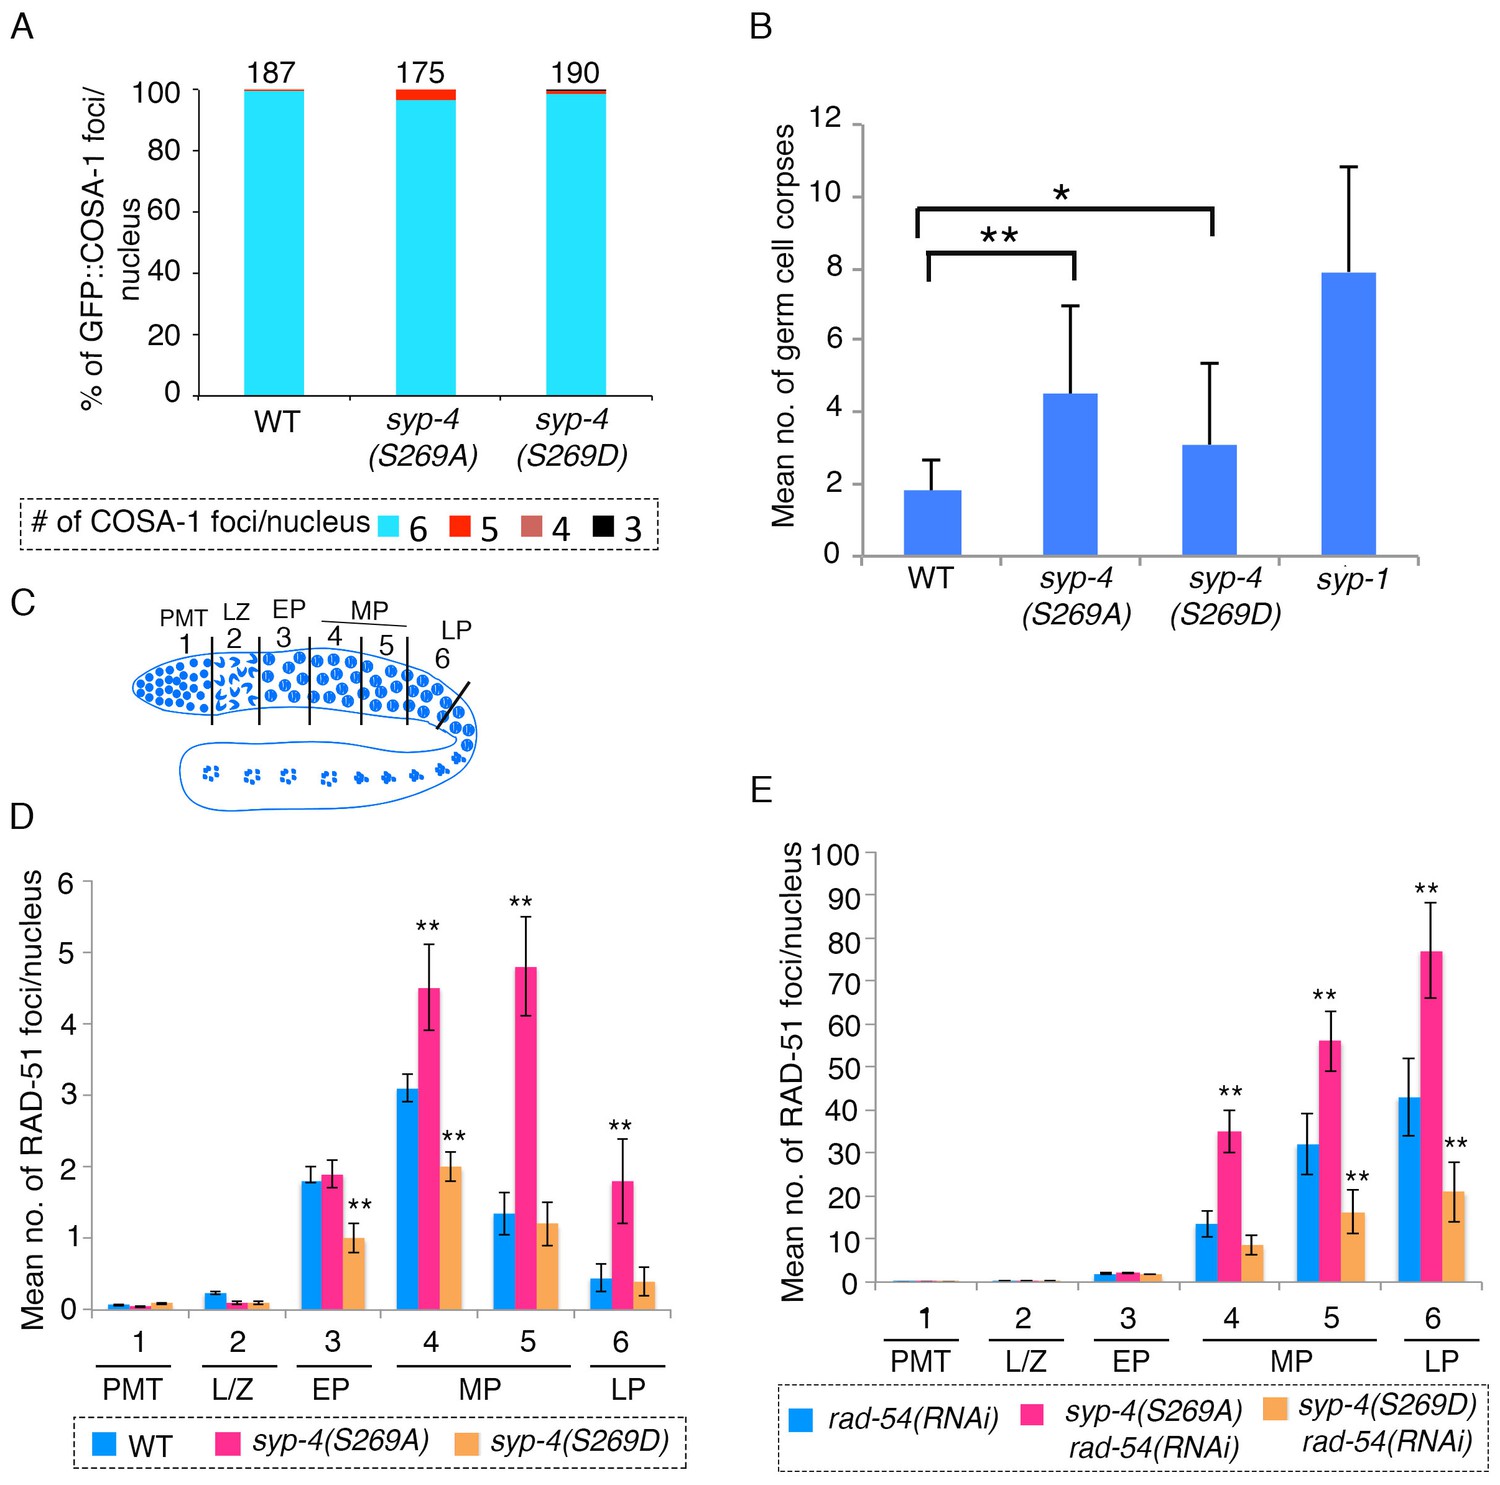
SYP-4 phosphorylation at the S269 site by Polo-like kinase regulates DSB formation.
(A) Graph depicts no statistically significant difference in the percentage of GFP::COSA-1 foci scored per nucleus for either the syp-4(S269A) or syp-4(S269D) mutants compared to wild type. Color code at the bottom indicates the number of GFP::COSA-1 foci observed per nucleus. Number on the top of the histogram bars represent the total number of nuclei scored for each genotype. (B) Graph depicts the increase in the mean number of germ cell corpses detected for both syp-4(S269A) and syp-4(S269D) mutants compared to wild type (**p<0.0001 and *p<0.0008, respectively, by the two-tailed Mann-Whitney test, 95% C.I.). The syp-1 mutant was used as a positive control given its elevated levels of germ cell apoptosis. 56, 72, 61, and 40 animals were analyzed for wild type, syp-4(S269A), syp-4(S269D) and syp-1(me17) mutants, respectively. (C) Schematic representation of the C. elegans germline indicating the different zones scored for the number of RAD-51 foci/nucleus. (D) Histogram depicts the increase in the mean number of RAD-51 foci observed per nucleus in the germlines of syp-4(S269A) mutants compared to wild type and the decrease in the mean number of RAD-51 foci observed in syp-4(S269D) mutants compared to wild type. (E) Similar analysis as in (D) except it is performed in a rad-54(RNAi) background allowing for a quantification of the total number of DSBs observed in each indicated genotype. This analysis reveals that the altered numbers of RAD-51 foci are due to increased levels of DSBs in syp-4(S269A) mutants and decreased levels of DSBs in syp-4(S269D) mutants. (D–E) X-axes indicate the position along the germline. PMT- premeiotic tip, L/Z- leptotene/zygotene, EP- early pachytene, MP- mid-pachytene, and LP- late pachytene. Six gonad arms were analyzed for each genotype. ** Indicates p<0.0001 by the two-tailed Mann-Whitney test, 95% C.I.
-
Figure 5—source data 1
Numerical data for the percentage of GFP::COSA-1 foci scored per nucleus for either the syp-4(S269A) or syp-4(S269D) mutants compared to wild type shown in Figure 5A.
- https://doi.org/10.7554/eLife.23437.014
-
Figure 5—source data 2
Numerical data used to calculate the mean number of germ cell corpses for both syp-4(S269A) and syp-4(S269D) mutants compared to wild type shown in Figure 5B.
- https://doi.org/10.7554/eLife.23437.015
-
Figure 5—source data 3
Numerical data used to calculate the mean number of RAD-51 foci observed per nucleus throughout zones 1–6 from whole mounted gonads of the indicated genotypes shown in Figure 5D and E.
Sheet one shows all raw data while sheet two shows combined summaries.
- https://doi.org/10.7554/eLife.23437.016
Figure 5—figure supplement 1
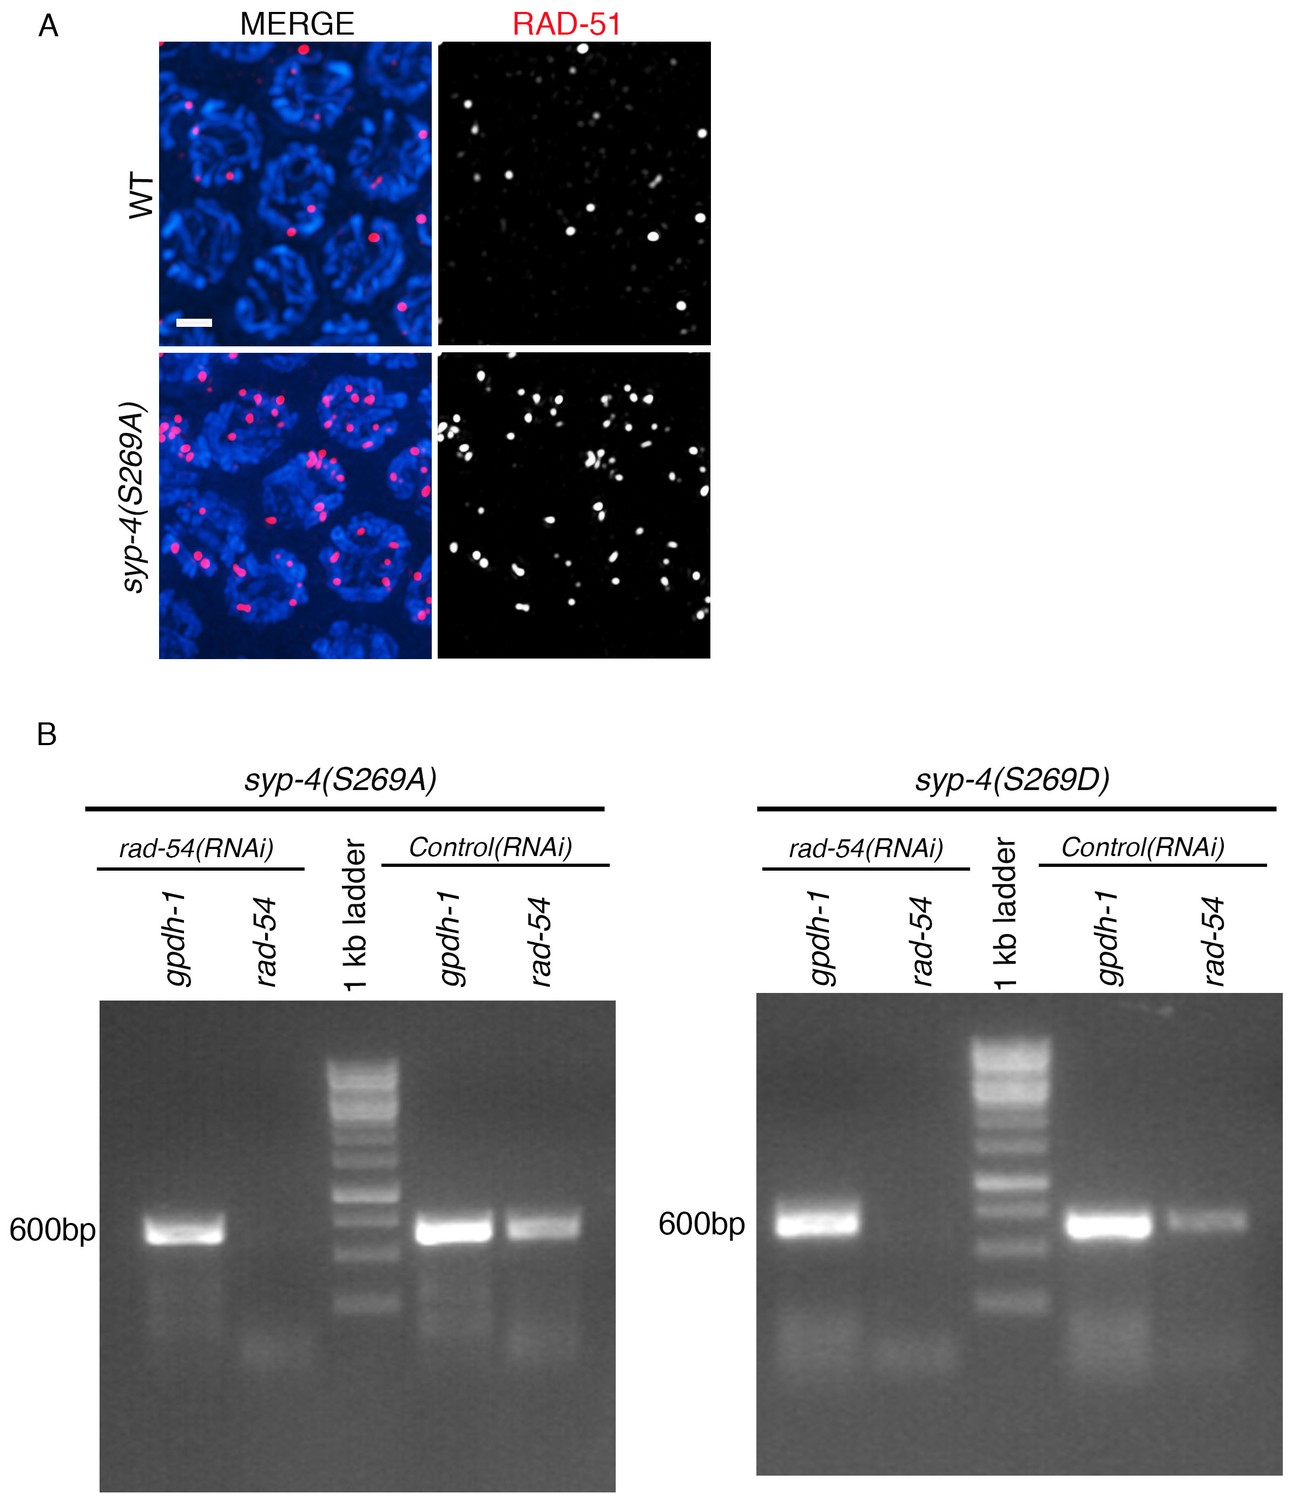
RT-PCR showing depletion of rad-54 by RNAi in wild type, syp-4(S269A) rad-54(RNAi) and syp-4(S269D) rad-54(RNAi) animals.
(A) High-magnification images of mid-pachytene stage nuclei (zone five indicated in Figure 5C and D) in wild type and syp-4(S269A) mutants stained with RAD-51 (red) and DAPI (blue). Scale bar, 3 μm. (B) RT-PCR of rad-54(RNAi) compared to control RNAi (empty vector) in syp-4(S269A) and syp-4(S269D) animals scored for levels of RAD-51 foci per germline nucleus in Figure 5E. gpdh-1 expression was used as a loading control. Each lane corresponds to a pooled worm lysate of ~30 worms and indicates the effective depletion of rad-54 by RNAi.
Figure 6 with 1 supplement
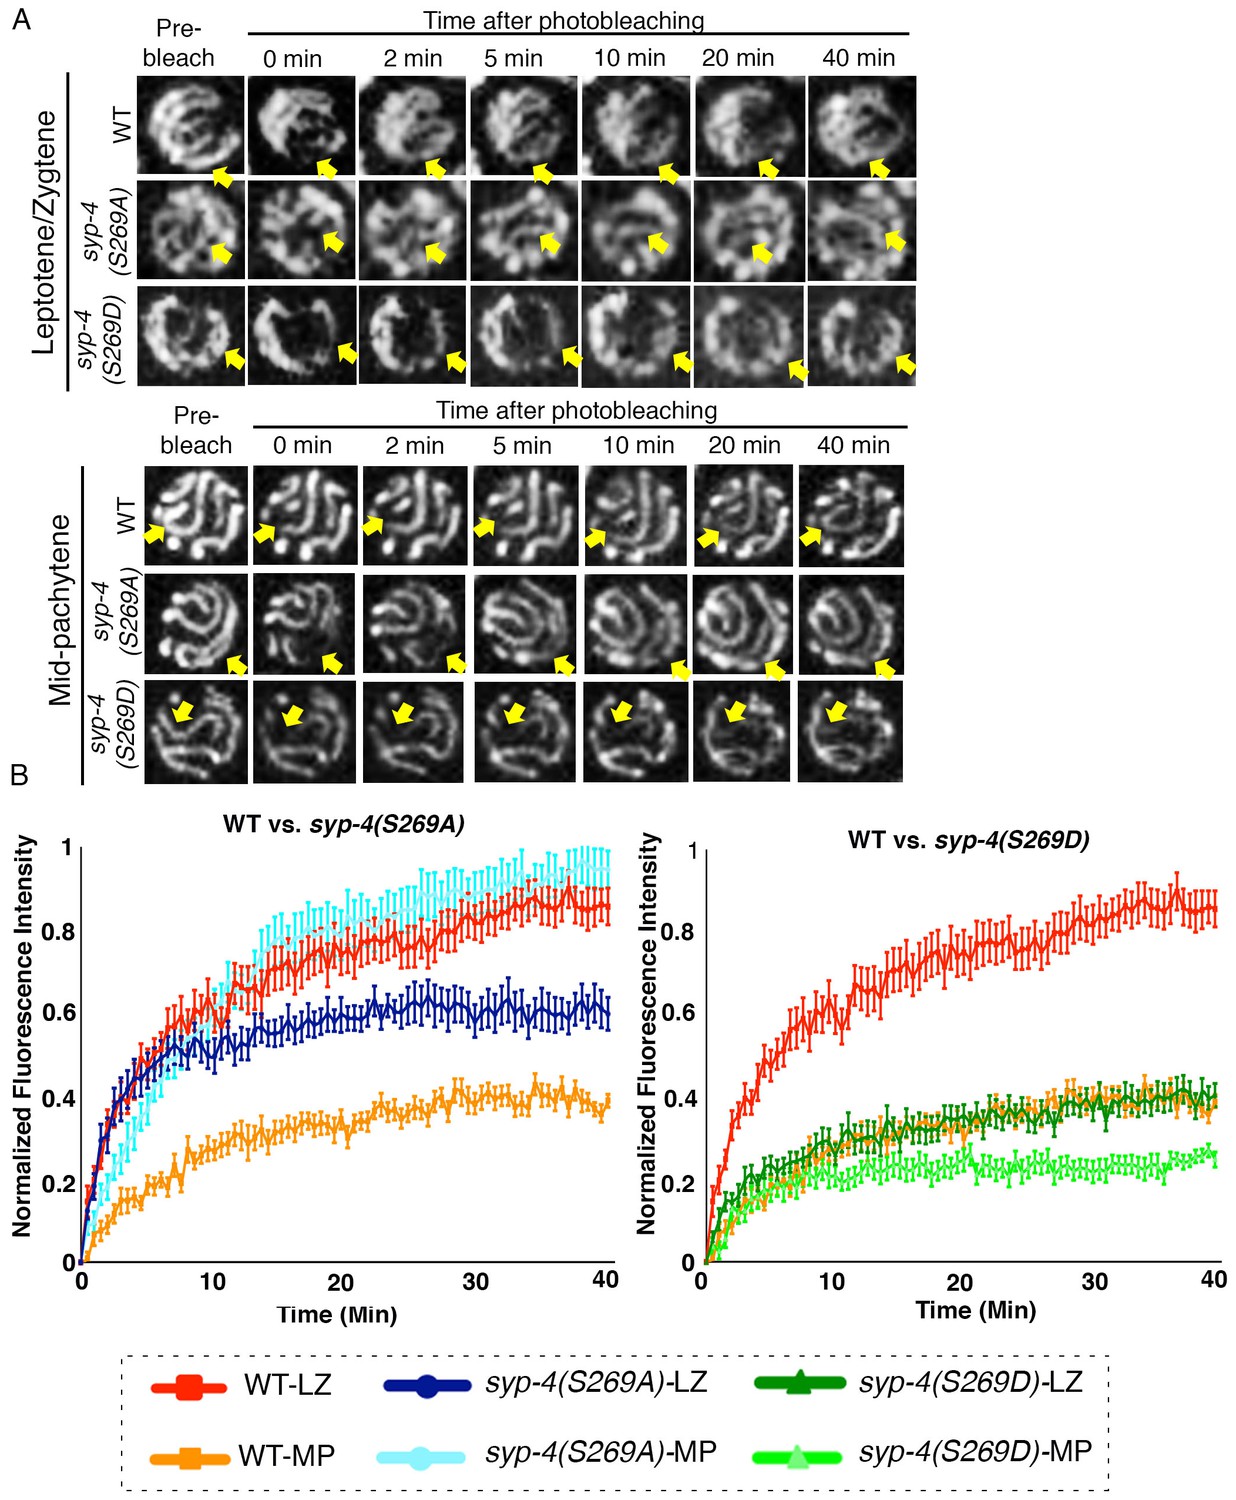
PLK-dependent phosphorylation of SYP-4 changes the SC central region from a more dynamic to a less dynamic state.
(A) Representative images showing the GFP::SYP-3 fluorescence detected in leptotene/zygotene and mid-pachytene nuclei for the indicated genotypes during FRAP experiments. Arrows indicate the small region that was bleached and measured for fluorescence recovery on each nucleus. GFP::SYP-3 signal recovery after photobleaching during leptotene/zygotene is faster in both wild type and syp-4(S269A) mutants compared to syp-4(S269D) mutants. At mid-pachytene, while the rate of fluorescence signal recovery is slower compared to earlier prophase for wild type, the syp-4(269A) mutants continue to exhibit a rapid recovery rate comparable to that observed earlier in leptotene/zygote, while the syp-4(S269D) mutants continue to exhibit a slower recovery rate. (B) Graph showing quantitation of GFP::SYP-3 fluorescence recovery in leptotene/zygotene and mid-pachytene stage nuclei in wild type compared to syp-4(S269A), and syp-4(S269D) mutants. The total of number of nuclei measured in each group were: Mid-pachytene_WT: n = 20; Mid-pachytene _syp-4(S269D): n = 18; Mid-pachytene _ syp-4(S269A): n = 20; Leptotene/zygotene _WT: n = 28; Leptotene/zygotene_ syp-4(S269D): n = 20; Leptotene/zygotene _ syp-4(S269A): n = 21. Error bars represent standard error of the mean. Bar code in the bottom indicates the stage of the nuclei and genotype. LZ – leptotene/zygotene; MP – mid-pachytene.
-
Figure 6—source data 1
Final data, after corrections, used to make graph for FRAP analysis shown in Figure 6B.
- https://doi.org/10.7554/eLife.23437.019
-
Figure 6—source data 2
Raw numerical data used for graph of FRAP analysis shown in Figure 6B.
- https://doi.org/10.7554/eLife.23437.020
Figure 6—figure supplement 1
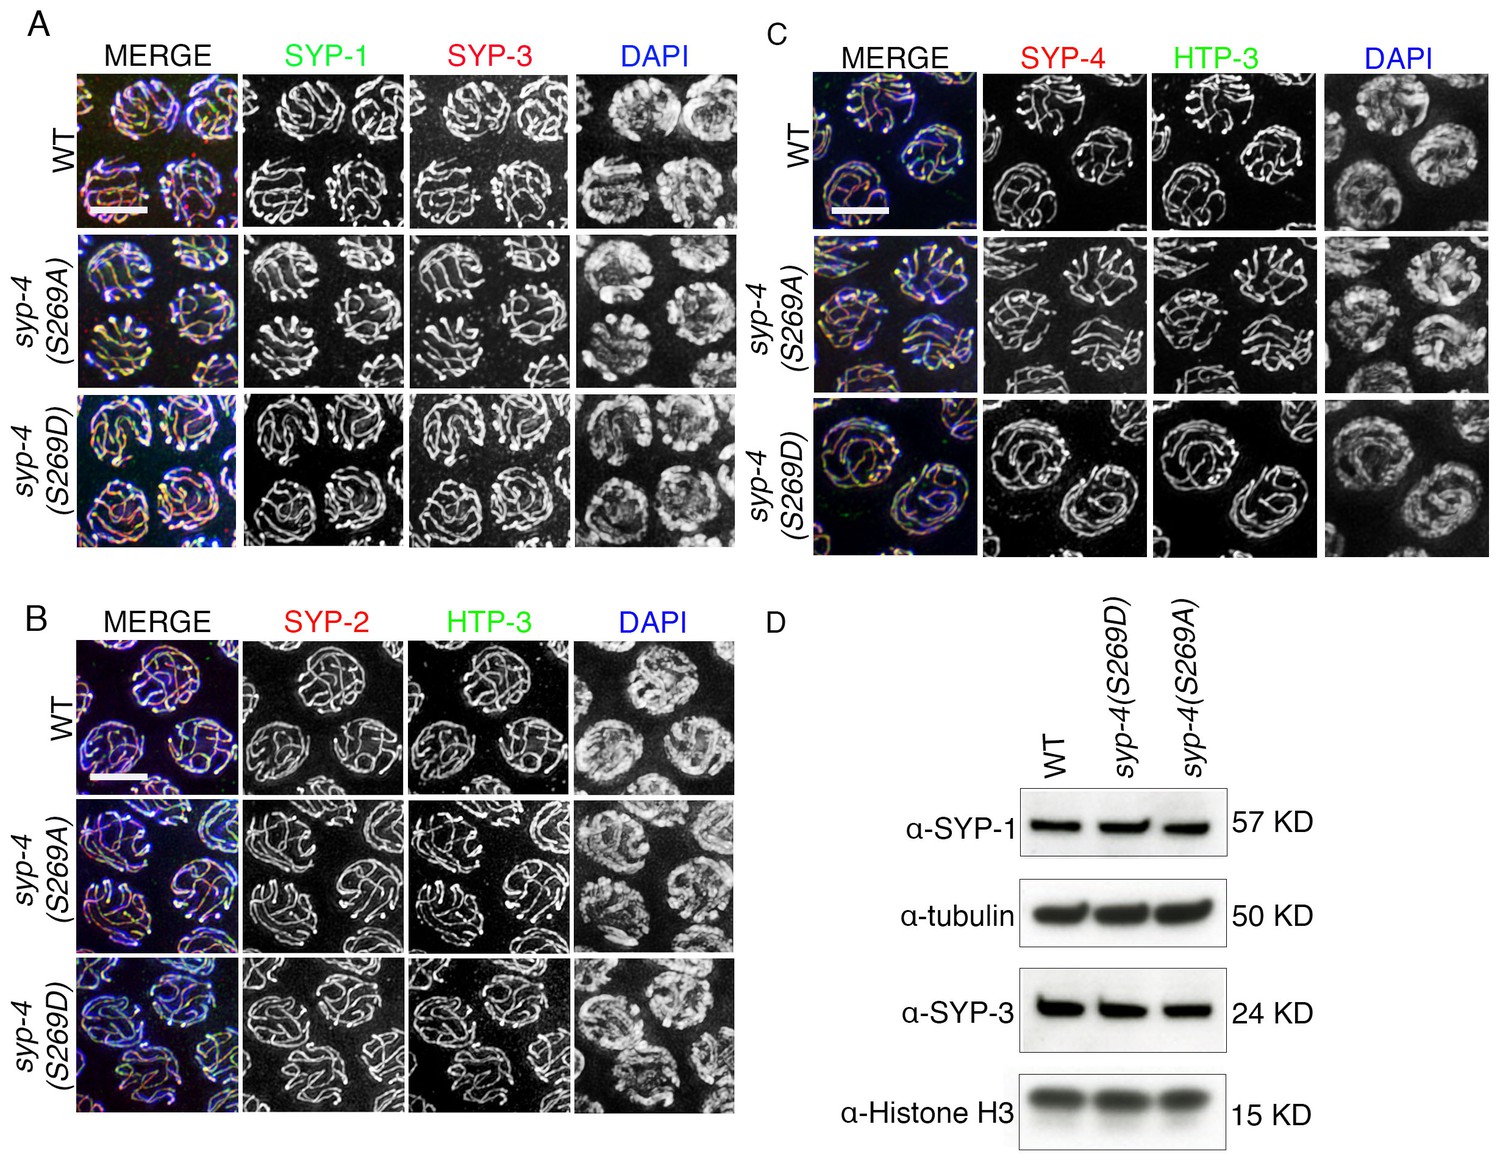
Phosphorylation of SYP-4 at S269 does not affect SC assembly and maintenance.
(A) High-magnification images of pachytene nuclei in wild type, syp-4(S269A) and syp-4(S269D) mutants co-stained with SYP-1 (green), SYP-3 (red), and DAPI (blue). (B) High-magnification images of pachytene nuclei in wild type, syp-4(S269A) and syp-4(S269D) mutants co-stained with HTP-3 (green), SYP-2 (red), and DAPI (blue). (C) High-magnification images of pachytene nuclei in wild type, syp-4(S269A) and syp-4(S269D) mutants co-stained with HTP-3 (green), SYP-4 (red), and DAPI (blue). (D) Western blot of whole worm lysates showing no changes in the levels of the SYP-1 and SYP-3 proteins in wild type, syp-4(S269A) and syp-4(S269D) animals. α-tubulin and α-histone H3 were used as loading controls.
Figure 7
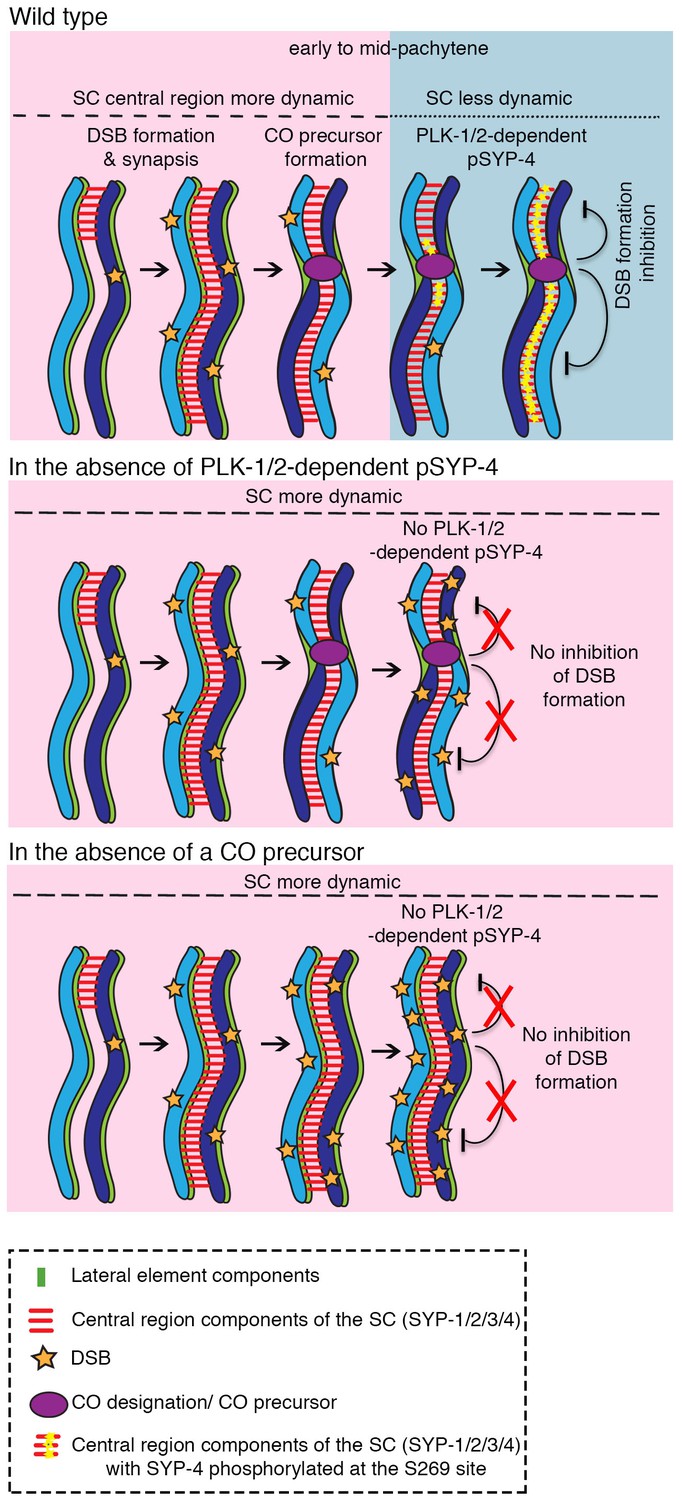
Model for how PLK-1/2-dependent phosphorylation of the synaptonemal complex protein SYP-4 regulates double-strand break formation through a negative feedback loop.
In wild type, PLK-1/2-dependent phosphorylation of SYP-4 at the S269 site occurs in response to CO designation. This phosphorylation switches the central region of the SC from a more dynamic (pink) to a less dynamic state (blue) during pachytene, inhibiting additional DSB formation on the homologous chromosomes. In the phosphodead mutant, in the absence of phosphorylation of SYP-4 at the S269 site, the SC fails to stabilize and the absence of a feedback loop results in continued DSB formation along the homologous chromosomes. Our model suggests that in the absence of CO designation, PLK-1/2-dependent phosphorylation of SYP-4 does not take place and the SC persists in a more dynamic state, which allows the homologs to remain in a DSB-permissive state.
Videos
Video 1
Example of a nucleus included in the FRAP analysis for Figure 6.
Mid-pachytene stage nuclei from wild type hermaphrodite animals expressing SYP-3::GFP included for analysis for FRAP experiment in Figure 6. Playback time is 447x in real-time.
Video 2
Example of a nucleus excluded from FRAP analysis in Figure 6.
Mid-pachytene stage nuclei from wild type hermaphrodite animals expressing SYP-3::GFP excluded from the FRAP analysis since this nucleus is rotating on its own axis. Playback time is 447x in real-time.
Additional files
-
Supplementary file 1
Brood size, embryonic lethality and incidence of males observed for syp-4(S269A) and syp-4(S269D) mutants.
The ‘Eggs Laid’ column indicates the average number of eggs laid (including both non-hatched and hatched embryos) per P0 hermaphrodite ± standard deviation. % Embryonic lethality was calculated by dividing the number of non-hatched embryos by the total number of hatched and non-hatched embryos laid. % Males was calculated by dividing the total number of males observed by the total number of hatched (viable) progeny scored. N = total number of P0 worms for which entire broods were scored. *p<0.0001 (Two-tailed Mann-Whitney test, 95% C.I.).
- https://doi.org/10.7554/eLife.23437.025
-
Supplementary file 2
Dunn’s multiple comparisons test of FRAP analysis.
Dunn’s multiple comparisons test between groups was applied to assess statistical significance of GFP::SYP-3 fluorescence recovery data presented in Figure 6B. LZ indicates leptotene/zygotene stage nuclei and MP indicates mid-pachytene stage nuclei.
- https://doi.org/10.7554/eLife.23437.026
-
Supplementary file 3
Numerical data for brood size, embryonic lethality and incidence of males shown on Supplementary file 1.
- https://doi.org/10.7554/eLife.23437.027
Download links
A two-part list of links to download the article, or parts of the article, in various formats.
Downloads (link to download the article as PDF)
Open citations (links to open the citations from this article in various online reference manager services)
Cite this article (links to download the citations from this article in formats compatible with various reference manager tools)
Polo-like kinase-dependent phosphorylation of the synaptonemal complex protein SYP-4 regulates double-strand break formation through a negative feedback loop.
eLife 6:e23437.
https://doi.org/10.7554/eLife.23437


