Fluorescence Lifetime Imaging Microscopy reveals rerouting of SNARE trafficking driving dendritic cell activation
- Radboud Institute for Molecular Life Sciences, Radboud University Medical Center, Netherlands
Figures
Figure 1 with 1 supplement

SNARE complex formation by FRET-FLIM.
(A) Model of the neuronal SNAREs (crystal structure; protein database 3HD7 [Stein et al., 2009]) with the C-termini of syntaxin 1 (red) conjugated to mCitrine (3DQ1 [Ho et al., 2008]; yellow) and VAMP2 (blue) conjugated to mCherry (2H5Q [Shu et al., 2006]; magenta). mCitrine (donor fluorophore) and mCherry (acceptor) are within 3 nm proximity resulting in FRET. Green: SNAP25. (B) Scheme of membrane fusion resulting in FRET. (C) Representative confocal microscopy (left) and FLIM (right) images of dendritic cells expressing Stx3-mCitrine (green in merge; upper panels), Stx3-mCitrine with VAMP3-mCherry (magenta; middle panels), or Stx3 conjugated to both mCitrine and mCherry (Stx3-mCitrine-mCherry; lower panels). Apparent fluorescence lifetimes of Stx3-mCitrine with VAMP3-mCherry were lowest at the cell membrane (yellow arrowheads). Scale bars, 10 µm. Full lifetime/intensity lookup table and lifetime images are in Figure 1—figure supplement 1D–E.
Figure 1—figure supplement 1
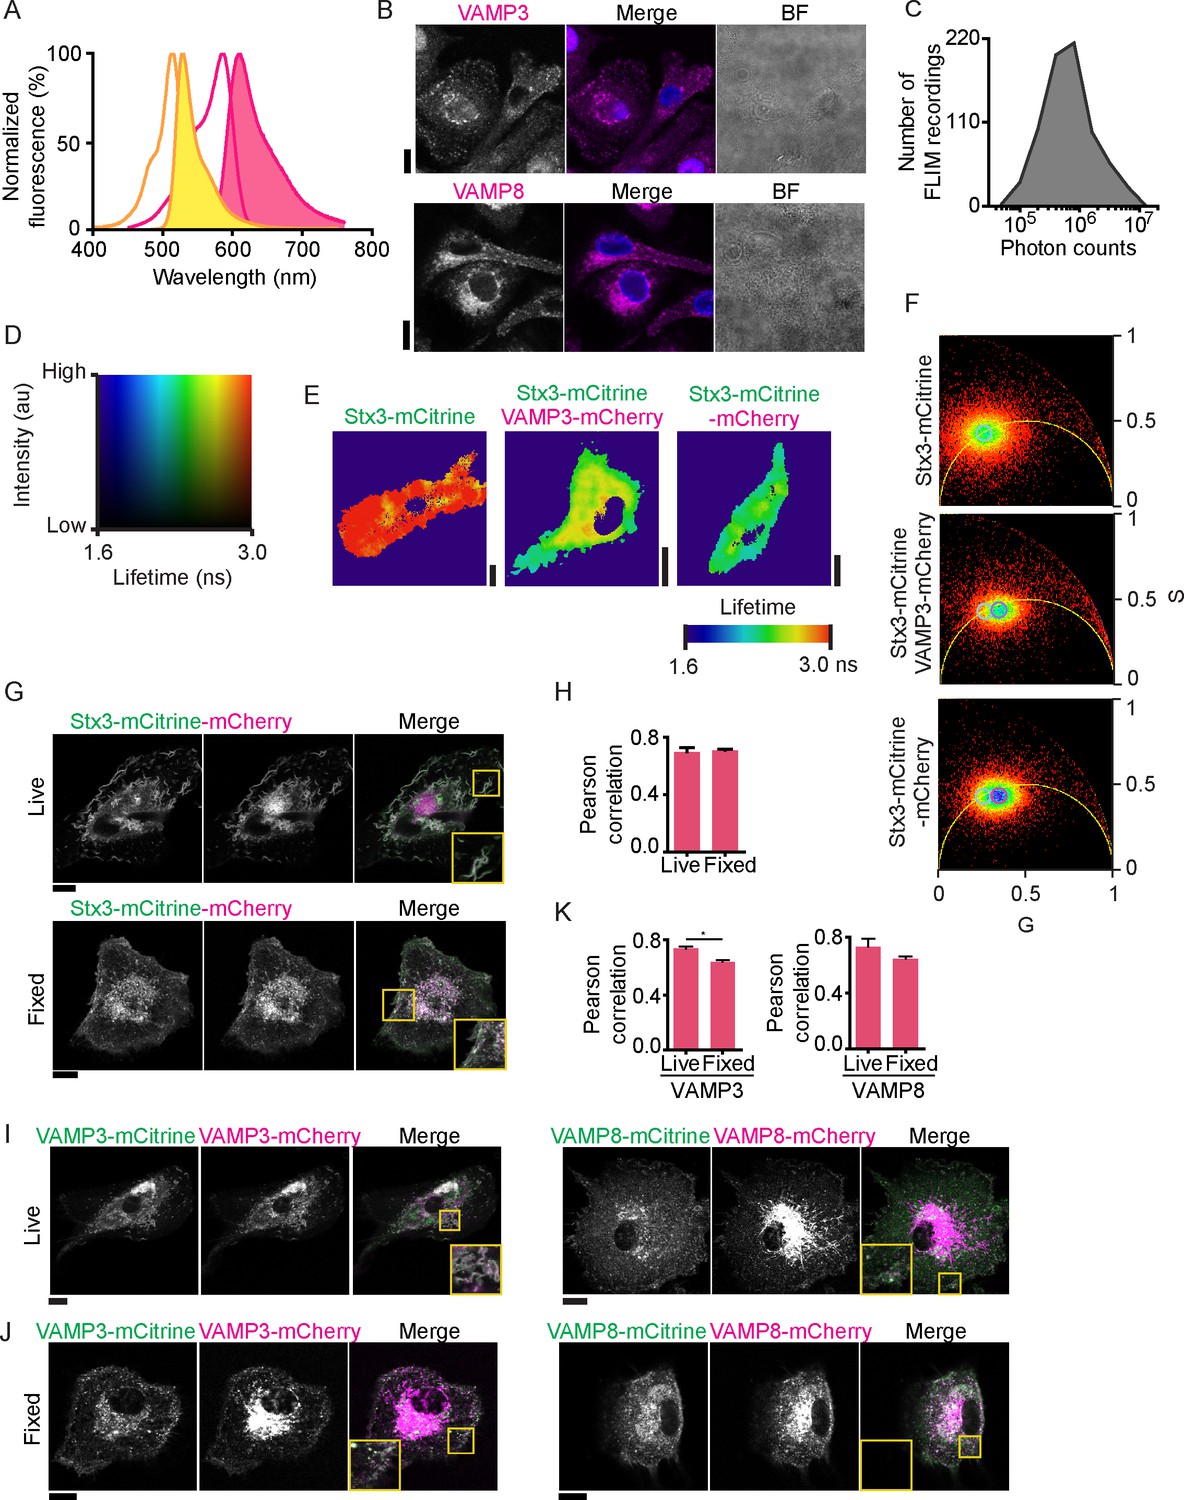
Lifetime images, confocal images and phasor analysis belonging to main Figure 1.
(A) The excitation (open curves) and emission (filled curves) spectra of mCitrine (yellow) and mCherry (pink) (data from Chroma Technology). (B) Representative confocal microscopy images of antibody staining of endogenous VAMP3 (top; magenta in merge) and VAMP8 (bottom) in dendritic cells. Blue: DAPI. BF: bright-field. (C) Distribution of total photon counts for all fluorescence lifetime recordings. (D) Full lookup table belonging to the FLIM images. Plotted is the fluorescence intensity (y-axis) versus the fluorescence lifetime (x-axis). (E) Fluorescence lifetime images belonging to main Figure 1C. FLIM images were generated by convolution of these lifetime images with the fluorescence intensities (i.e., the mCitrine images shown in the main figure). (F) Phasor plots for the cells shown in main Figure 1C. Cyan circles: center of the phasor location for Stx3-mCitrine in absence of acceptor fluorophore (upper graph); purple circles: center for Stx3-mCitrine with VAMP3-mCherry (middle graph); pink circle: center for Stx3-mCitrine-mCherry (lower graph). (G) Representative confocal microscopy images of live (top) and fixed (bottom) dendritic cells expressing the Stx3-mCitrine-mCherry tandem construct (mCitrine: green in merge; mCherry: magenta). (H) Pearson correlation coefficients for colocalization of the fluorophores of the Stx3-mCitrine-mCherry tandem construct for 3 donors (average ± SEM; paired two-sided Student’s t-test). (I–J) Same as panel G, but now for live (I) and fixed (J) cells co-expressing VAMP3-mCitrine with VAMP3-mCherry (left) or VAMP8-mCitrine with VAMP8-mCherry (right). (K) Pearson correlation coefficients for panels I–J (average ± SEM; VAMP3: p=0.046, paired two-sided Student’s t-test). Scale bars, 10 µm.
Figure 2 with 2 supplements

SNARE complex formation by whole-cell fluorescence lifetime measurements.
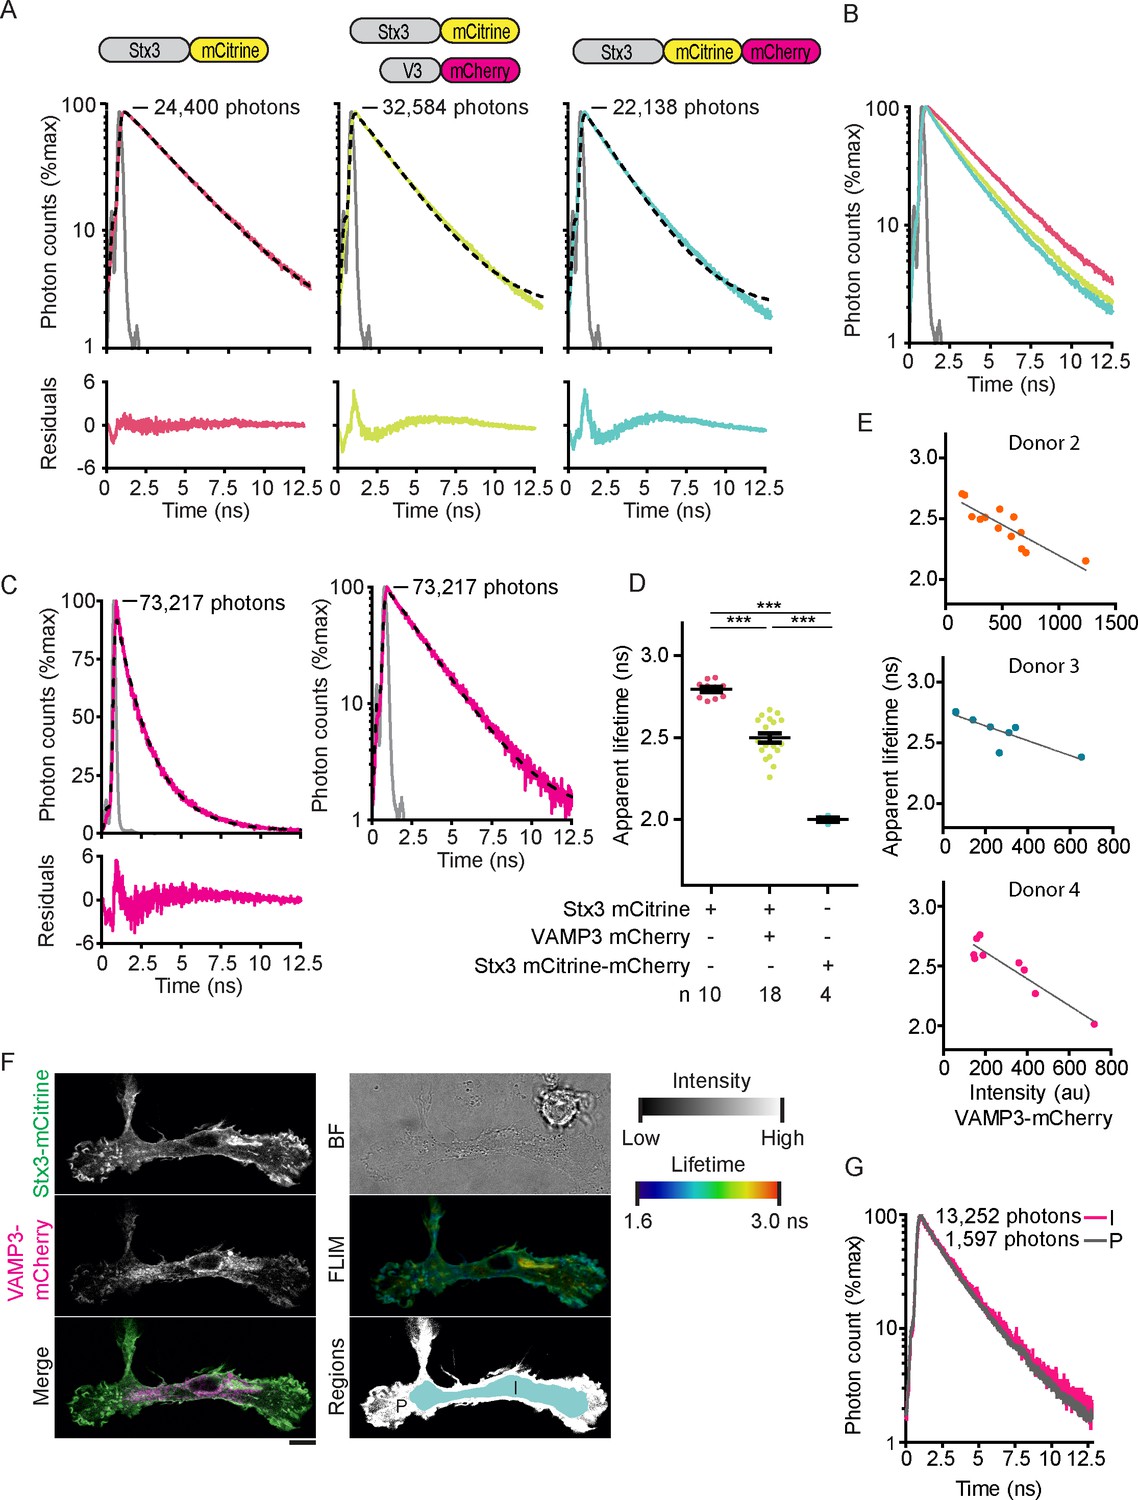
(A) Representative whole-cell fluorescence lifetime histograms of dendritic cells expressing Stx3-mCitrine (red curves; left graph), Stx3-mCitrine with VAMP3-mCherry (green; middle graph), or Stx3 conjugated to both mCitrine and mCherry (Stx3-mCitrine-mCherry; cyan; right graph). Dashed lines: fits with mono-exponential decay functions convoluted with the instrument response function (IRF; gray). Graphs are normalized to the maximum photon counts (depicted in each graph). Apparent fluorescence lifetimes for Stx3-mCitrine: 2.90 ns; for Stx3-mCitrine with VAMP3-mCherry: 2.29 ns; for Stx3-mCitrine-mCherry: 2.05 ns. Shown with logarithmic scaling in Figure 2—figure supplement 1A. (B) Overlap of the fluorescence lifetime decay curves from panel A (logarithmic scaling in Figure 2—figure supplement 1B). (C) Whole-cell apparent fluorescence lifetimes for the conditions from panel A. Shown are individual cells pooled from at least 4 donors (mean ± SEM shown; one-way ANOVA with Bonferroni correction; n: number of cells; individual donors in Figure 2—figure supplement 1D). (D) Whole-cell apparent fluorescence lifetimes of Stx3-mCitrine as a function of the expression level of VAMP3-mCherry (by fluorescence intensities) of a representative donor (more donors in Figure 2—figure supplement 1E). Dashed line: linear regression (β = −0.008; R2 = 0.800). (E) Apparent fluorescence lifetimes of dendritic cells expressing Stx3-mCitrine with VAMP3-mCherry at the peripheral region (P) vs. the internal region (I) of the imaged cell areas (Figure 2—figure supplement 1F–G). Individual cells from five donors are shown (grey curve: line of equality; black dashed curve: linear regression (β = 1.174; R2 = 0.821)). Note that for most cells, the lifetime at the periphery is lower than at intracellular regions (Paired two-sided Student’s t-test; p=0.0078). (F) Fluorescence lifetime histogram from panel A for a dendritic cell co-expressing Stx3-mCitrine with VAMP3-mCherry, but now fitted with a double-exponential decay function with the lifetimes of the slow (2.8 ns) and fast (2.0 ns) components fixed and convoluted with the IRF (gray curve). The percentage FRET (% FRET) was calculated as the amplitude of the fast component over the total amplitude and was 81% (logarithmic scaling in Figure 2—figure supplement 2A). (G) Same as panel C, but now fitted with double-exponential decay functions and % FRET shown. (H) Same as panel D, but now fitted with double-exponential decay functions and % FRET shown (more donors in Figure 2—figure supplement 2B). Dashed line: linear regression (β = 0.927; R2 = 0.771).
Figure 2—figure supplement 1
Fluorescence lifetime histograms fitted with mono-exponential decay functions and calibration of FLIM setup.
(A) Same as main Figure 2A, but now with logarithmic scaling. Shown are representative whole-cell fluorescence lifetime decay curves of dendritic cells expressing Stx3-mCitrine (red curves; left graphs), Stx3-mCitrine with VAMP3-mCherry (green; middle graphs), or Stx3 conjugated to both mCitrine and mCherry (Stx3-mCitrine-mCherry; cyan; right graphs). Dashed lines: fits with mono-exponential decay functions convoluted with the instrument response function (IRF; gray; residuals from the fits shown). Graphs are normalized to the maximum photon counts (depicted in each graph). (B) Same as main Figure 2B, but now with logarithmic scaling. Shown is the overlap of the fluorescence lifetime decay curves from panel A. (C) Representative fluorescence lifetime decay curve of rhodamine B in methanol (about 1 µM concentration; magenta curves). Dashed line: fit with a mono-exponential decay function. The fit is shown with a linear (left) and a logarithmic (right) scaling. A fluorescence lifetime was obtained of 2.19 ± 0.04 ns (mean ± SEM from four independent measurements), close to the reported lifetime of 2.32 ns (Kristoffersen et al., 2014). (D) Same as main Figure 2C, but now the average whole-cell apparent fluorescence lifetimes of individual donors are shown (n: number of donors; mean ± SEM shown; one-way ANOVA with Bonferroni correction). (E) Same as main Figure 2D for three more donors. Shown are whole-cell apparent fluorescence lifetimes of Stx3-mCitrine from fits with mono-exponential decay functions for individual cells co-expressing Stx3-mCitrine with VAMP3-mCherry. Dashed lines: linear regression (top: β = −0.001, R2 = 0.756; middle: β = −0.001, R2 = 0.702; bottom: β = −0.001, R2 = 0.869). (F) Representative confocal microscopy and FLIM images of a dendritic cell co-expressing Stx3-mCitrine (green in merge) and VAMP3-mCherry (magenta). The intracellular (I; light blue in lower right panel) and peripheral (P; white) regions of the imaged cell area were manually selected. BF: bright-field. Scale bar, 10 µm. (G) Whole-cell fluorescence lifetime decay curves of the intracellular (I) and peripheral (P) cell regions for the cell from panel F. The apparent fluorescence lifetimes obtained from mono-exponential fits were 2.41 ns (I) and 2.24 ns (P).
Figure 2—figure supplement 2
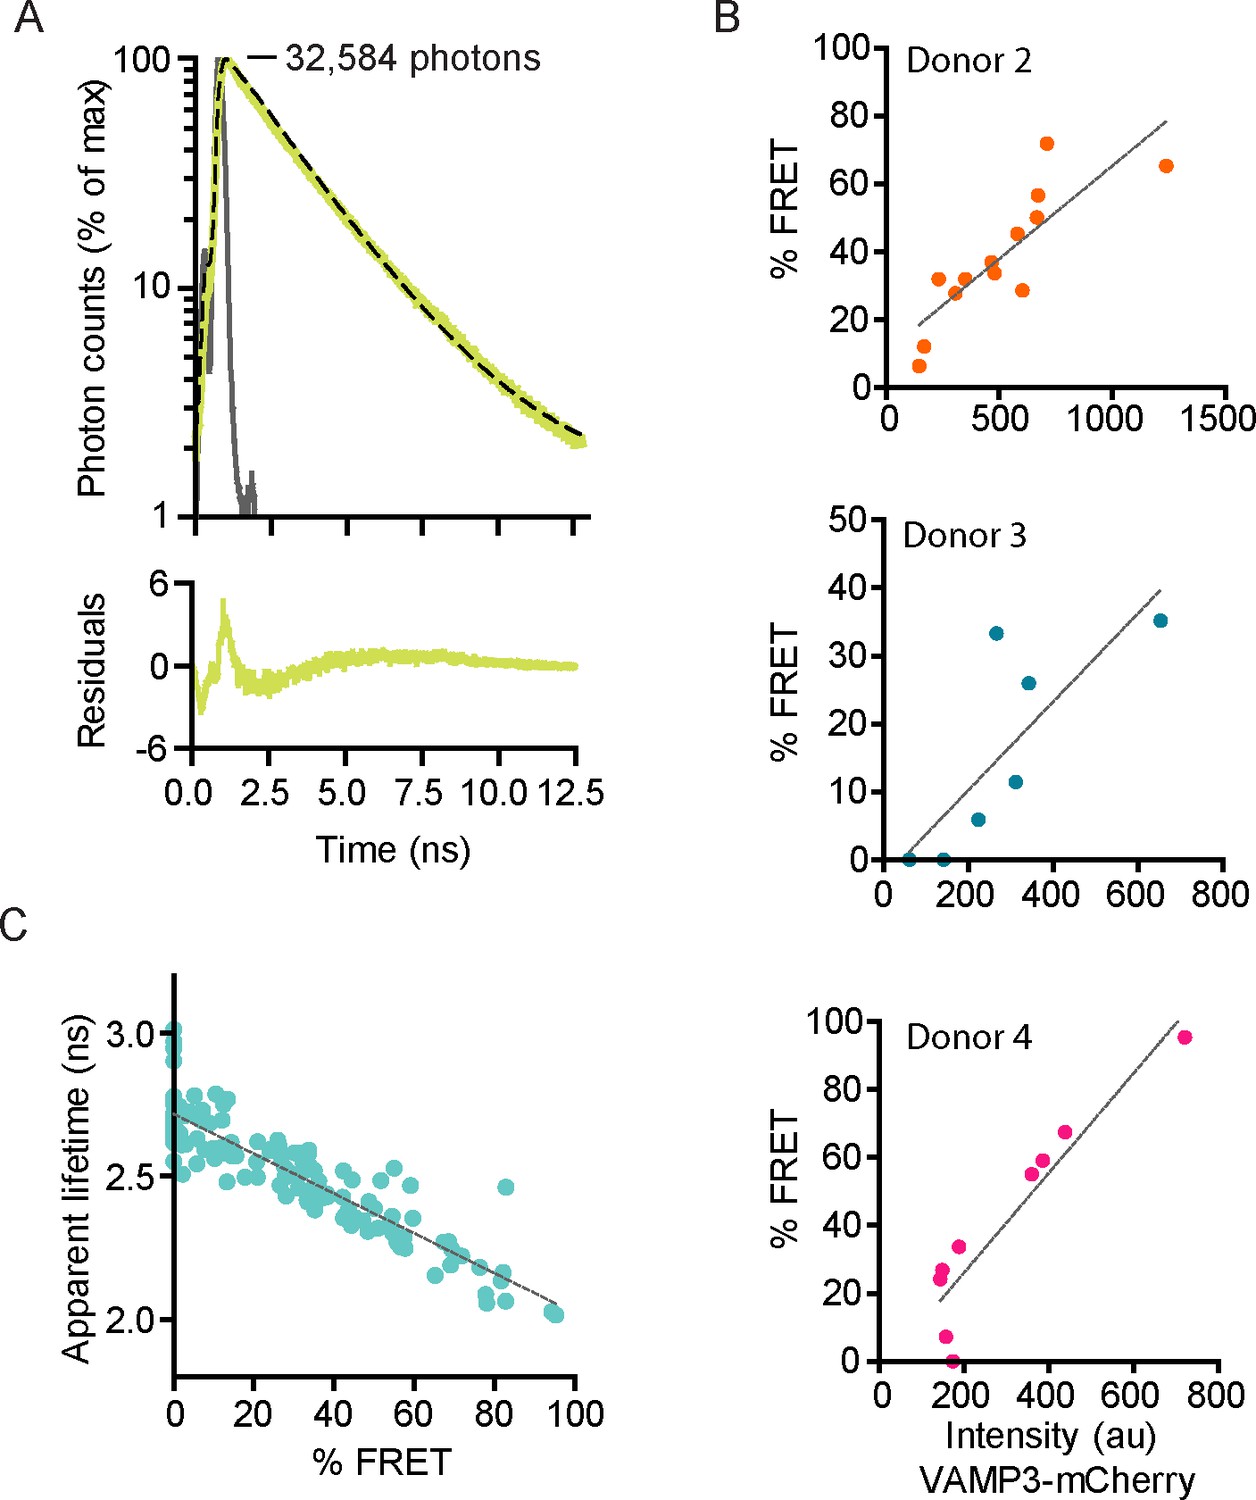
Fluorescence lifetime histograms fitted with double-exponential decay functions.
(A) Same as main Figure 2F, but now with logarithmic scaling. Shown is a representative whole-cell fluorescence lifetime histogram of a dendritic cell co-expressing Stx3-mCitrine with VAMP3-mCherry. Dashed line: fit with double-exponential decay function convoluted with the instrument response function (IRF; gray; residuals from the fit shown). Graphs are normalized to the maximum photon counts (depicted in graph). (B) Same as main Figure 2H for three more donors. Shown are % FRET from fits with double-exponential decay functions for individual cells co-expressing Stx3-mCitrine with VAMP3-mCherry. Dashed lines: linear regression (top: β = 0.055, R2 = 0.704; middle: β = 0.065, R2 = 0.674; bottom: β = 0.147, R2 = 0.867). (C) The apparent fluorescence lifetime from mono-exponential fits as a function of the % FRET from double exponential fits for individual cells co-expressing Stx3-mCitrine with VAMP3-mCherry. Dashed line: linear regression (β = −0.007, R2 = 0.812).
Figure 3 with 1 supplement
Forced interactions between SNAREs increases FRET while FRET is reduced with a fusion incompetent VAMP3 mutant.
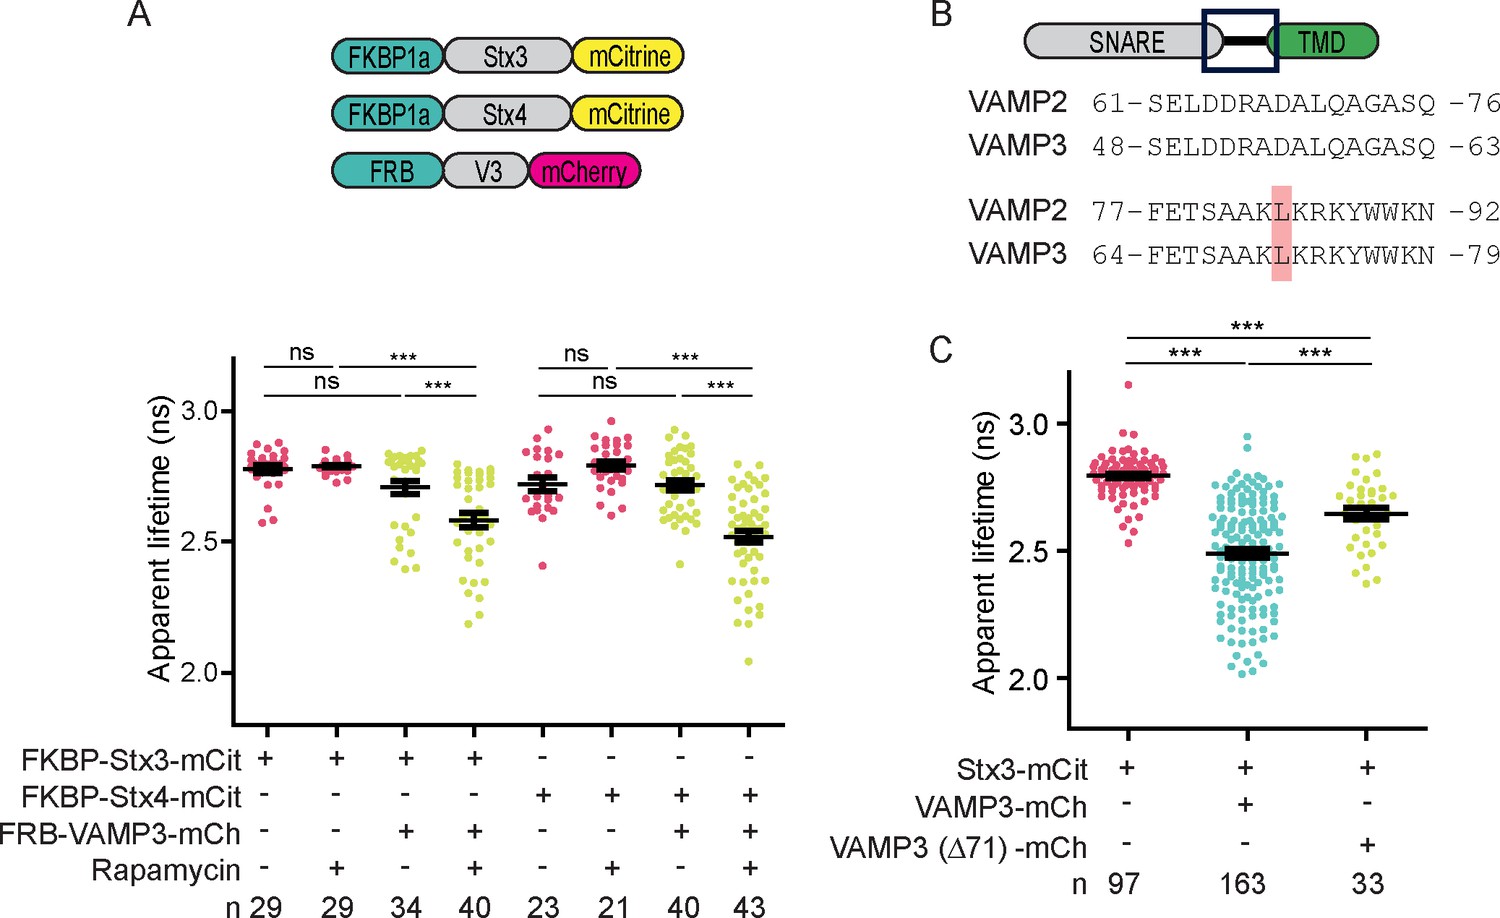
(A) Whole-cell apparent fluorescence lifetimes for dendritic cells expressing FKBP-Stx3-mCitrine or FKBP-Stx4-mCitrine together with FRB-VAMP3-mCherry and incubated in absence or presence of rapamycin or a rapamycin analogue. (B) Alignment of VAMP2 and VAMP3 (mouse sequences) showing 100% identity of the region containing leucines 84 (VAMP2) and 71 (VAMP3). (C) Whole-cell apparent fluorescence lifetimes for dendritic cells expressing Stx3-mCitrine with wild-type VAMP3-mCherry or a mutant lacking leucine 71 (VAMP3(Δ71)-mCherry). Shown in panels A and C are individual cells pooled from at least 4 donors (mean ± SEM shown; one-way ANOVA with Bonferroni correction; n: number of cells). Representative confocal and FLIM images are in Figure 3—figure supplement 1.
Figure 3—figure supplement 1

FLIM images belonging to main Figure 3.
(A) Representative confocal microscopy, convoluted FLIM and fluorescence lifetime images of dendritic cells expressing FKBP-Stx3-mCitrine (upper panel) or FKBP-Stx4-mCitrine (lower panel; green in merge) together with FRB-VAMP3-mCherry (magenta) and incubated in absence or presence of a rapamycin analogue. (B) Representative confocal microscopy, convoluted FLIM and lifetime images of dendritic cells expressing Stx3-mCitrine (green) with mutant VAMP3-mCherry lacking leucine 71 (VAMP3(Δ71)-mCherry; magenta). Scale bars, 10 µm.
Figure 4 with 1 supplement
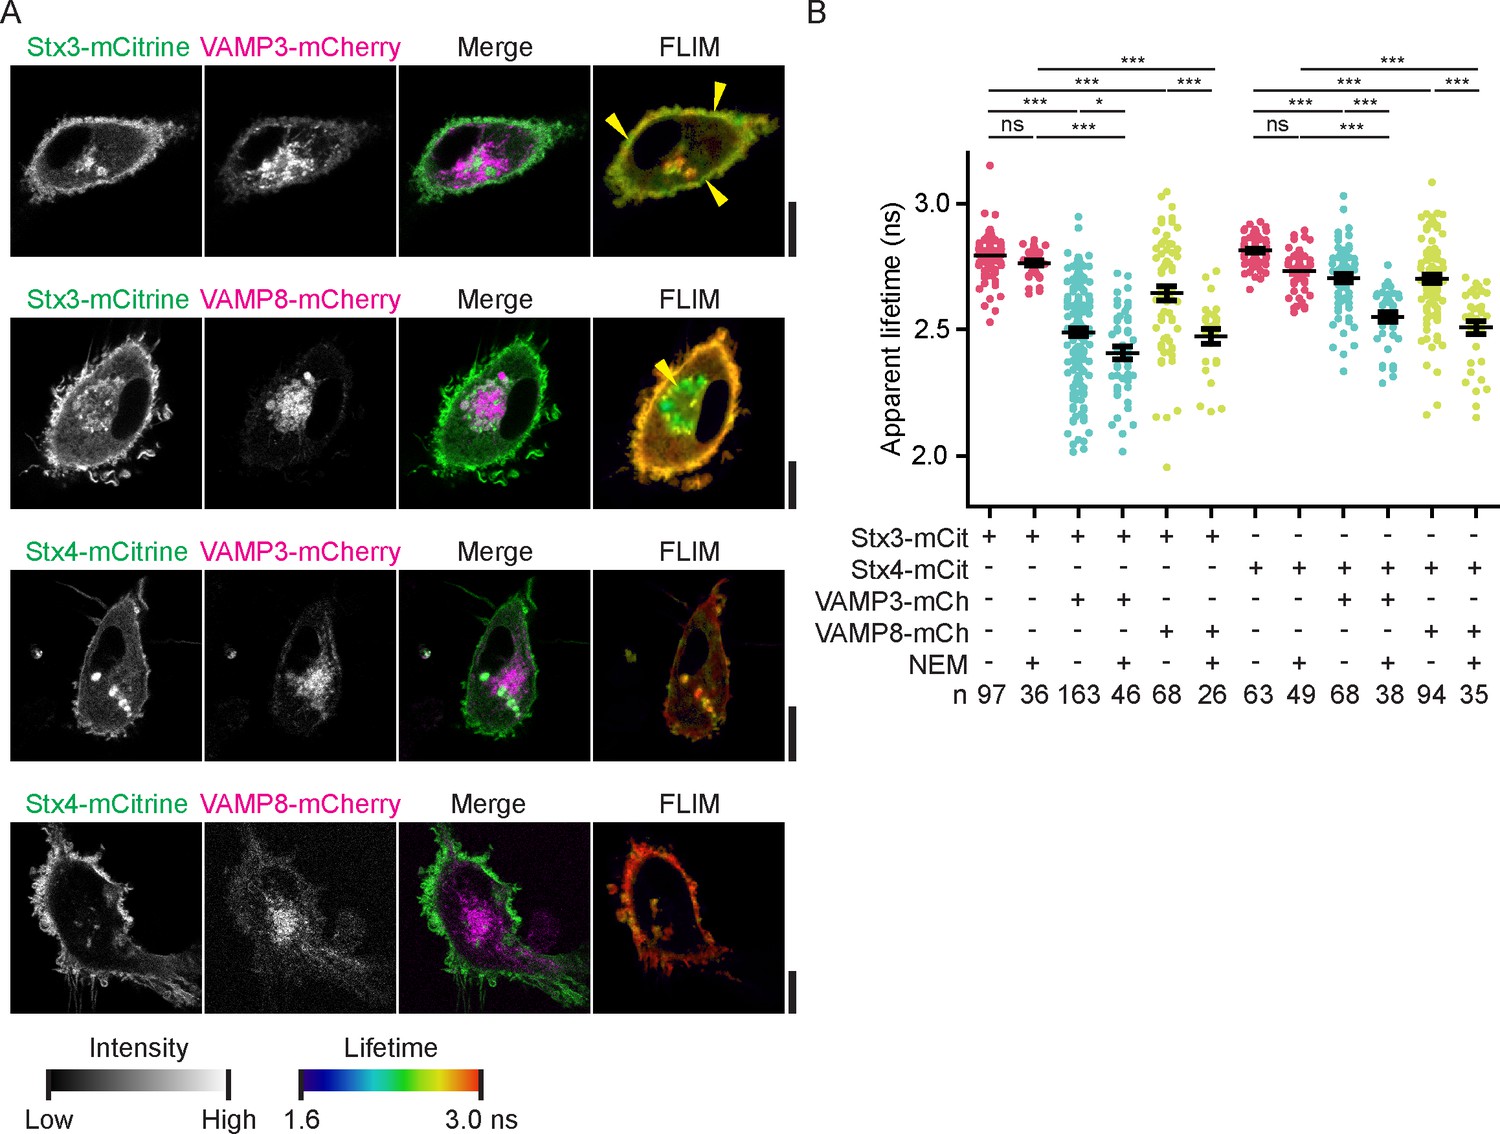
FRET-FLIM of Stx3 and Stx4 with VAMP3 and VAMP8.
(A) Representative confocal microscopy (left) and convoluted FLIM (right) images of dendritic cells expressing Stx3-mCitrine or Stx4-mCitrine (green in merge) with VAMP3-mCherry or VAMP8-mCherry (magenta). The apparent fluorescence lifetimes of Stx3-mCitrine with VAMP3-mCherry were lowest at the cell membrane, whereas the lifetimes with VAMP8-mCherry were lowest at intracellular compartments (yellow arrowheads). Scale bars, 10 µm. Lifetime images are in Figure 4—figure supplement 1A. (B) Whole-cell apparent fluorescence lifetimes for the conditions from panel A, both in presence or absence of NEM. Shown are individual cells pooled from at least 3 donors (mean ± SEM shown; one-way ANOVA with Bonferroni correction; n: number of cells; individual donors in Figure 4—figure supplement 1B).
Figure 4—figure supplement 1
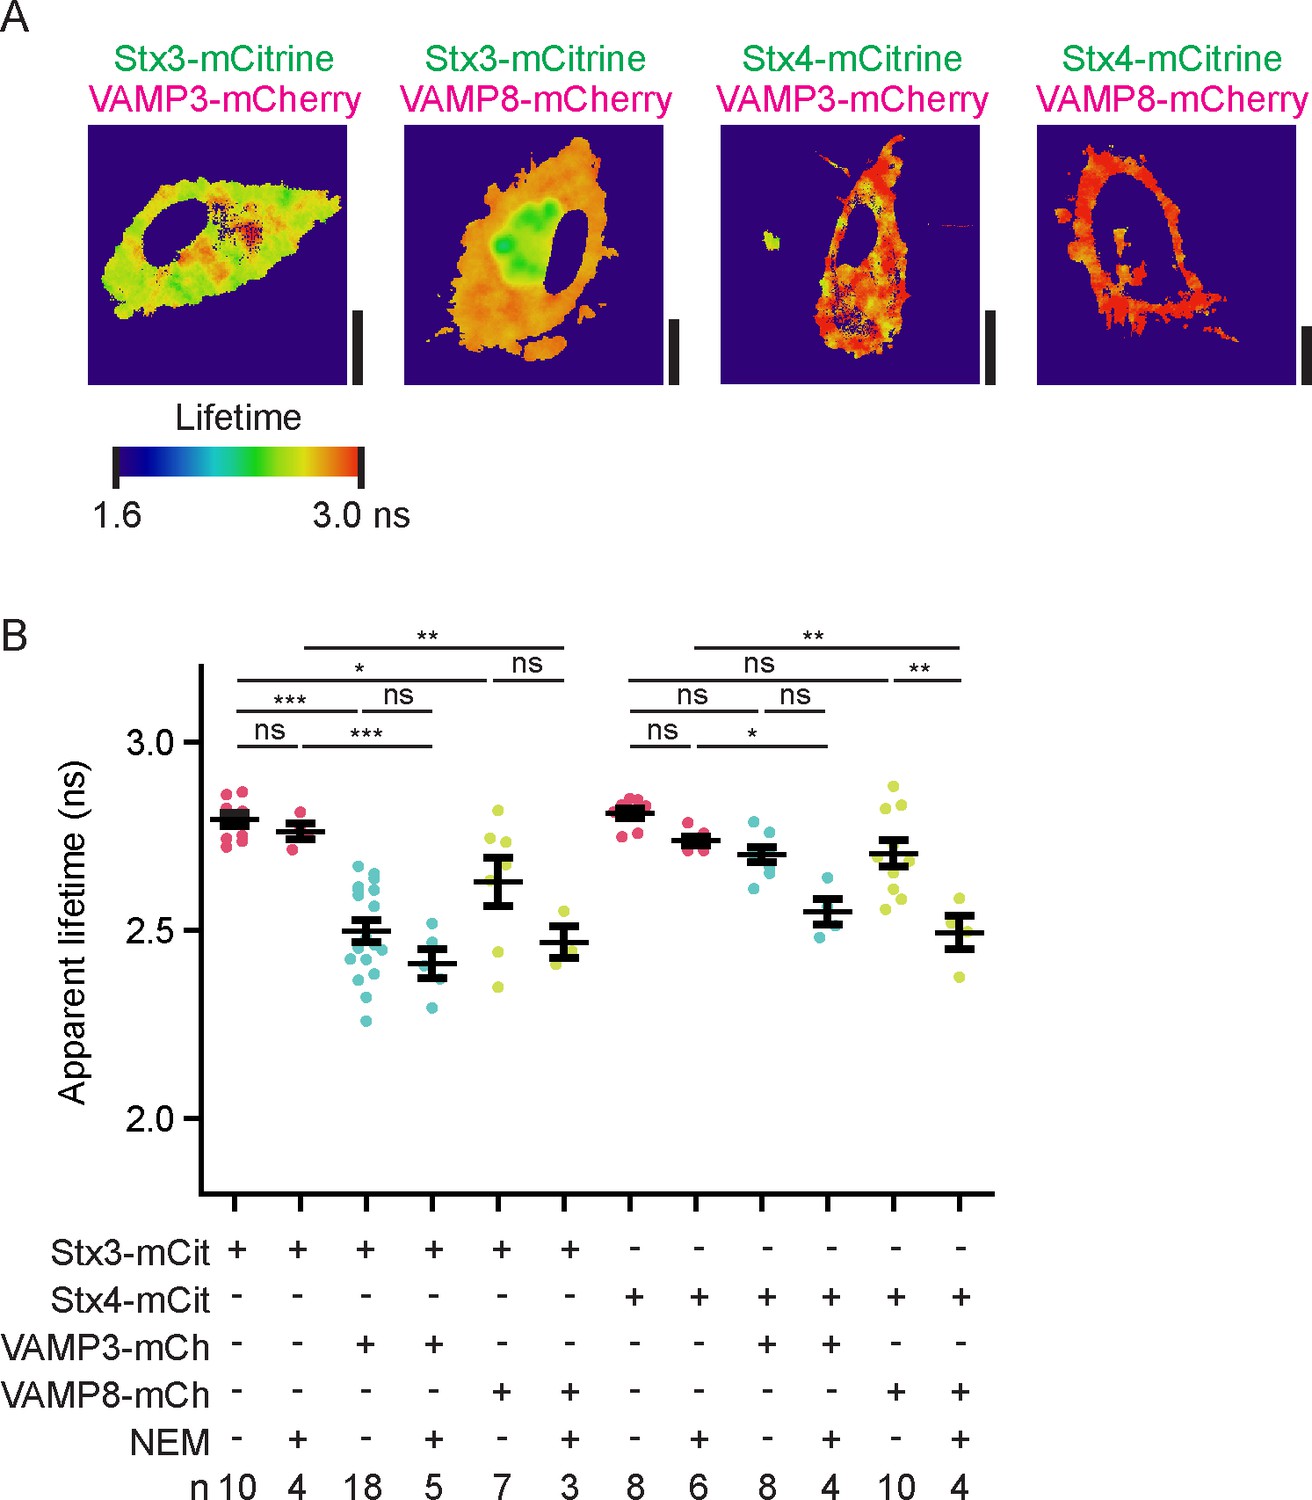
Fluorescence lifetime images belonging to main Figure 4.
(A) Fluorescence lifetime images belonging to main Figure 4A. FLIM images were generated by convolution of these lifetime images with the fluorescence intensities (i.e., the mCitrine images shown in the main figure). Scale bars, 10 µm. (B) Same as main Figure 4B, but now with the averages for individual donors. Shown are donor-averaged whole-cell apparent fluorescence lifetimes of dendritic cells expressing Stx3-mCitrine or Stx4-mCitrine with or without VAMP3-mCherry or VAMP8-mCherry and in absence or presence of NEM treatment (mean ± SEM shown; one-way ANOVA with Bonferroni correction; n: number of donors).
Figure 5 with 1 supplement
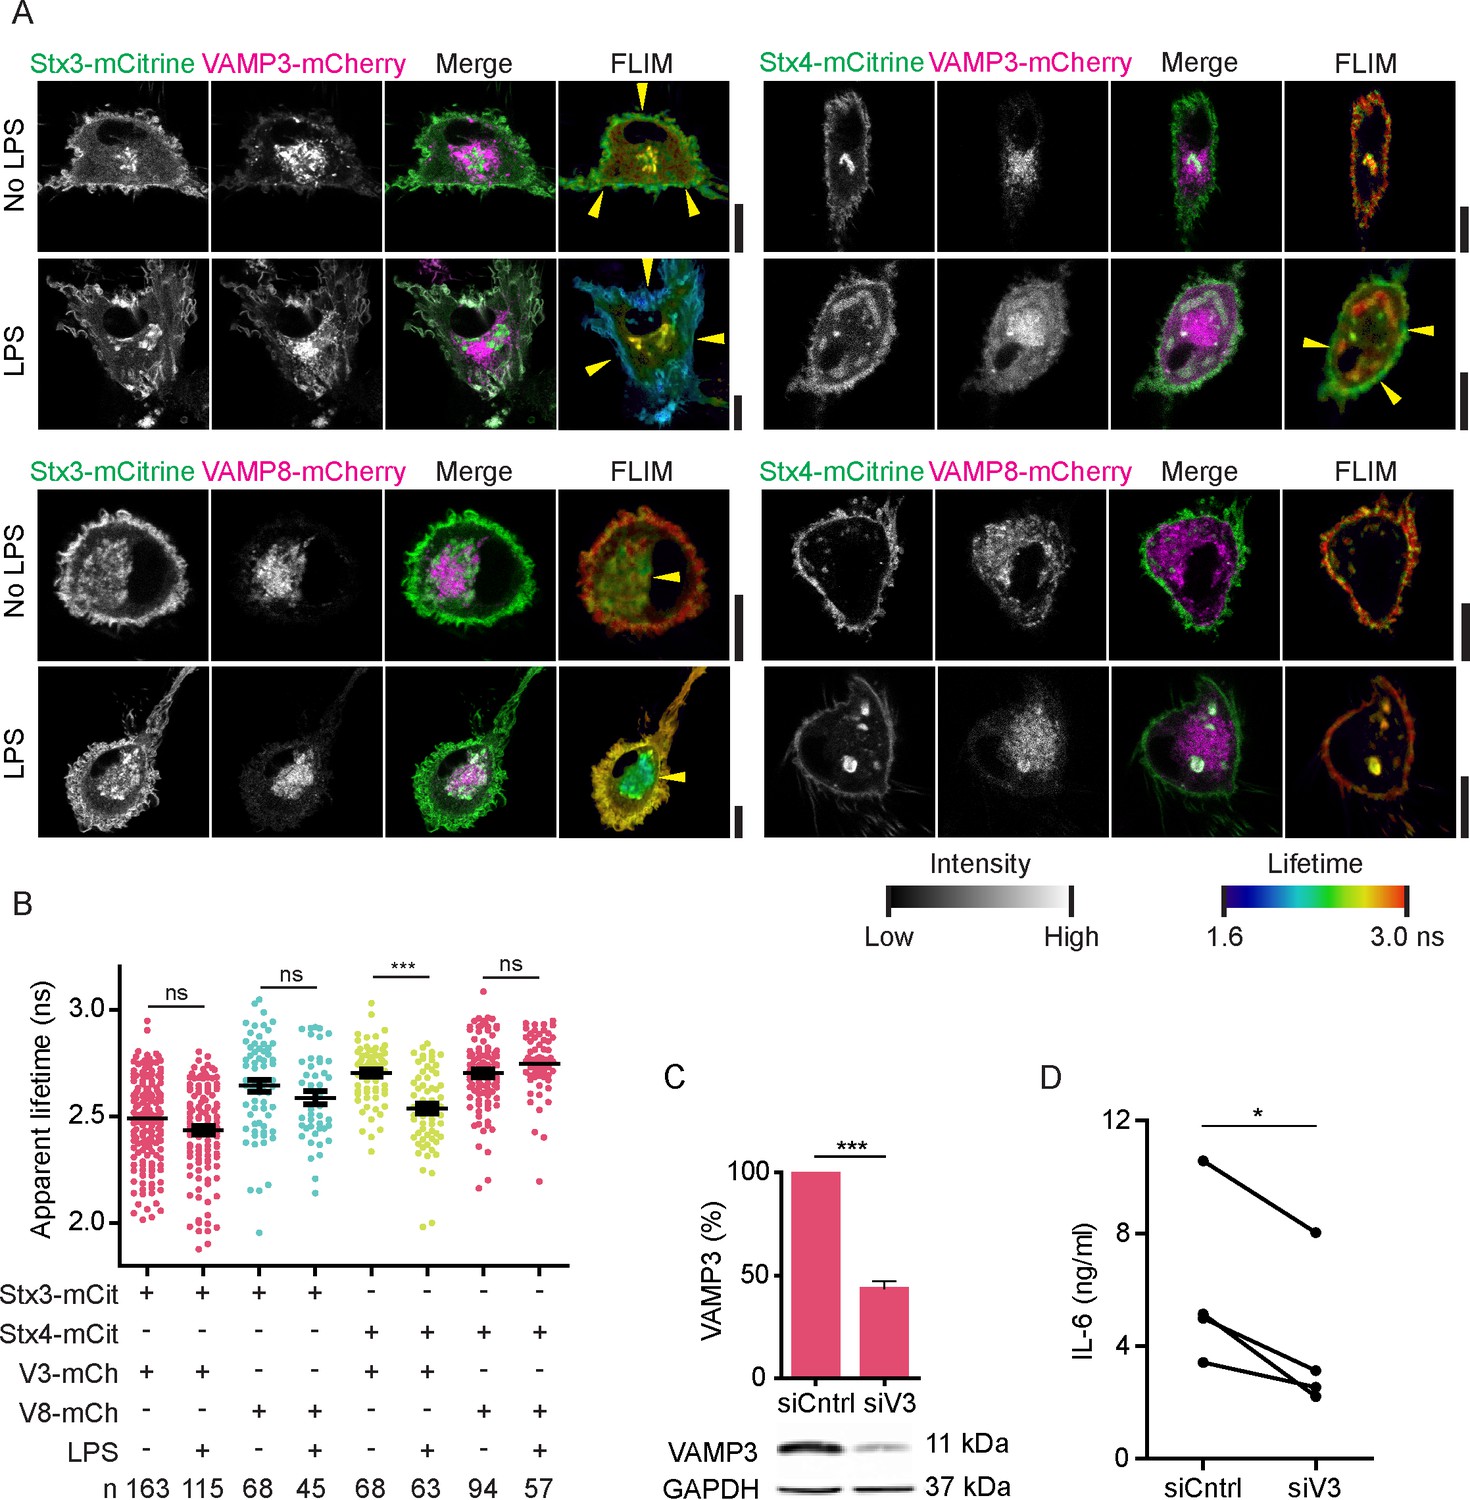
LPS activation of dendritic cells increases complex formation of Stx4 with VAMP3 at the plasma membrane.
(A) Representative confocal microscopy (left) and convoluted FLIM (right) images of unstimulated or LPS-activated dendritic cells expressing Stx3-mCitrine or Stx4-mCitrine (green in merge) with VAMP3-mCherry or VAMP8-mCherry (magenta). Apparent fluorescence lifetimes of Stx3-mCitrine and Stx4-mCitrine with VAMP3-mCherry were lowest at the cell membrane (yellow arrowheads), whereas the lifetimes of Stx3-mCitrine with VAMP8-mCherry were lowest at intracellular compartments (yellow arrowheads). Scale bars, 10 µm. Lifetime images are in Figure 5—figure supplement 1A. (B) Whole-cell apparent fluorescence lifetimes for the conditions from panel A in presence or absence of LPS. Shown are individual cells pooled from at least 4 donors (mean ± SEM shown; one-way ANOVA with Bonferroni correction; n: number of cells; individual donors in Figure 5—figure supplement 1D). (C) Representative Western blot and quantification of siRNA knockdown of VAMP3 (siV3; p=0.0001, paired two-sided Student’s t-test). siCntrl: non-targeting siRNA control. GAPDH: loading control. (D) IL-6 production after 24 hr LPS exposure by dendritic cells with VAMP3 knockdown (siV3) or siCntrl (individual donors shown; p=0.0199, paired two-sided Student’s t-test; time traces shown in Figure 5—figure supplement 1E).
Figure 5—figure supplement 1
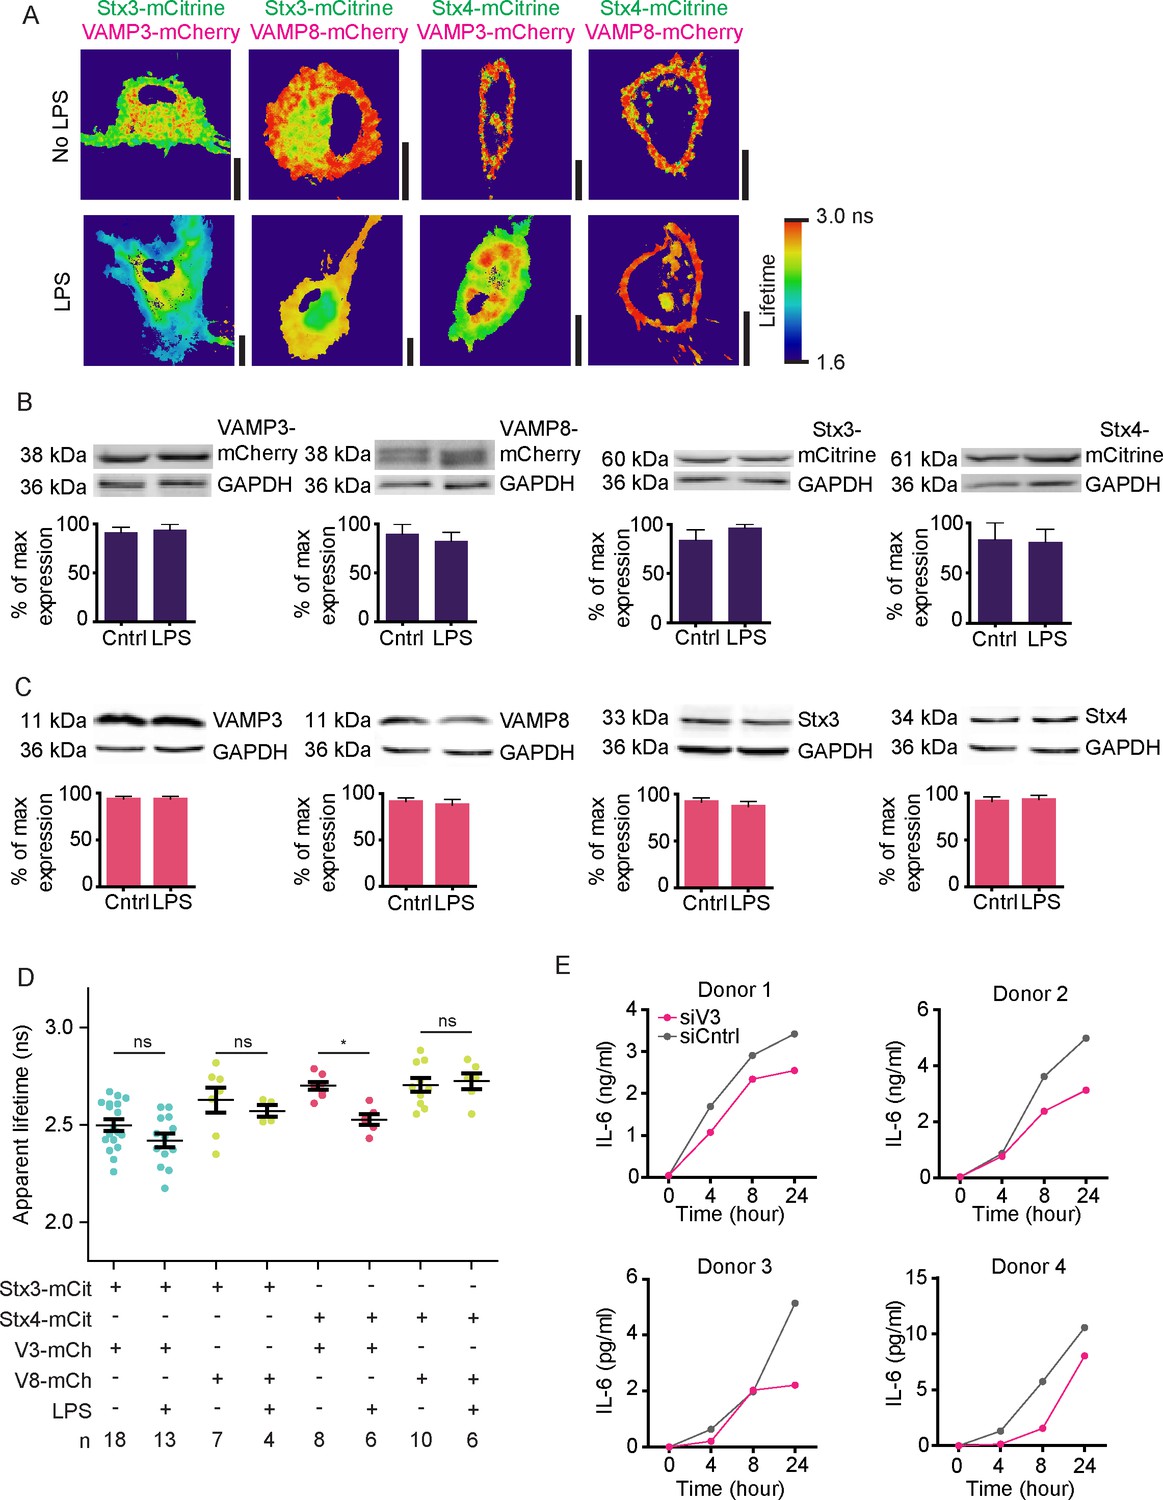
Fluorescence lifetime images belonging to main Figure 5, expression levels of endogenous and overexpressed SNAREs upon LPS treatment and time traces of IL-6 secretion.
(A) Fluorescence lifetime images belonging to main Figure 5A. FLIM images were generated by convolution of these lifetime images with the fluorescence intensities (i.e., the mCitrine images shown in the main figure). Scale bars, 10 µm. (B) Expression levels of overexpressed Stx3, Stx4, VAMP3, and VAMP8 by dendritic cells with and without overnight LPS-activation. Shown are representative Western blots and quantification (mean ± SEM from 3 donors). GAPDH: loading control. VAMP8-mCherry appears as a double band because of incomplete stripping of the GAPDH antibody (lower band). LPS treatment did not result in significant changes in SNARE expression (paired two-sided Student’s t-tests). (C) Same as panel B, but now for endogenous Stx3, Stx4, VAMP3, and VAMP8. (D) Same as main Figure 5B, but now with the averages for individual donors. Shown donor-averaged whole-cell apparent fluorescence lifetimes of dendritic cells expressing Stx3-mCitrine or Stx4-mCitrine with or without VAMP3-mCherry or VAMP8-mCherry and in absence or presence of LPS treatment (mean ± SEM shown; one-way ANOVA with Bonferroni correction; n: number of donors). (E) Time course of IL-6 secretion with siCntrl or siV3 knock-down for four individual donors.
Download links
A two-part list of links to download the article, or parts of the article, in various formats.
Downloads (link to download the article as PDF)
Open citations (links to open the citations from this article in various online reference manager services)
Cite this article (links to download the citations from this article in formats compatible with various reference manager tools)
Fluorescence Lifetime Imaging Microscopy reveals rerouting of SNARE trafficking driving dendritic cell activation
eLife 6:e23525.
https://doi.org/10.7554/eLife.23525


