Engineering of a synthetic quadrastable gene network to approach Waddington landscape and cell fate determination
- Arizona State University, United States
- King’s College, University of Aberdeen, United Kingdom
Figures
Figure 1 with 1 supplement

Conceptual and experimental design of MINPA and its sub-networks.
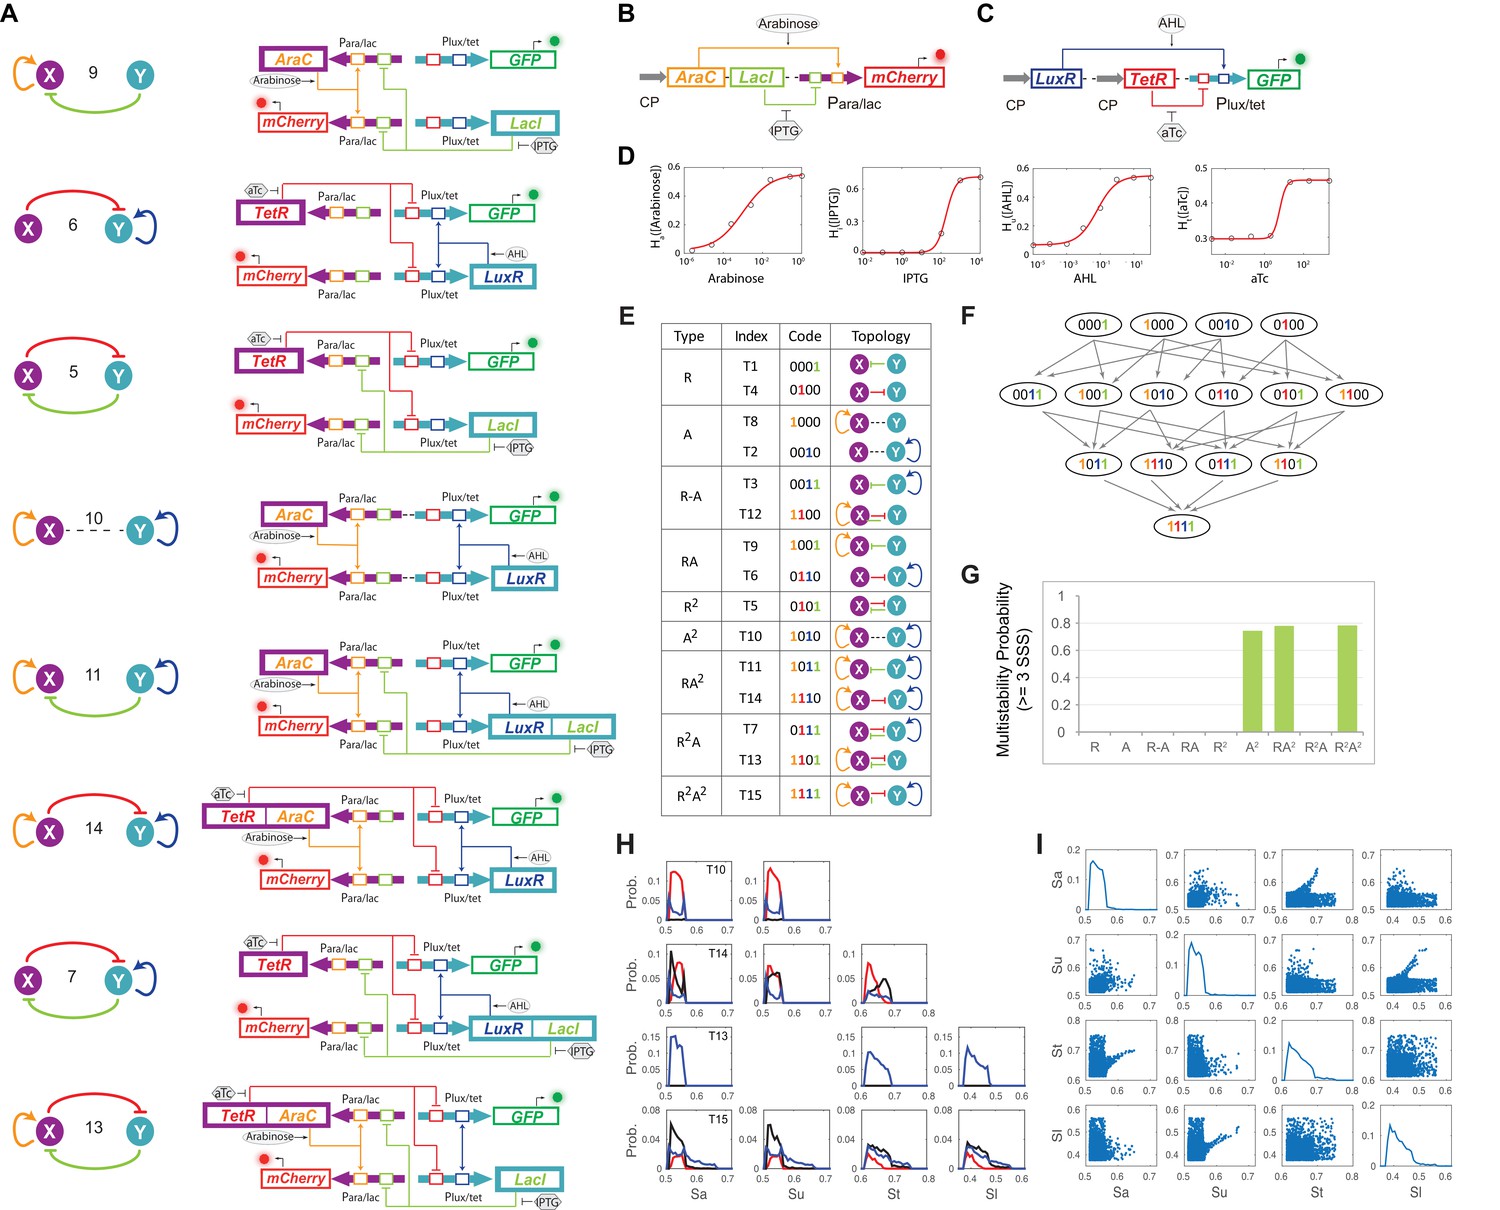
(A) Abstract diagram of MINPA topology, where X and Y mutually inhibit (T-bars) each other and auto-activate (arrowheads) itself. Four inducers to regulate the four color-coded regulatory edges are also listed. (B) Molecular implementation of the MINPA network. Para/lac (purple arrow) is activated by AraC (yellow) and repressed by LacI (light green), while Plux/tet (cyan arrow) is activated by LuxR (blue) and repressed by TetR (red). Arabinose and AHL (oval) can induce AraC and LuxR activation, respectively. IPTG and aTc (hexagon) can respectively relieve LacI and TetR inhibition. GFP and mCherry serve as the readout of Para/lac and Plux/tet, respectively. Therefore, TetR and AraC collectively form the node X in (A), color-coded as purple rectangle. Similarly, LuxR and LacI collectively form the node Y in (A), color-coded as cyan rectangle. Genes, promoters and regulations are color-coded corresponding to the topology in (A). (C) List of MINPA and its 14 sub-networks. Numbering of indices is converted from topologies’ binary name (see Figure 1—figure supplement 1E for more details). T represents ‘topology’. R represents ‘repression’, and A represents ‘autoactivation’. Superscript is used to describe the number of such types of edges. Topologies with shaded background were later constructed and analyzed experimentally. (D–E) Dynamic responses for Para/lac (D) and Plux/tet (E) through induction with Arabinose (Ara) and IPTG, and AHL and aTc, respectively. Presented data was the mean value of three replicates. mCherry and GFP serves as the readout of the two promoters.
Figure 1—figure supplement 1
Experimental design, topological hierarchy and multistability probability analysis of MINPA sub-networks.
(A) Abstract diagrams and molecular implementation of the eight MINPA sub-network topologies, including tunable positive feedbacks (T6 and T9), mutual inhibition (T5), dual-positive feedbacks (T10), and their combinations (T7, T11, T13, and T14). Genes, promoters, and regulations are color-coded corresponding to the topology on the left side. (B–C) Biological devices for testing promoter Para/lac (B) and Plux/tet (C), respectively. Fluorescence was measured by flow cytometry at 12 hr and 24 hr (not shown) after adding the inducers. All the data points were averaged from three repeated experiments. Grey arrows represent constitutive promoters (BBa_K176009). (D) Principle components and optimal Hill functions fitted for hybrid promoter Para/lac and Plux/tet. (E) List of MINPA and its 14 sub-networks, which are named, and color-coded, as binary numbers based on the existence of regulatory edges. (F) Topological hierarchy of the 15 motifs. (G) Probability of multistability (tristability and quadrastability) for the nine experimentally constructed networks. SSS: stable steady states. The range for activation/repression strength is [0.3, 0.8], and the probability was calculated from the number of parameter sets giving rise to multistability over 2000-repeated computational simulations. (H) Histograms for parameter combination that have multistability in sub-networks of T10, T13, T14 and T15 (MINPA). For each sub-network, the network activation and inhibition strength Sa, Su, St and Sl are randomly selected from given ranges and the number of corresponding SSS is recorded. We repeat this procedure for all sub-networks for 2000 times and calculate the probabilities of bistability (blue lines), tristability (black lines) and quadrastability (red lines). (I) Scatter plots for all parameter combinations that have multistability in MINPA. We generate parameters using the same approach as (H) and select the parameter combinations that can generate three or four SSS in MINPA.
Figure 2 with 3 supplements

Sequential induction of MINPA and its sub-networks.
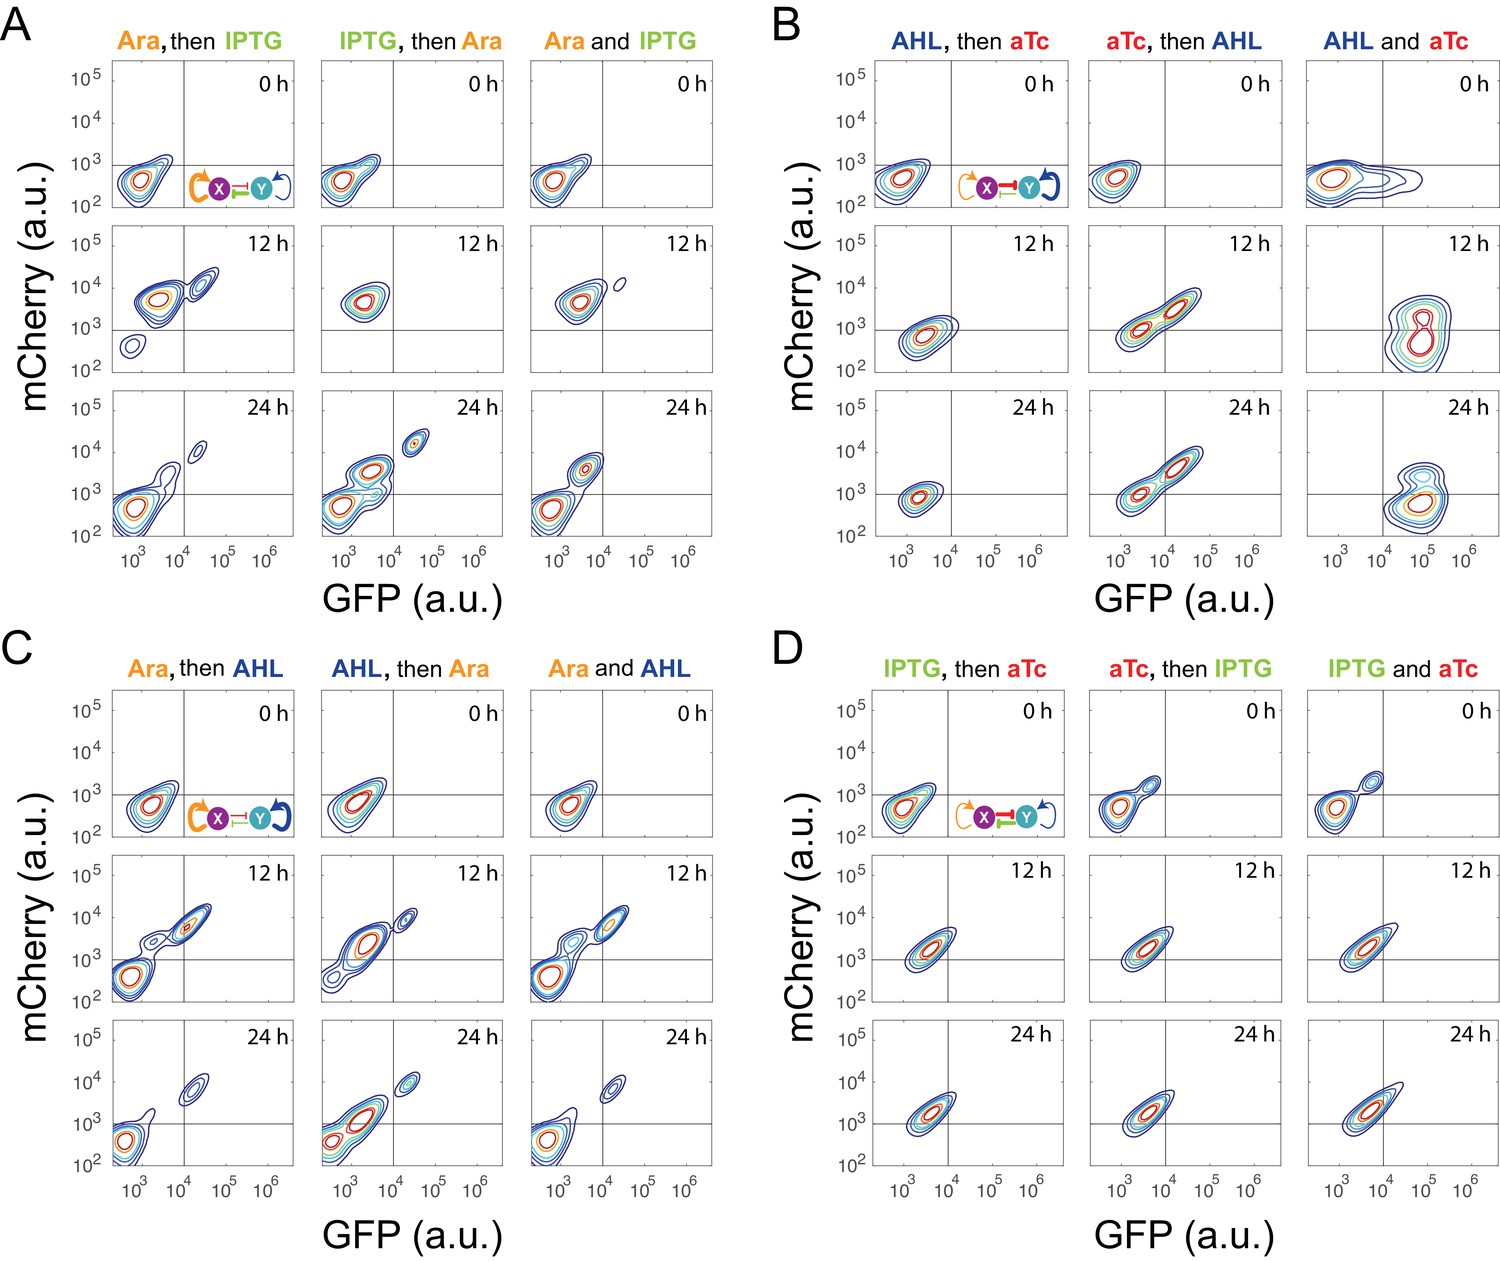
(A) Schematic illustration of rationale for sequential induction. This two-parameter bifurcation diagram of a bistable toggle-switch depicts all steady state values of response (Z-axis) with combinations of inducer I and II (X and Y axes). Arrows illustrate order and direction of inductions and consequent steady state value changes. Solid lines on the X-Y plane are the boundaries of bistability. Dashed lines on the X-Y plane are projections of solid white arrowheads. (B) Arabinose (Ara) and IPTG were sequentially (left and middle columns) or simultaneously (right column) applied to induce T9, T13, T11, and T15. T: topology. The concentration of Arabinose and IPTG is 2.5*10−5m/v, and 5*10−5 M, respectively. To indicate the effects of inducers, we used the same color for applied inducers and its regulated connections, which were also shown in bold lines. The other non-regulated connections are represented by thin lines. (C) AHL and aTc were sequentially (left and middle) or simultaneously (right) applied to induce T6, T7, T14, and T15. The concentration of AHL and aTc is 1*10−4 M, and 200 ng/ml, respectively. (D) Ara and AHL were sequentially (left and middle) or simultaneously (right) applied to induce T10, T14, T11, and T15. The concentration of Arabinose and AHL is 2.5*10−5m/v, and 1*10−8 M, respectively. Samples were treated with the first inducer till OD600 is about 0.15 and then the second inducer was added. Cells were grown for another 24 hr before measured by flow cytometry. The experiments were performed in triplicate and repeated two times, and representative results are presented. The inducers are color-coded as visual assistance to indicate which edge of inset diagram it regulates.
Figure 2—figure supplement 1
Experimental design and validation of sequential induction strategy in a synthetic toggle switch circuit.
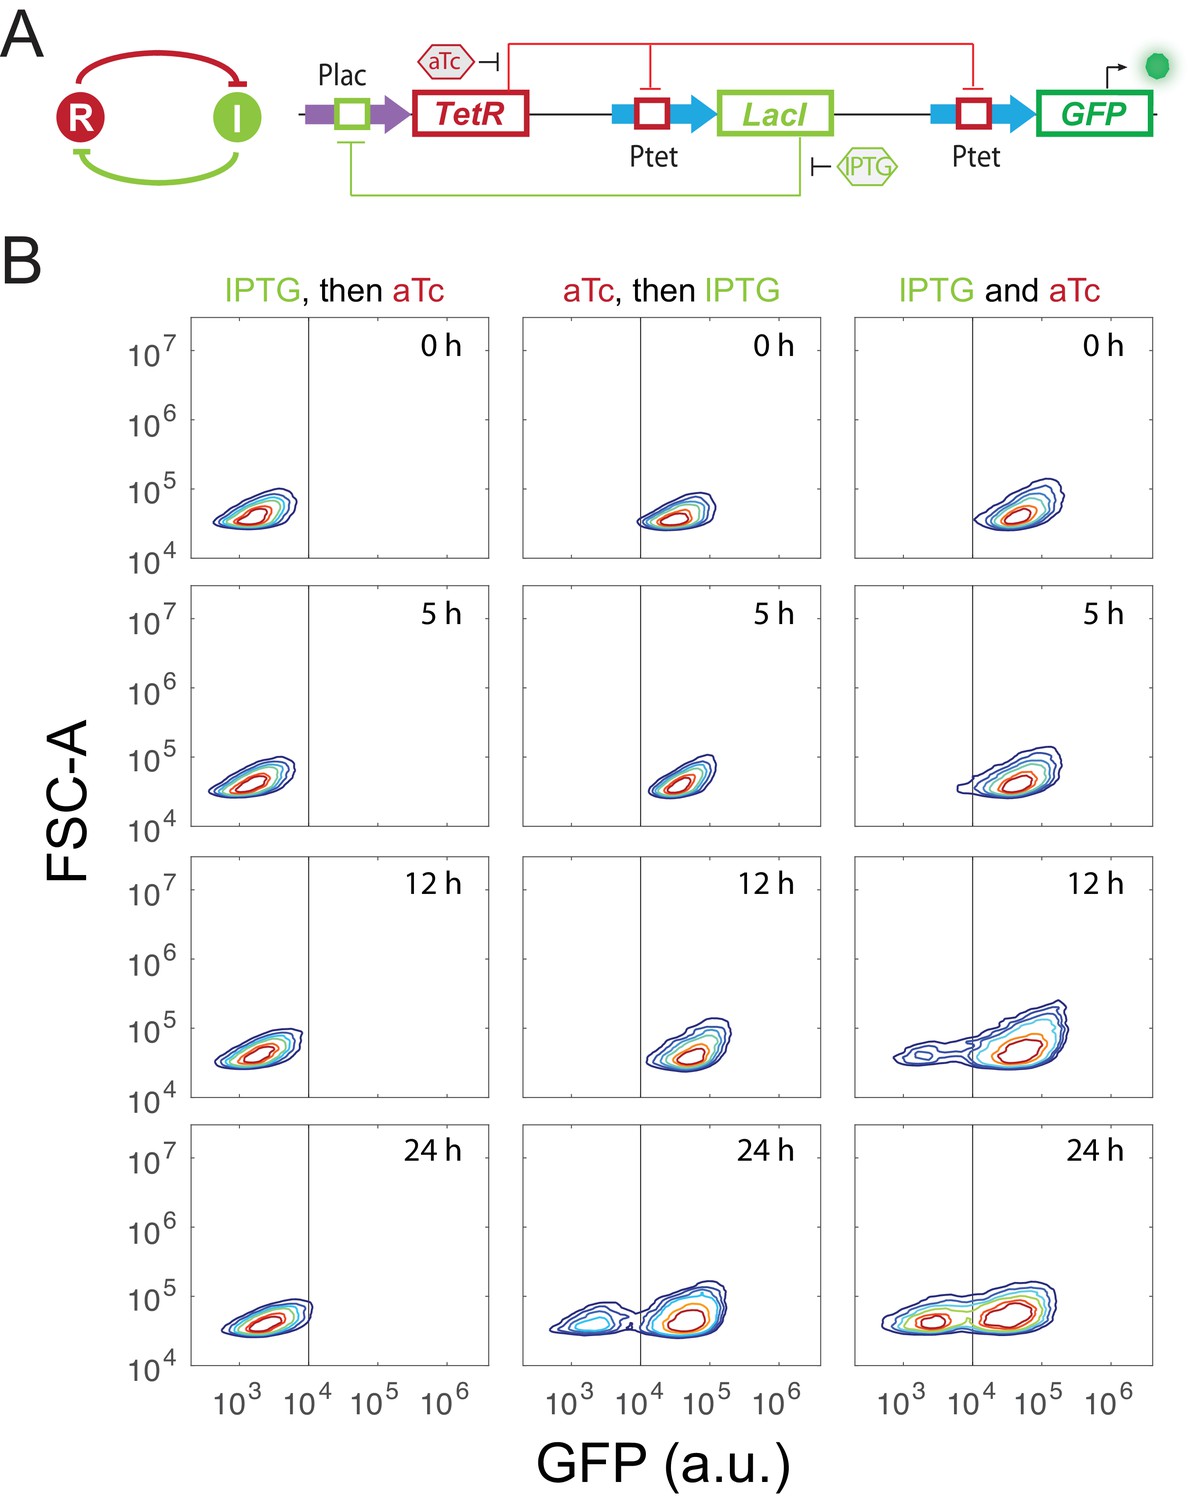
(A) Abstract diagram and molecular implementation of the toggle switch circuit. TetR (R) and LacI (I) mutually inhibit each other through binding to Ptet and Plac promoter, respectively. IPTG and aTc (hexagon) can respectively relieve LacI and TetR inhibition. GFP serves as the readout of Ptet. (B) Time course results of the sequential induction. The y-axis represents forward scatter (FSC-A), and the x-axis indicates GFP fluorescence. IPTG and aTc were sequentially (left and middle columns) or simultaneously (right column) applied to induce the toggle circuit. The first inducer was added to the media for 5 hr, and then the second inducer was added. Fluorescence was measured by flow cytometry at 0 hr, 5 hr, 12 hr, and 24 hr after the second inducer was added into the cultures. The concentration of IPTG and aTc is 8*10−5 M, and 100 ng/ml, respectively. Experiments were repeated for at least three times, and representative results were shown.
Figure 2—figure supplement 2
Time course results of sequential induction for the MINPA (T15) circuit.
(A) Arabinose (Ara) and IPTG were sequentially (left and middle columns) or simultaneously (right column) applied to induce T15. The first inducer was applied for 5 hr, and then the second inducer was added into the culture. Fluorescence was measured by flow cytometry at 0 hr, 12 hr, and 24 hr after the second inducer was added into the culture. The concentration of Ara and IPTG is 2.5*10−5m/v, and 5*10−5 M, respectively. (B) AHL and aTc were sequentially (left and middle) or simultaneously (right) applied to induce T15. The first inducer was applied for 6.5 hr, and then the second inducer was added into the culture. The concentration of AHL and aTc is 1*10−4 M, and 200 ng/ml, respectively. (C) Ara and AHL were sequentially (left and middle) or simultaneously (right) applied to induce T15. The first inducer was applied for 5 hr, and then the second inducer was added into the culture. The concentration of Arabinose and AHL is 2.5*10−5m/v, and 1*10−8 M, respectively. (D) IPTG and aTc were sequentially (left and middle) or simultaneously (right) applied to induce T15. The first inducer was applied for 6.5 hr, and then the second inducer was added into the culture. The concentration of IPTG and aTc is 1*10−4 M, and 200 ng/ml, respectively. Fluorescence was measured by flow cytometry at 0 hr, 12 hr, and 24 hr after the second inducer was added into the culture. The inducers are color-coded as visual assistance to indicate which edge of inset diagram it regulates.
Figure 2—figure supplement 3
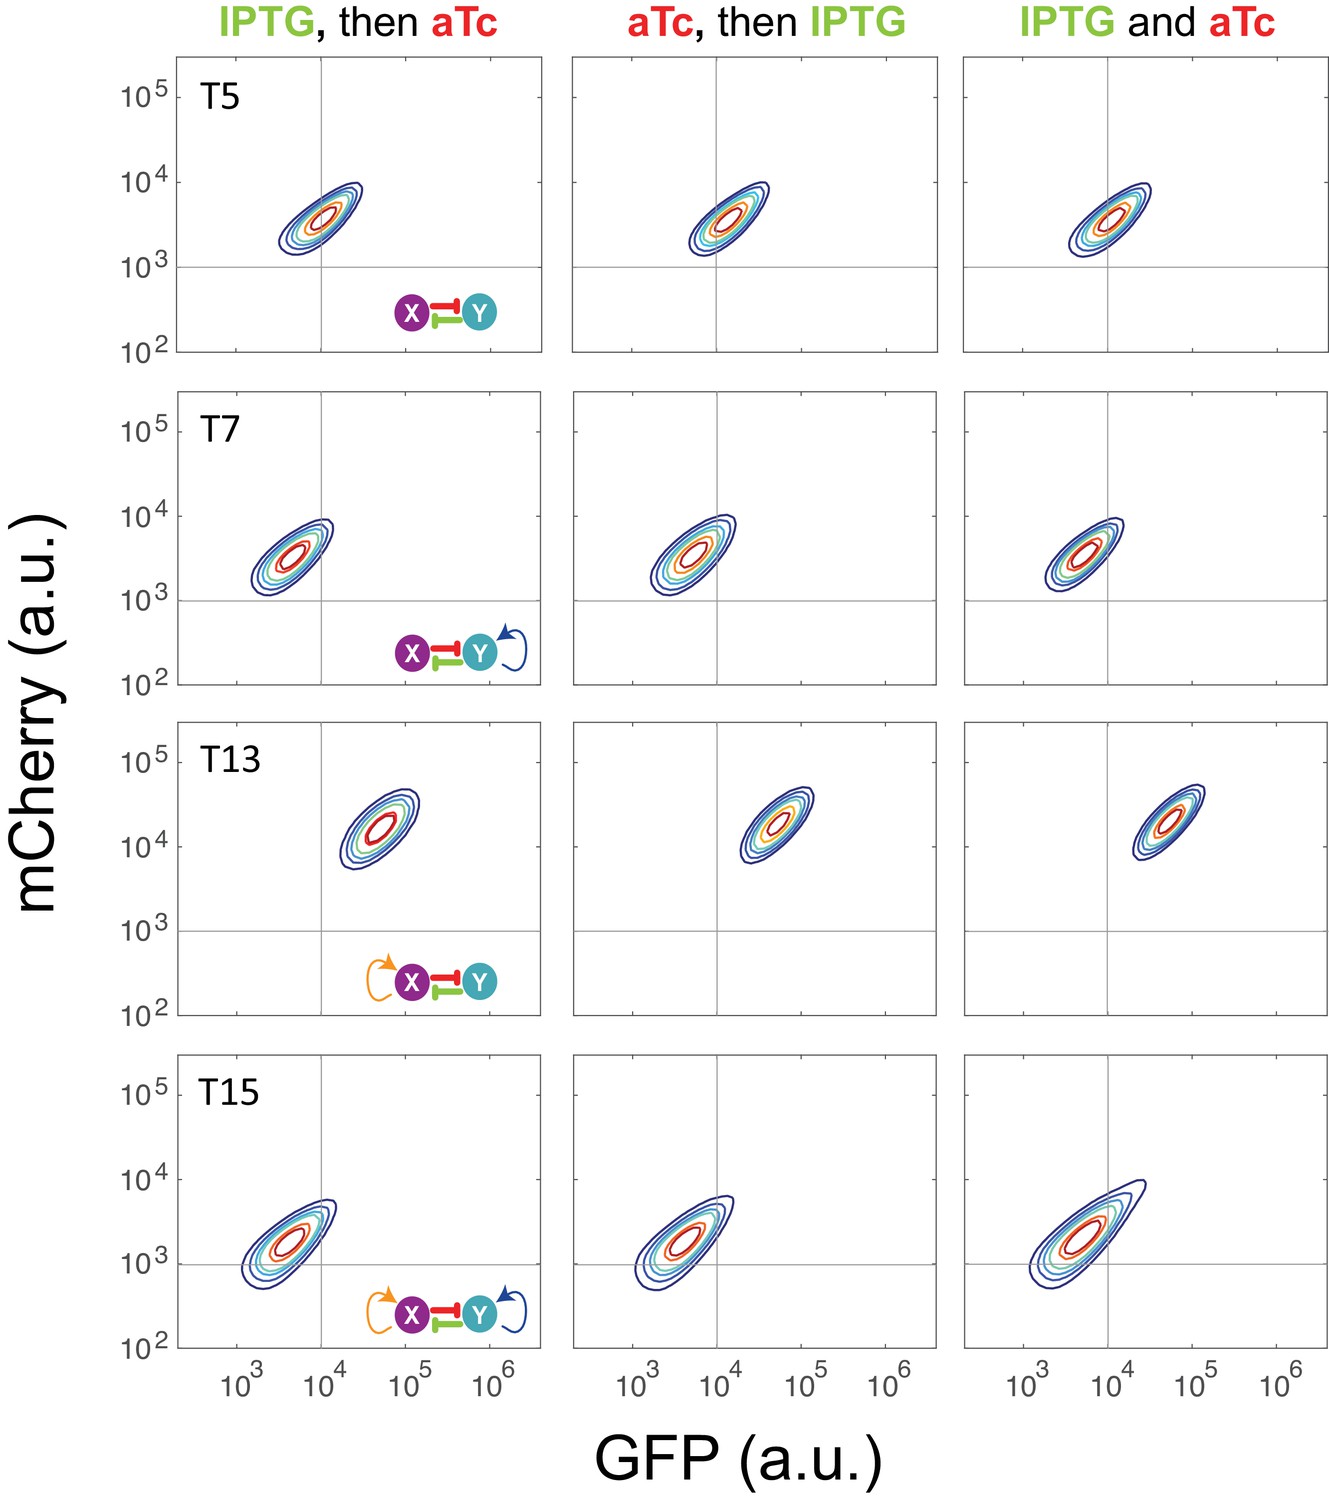
Sequential induction for circuits T5, T7, T13, and T15 with inducers IPTG and aTc.
Left: IPTG was first applied to induce the circuits, and then aTc was added; Middle: aTc was first applied to induce the circuits, and then IPTG was added; Right: IPTG and aTc were added simultaneously into the medium. The concentration of IPTG and aTc is 1*10−4 M and 200 ng/ml, respectively. Samples were treated with the first inducer for 6.5 hr and then the second inducer was added. Fluorescence was measured at 24 hr by flow cytometry.
Figure 3 with 2 supplements
Bifurcation analysis and hysteresis of MINPA.
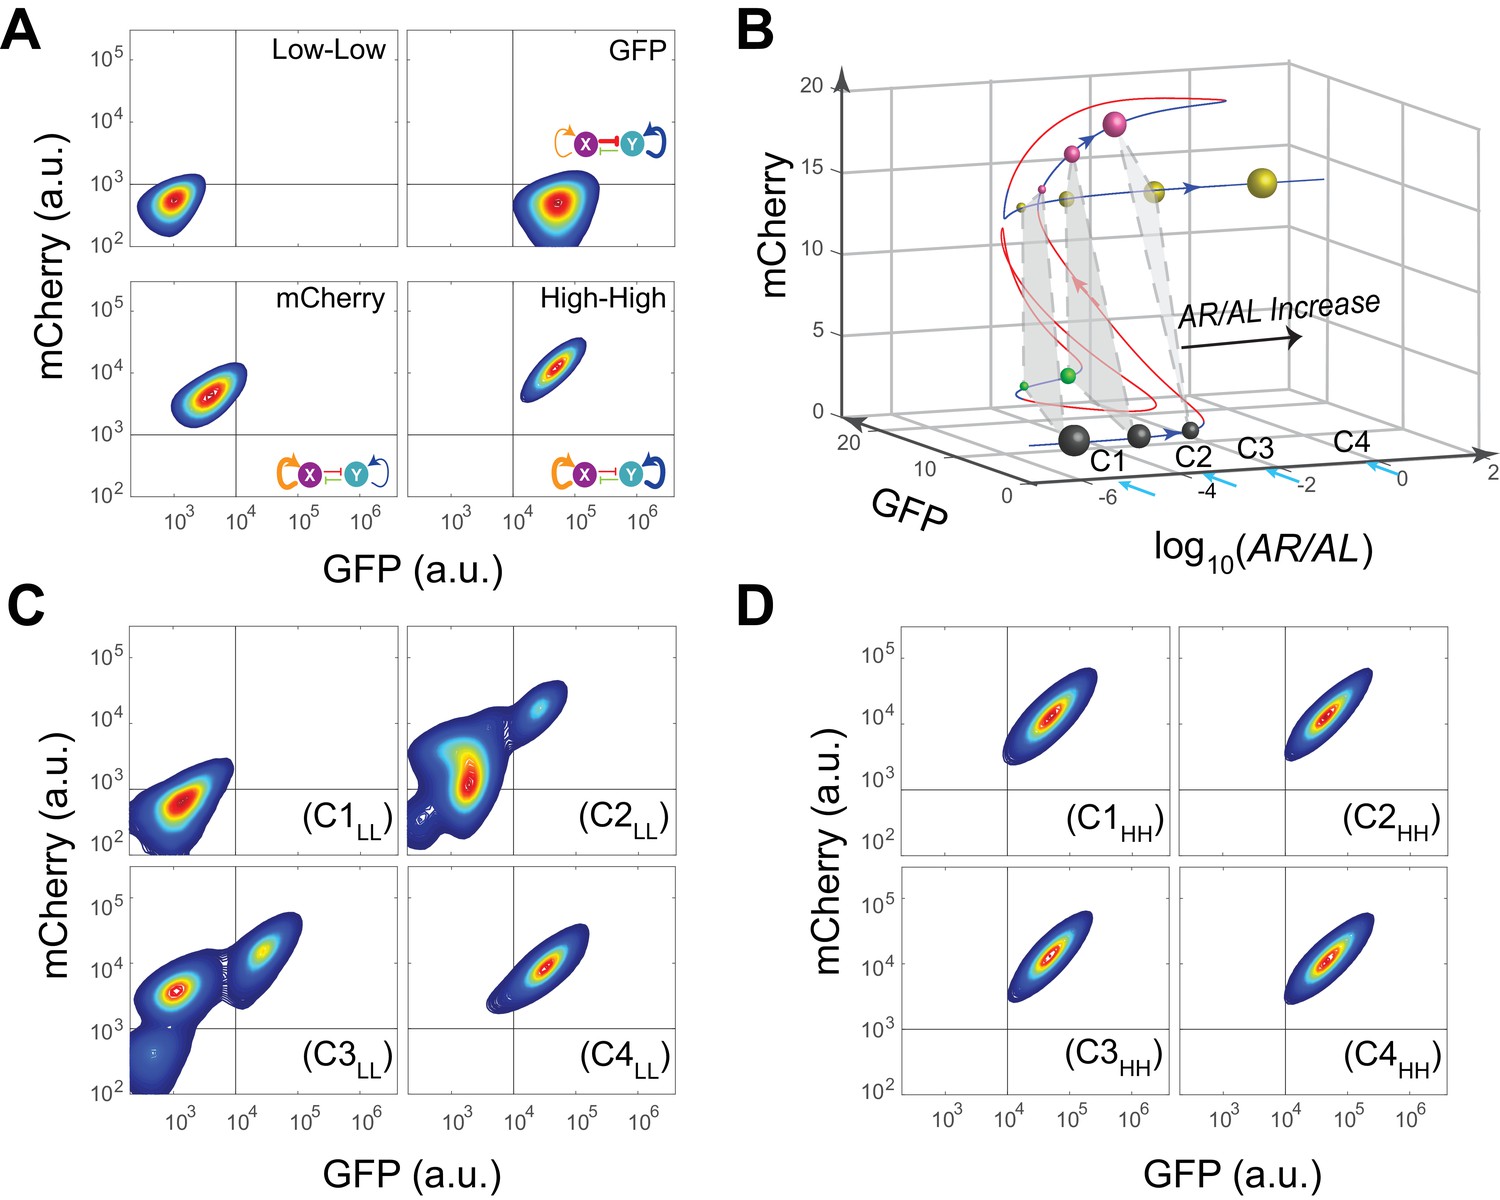
(A) Engineered MINPA is tunable to reach four individual states: low-low, GFP, mCherry, and high-high, under no induction, 1*10−4 M AHL and 100 ng/ml aTc, 2.5*10−5 (m/v) Arabinose, 1*10−4 M AHL and 2.5*10−3 (m/v) Arabinose, and respectively. To indicate the effects of inducers, we used the same color for applied inducer and its regulated connection (bolder lines) in the MINPA topology. The other non-regulated connections are represented by thin lines. (B) 3-D bifurcation diagram of MINPA. AR/AL is a lumped parameter composed of increasing concentrations of Arabinose and AHL, but the ratio of Arabinose and AHL is fixed, i.e., [Arabinose]/[AHL] is a constant. GFP and mCherry represent the states of node X and Y. Blue lines represent stable steady states, while red ones are unstable steady states. Grey, green, rose, and golden spheres represent low-low, GFP, mCherry, and high-high state, respectively. And the size of spheres correlates with the attractiveness of each state. C1, C2, C3, and C4 are four increasing concentrations of Arabinose and AHL used for experimental probing. (C–D) Hysteresis results of MINPA under induction of AR/AL. C1LL-C4LL: cells with low-low initial state (C) are induced with AR/AL at C1 to C4; C1HH-C4HH: cells with high-high initial state (D) are induced with AR/AL for 24 hr at C1 to C4. C1: no inducers; C2: 2.5*10−6m/v Arabinose and 1*10−7 M AHL; C3: 2.5*10−5m/v Arabinose and 1*10−6 M AHL; C4: 2.5*10−3m/v Arabinose and 1*10−4 M AHL. Arabinose and AHL were added at the same time to induce the cells. 100,000 cells were recorded for each sample by flow cytometry.
Figure 3—figure supplement 1
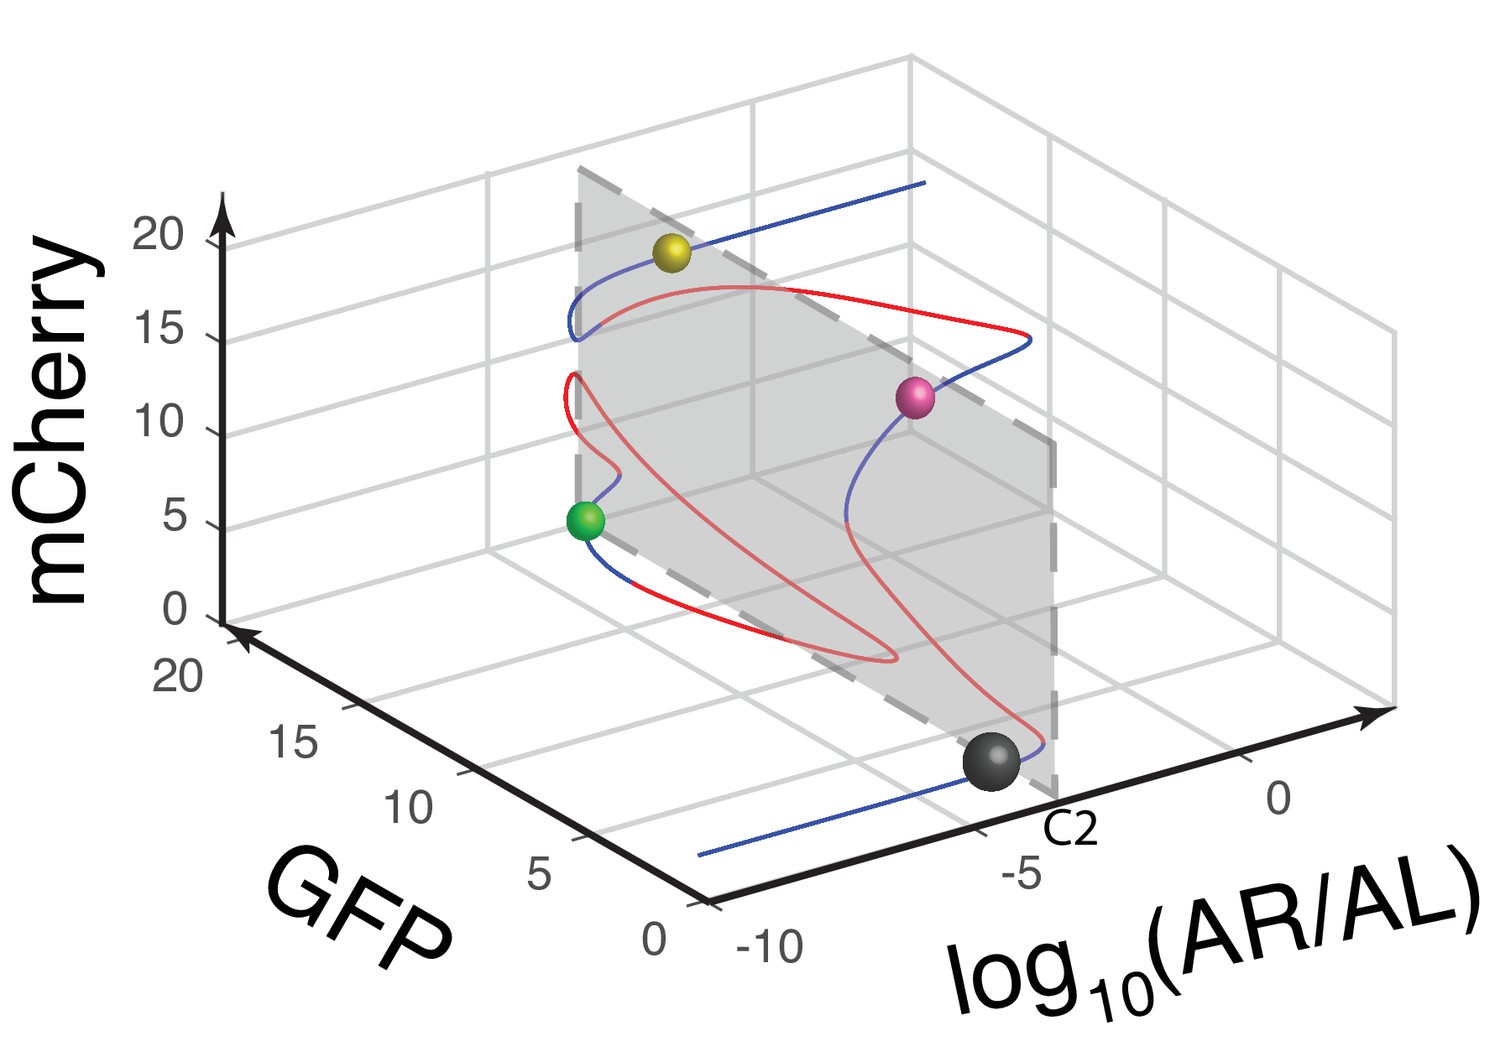
Another view of the 3-D bifurcation diagram of MINPA at C2.
The circuit’s quadrastability is illustrated as four similar-sized colored spheres on the same gray plane, which represents the low-low, GFP, mCherry, and high-high state, respectively. Blue lines represent stable steady states, while red ones are unstable steady states. Grey, green, rose, and golden spheres represent low-low, GFP, mCherry, and high-high state, respectively. And the size of spheres correlates with the attractiveness of each state. C2: 2.5*10−6m/v Arabinose and 1*10−7 M AHL.
Figure 3—figure supplement 2
Bifurcation analysis for and hysteresis of MINPA with induction of Arabinose and AHL.
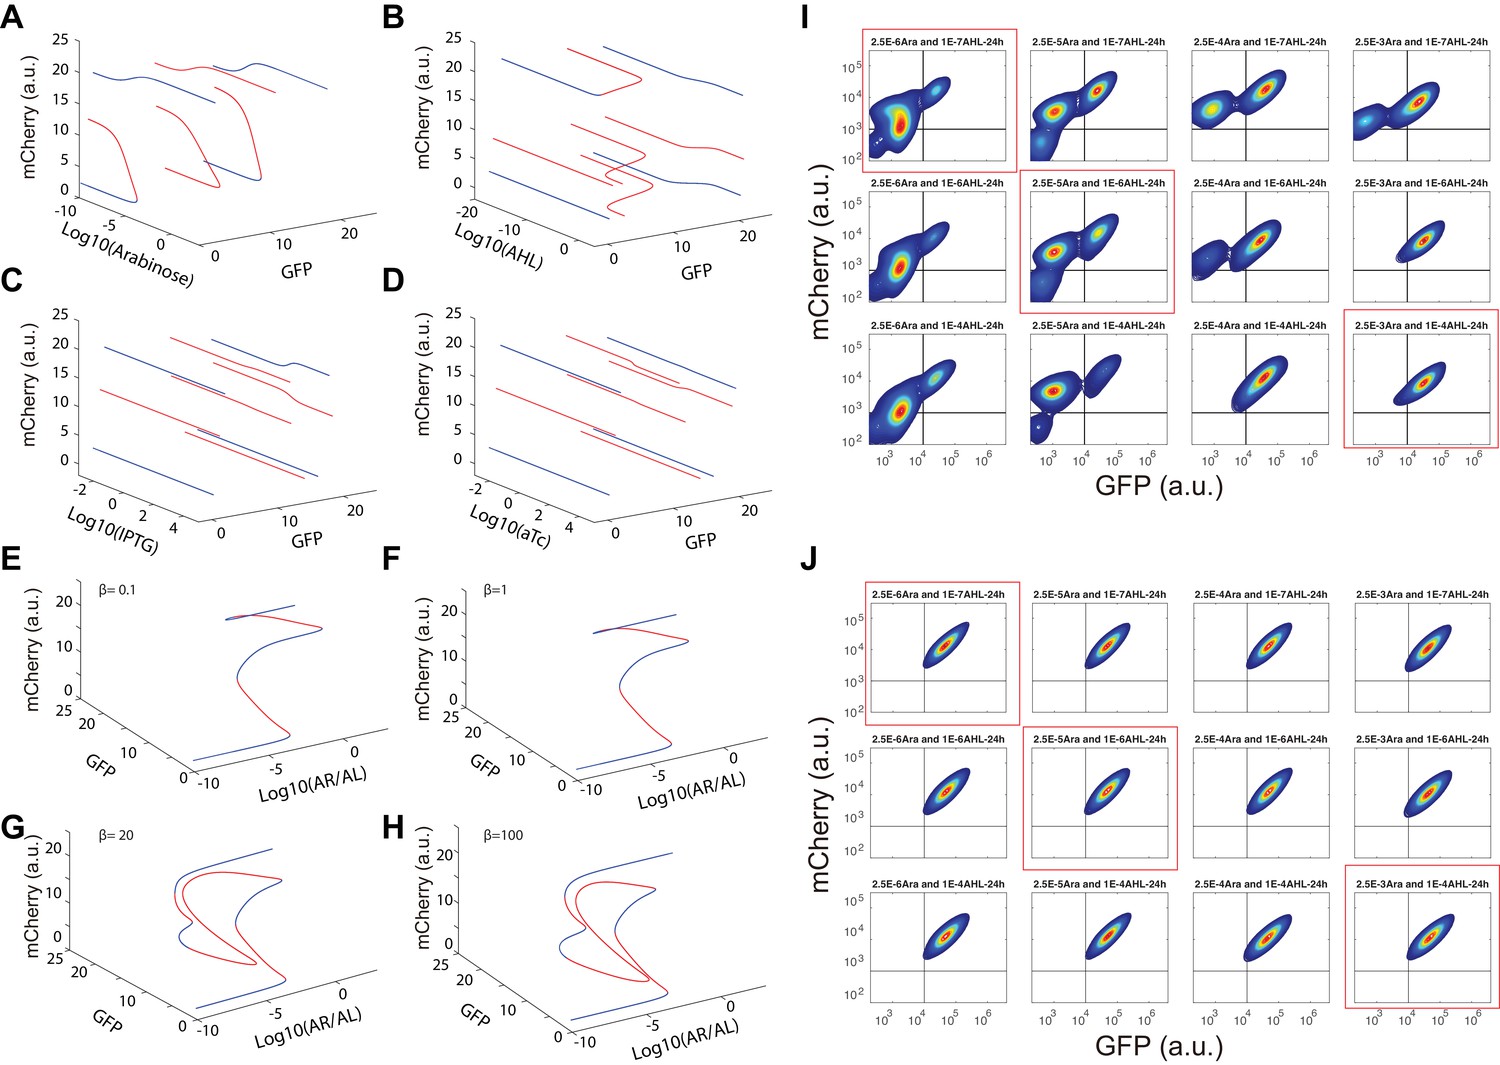
(A–D) One-dimensional bifurcation analysis for all four inducers in MINPA. We perform bifurcation analysis for each inducer while setting the concentration of other inducers to be very small (10−10). The blue curves are branches of stable steady states (SSS), while the red curves are branches of unstable steady states (USS). The bifurcation analyses are performed using Matlab. (E–H) Dual induction bifurcation analysis for Arabinose and AHL in MINPA. We perform bifurcation analysis for dual induction of different β (see Appendix for details). The blue curves are branches of SSS, while the red curves are branches of unstable steady states. (I) Hysteresis of MINPA for initial low-low state cells with induction of Arabinose and AHL. Cells with initial low-low state were induced with a series of concentrations of Arabinose (from 2.5*10−6m/v to 2.5*10−5m/v to 2.5*10−3m/v) and AHL (from 1*10−7 M to 1*10−6 M to 1*10−4 M). Data circled by red rectangles are shown in Figure 3C. Cells were grown for 24 hr before measured by flow cytometry. 10,000 events were recorded. (J) Hysteresis of MINPA for initial high-high state cells with induction of Arabinose and AHL. Initial high-high state cells were collected from the initial low-low state cells induced with 2.5*10−3m/v Arabinose and 1*10−4 M AHL for 12 hr. Cellular states were then monitored by flow cytometry to ensure its high-high state profile. The high-high state cells were washed and then inoculated into fresh medium with the same concentrations of Arabinose and AHL (from 2.5*10−6m/v to 2.5*10−5m/v to 2.5*10−3m/v) and AHL (from 1*10−7 M to 1*10−6 M to 1*10−4 M). Data circled by red rectangles are shown in Figure 3D. Cells were grown for 24 hr before measured by flow cytometry. 10,000 events were recorded.
Figure 4 with 1 supplement
Model-guided quadrastability of MINPA through triple induction.
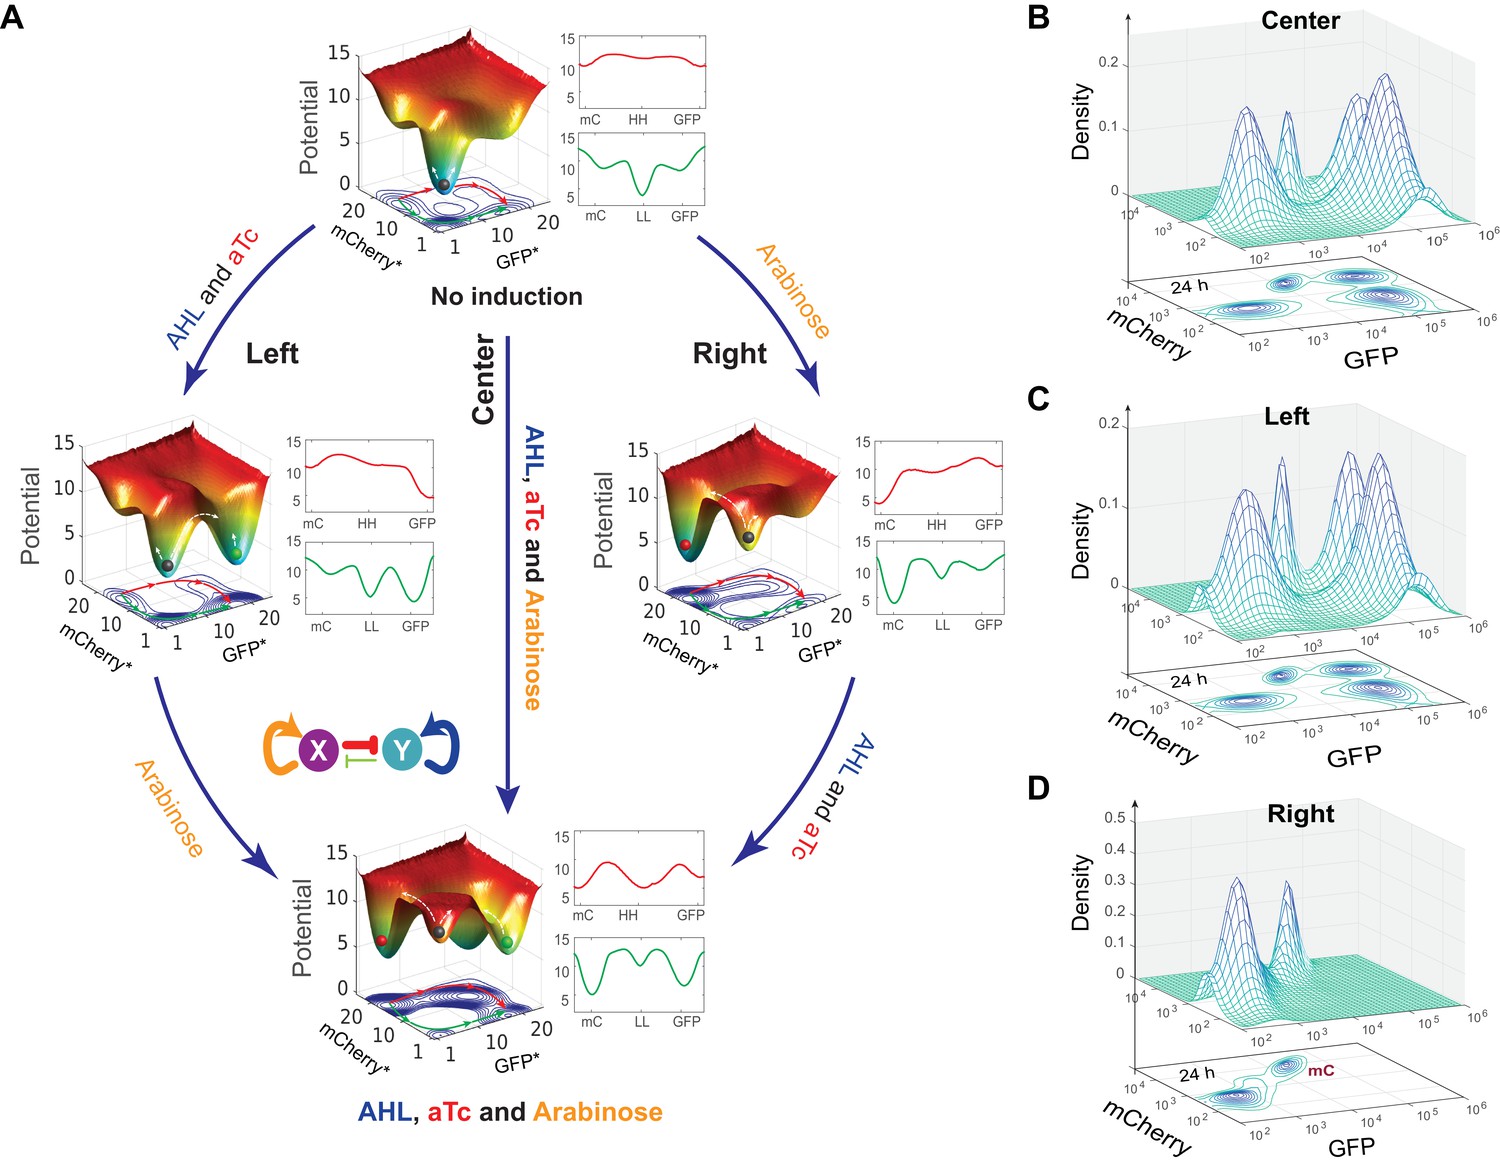
(A) Dynamic evolution of computed energy landscapes of MINPA under sequential/simultaneous inductions of Arabinose, and/or AHL and aTc. Center route: simultaneous induction with three inducers; Left route: sequential induction with AHL and aTc first, and then Arabinose. Right route: sequential induction with Arabinose, and then AHL and aTc. Deeper wells represent the higher stability of corresponding states. For each three-dimensional landscape, corresponding two-dimensional state-potential plots were also shown. Red line sketches the potentials from mCherry state to high-high to GFP state while green one represents the potentials from mCherry state to low-low to GFP states. mC: mCherry; HH: high-high; LL: low-low. GFP* and mCherry* is the computed GFP and mCherry abundance from the model. To indicate the effects of inducers, we used the same color for applied inducers and its regulated connections, which were also shown in bolder lines. (B–D) Experimental validations of model-predicted quadrastability using flow cytometry. Quadrastable steady states were observed when Arabinose, AHL, and aTc were simultaneously added into the media (B), corresponding to the Center route in A). Four populations were also observed when AHL and aTc were first added to growth media for 6.5 hr and then Arabinose was added, and cells were grown for another 24 hr before measurement (C), corresponding to the Left route in A). Bimodality (low-low and mCherry states) was generated when Arabinose was first applied and then AHL and aTc were added (D), corresponding to the Right route in A). Concentrations for Arabinose, AHL and aTc are 2.5*10−5m/v, 1*10−4 M, and 400 ng/ml, respectively. Representative results from three replicates are showed and 100,000 cells were recorded for each sample by flow cytometry.
Figure 4—figure supplement 1
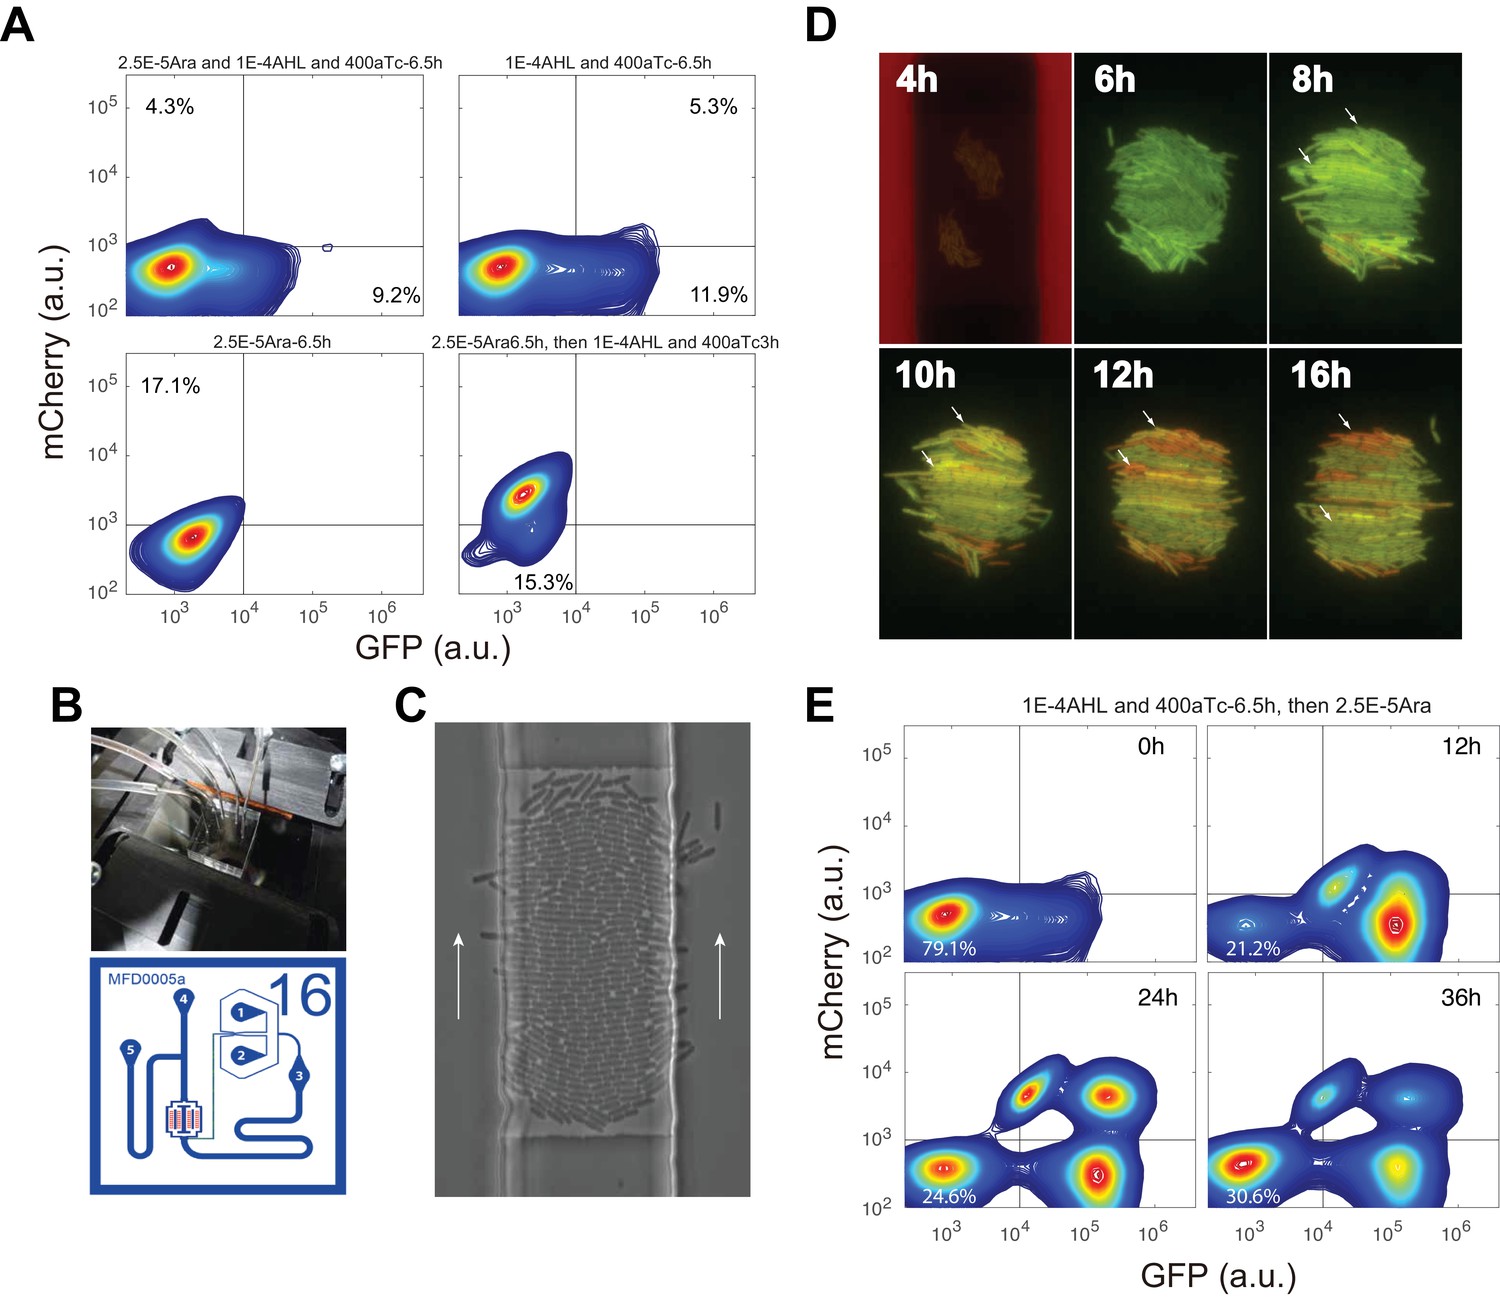
Cells’ states under induction with the first inducer, microfludic results to demonstrate quadrastability with IPTG and aTc induction, and time course of sequential induction of AHL, aTc and Ara.
(A) Up left: Flow cytometry result for cells simultaneously induced with 2.5*10−5m/v Arabinose, 1*10−4 M AHL and 200 ng/ml aTc for 6.5 hr. Up right: Cells were first induced with 1*10−4 M and 400 ng/ml aTc for 6.5 hr, and then measured by flow cytometry. About 12% cells were moving from low-low state to GFP state at 6.5 hr. Bottom left: Cells were first induced with 2.5*10−5m/v Arabinose and no obvious state transition was observed at 6.5 hr. However, at 9.5 hr, most cells (84.6%) were transitioned to mCherry state (Bottom right). (B) Microfluidic setup and device design (adopted from Dr. Hasty lab (Ferry et al., 2011). (C) Images showing E.coli growing in the device. White arrows indicate the flow direction. (D) Time course of the cells growing and fluorescence state change with 2*10−4 M IPTG and 200 ng/ml aTc induction in the trap. The red flow is medium without inducer for 6 hr, and then cells switch to medium with inducers for 18 hr. Small white arrows show single cells with state change from GFP to mCherry. Magnification: 40x. (E) Time-course sequential induction with AHL, aTc first and then Arabinose (corresponding to the Left route in Figure 4A). The indicated time point is the time after Arabinose added into the culture. 10,000 events were recorded. The low-low state cells changed from 21.2% (12 h) to 24.6% (24 h) to 30.6% (36 h).
Appendix 1—figure 1

Cell growth rates under each inducer and inducer combinations.
Growth curves for the cells under the four individual inducers: Ara; AHL; aTc; IPTG, and inducer combinations: AHL and aTc; AHL, aTc, and Ara. Ara: 2.5*10−5m/v; AHL: 1*10−5 M, aTc: 200 ng/ml, IPTG: 1*10−4 M. Cells under induction with aTc has a longer lag phase (~2.5 hr), and all the samples reached stationary phase after ~13 hr. Data indicate mean±SD of three independent replicates.
Videos
Appendix 1—Video 1
A time-lapse movie growing in the microfluidic chip for 24 hr.
Time course of the cells growing and fluorescence state change with 2*10−4 M IPTG and 200 ng/ml aTc induction in the trap. The red flow is medium without inducer for 6 hr, and then cells switch to medium with inducers for 18 hr. Magnification: 40x.
Tables
Table 1
Components from the Registry of standard biological parts
| Biobrick number | Abbreviation in the paper | Description |
|---|---|---|
| BBa_C0080 | AraC | AraC arabinose operon regulatory protein from E. coli |
| BBa_C0040 | TetR | Tetracycline repressor from transposon Tn10 |
| BBa_C0062 | LuxR | LuxR activator from Aliivibrio fischeri |
| BBa_C0012 | LacI | LacI repressor from E. coli |
| BBa_E0240 | GFP | GFP generator |
| BBa_J06702 | mCherry | RFP generator |
| BBa_K176002 | Plux/tet | Hybrid promoter with LuxR/HSL- and TetR-binding sites |
| BBa_B0034 | RBS | Ribosome binding site |
| BBa_B0015 | Terminator | Transcriptional terminator (double) |
| BBa_K176009 | CP | Constitutive promoter |
| pSB1K3 | pSB1K3 | High copy BioBrick assembly plasmid with kanamycin resistance |
| pSB1A3 | pSB1A3 | High copy BioBrick assembly plasmid with ampicillin resistance |
Additional files
-
Source code file 1
Flow cytometry data analysis file.
- https://doi.org/10.7554/eLife.23702.015
-
Source code file 2
Bifurcation analysis in Figure 3.
- https://doi.org/10.7554/eLife.23702.016
-
Source code file 3
Potential landscape calculation file.
- https://doi.org/10.7554/eLife.23702.017
Download links
A two-part list of links to download the article, or parts of the article, in various formats.
Downloads (link to download the article as PDF)
Open citations (links to open the citations from this article in various online reference manager services)
Cite this article (links to download the citations from this article in formats compatible with various reference manager tools)
Engineering of a synthetic quadrastable gene network to approach Waddington landscape and cell fate determination
eLife 6:e23702.
https://doi.org/10.7554/eLife.23702


