Chimeric origins of ochrophytes and haptophytes revealed through an ancient plastid proteome
- École Normale Supérieure, CNRS, Inserm, PSL Research University, France
- Arizona State University, United States
- Université Pierre et Marie Curie, France
- University of Alberta, Canada
- CNRS, UPMC, FR2424, ABiMS, Station Biologique, France
- Sorbonne Universités, Université Pierre et Marie Curie
- Station Biologique de Roscoff, France
Figures
Figure 1 with 1 supplement
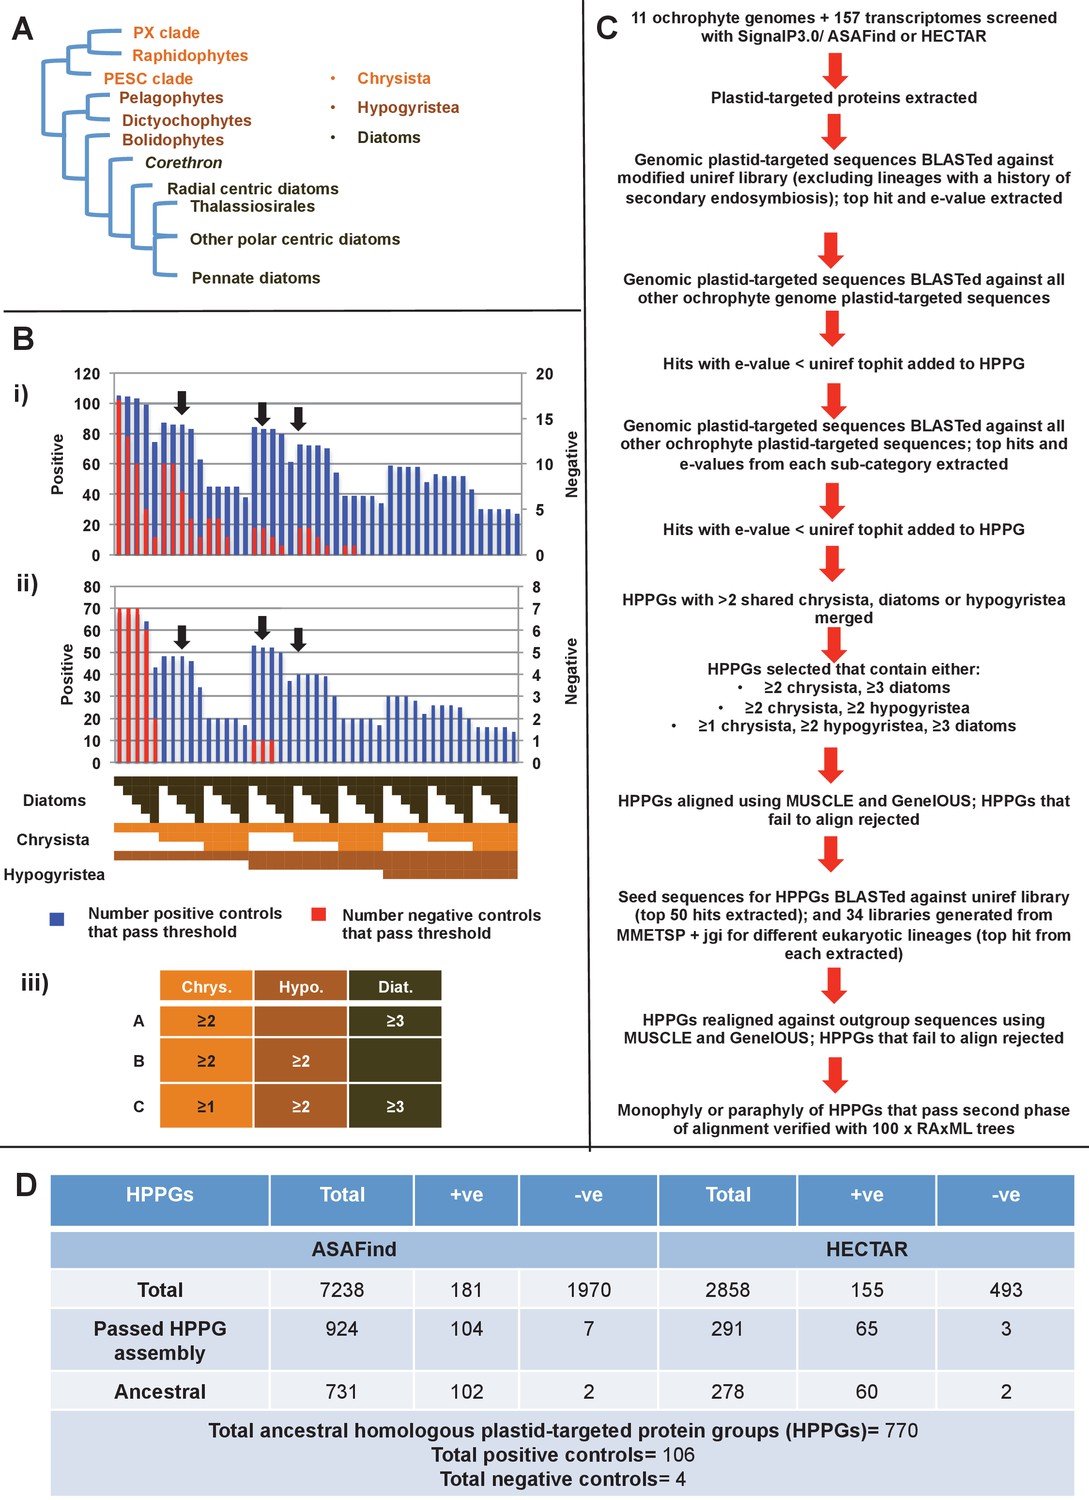
Procedure for identification of conserved plastid-targeted proteins in ochrophytes.
(Panel A) shows a schematic unrooted ochrophyte tree, with the three major ochrophyte lineages (chrysista, hypogyristea, and diatoms) denoted by different coloured labels. ‘PX’ refers to the combined clade of phaeophytes, xanthophytes and related taxa, and ‘PESC’ to pinguiophytes, eustigmatophytes, synchromophytes, chrysophytes and relatives. A global overview of the eukaryotic tree of life, including the position of ochrophytes relative to other lineages is shown in Figure 1—figure supplement 1. (Panel B) shows the number of inferred positive control HPPGs (i.e., HPPGs encoding proteins with experimentally confirmed plastid localisation, or unambiguously plastid function) and negative control HPPGs (i.e., HPPGs encoding proteins with no obvious plastid-targeted orthologues encoded in ochrophyte genomes, but found in haptophyte and cryptomonad genomes) detected as plastid-targeted in different numbers of ochrophyte lineages using ASAFind (i) and HECTAR (ii). The blue bars show the number of positive controls identified to pass a specific conservation threshold, plotted against the left hand vertical axis of the graph, while the red bars show the number of negative controls that pass the same conservation threshold, plotted against the right hand vertical axis of the graph. The number of different sub-categories included in each conservation threshold is shown in a heatmap below the two graphs, with the specific distribution for each bar in the graph shown in the aligned cells directly beneath it. Each shaded cell corresponds to an identified orthologue in one sub-category of a particular ochrophyte lineage: orange cells indicate presence of chrysistan sub-categories; light brown cells the presence of hypogyristean sub-categories; and dark brown cells the presence of diatom sub-categories. In each graph, black arrows label the conservation thresholds inferred to give the strongest separation (as inferred by chi-squared P-value) between positive and negative control sequences. The table (iii) tabulates the three conservation patterns identified as appropriate for distinguishing probable ancestral HPPGs from false positives. (Panel C) shows the complete HPPG assembly, alignment and phylogenetic pathway used to identify conserved plastid-targeted proteins. (Panel D) tabulates the number of HPPGs built using ASAFind and HECTAR predictions, and the number of non-redundant HPPGs identified in the final dataset. The final total represents the pooled total of non-redundant HPPGs identified with both ASAFind and HECTAR.
Figure 1—figure supplement 1
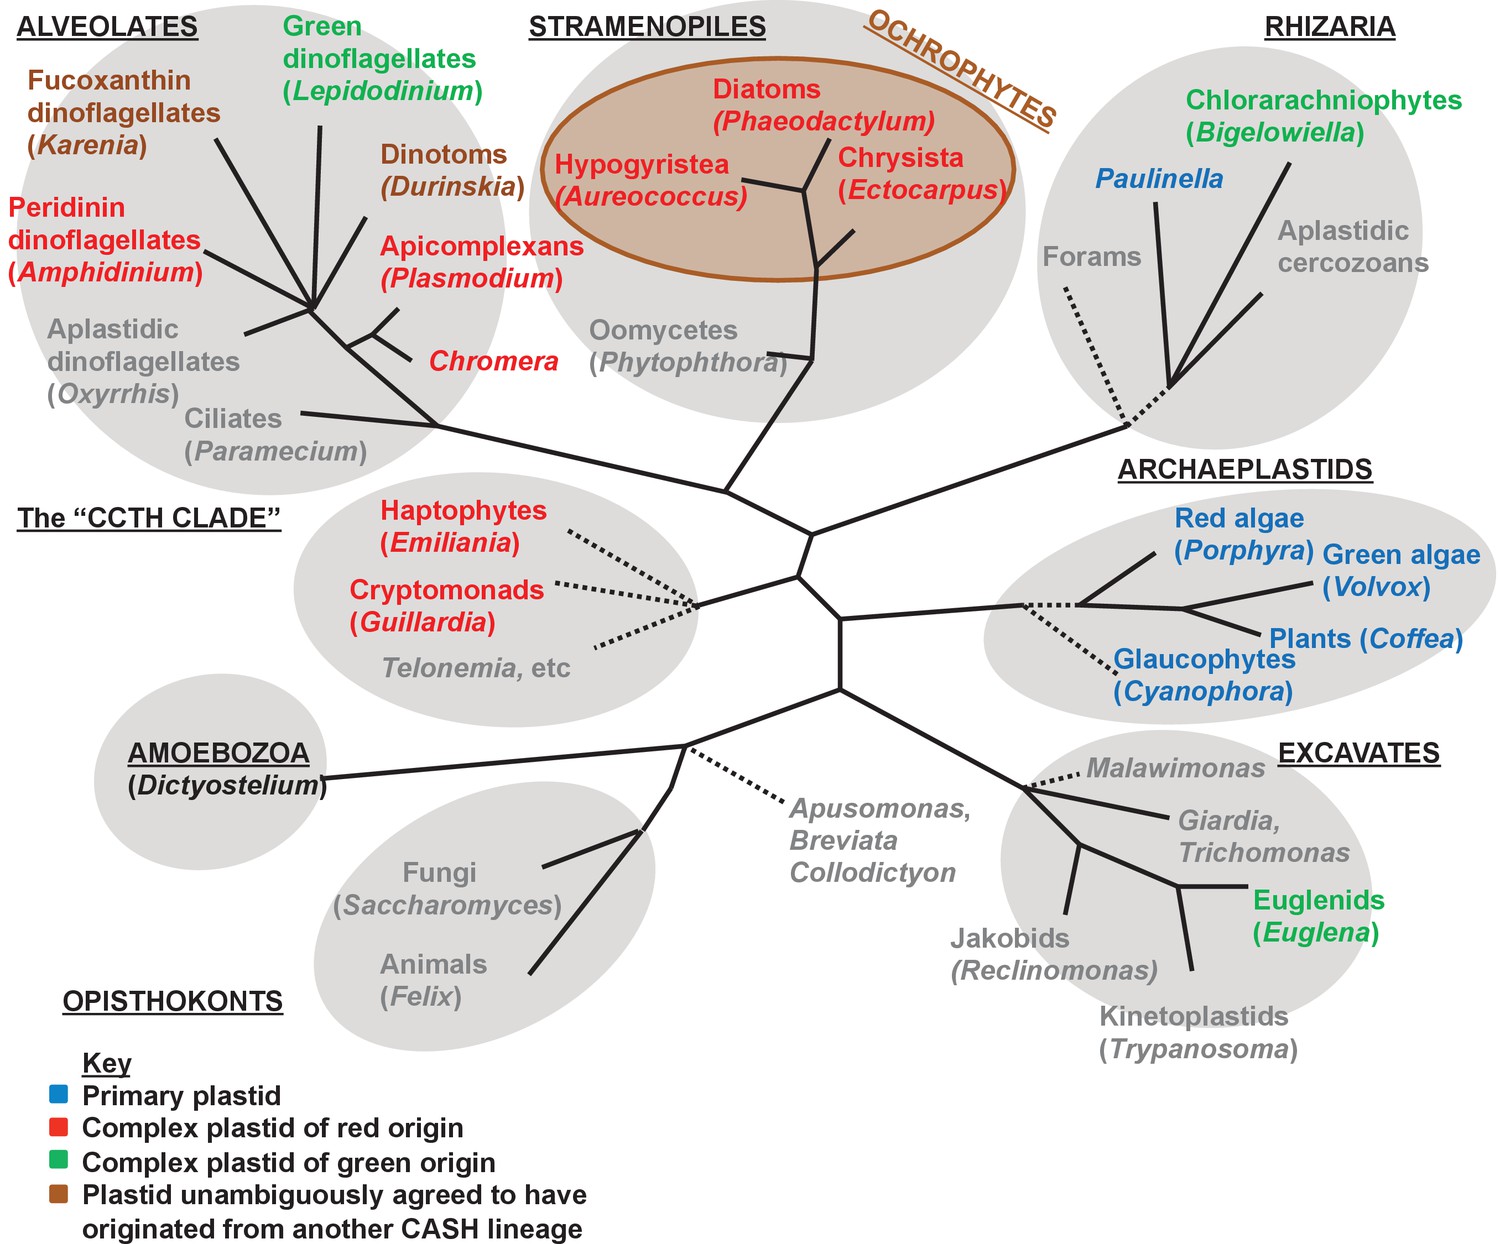
Overview of eukaryotic diversity.
This figure, adapted from a previous review (Dorrell and Howe, 2012a), profiles the diversity of different eukaryotic nuclear lineages. Each grey ellipse corresponds to one major clade, or ‘supergroup’ of eukaryotes. A brown ellipse within the stramenopile clade delineates the ochrophyte lineages. Dashed lines denote uncertain taxonomic relationships. For each taxon, a type species (defined either by the presence of a complete genome, extensive transcriptome library, or of particular anthropic significance) is given in brackets. Taxa that lack plastids are labelled in grey, and taxa with plastids are shaded according to the evolutionary origin of that plastid lineage.
Figure 2 with 7 supplements
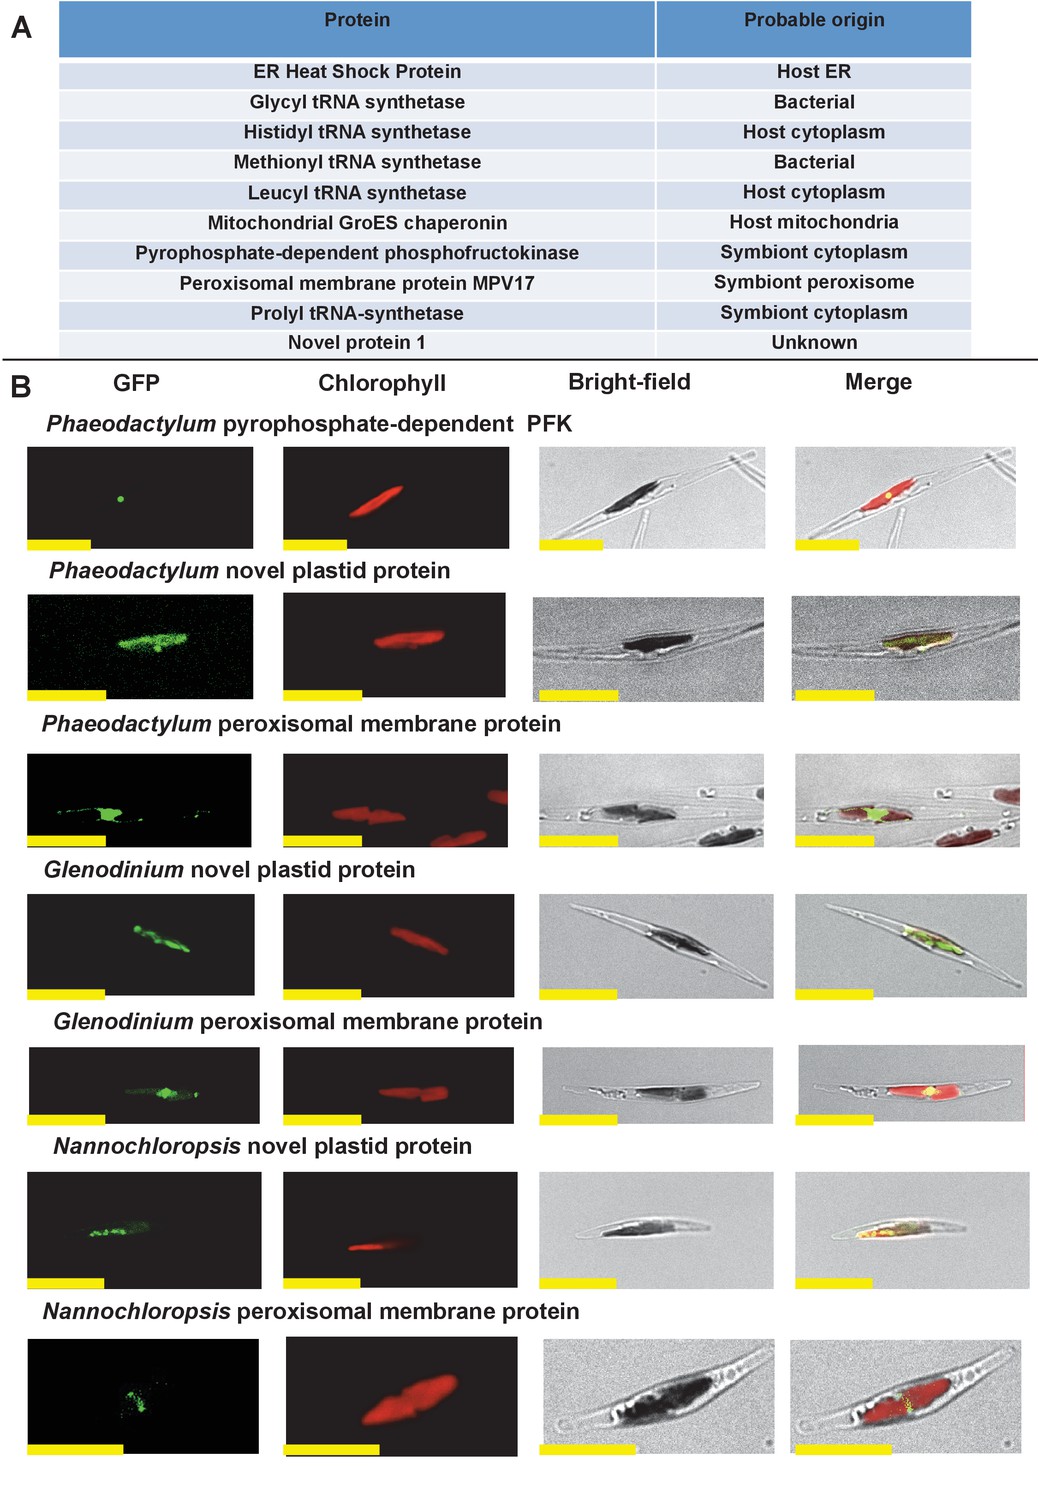
Verification of unusual ancestral plastid-targeted proteins.
(Panel A) lists the ten proteins selected for experimental characterisation and their most probable previous localisation prior to their establishment in the ochrophyte plastid, based on the first 50 nr BLAST hits. Exemplar alignments and single-gene tree topologies for some of these proteins are shown in Figure 2—figure supplements 1–4. (Panel B) shows the localisation of GFP constructs for copies of two proteins with an unambiguous plastid localisation (a pyrophosphate-dependent PFK, which localises to the pyrenoid, and a novel plastid protein, with cosmopolitan distribution across the plastid) and one protein with a periplastid localisation (a predicted peroxisomal membrane protein) from the diatom Phaeodactylum tricornutum, the diatom endosymbiont of the dinoflagellate Glenodinium foliaceum and the eustigmatophyte Nannochloropsis gaditana, expressed in P. tricornutum. All scale bars = 10 μm. Expression constructs for seven additional P. tricornutum proteins and three additional N. gaditana proteins with multipartite plastid localisations are shown in Figure 2—figure supplements 5 and 6, and control images (wild-type cells, and cells expressing untargeted eGFP) are shown in Figure 2—figure supplement 7.
Figure 2—figure supplement 1
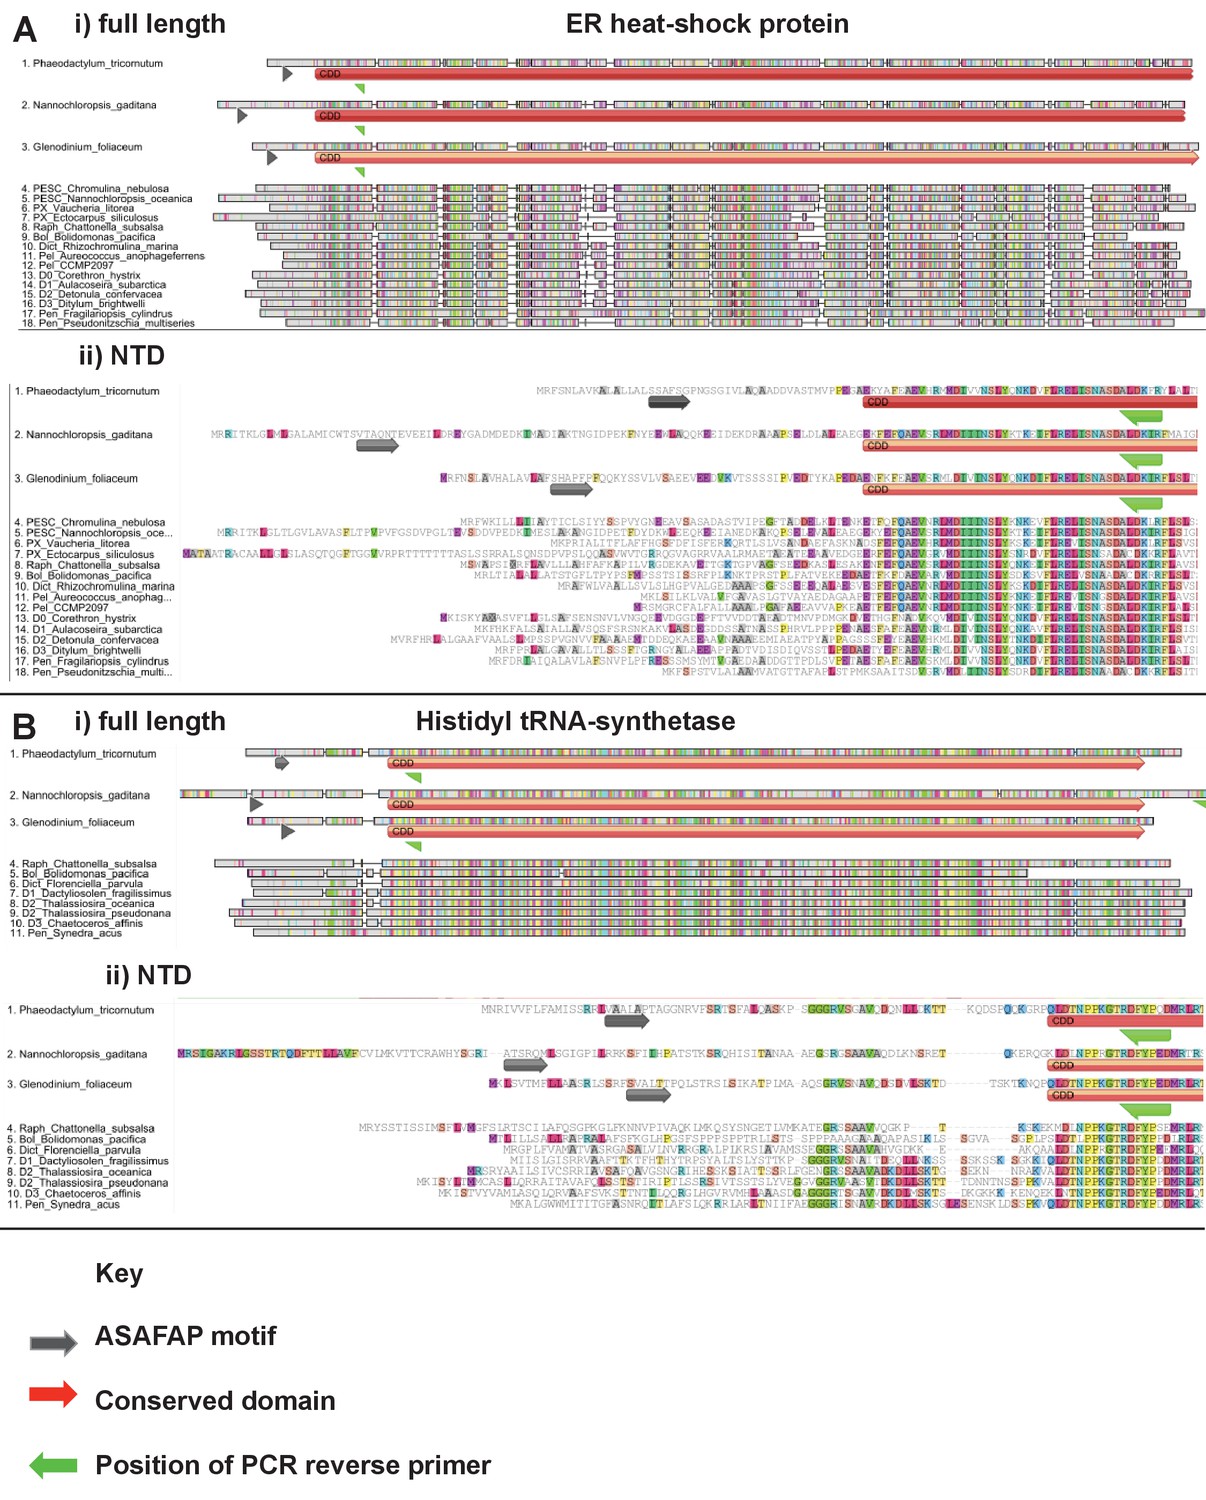
Exemplar ochrophyte plastid protein alignments.
This figure shows untrimmed GeneIOUS alignments for two ancestral HPPGs of unusual provenance. In each case the full length of the protein (labelled i) and N-terminal region only (ii) are shown, demonstrating the broad conservation of the N-terminus position. Sequences for which exemplar targeting constructs (Phaeodactylum tricornutum, Nannochloropsis gaditana, Glenodinium foliaceum) were generated are shown at the top of each alignment.
Figure 2—figure supplement 2
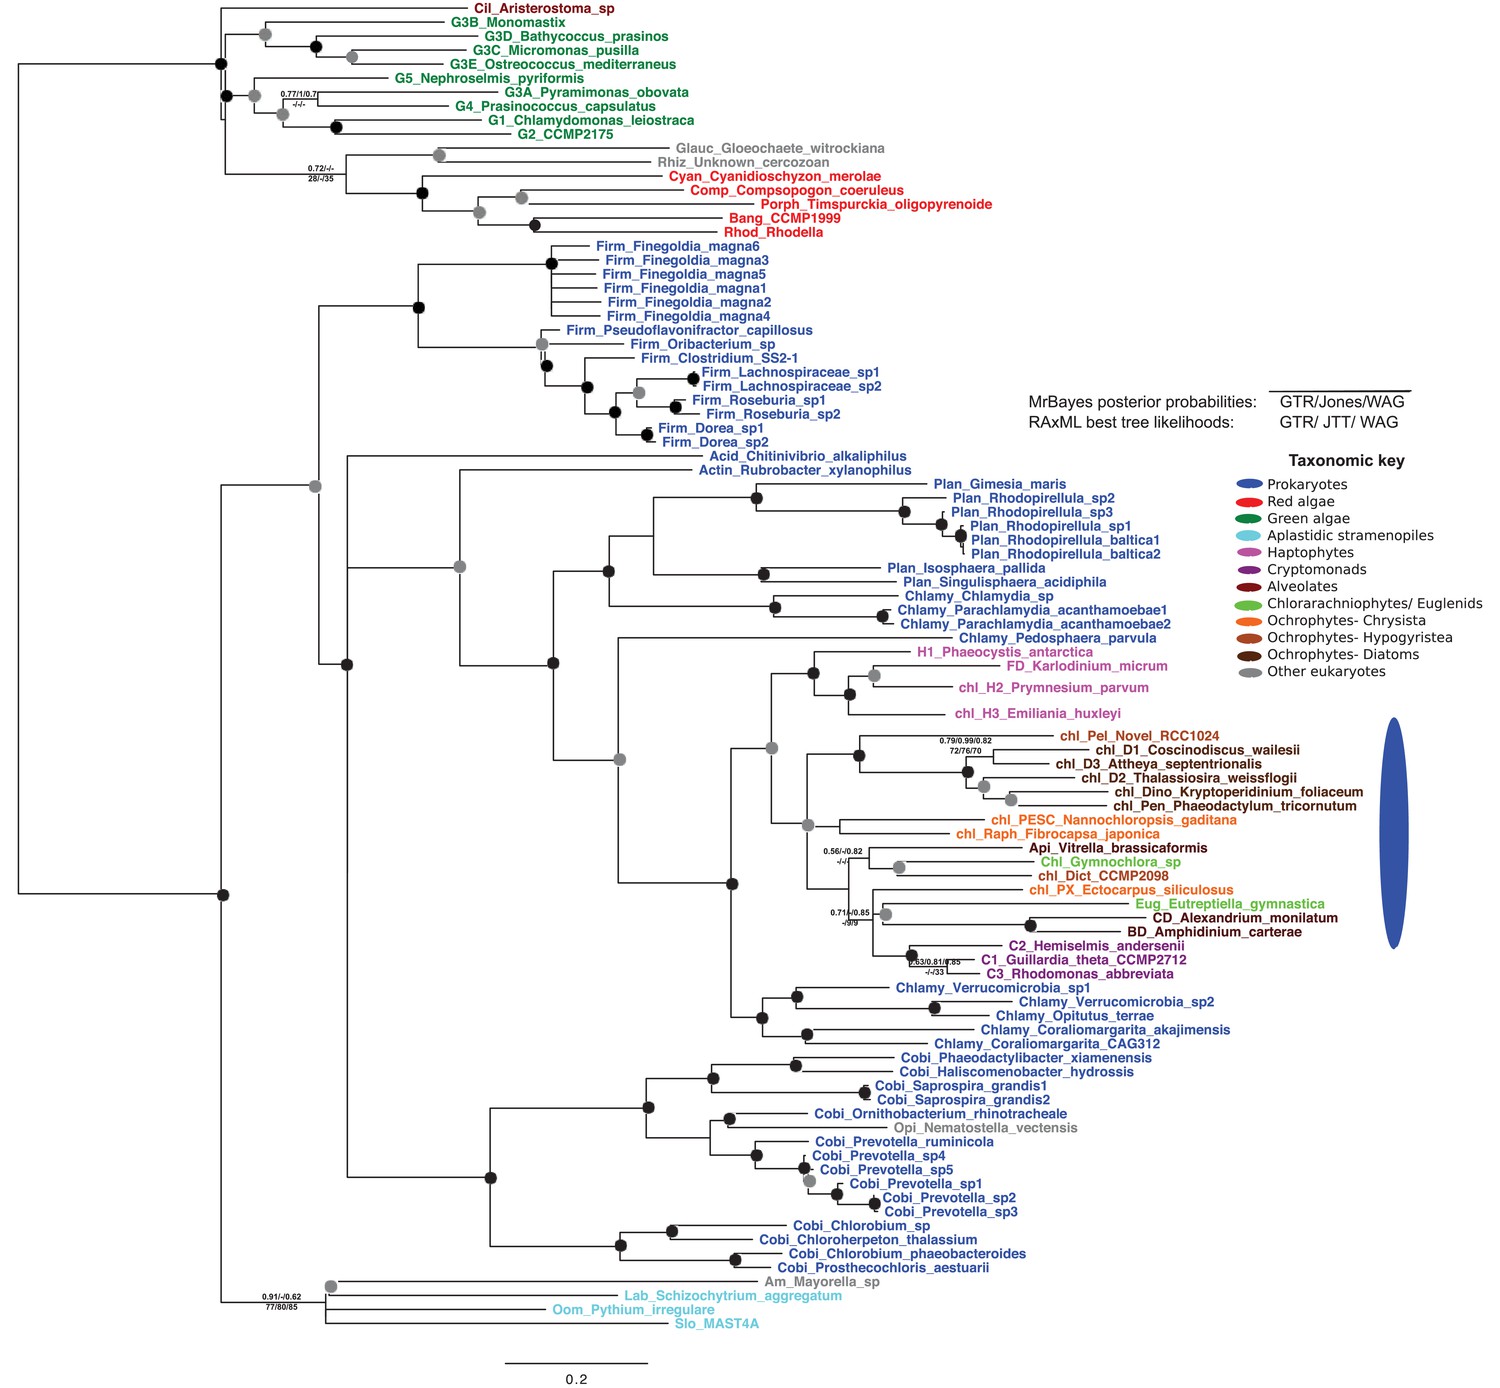
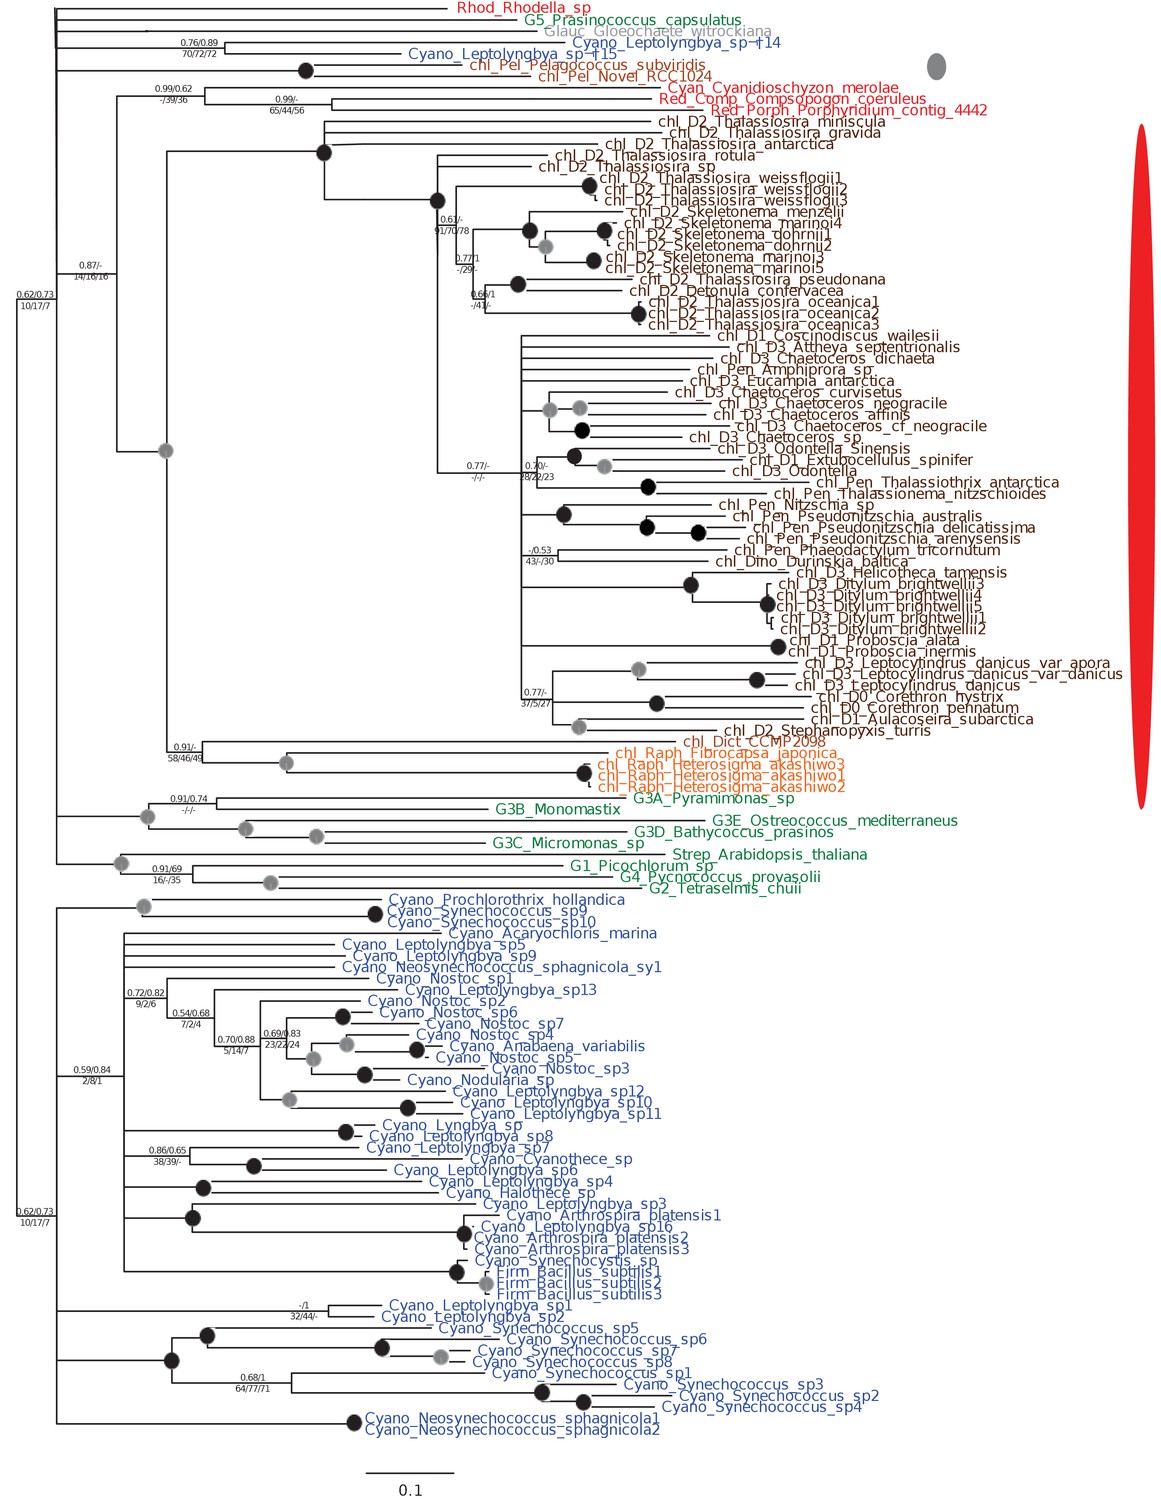
Tree of ochrophyte glycyl-tRNA synthetase sequences.
This tree shows the consensus unrooted Bayesian topology for a 95 taxa x 487 aa alignment of glycyl tRNA synthetase sequences. The font colour of each sequence corresponds to the taxonomic origin (see legend below for details) and are labelled with the taxonomic identifiers previously defined in Table S1. Sequences labelled with chl_ possess apparent plastid targeting sequences recognisable by CASH lineage plastids. The ancestral ochrophyte plastidic isoform, of apparent chlamydiobacterial origin, is labelled with a blue ellipse. Black circles at each node denote posterior probabilities of 1.0 in Bayesian inferences with three different substitution matrices (GTR, Jones, and WAG), and grey circles indicate posterior probabilities of 0.8 with at least two of these matrices. Support values for all remaining nodes, is provided using both Bayesian analysis (above line) and RAxML tree (below line), using three substitution matrices, as defined in the figure legend.
Figure 2—figure supplement 3
Tree of ochrophyte pyrophosphate dependent phosphofructo-1- kinase sequences.
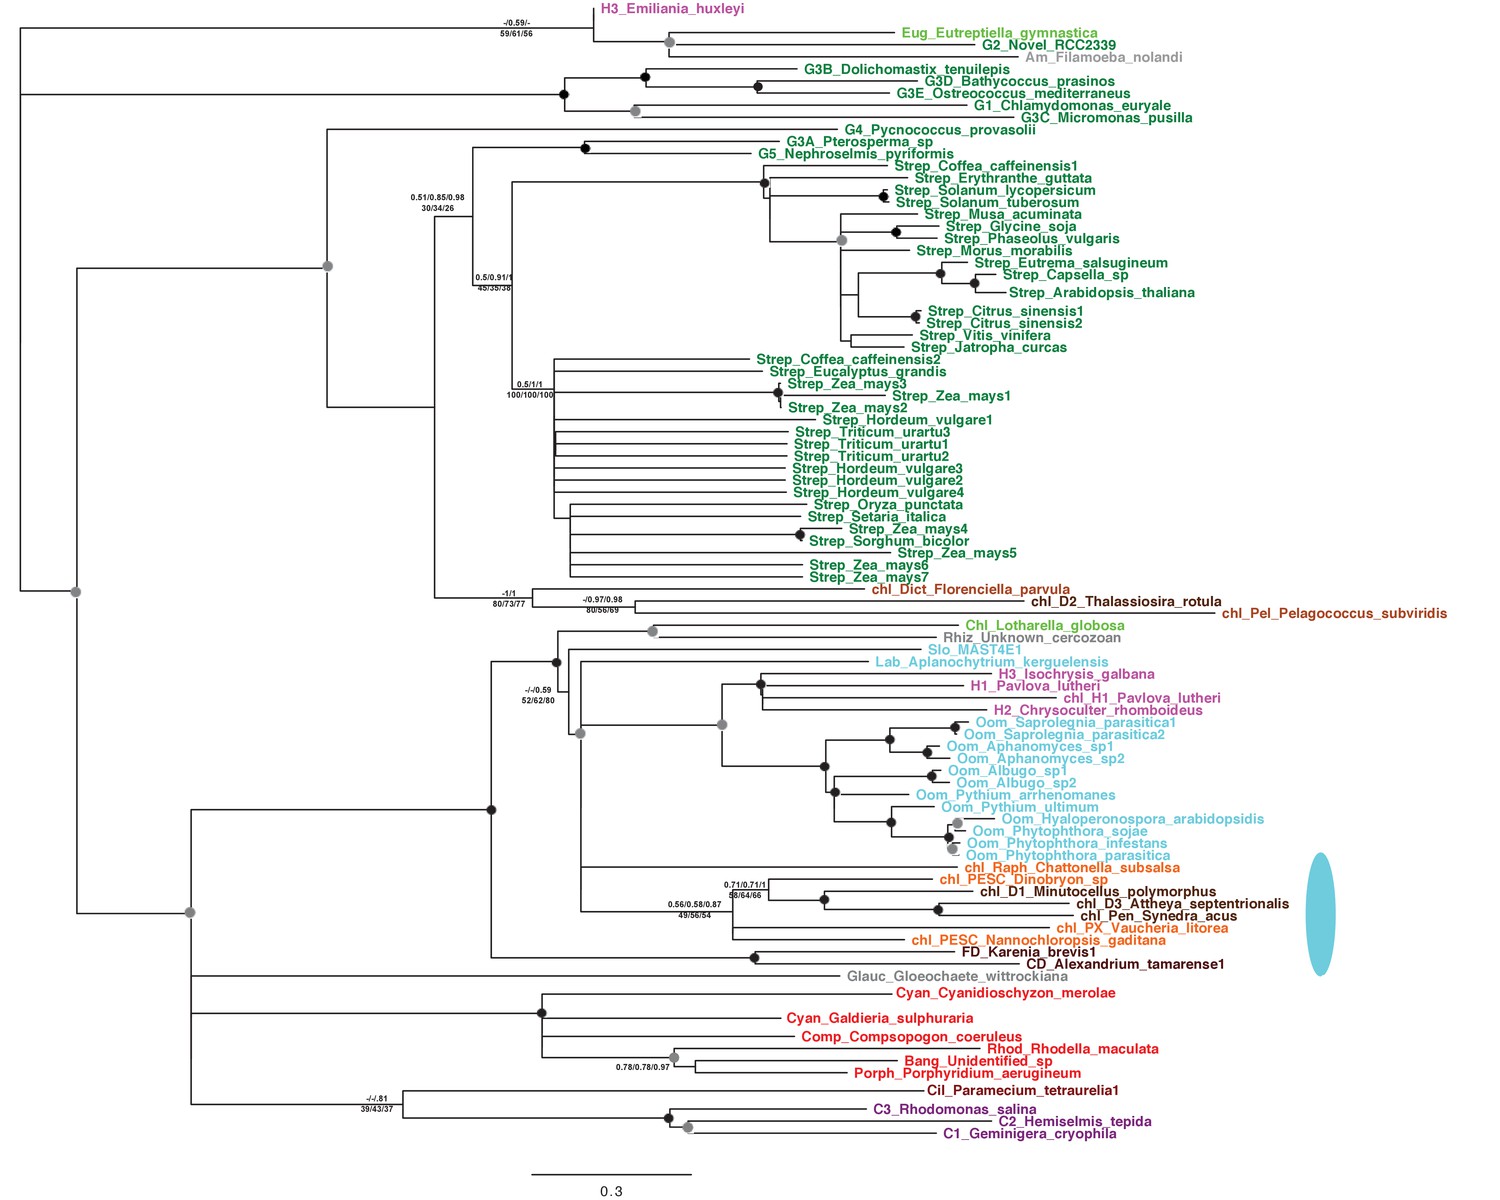
This tree shows the consensus Bayesian topology inferred for a 94 taxa x 449 aa alignment of pyrophosphate-dependent PFK, with taxa and support values shown as per Figure 2—figure supplement 2. The ancestral ochrophyte plastid isoform, of probable aplastidic stramenopile origin, is labelled with a cyan ellipse.
Figure 2—figure supplement 4
Tree of a novel ochrophyte plastid-targeted protein.
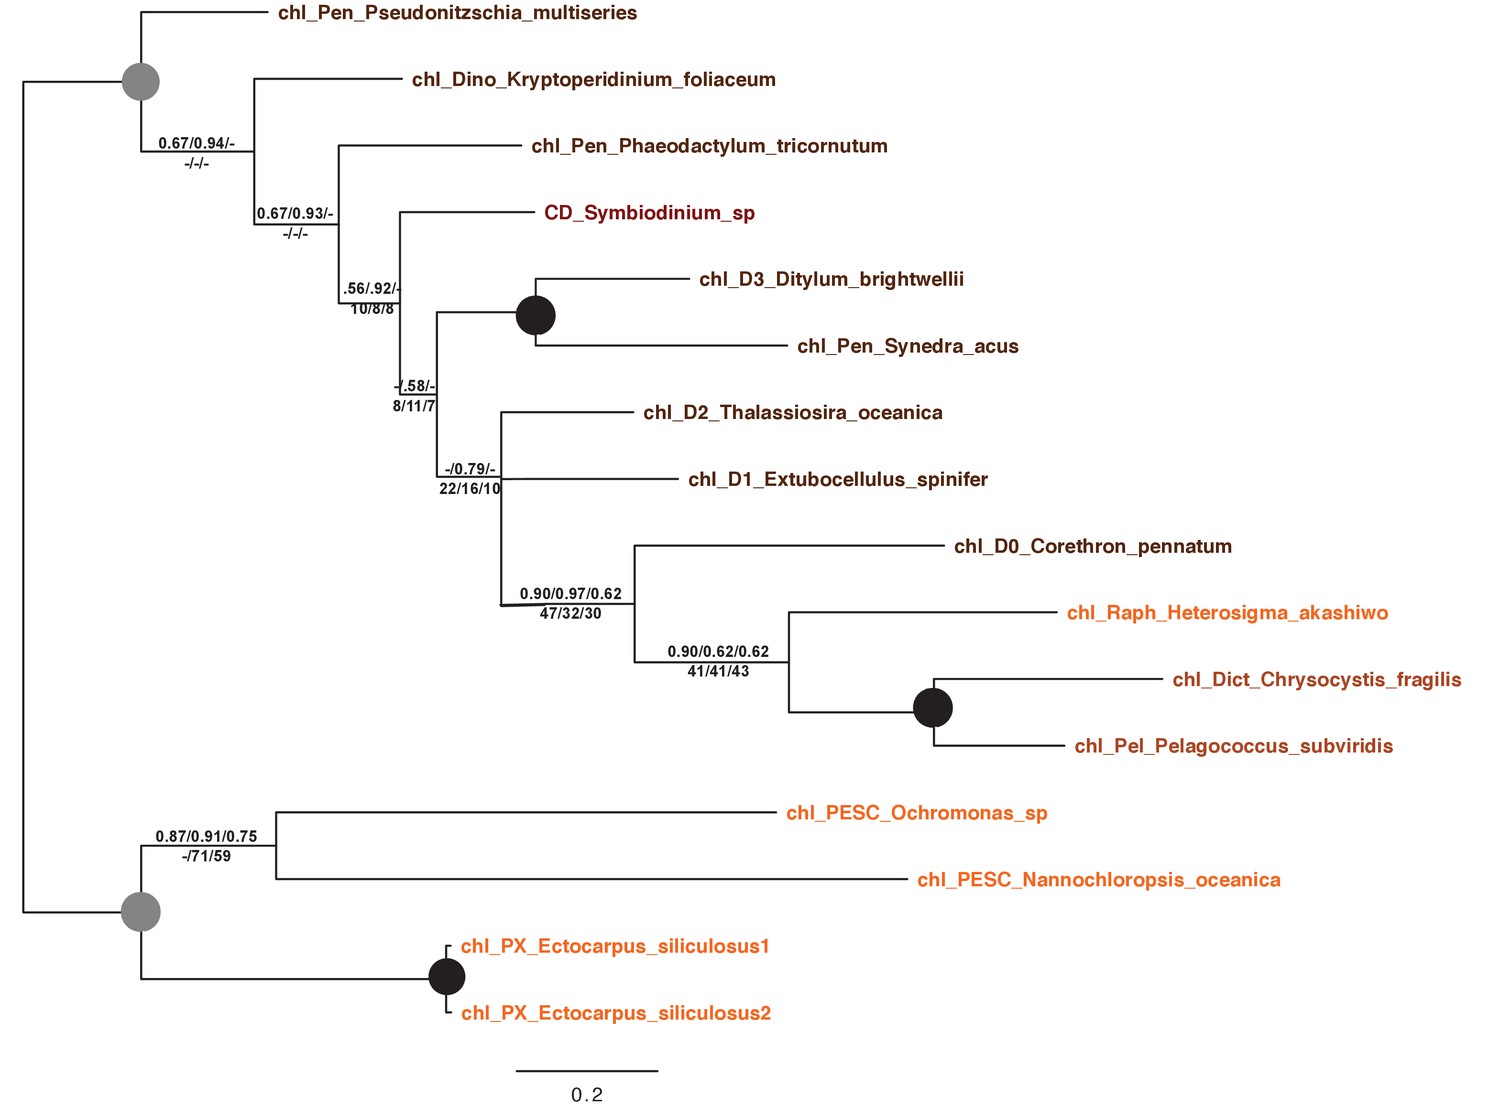
This tree shows the consensus Bayesian topology inferred for a 16 taxa x 103 aa alignment of a plastid-targeted protein seemingly restricted to ochrophytes and one dinoflagellate lineage. Taxa are labelled and support values are shown as per Figure 2—figure supplement 2.
Figure 2—figure supplement 5
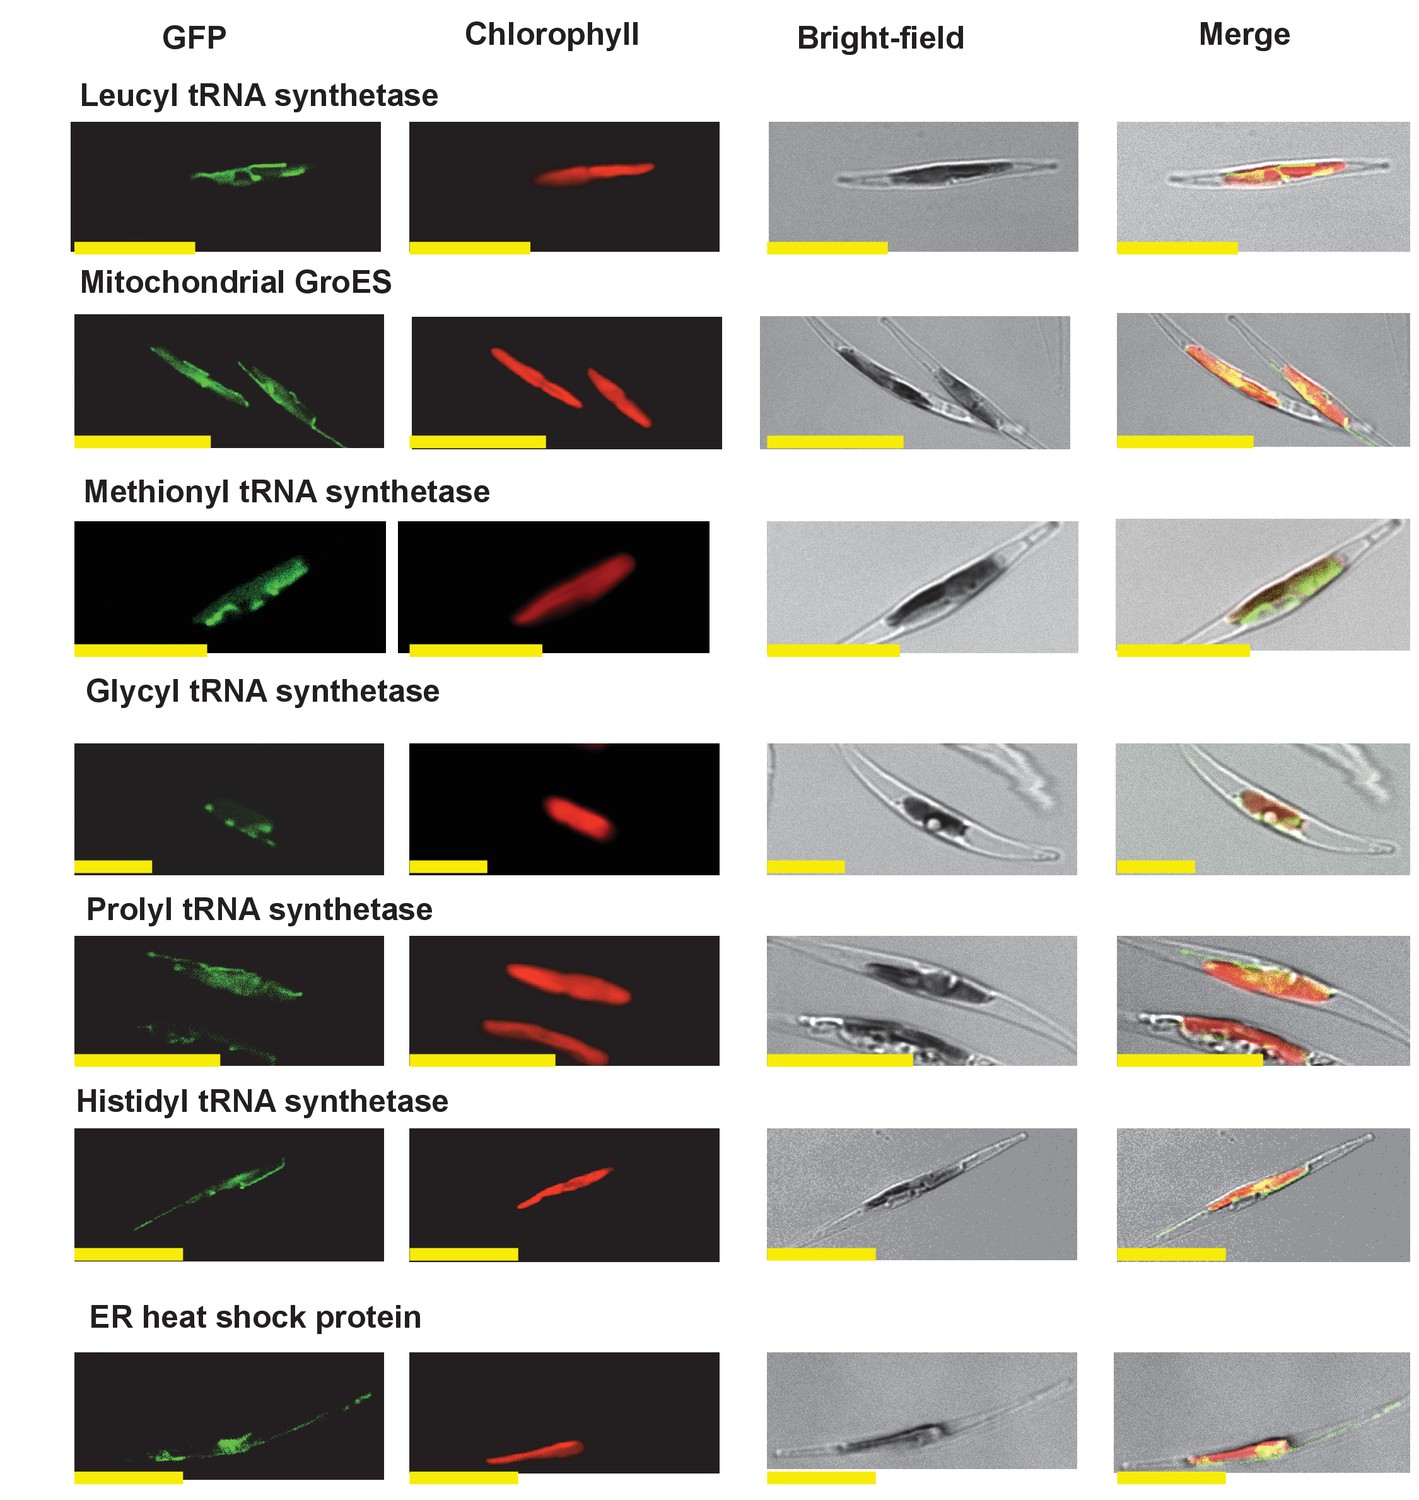
Multipartite Phaeodactylum plastid-targeted proteins.
This figure shows the localisation of GFP overexpression constructs for copies of seven proteins from the diatom Phaeodactylum tricornutum that are of non-plastid origin, but show multipartite localization to the plastid and one other organelle (the mitochondria, or in the case of the ‘ER heat shock protein’ to the endoplasmic reticulum).
Figure 2—figure supplement 6
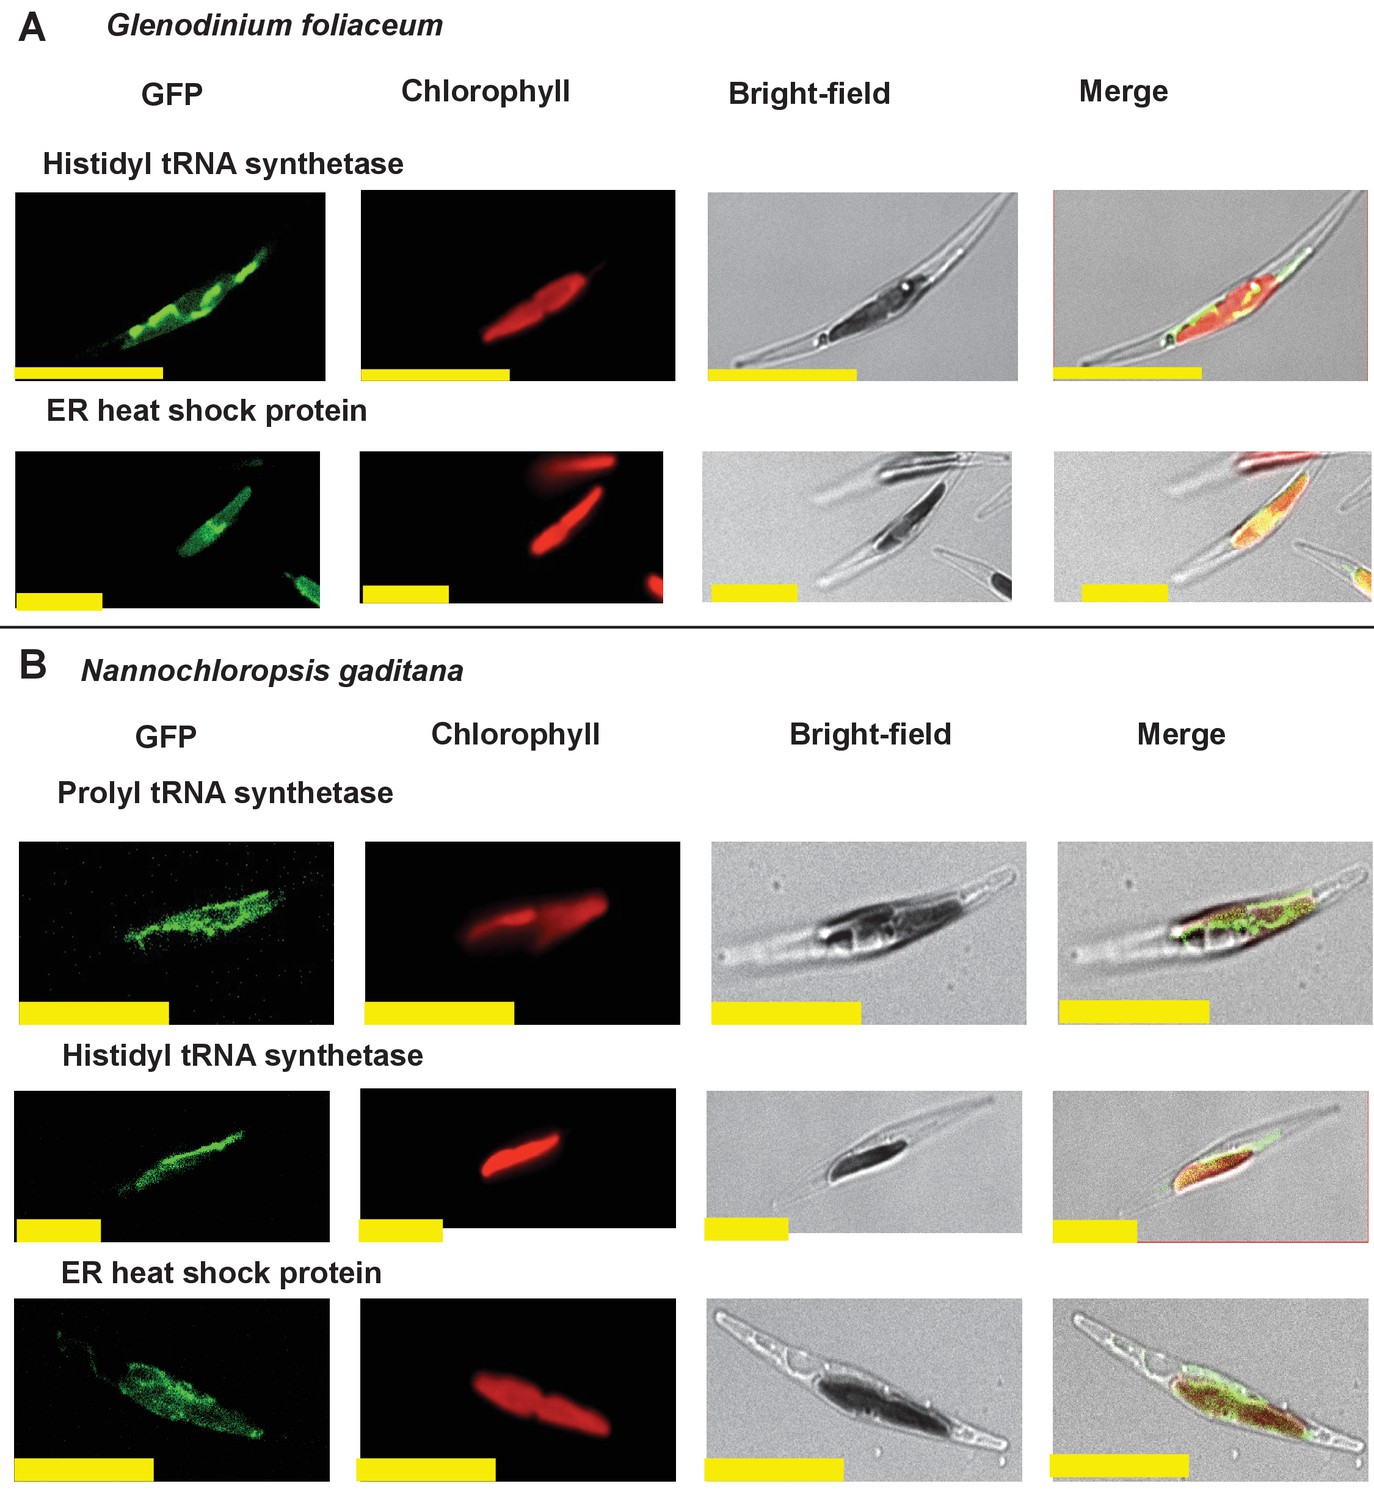
Heterologous expression constructs of multipartite plastid-targeted proteins.
This figure shows the localisation of GFP overexpression constructs for copies of two proteins from the dinotom Glenodinium foliaceum (Panel A), and three proteins from the eustigmatophyte Nannochloropsis gaditana (Panel B) that are of non-plastid origin, but show multipartite localisation to the plastid and one other organelle, per Figure 2—figure supplement 5.
Figure 2—figure supplement 7
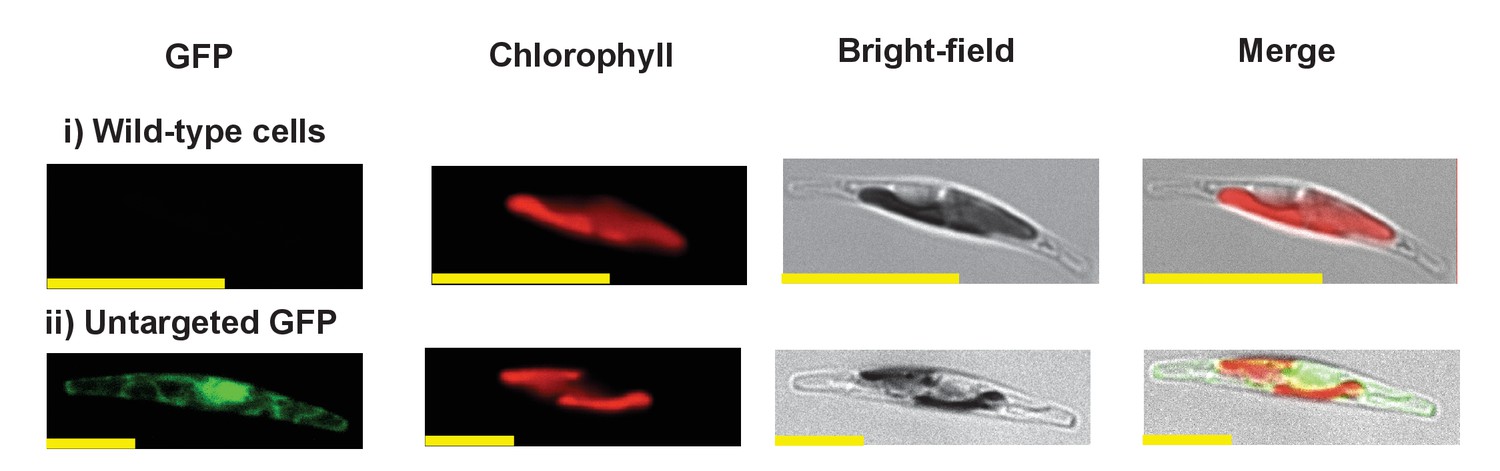
Exemplar control images for confocal microscopy.
This figure shows fluorescence patterns for wild-type Phaeodactylum tricornutum cells (i), and transformant Phaeodactylum cells expressing GFP that has not been fused to any N-terminal targeting sequence (ii), both visualised under the same conditions used for all other cultures.
Figure 3

Evolutionary origins of the ochrophyte plastid proteome.
(Panel A) displays the origins inferred by BLAST top hit, phylogenetic analysis, and combined analysis for all ancestral HPPGs. (Panel B) shows (i) a schematic diagram of stramenopile taxonomy, with the evolutionary relationships between labyrinthulomycetes, oomycetes, slopalinids and ochrophytes proposed by recent multigene studies (Derelle et al., 2016), and the probable closest stramenopile relative (as inferred by BLAST top hit analysis) of the 26 ancestral HPPGs verified by combined analysis to be of aplastidic stramenopile origin, and (ii) the next nearest relative, as inferred through BLAST top hit, phylogenetic and combined analysis, of the 26 aplastidic stramenopile HPPGs verified by combined analysis. The evolutionary categories in this graph are shaded as per in panel A.
Figure 4 with 5 supplements
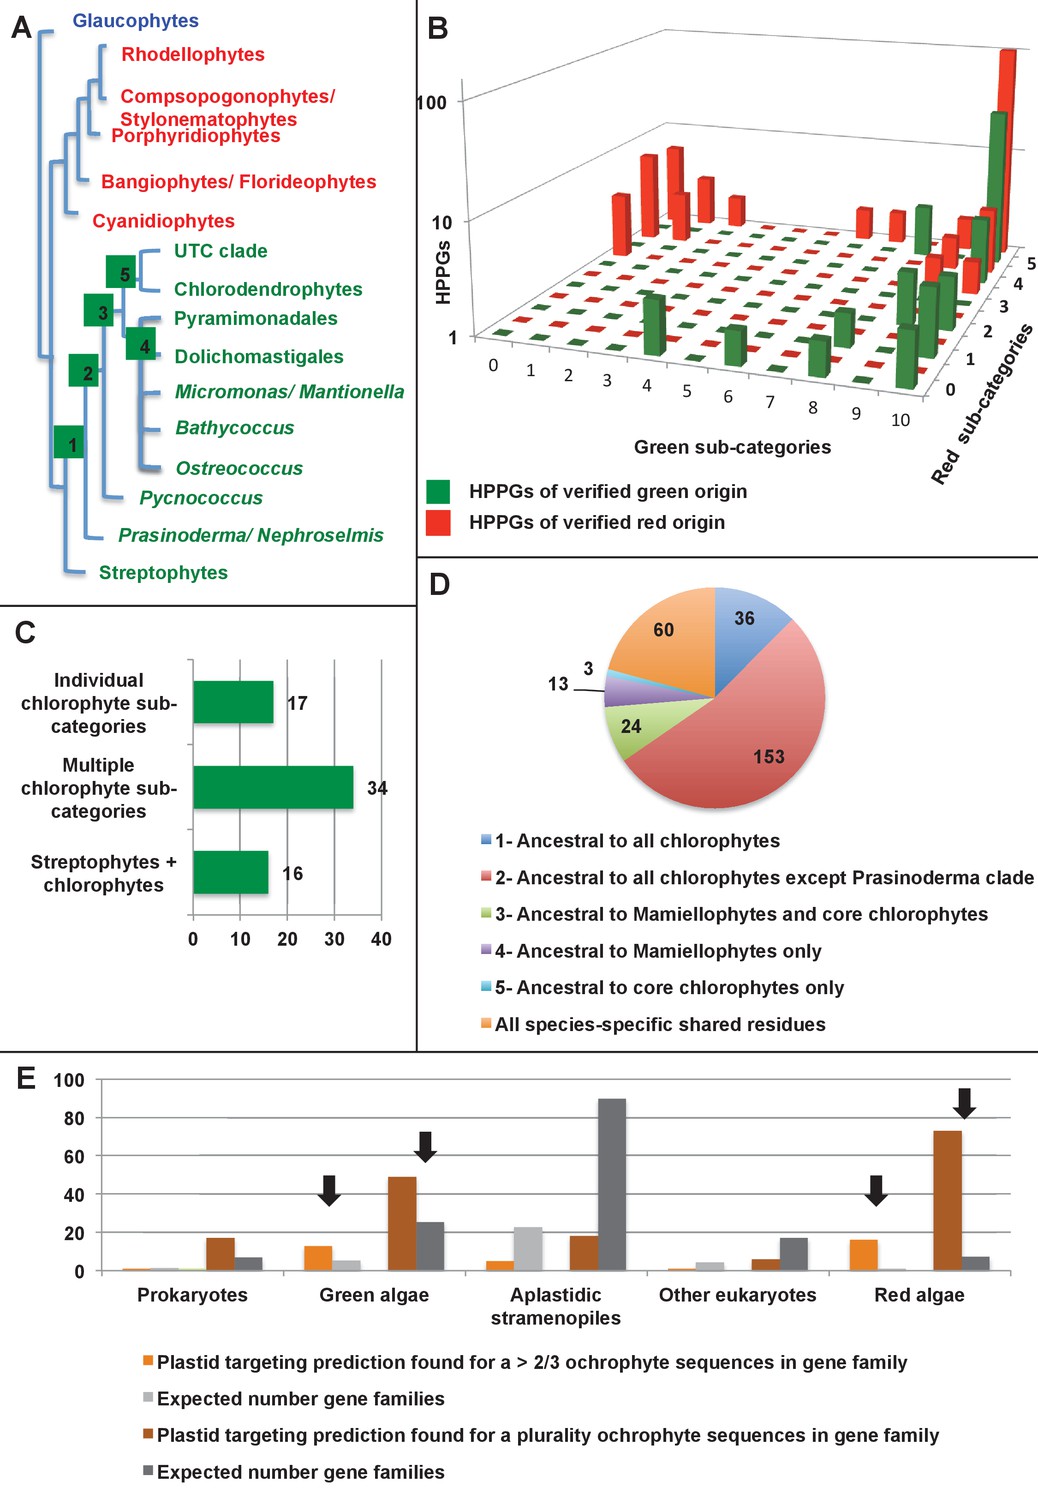
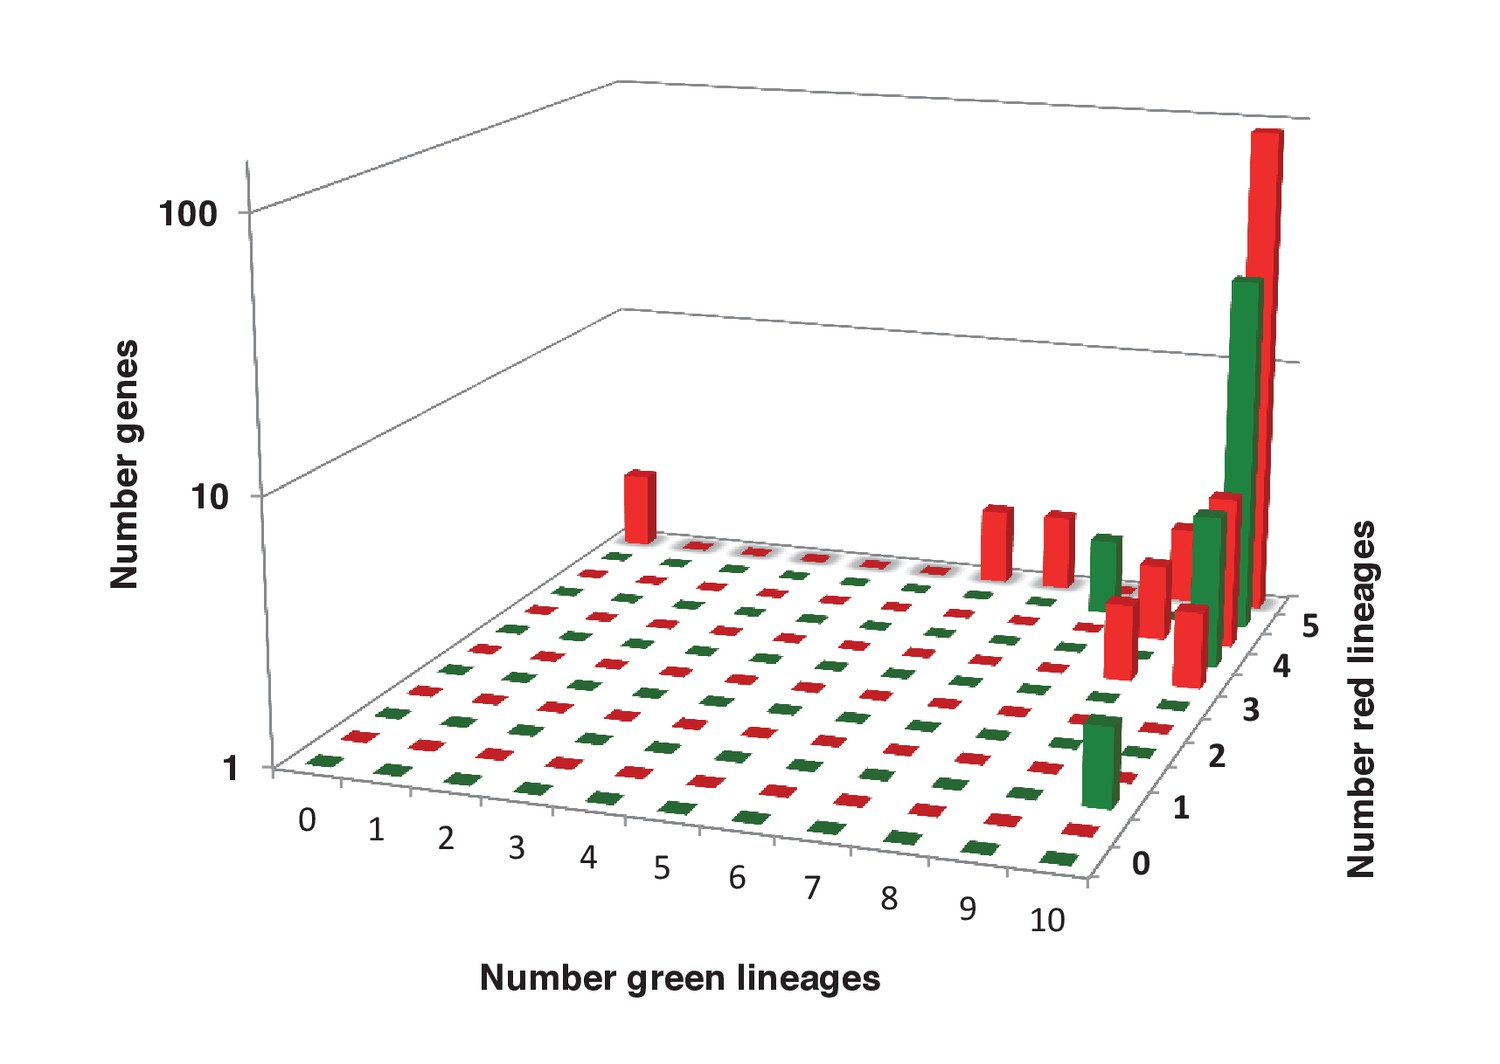
Verification and origins of the green signal in ochrophyte plastids.
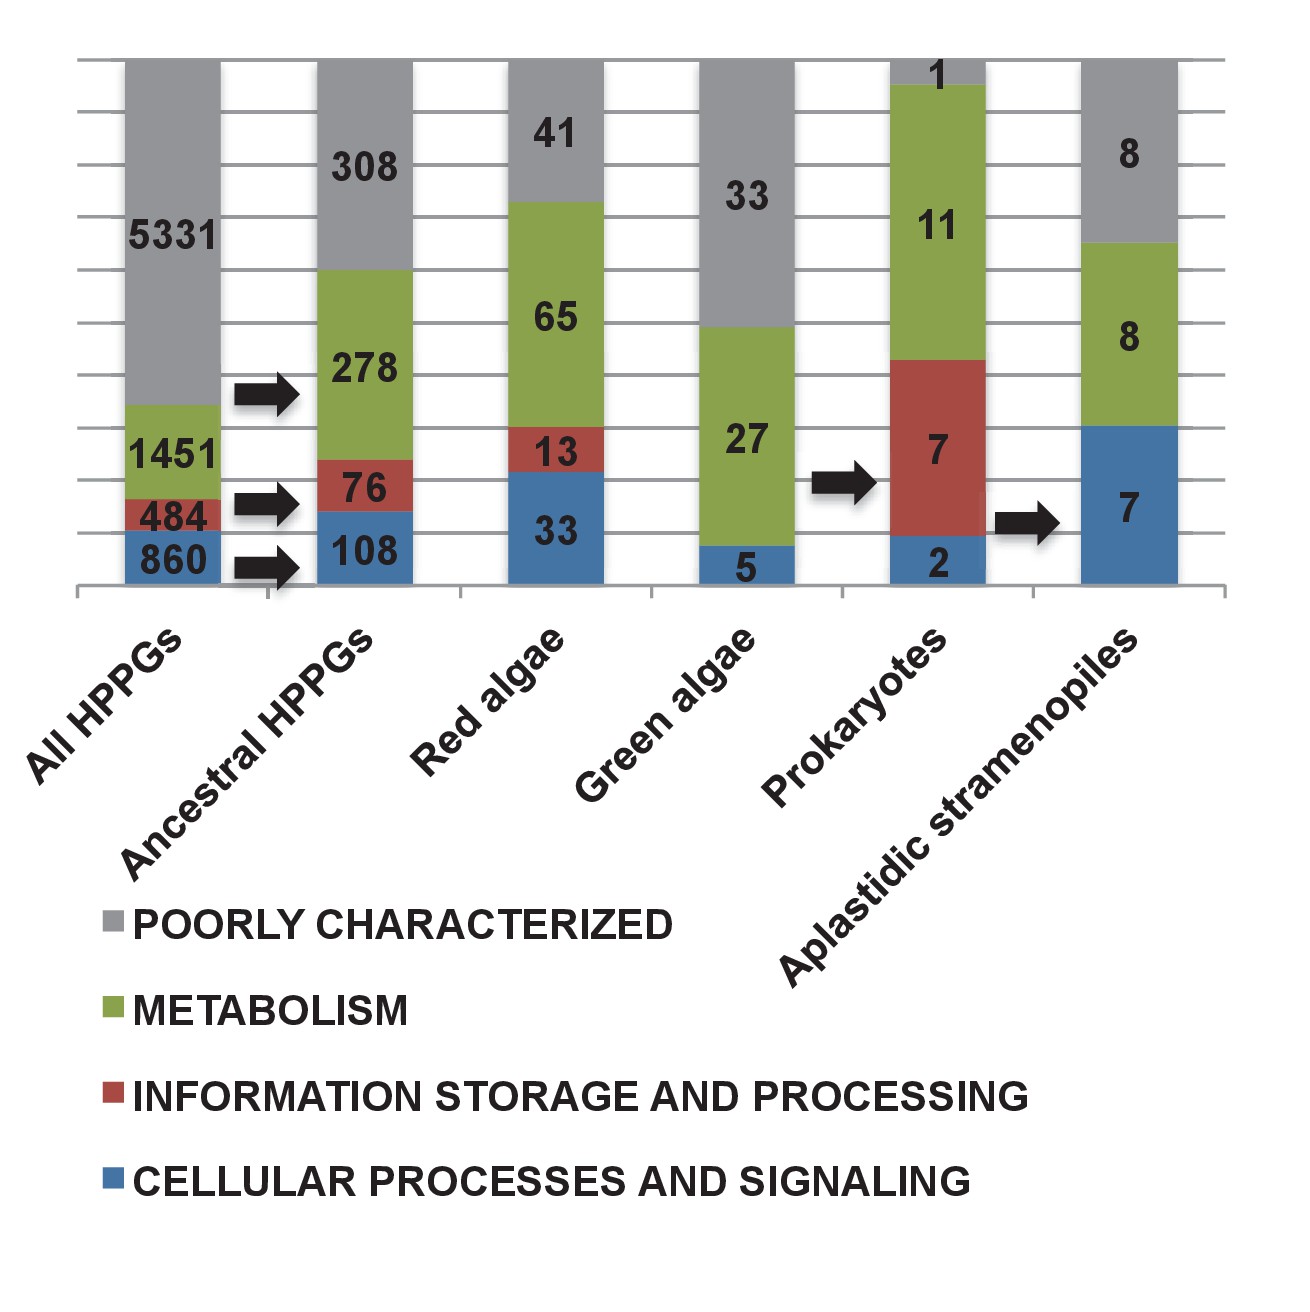
(Panel A) shows a schematic tree of the 11 archaeplastid sub-categories with which each green HPPG alignment was enriched prior to phylogenetic analysis. The topology of the red and green algae are shown according to previously published phylogenies (Leliaert et al., 2011; Yoon et al., 2006). Green sub-categories are in green text; red algal sub-categories in red text; and other sub-categories are in blue text. Five ancestral positions within the green algal tree inspected in subsequent analyses are labelled with coloured boxes. (Panel B) shows the number of HPPGs of verified red (red bars) or green origin (green bars) for which orthologues were identified in different numbers green sub-categories (plotted on the x-axis) and red sub-categories (plotted on the z-axis). An equivalent graph showing only HPPGs for which a glaucophyte orthologue was detected is shown in Figure 4—figure supplement 1. (Panel C) compares the number of trees in which HPPGs of verified green origin resolve as a sister group to all green lineages (including chlorophytes and streptophytes); to multiple chlorophyte sub-categories but to the exclusion of streptophytes; and to individual chlorophyte sub-categories only. A detailed heatmap of the evolutionary distribution of the green sub-categories detected in each sister-group is shown in Figure 4—figure supplement 2, and the distribution of BLAST top hits within each sub-category is shown in Figure 4—figure supplement 3. (Panel D) lists the number of residues inferred from a dataset of 32 ochrophyte HPPGs of verified green origin, which have been subsequently entirely vertically inherited in all major photosynthetic eukaryotic lineages, to be uniquely shared between ochrophytes and some but not all green lineages, hence might represent specific synapomorphic residues. Residues are categorized by inferred origin point within the tree topology shown in panel A, i.e., each of the five ancestral nodes labelled. A final category shows all of the residues inferred to be specifically shared with one green sub-category, and not with any other. The distribution of residues based on the earliest possible origin point (taking into account gapped and missing residues in each HPPG alignment) is shown in Figure 4—figure supplement 4. (Panel E) shows the number of the 7140 conserved gene families inferred to have been present in the last common ochrophyte ancestor that are predicted by ASAFind to encode proteins targeted to the plastid, subdivided by probable evolutionary origin, and the number expected to be present in each category assuming a random distribution of plastid-targeted proteins across the entire dataset, independent of evolutionary origin. Evolutionary categories of proteins found to be significantly more likely (chi-squared test, p=0.05) to encode plastid-targeted proteins than would be expected are labelled with black arrows. An equivalent distribution of plastid-targeted proteins inferred using HECTAR is shown in Figure 4—figure supplement 5.
Figure 4—figure supplement 1
Sampling richness associated with ancestral HPPGs of green algal origin.
This figure shows the number of sub-different archaeplastid orthologues for ancestral HPPGs verified by combined BLAST top hit and single-gene tree analysis to be of either green algal origin (green bars) or red algal origin (red bars), for which glaucophyte orthologues were also identified.
Figure 4—figure supplement 2
Heatmaps of nearest sister-groups of ancestral HPPGs of verified green origin.
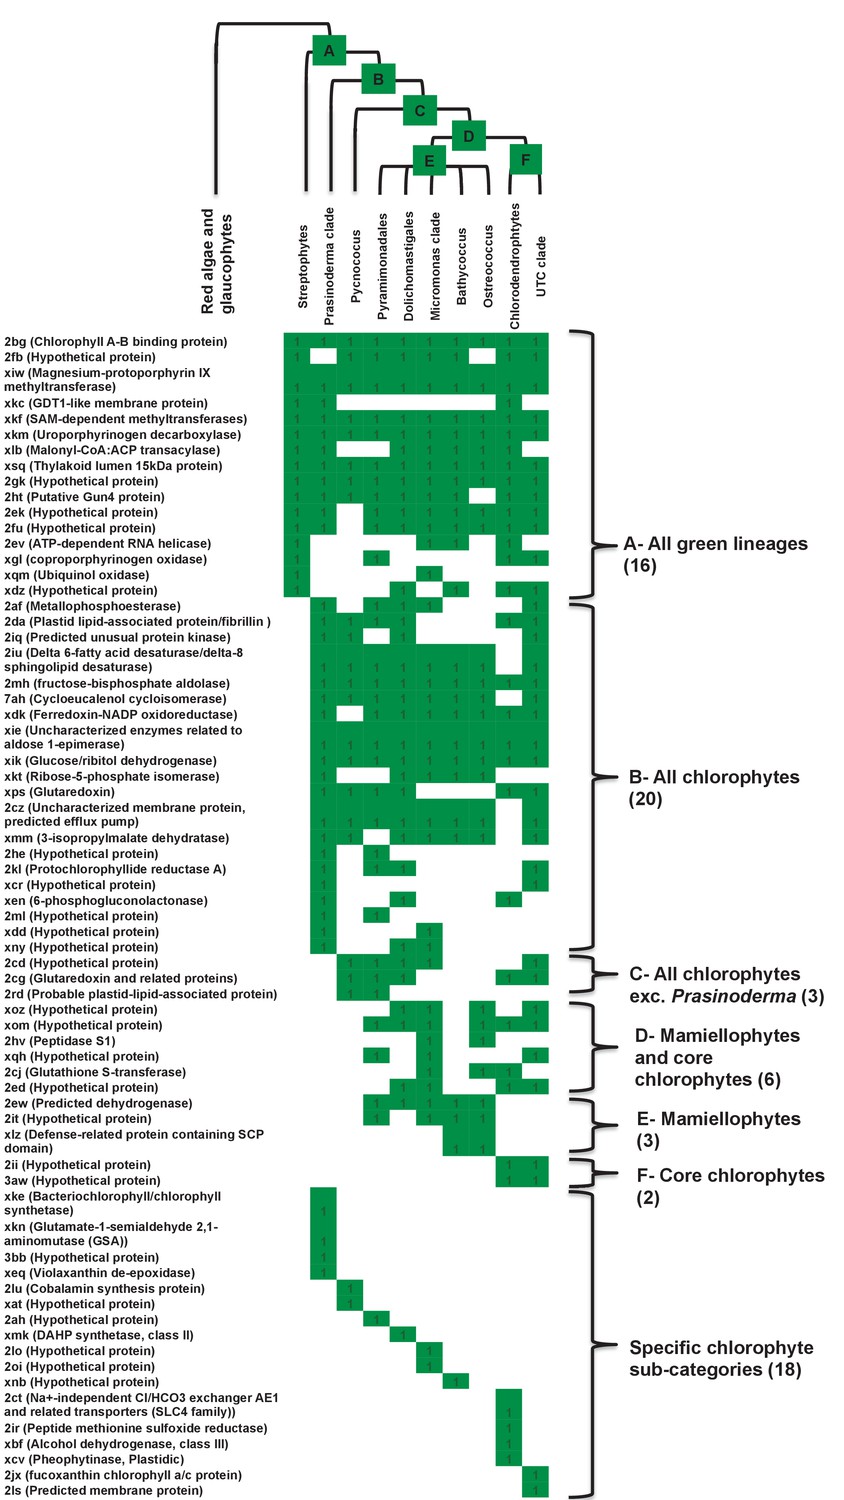
This figure shows the specific topologies of single gene trees for HPPGs verified to be of green origin by combined BLAST and phylogenetic analysis. (Panel A) shows a reference topology of evolutionary relationships between green lineages, defined as per Leliaert et al. (2011). Six ancestral nodes that might correspond to the origin point of ochrophyte HPPGs are labelled with coloured boxes. (Panel B) shows the presence and absence of each green subcategory in the immediate sister-group to the ochrophyte HPPG in each single tree of HPPGs of verified origin. HPPGs are grouped by the inferred origin point within the green algae, with the number of HPPGs identified for each origin point given with round brackets.
Figure 4—figure supplement 3
Specific origins of green HPPGs as inferred from BLAST top hit analyses.
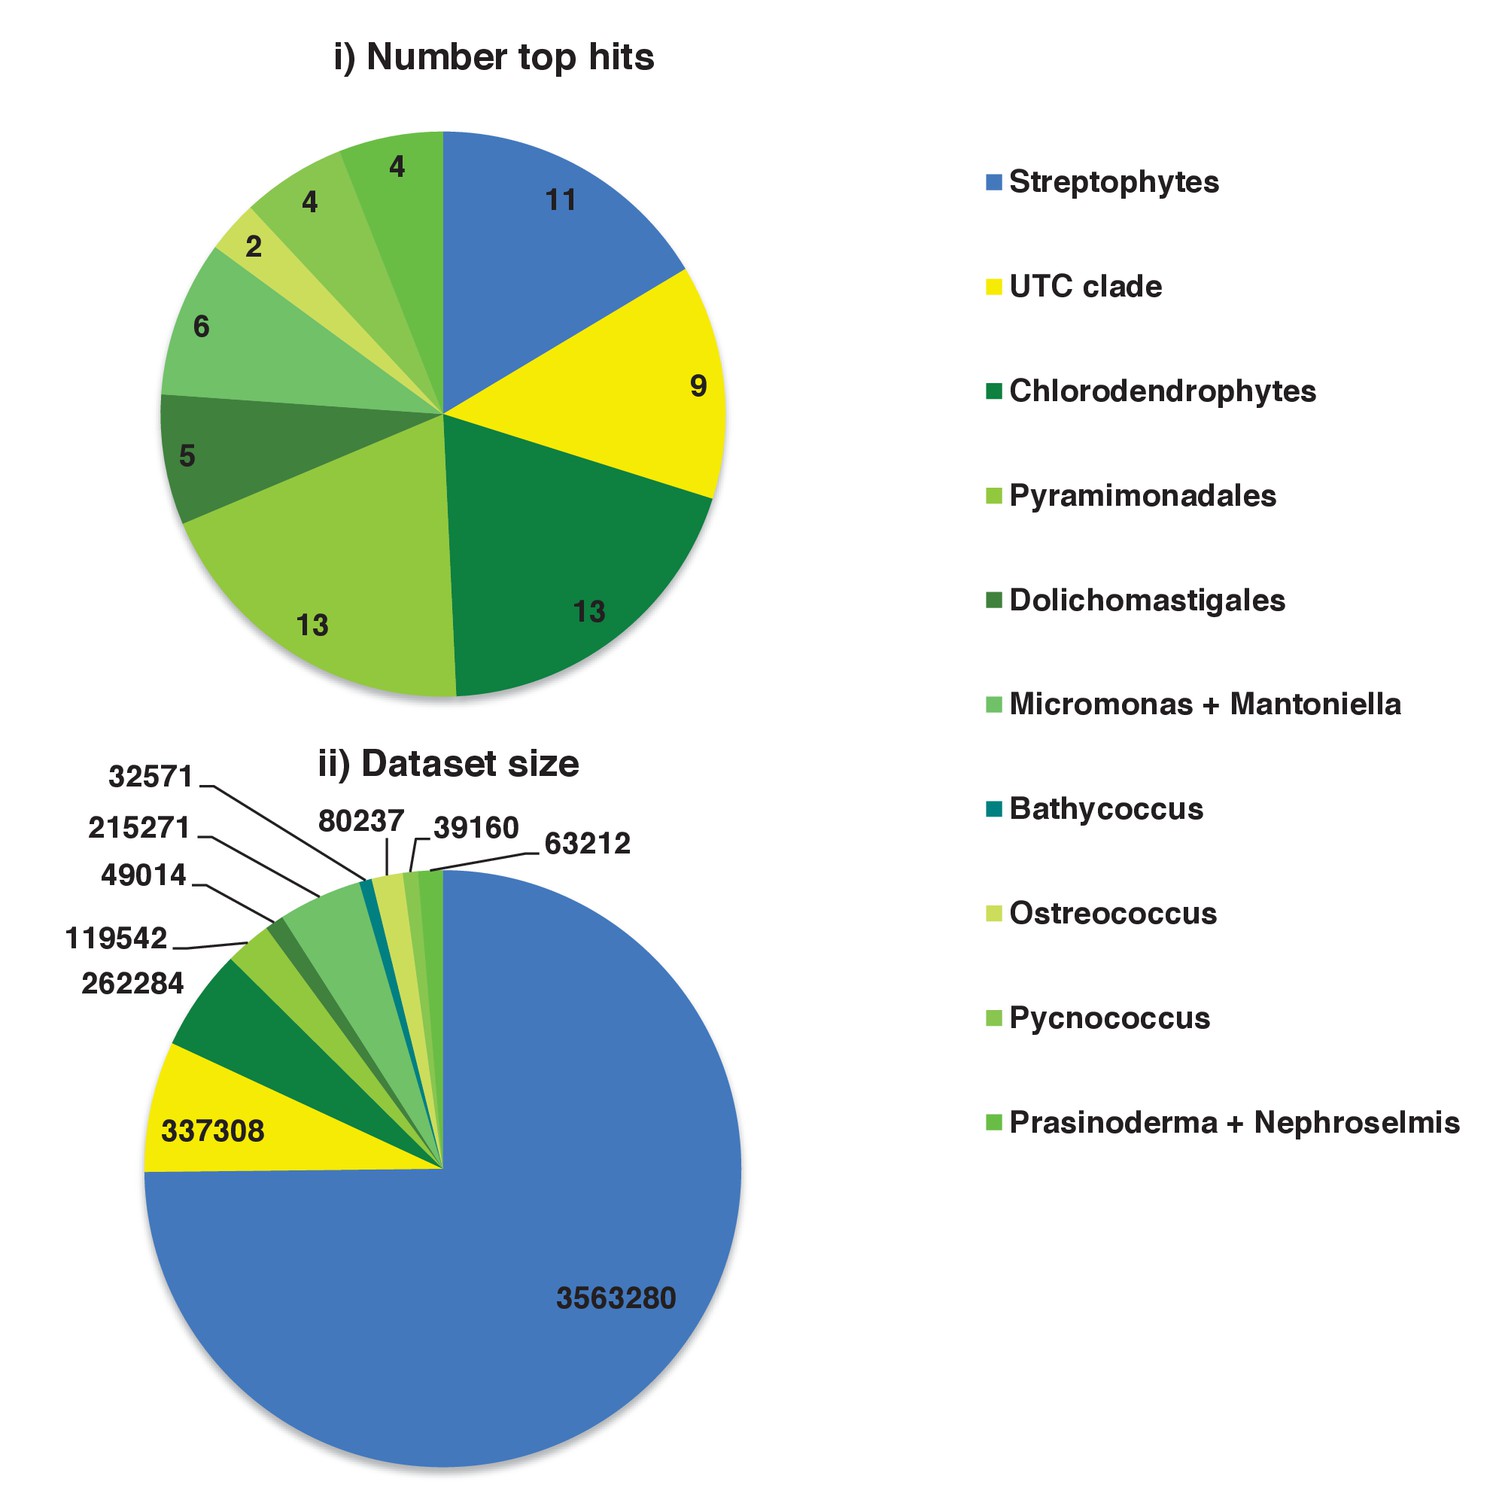
These charts show (i) the number of BLAST top hits against each of the individual green sub-categories from HPPGs for which a green origin was identified both from BLAST top hit and single-gene tree analysis, and (ii) the total number of non-redundant sequences from each green sub-category included in the BLAST library.
Figure 4—figure supplement 4
Earliest evolutionary origins of shared plastid residues.
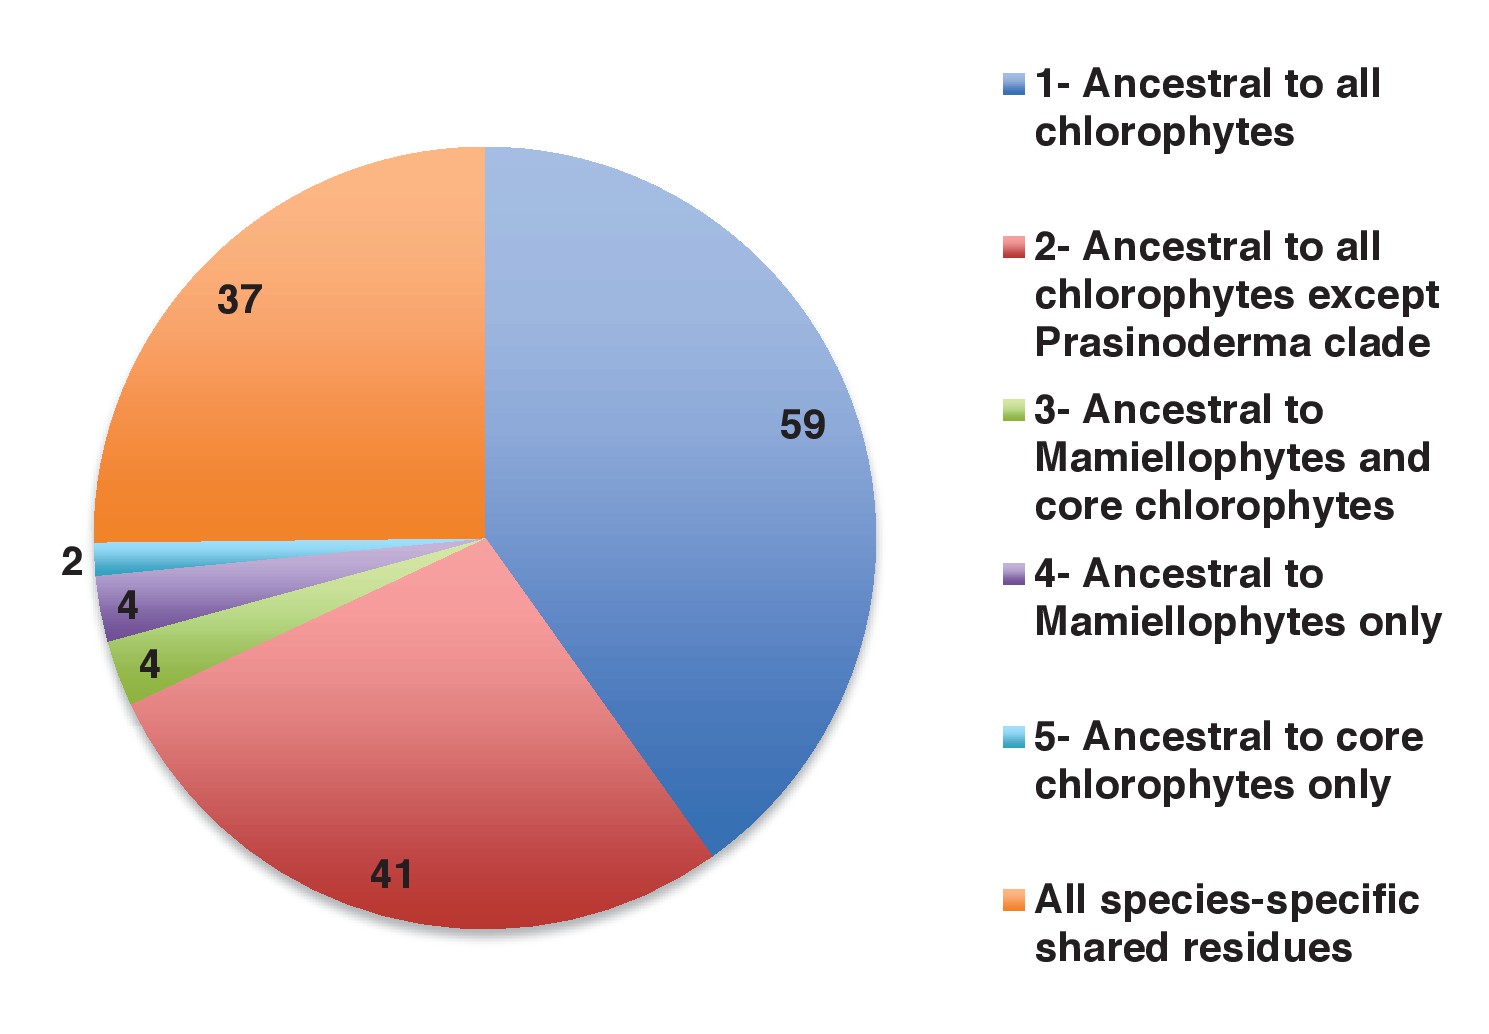
This figure shows the number of residues in the concatenated alignment of HPPGs of verified green origin, which have been subsequently vertically inherited in all major photosynthetic eukaryotes that are present in green algae and ochrophytes, and are not found in red algae and glaucophytes. Residues are divided by inferred origin point, and are shown as per Figure 4, panel D. The values here a calculated as the earliest possible origin point for each uniquely shared residue, in which all gapped and missing positions within the alignment are treated as potential identities. 100 of the 147 residues inferred to have originated within green algae in this analysis originated either within a common ancestor of all chlorophytes, or in a common ancestor of all chlorophytes excluding the basally divergent lineages Prasinoderma, Prasinococcus and Nephroselmis.
Figure 4—figure supplement 5
Origins and HECTAR based targeting tests of proteins encoded by conserved ochrophyte gene clusters.
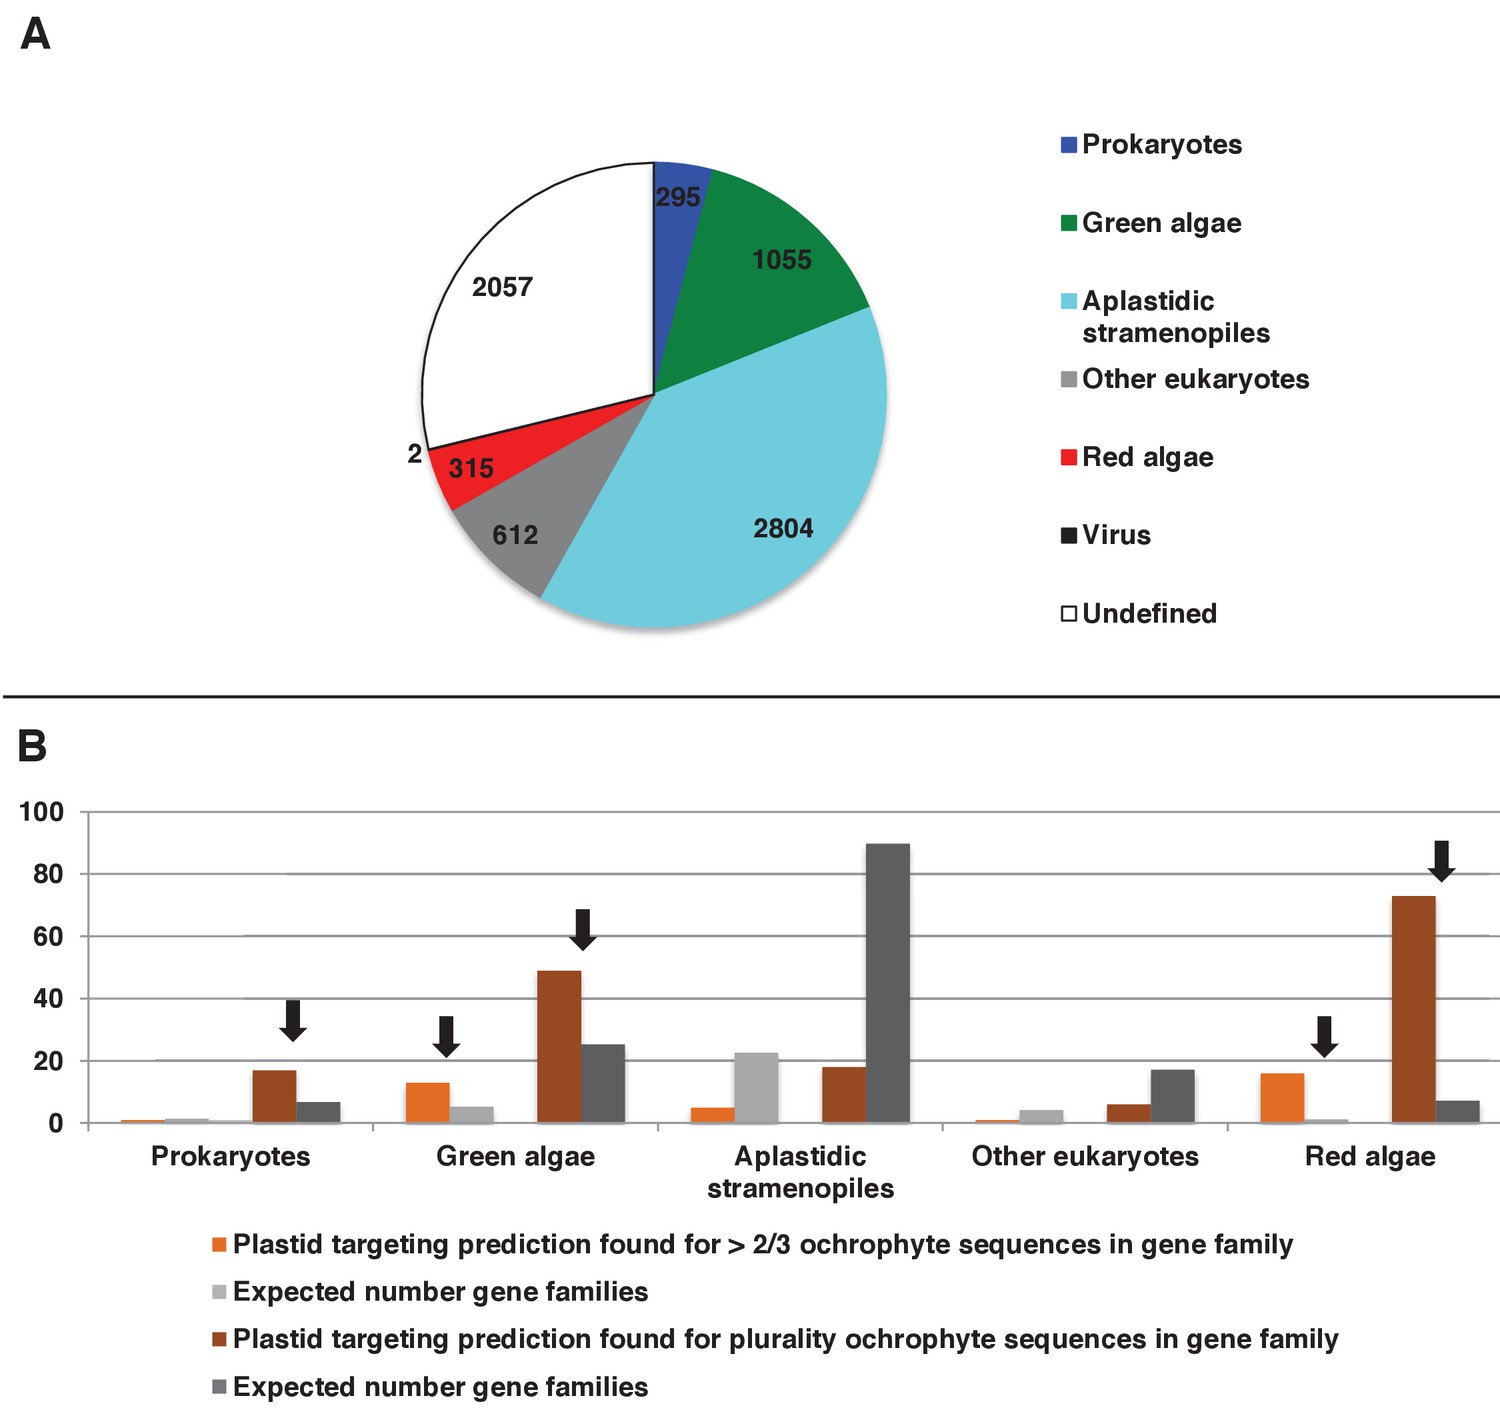
(Panel A) shows the most probably evolutionary origin, identified using BLAST top hit analysis, for 7140 conserved gene clusters inferred to have been present in the last common ochrophyte ancestor. (Panel B) shows the number of these gene families that are predicted by HECTAR to encode proteins targeted to the plastid, subdivided by probable evolutionary origin, and the number expected to be present in each category assuming a random distribution of plastid-targeted proteins across the entire dataset, independent of evolutionary origin. Categories inferred to be significantly enriched above the expected values are labelled with black arrows.
Figure 5 with 9 supplements
Functional mixing of the ancestral ochrophyte HPPGs.
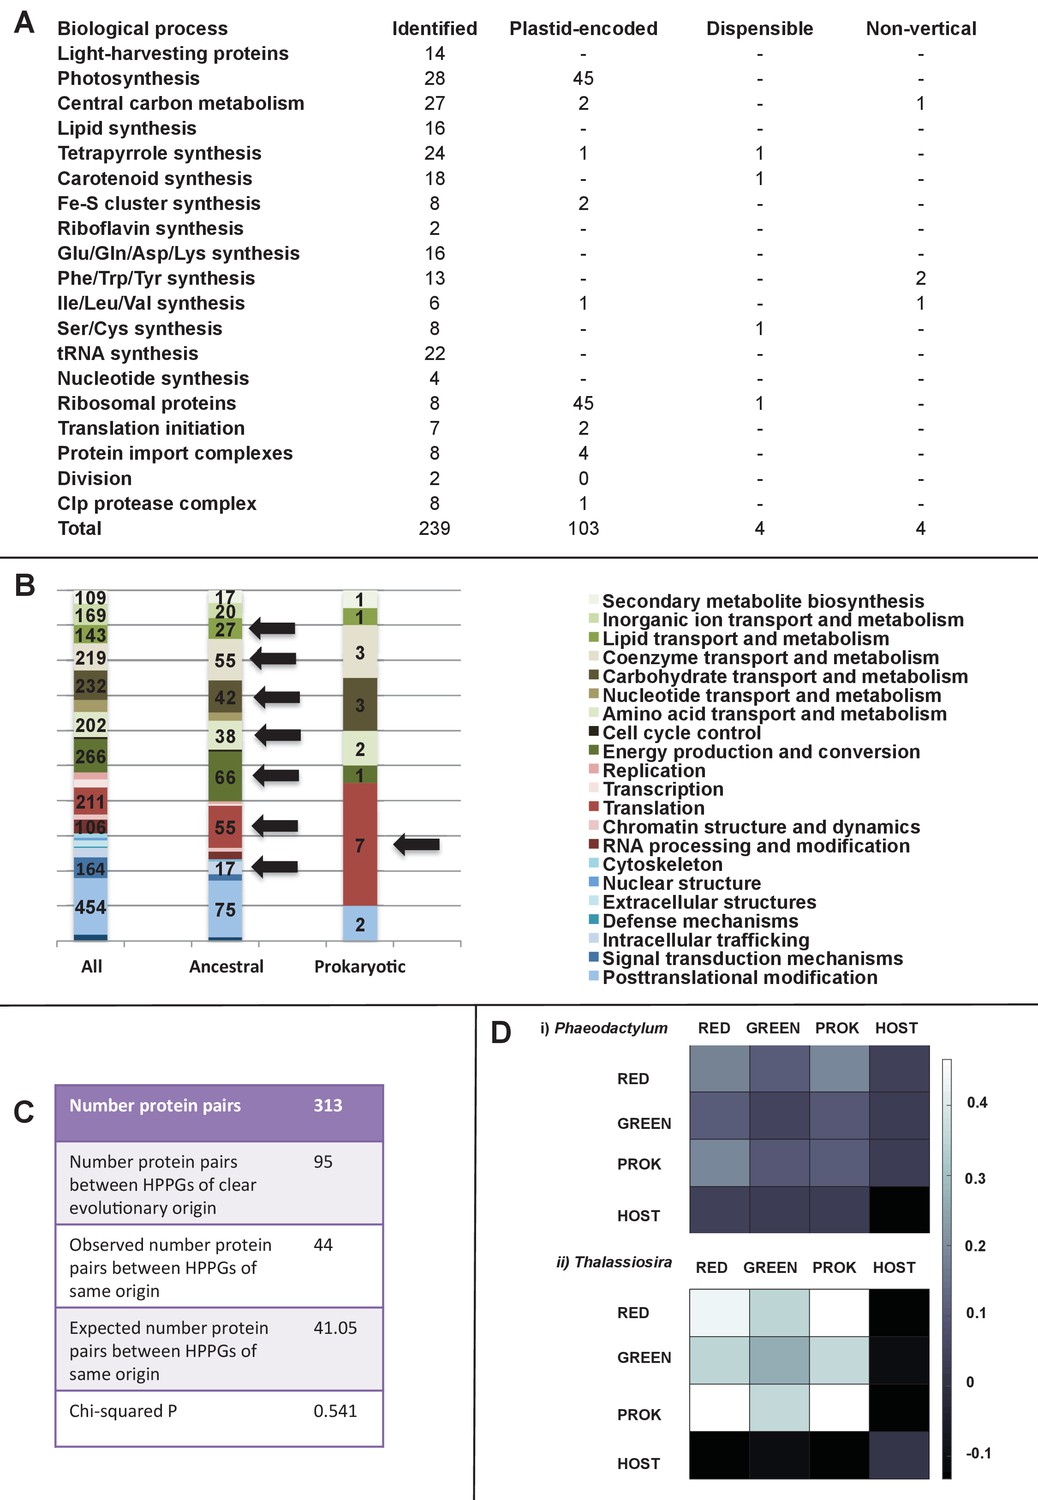
(Panel A) tabulates nineteen different fundamental plastid metabolism pathways and biological processes recovered in the ancestral HPPG dataset. Detailed information concerning the origin and identity of each component of each pathway is provided in Figure 5—figure supplement 1, and an overview and phylogenetic trees of each of the non-vertically inherited enzymes identified are provided in Figure 5—figure supplements 2–6. (Panel B) compares the distribution of individual KOG families in the complete HPPG library, the ancestral HPPG dataset, and HPPGs of verified prokaryotic origin. KOG families pertaining to metabolism are shown in shades of green, families pertaining to information storage are shown in shades of red, and families pertaining to cellular processes are shown in shades of blue. Families with unknown KOG classification or general function predictions only are not shown. KOG classes that are enriched in the ancestral HPPG dataset compared to the relative proportions of each KOG class found in the full HPPG dataset, or in individual ancestral HPPGs of prokaryotic origin compared to the ancestral HPPG dataset (as inferred by chi-squared test, p<0.05), are labelled with black horizontal arrows. No such enrichments were observed in any evolutionary category of ancestral HPPGs other than prokaryotes, hence analogous distributions of HPPGs of red algal, green algal and host origin are not shown. Overviews of the broader KOG classes that are enriched either in the ancestral HPPG dataset, or in specific evolutionary categories of ancestral HPPG, are shown in Figure 5—figure supplement 7. (Panel C) tabulates the number of ancestral HPPGs performing consecutive metabolic functions, or that are likely to have direct regulatory interactions, alongside the number of these protein pairs in which both members are of verified evolutionary origin; the number observed where both members possess the same evolutionary origin; the expected number of protein pairs where both members possess the same evolutionary origin; and the chi-squared probability of similarity between the observed and expected values. (Panel D) shows heatmaps for the pairwise correlation coefficients of expression for genes encoding different evolutionary categories, as verified using combined BLAST top hit and single-gene tree analysis, of ancestral HPPGs in the model diatoms Phaeodactylum tricornutum (i) and Thalassiosira pseudonana (ii). A scale bar showing the relationship between shading and correlation coefficient is shown to the right of the heatmaps. Boxplots comparing the individual expression profiles of different categories of ancestral HPPG, and the associated ANOVA P values calculated, are shown in Figure 5—figure supplement 8 (for P. tricornutum) and Figure 5—figure supplement 9 (for T. pseudonana).
Figure 5—figure supplement 1
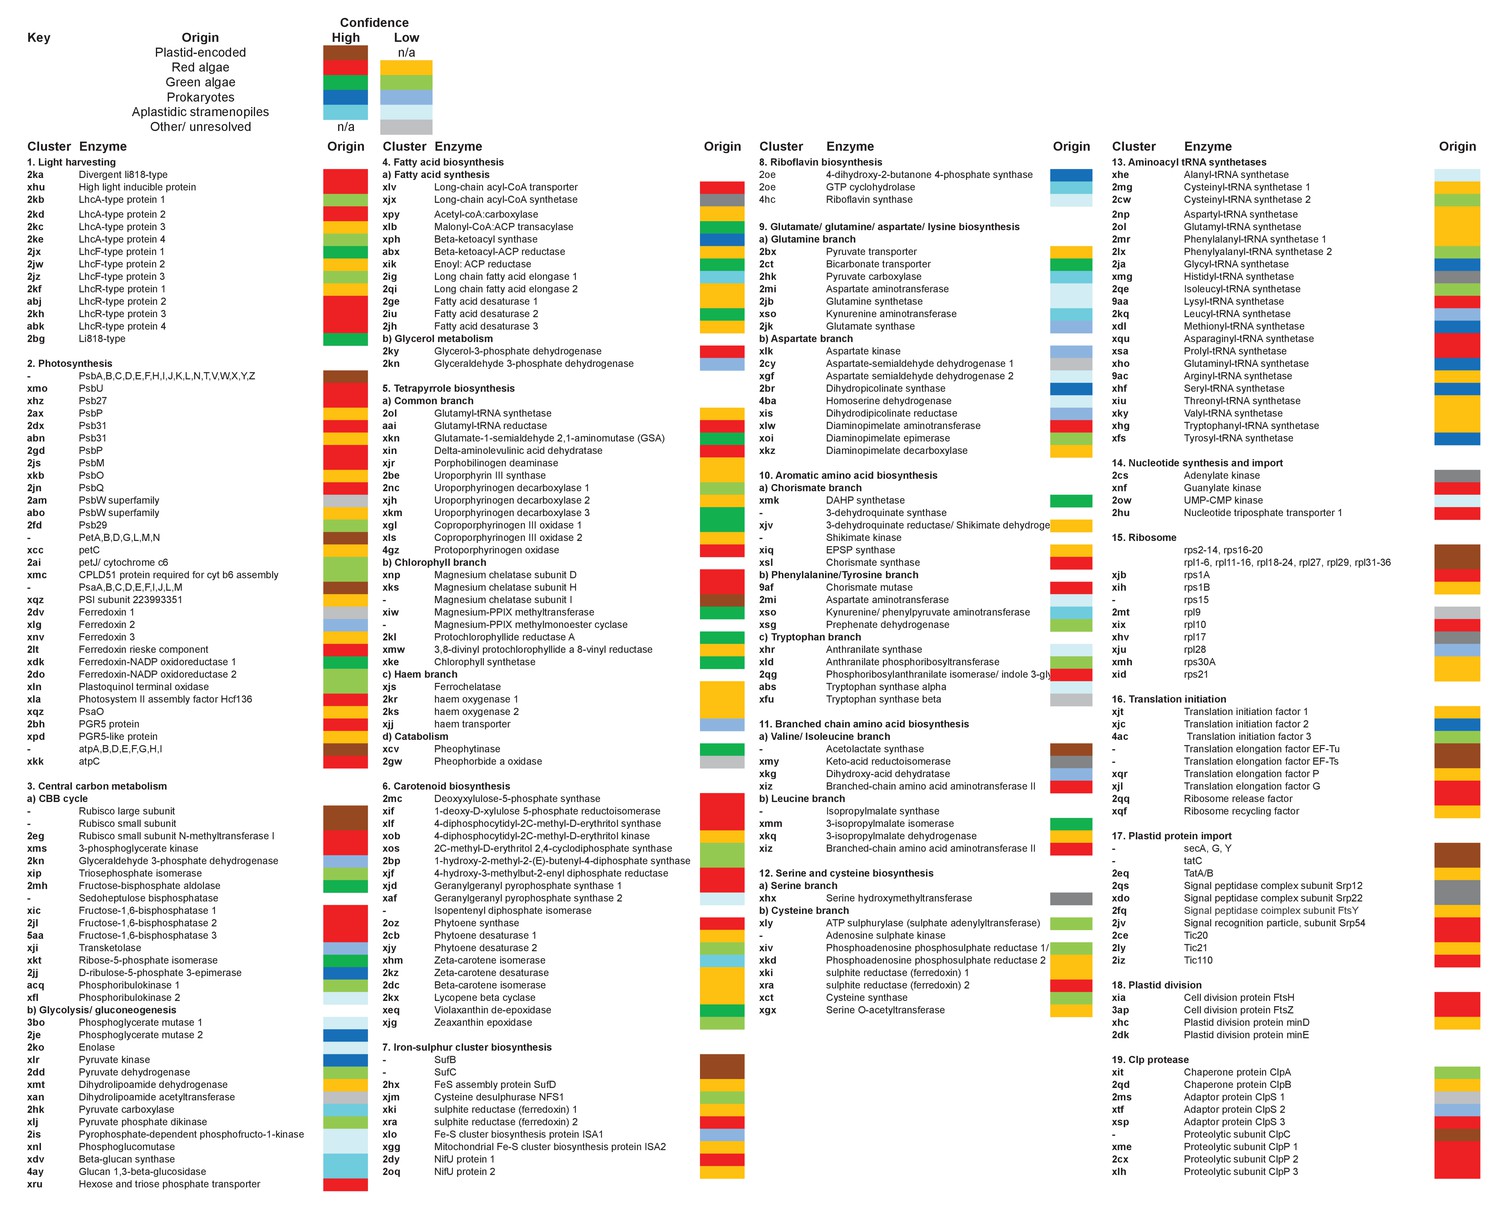
Reconstructed metabolism pathways and core biological processes in the ancestral ochrophyte plastid.
This figure tabulates each of the ancestral ochrophyte HPPGs corresponding to 350 central plastid metabolism and other biological processes. The ‘origin’ column shows the probable evolutionary source for each HPPG as defined by combined BLAST tophit and single-gene tree analysis. The origin of each ancestral HPPG is either assigned a ‘high confidence’ value (in which the same origin was robustly supported both by single-gene tree and by BLAST tophit analysis) or a ‘low confidence’ value (in the absence of robust and consistent support through both techniques; corresponding to the tree sister-group if one could be clearly assigned, or the BLAST tophit identity if not). A dash indicates the corresponding protein was not identified in the ancestral HPPG dataset due to either being plastid-encoded or alternative reasons; detailed explanations for the enzymes that are neither plastid-encoded nor detected in the ancestral HPPG dataset are provided in Figure 5—figure supplement 2.
Figure 5—figure supplement 2

Core plastid metabolism proteins not identified within the ancestral HPPG dataset.
https://doi.org/10.7554/eLife.23717.023
Figure 5—figure supplement 3
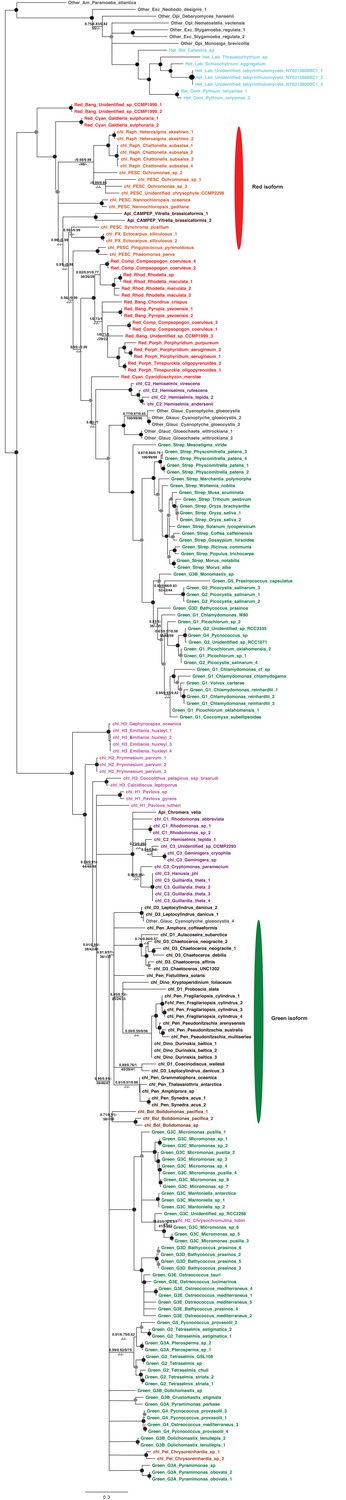
Tree of ochrophyte sedoheptulose- 7-bisphosphatase sequences.
This figure shows the consensus Bayesian topology inferred for a 218 taxa x 303 aa alignment of sedoheptulose-7-bisphosphatase sequences, shown as per Figure 2—figure supplement 2. Two different ochrophyte plastid isoforms- one restricted to chrysista, and of probable red algal origin, and one found in hypogyristea and diatoms, of probable green algal origin- are shown respectively by red and green ellipses.
Figure 5—figure supplement 4
Tree of ochrophyte 3-dehydroquinate synthase sequences.
This figure shows the consensus Bayesian topology inferred for a 324 taxa x 387 aa alignment of 3-dehydroquinate synthase, shown as per Figure 2—figure supplement 2. Three ochrophyte plastid isoforms are shown with coloured ellipses: a probable bacterial isoform restricted to pelagophytes and dictyochophytes (blue ellipse), and two isoforms of ambiguous red/ green origin found respectively in raphidophytes and eustigmatophytes, and in diatoms (green ellipses with red borders).
Figure 5—figure supplement 5

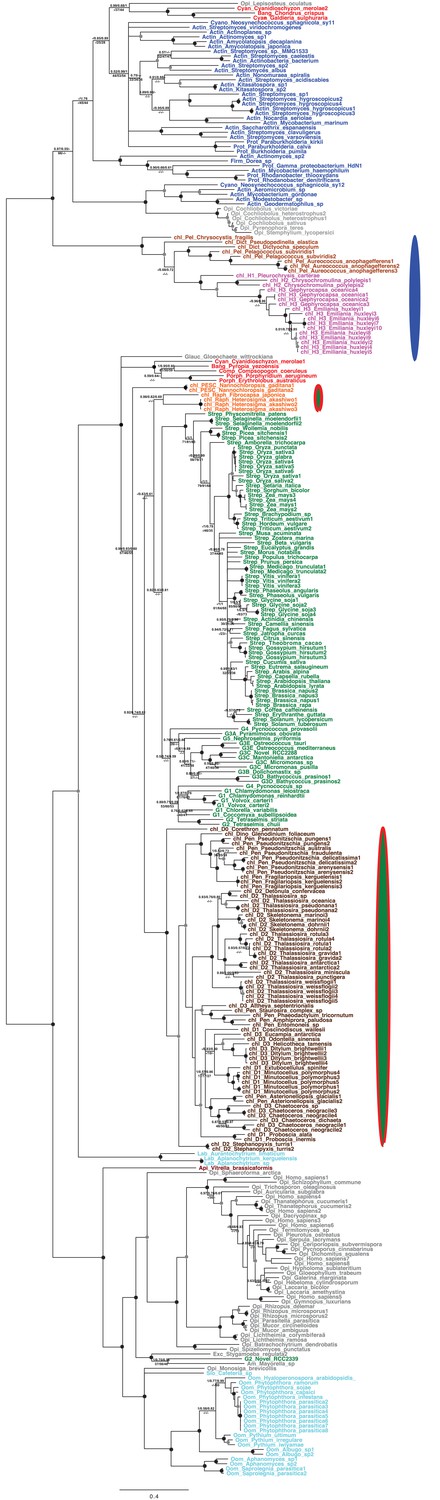
Tree of ochrophyte isopropylmalate dehydrogenase sequences.
This tree shows the consensus Bayesian phylogeny inferred for a 202 taxa x 592 aa alignment of isopropyl malate dehydrogenase sequences, shown as per Figure 2—figure supplement 2. Two ochrophyte plastid isoforms are shown with coloured ellipses: an isoform of green algal origin restricted to diatoms and hypogyristea (green ellipse), and a red algal isoform found in diatoms, pelagophytes and xanthophytes (red ellipse).
Figure 5—figure supplement 6
Tree of ochrophyte shikimate kinase sequences.
This figure shows the consensus Bayesian topology inferred for a 127 taxa x 262 aa alignment of shikimate kinase sequences. The WAG Bayesian topology was excluded from the consensus due to non-convergence between the two chains, hence the tree is produced from the consensus of GTR and Jones substitution matrices only, but is otherwise presented identically to Figure 2—figure supplement 2. Two distinct ochrophyte plastid isoforms are shown with coloured ellipses: a green algal isoform conserved across diatoms, dictyochophytes and raphidophytes (red ellipse), and a pelagophyte isoform of uncertain origin (grey ellipse).
Figure 5—figure supplement 7
KOG classes associated with different categories of HPPGs.
These pie charts profile the distribution of different KOG classes across (i) all HPPGs except for those with general function predictions only, or without any clear KOG function, (ii) the same, but restricted to ancestral HPPGs and (iii) the same, for ancestral HPPGs of unambiguous red, green, prokaryotic and aplastidic stramenopile origin as identified by combined BLAST top hit and single-gene tree analysis. KOG classes that occur at elevated frequency in the ancestral HPPG dataset compared to the complete HPPG dataset, and one KOG class enriched in the prokaryotic HPPG dataset compared to the ancestral HPPG dataset (chi-squared test, p<0.05) are labelled with horizontal arrows.
Figure 5—figure supplement 8

Coregulation of genes incorporated into HPPGs of different origin in the model diatom Phaeodactylum tricornutum.
(Panel A) shows boxplots of the correlation coefficients between the expression profiles of genes encoding members of ancestral HPPGs of red algal origin (i), green algal origin (ii), prokaryotic origin (iii) or host origin (iv), compared to genes encoding members of other HPPGs. Each HPPG is separated by evolutionary origin on the x-axis of each graph: for example, the box labelled ‘green algae’ on the ‘red algae’ graph shows the correlation coefficients between genes encoding members of ancestral HPPGs of red origin, and ancestral HPPGs of green origin. (Panel B) shows the P value statistics of mean separation calculated when comparing genes encoding members of ancestral HPPGs of the same origin (shown by row) to members of ancestral HPPGs of different origin (shown by column). For example, the intersect between the ‘red’ row and ‘green’ column shows the difference in mean correlation coefficient between pairs of genes that both encode members of ancestral HPPGs of red origin, and gene pairs of which one encodes an ancestral HPPG member of red origin, and the other an ancestral HPPG member of green origin. None of the P values calculated are significant, i.e. there are no categories of ancestral HPPG in which the internal correlation coefficients of gene expression are any different to those observed across the dataset as a whole.
Figure 5—figure supplement 9

Coregulation of genes incorporated into HPPGs of different origin in the model diatom Thalassiosira pseudonana.
Boxplots (Panel A) and P value statistics (Panel B) are shown as per Figure 5—figure supplement 8. Only two of the correlation value ANOVA tests (comparison of red-red and red-host correlations, and prokaryotic-prokaryotic and prokaryotic-host correlations, shaded in green) reveal a significantly higher correlation coefficient between pairs of genes encoding members of HPPG of the same evolutionary origin than pairs of genes encoding members of HPPGs with different evolutionary origins. These differences most probably reflect the extremely weak correlation coefficients associated with genes encoding HPPGs of host origin to all other genes considered (compare ‘Host’ category on boxplots i, ii and iii to all other categories); however, detailed comparison of the correlation values between genes encoding ancestral HPPGs of host origin and genes encoding ancestral HPPGs of different evolutionary origin (Panel A, boxplot iv; Panel B, bottom row) reveals no specific difference in the pairwise correlation values observed between genes encoding ancestral HPPGs of host origin, and genes encoding ancestral HPPGs of all other origins within the dataset.
Figure 6 with 3 supplements
Origins of chimeric proteins in the ochrophyte plastid.
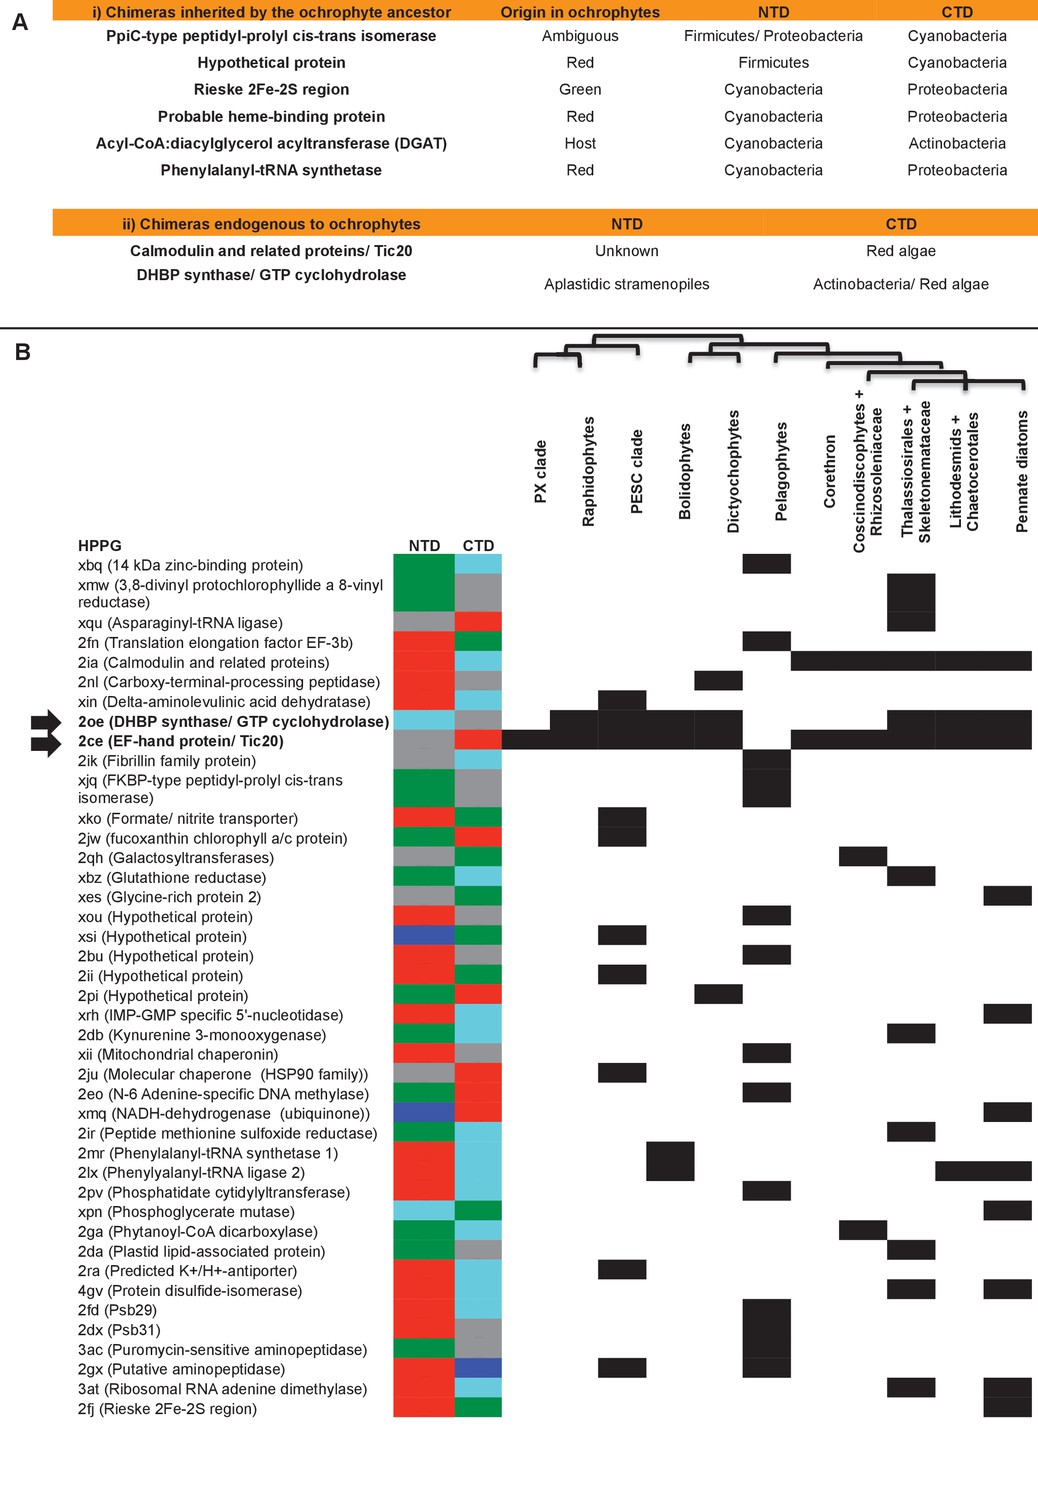
(Panel A) tabulates eight ancestral HPPGs containing domains of cyanobacterial and non-cyanobacterial origin, as previously identified (Méheust et al., 2016) that were inherited by the ochrophyte plastid, and two chimeric ancestral HPPGs which are probably of specific ochrophyte origin. (Panel B) shows a complete tabulated list of all ancestral HPPGs (listed by identifier, with the predicted function given in brackets) in which at least one chimerism event between domains of red algal, green algal, aplastidic stramenopile, other eukaryotic, and prokaryotic origin was detected. In each case, the inferred evolutionary origins of the N-terminal (NTD) and C-terminal (CTD) components of the chimeric members of the HPPG are given, according to the colour key within the figure, followed by its distribution across all ochrophyte lineages. The two chimeric HPPGs inferred to have arisen in the ochrophyte ancestor are shown in bold text and labelled with horizontal arrows. Exemplar alignments and phylogenies of the two chimeric proteins inferred to have originated in the ochrophyte ancestor are shown in Figure 6—figure supplements 1–3.
Figure 6—figure supplement 1
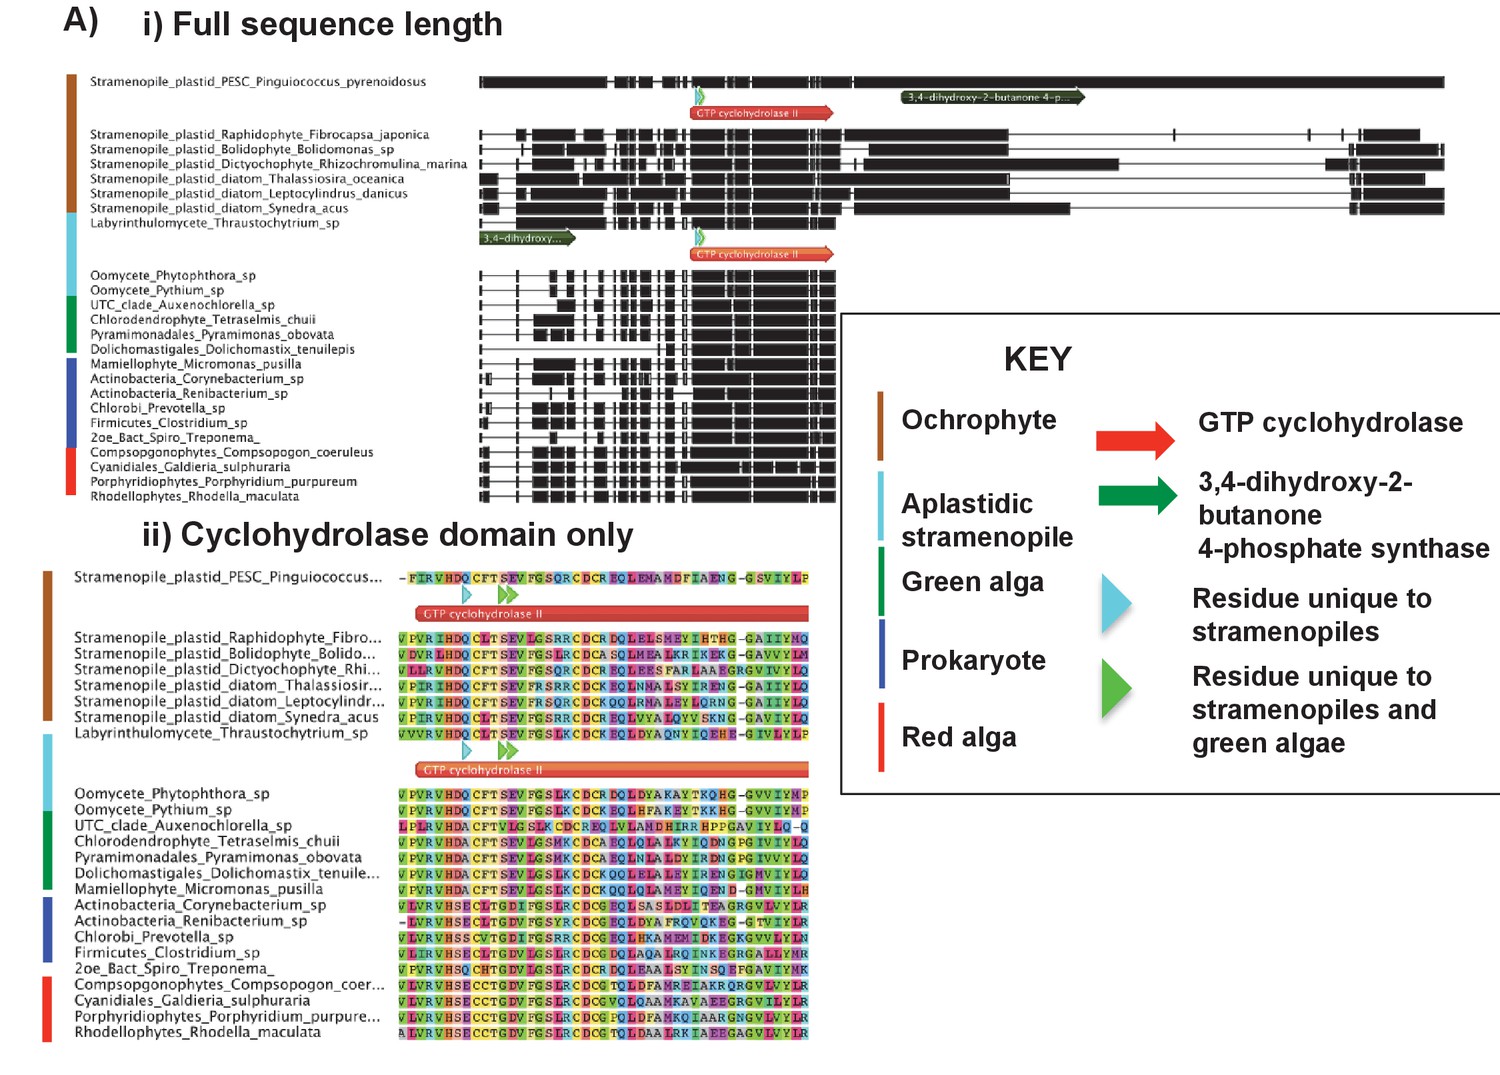
Alignments of an ochrophyte-specific riboflavin biosynthesis fusion protein.
(Panel A) shows alignments of the full length (i) and cyclohydrolase domain only (ii) of a plastid-targeted GTP cyclohydrolase II/3,4-dihydroxy-2-butanone 4-phosphate synthase protein conserved across the ochrophytes. Coloured bars adjacent to each sequence correspond to the evolutionary origin of the sequence. The cyclohydrolase domain of the ochrophyte protein is positioned in the N-terminal region, and the synthase domain in the C-terminal region. Three uniquely shared residues at the N-terminus of the cyclohydrolase domain confirm that it has been inherited from the aplastidic stramenopile ancestor of the ochrophytes.
Figure 6—figure supplement 2

Origins of ochrophyte plastid 3,4-dihydroxy-2-butanone 4- phosphate synthase.
This figure shows the consensus Bayesian topology inferred for a 22 taxa x 206 aa alignment of 3,4-dihydroxy-2-butanone 4-phosphate synthase domains from different lineages, inferred using Jones and WAG matrices, and shown as per Figure 2—figure supplement 2. The ochrophyte plastid isoforms branch with red algal and actinobacterial sequences.
Figure 6—figure supplement 3
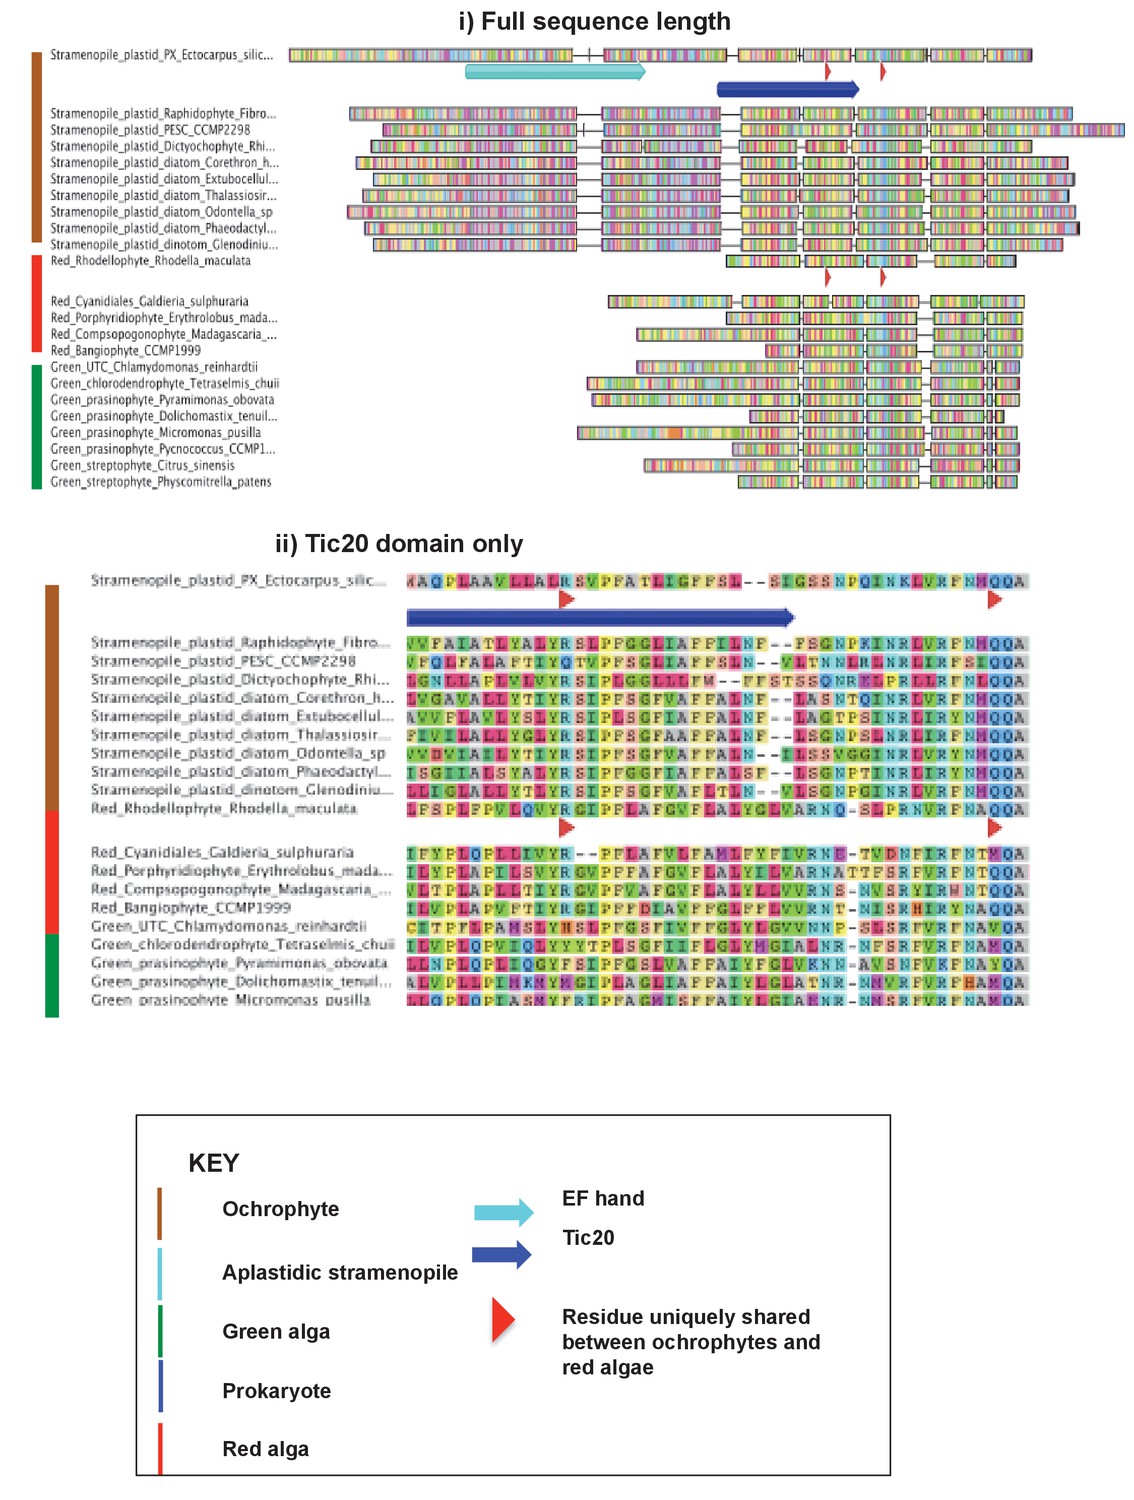
An ochrophyte-specific Tic20 fusion protein.
This figure shows alignments of the full length (i) and conserved region only (ii) of plastid Tic20 sequences, displayed as per Figure —figure supplement 1.
Figure 7 with 2 supplements
Ancient and bidirectional connections between the ochrophyte plastid and mitochondria.
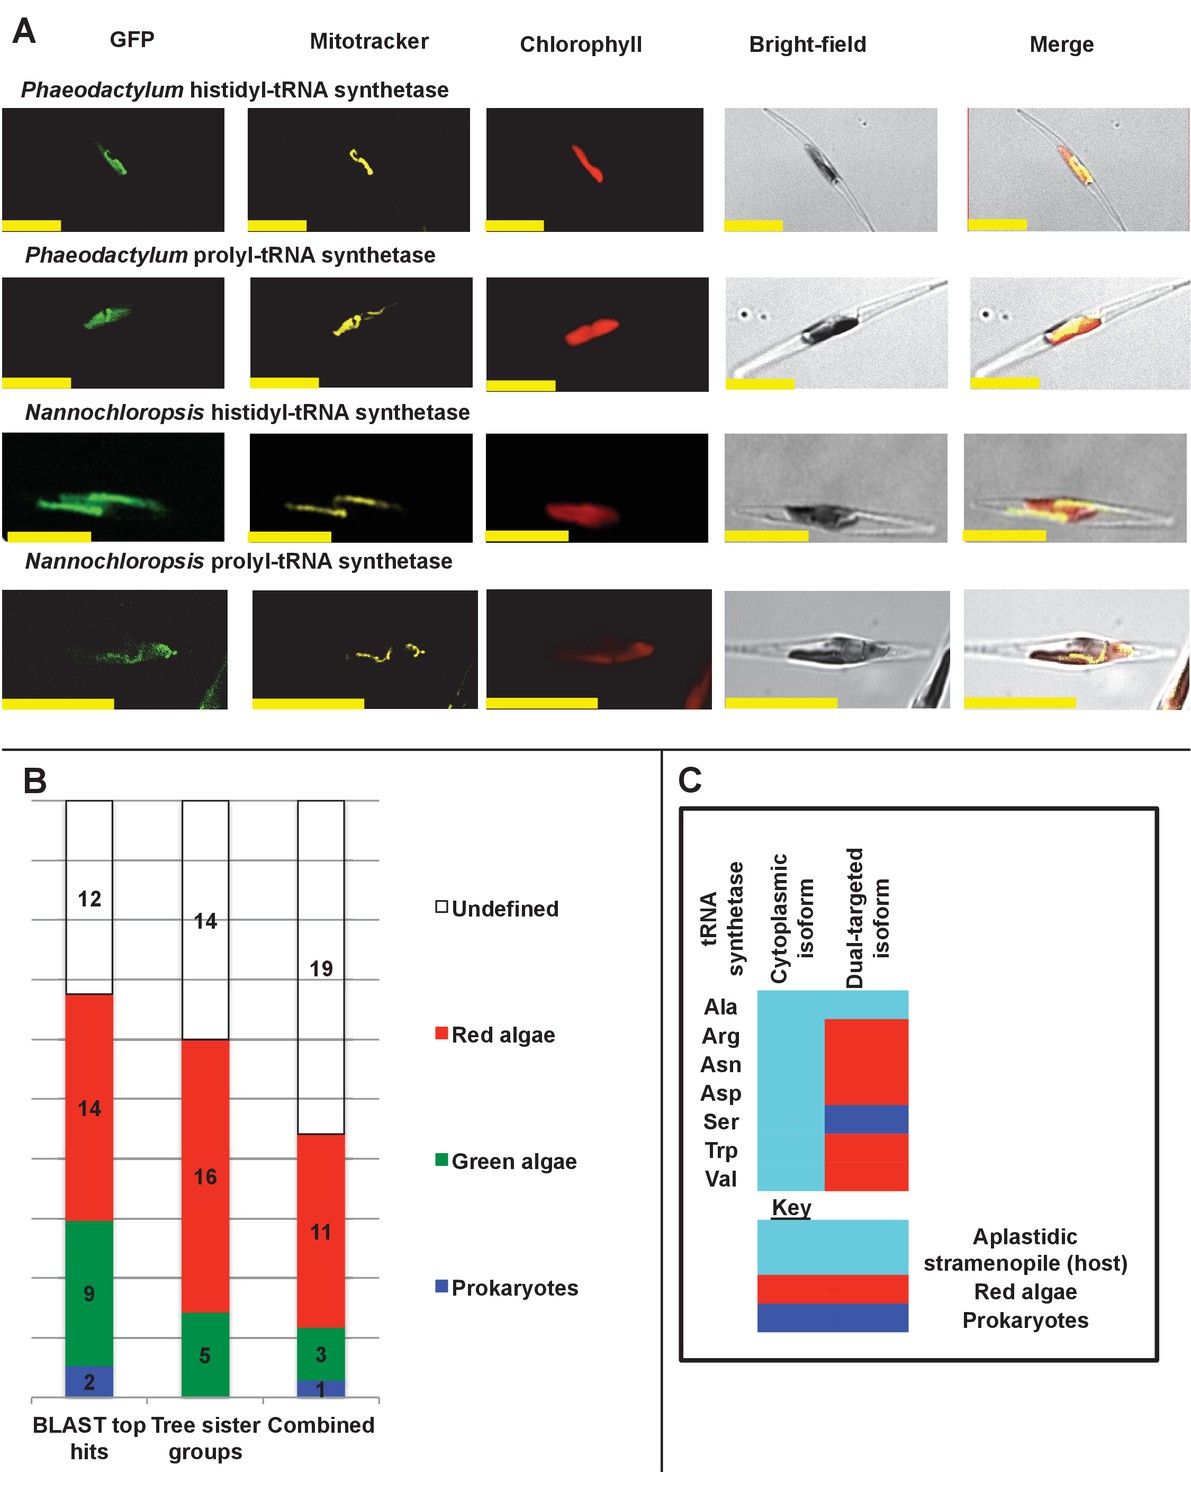
(Panel A) shows Mitotracker-Orange stained P. tricornutum lines expressing GFP fusion constructs for the N-terminal regions of histidyl- and prolyl-tRNA synthetase sequences from P. tricornutum and the eustigmatophyte Nannochloropsis gaditana. Targeting constructs for an additional four dual-targeted proteins in P. tricornutum and one dual-targeted protein in G. foliaceum, alongside Mitotracker-negative and wild type control images, are shown in Figure 7—figure supplement 1. (Panel B) profiles the predicted evolutionary origins of the 34 ancestral dual-targeted HPPGs, as inferred by BLAST top hit and single-gene tree analysis. Data supporting the thresholds used to identify probable dual-targeted HPPGs in silico are supplied in Figure 7—figure supplement 2. (Panel C) shows seven classes of tRNA synthetase for which only two copies were inferred in the genome of the last common ochrophyte ancestor. Evolutionary origins are inferred from combined BLAST top hit and single-gene tree analysis for dual-targeted proteins, and from BLAST top hit analysis alone for cytoplasmic proteins. In five cases the dual-targeted isoform is inferred to be of ultimate red algal origin, indicating that a protein derived from the endosymbiont has functionally replaced the endogenous host mitochondria-targeted copy.
Figure 7—figure supplement 1
Experimental verification of additional ochrophyte dual-targeted proteins.
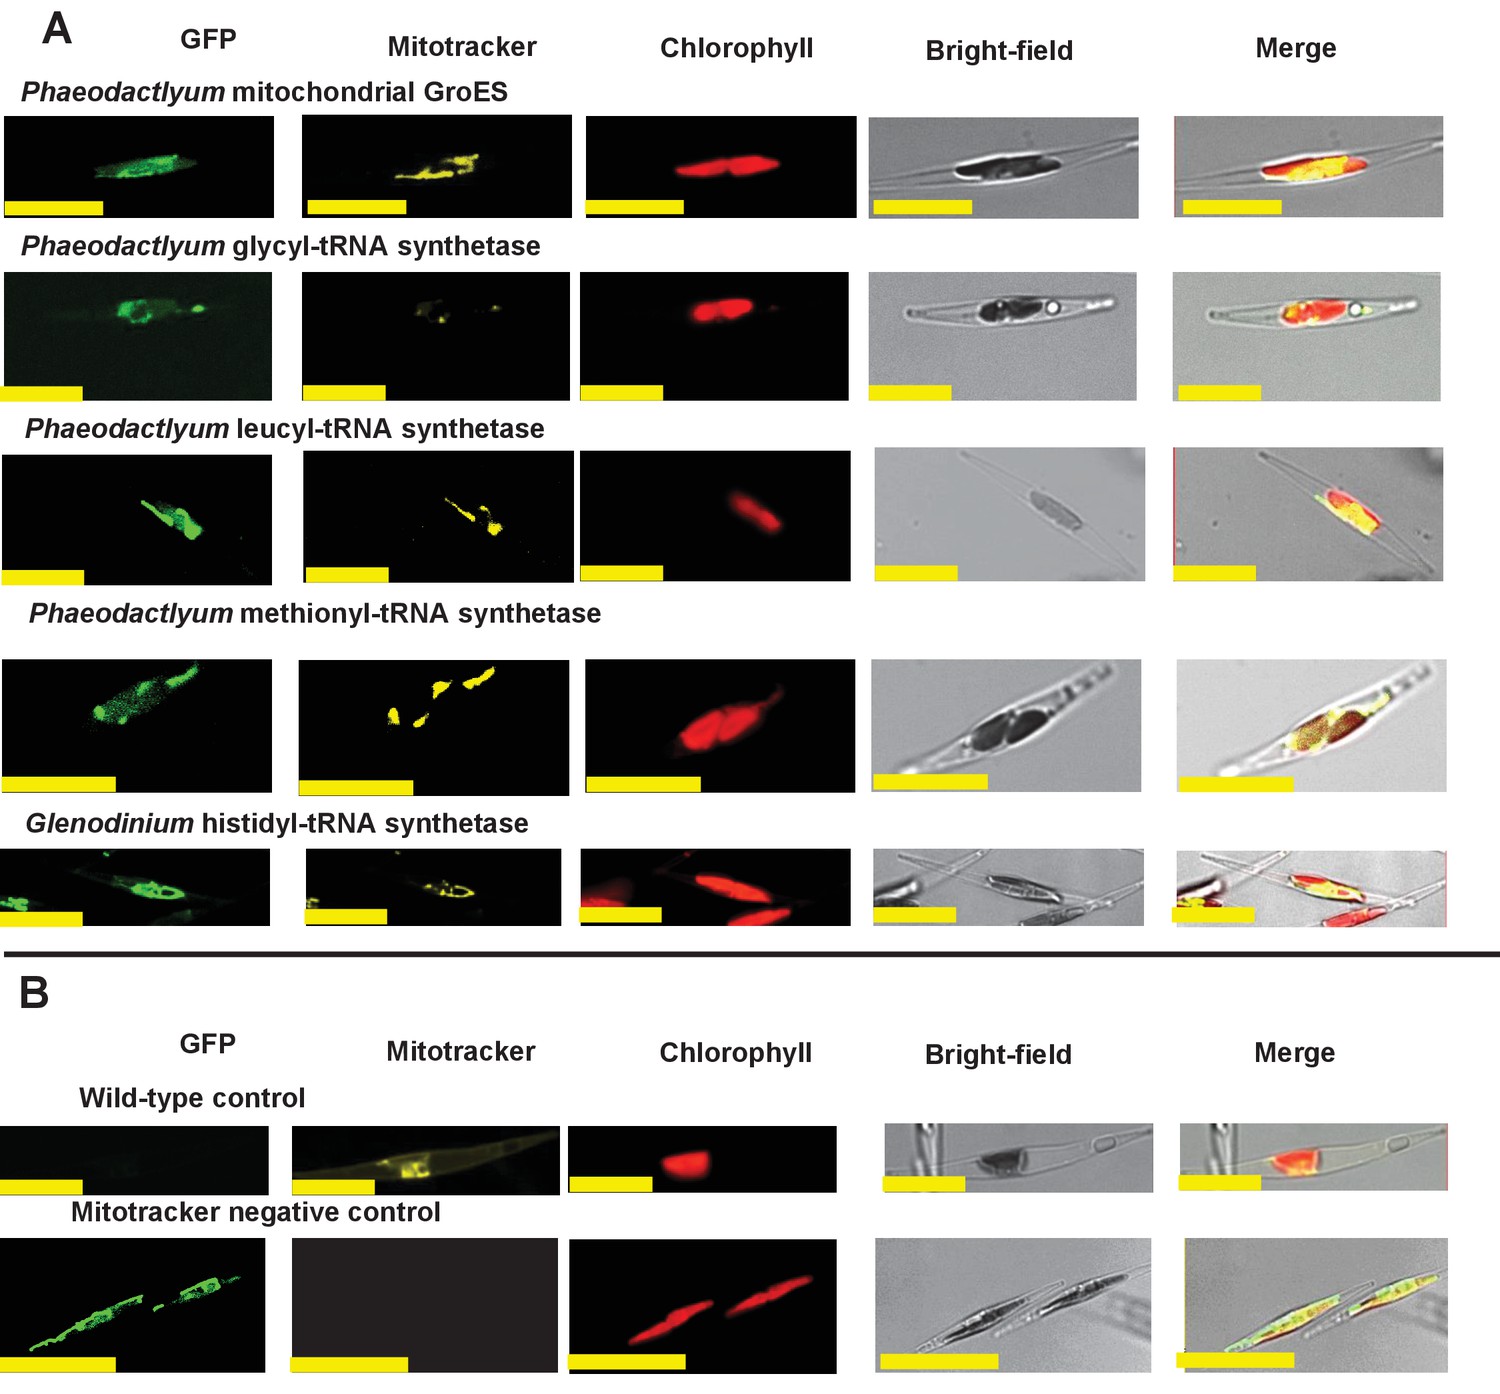
(Panel A) shows Mitotracker-orange stained Phaeodactylum tricornutum lines expressing four additional dual-targeted proteins (glycyl-, leucyl-, and methionyl-tRNA synthetases, and a predicted mitochondrial GroES-type chaperone) from Phaeodactylum tricornutum, and a dual-targeted histidyl-tRNA synthetase from Glenodinium foliaceum. (Panel B) shows control images that confirm an absence of crosstalk between GFP and Mitotracker: wild-type Phaeodactylum cells stained with Mitotracker, and cells expressing the Glenodinium histidyl-tRNA synthetase–GFP fusion construct and visualised with the Mitotracker laser and channel in the absence of Mitotracker stain.
Figure 7—figure supplement 2

Comparison of different in silico targeting prediction programmes for the identification of dual-targeted ochrophyte proteins.
(Panel A) shows Mitofates scores for ochrophyte proteins verified experimentally to be dual-targeted in this and a previous study (Gile et al., 2015). (Panel B) shows Mitofates scores for all ochrophyte proteins for which a subcellular localisation has been identified in previous studies. The red lines in each graph show the Mitofates default cutoff (0.385) and the green lines indicate our chosen cutoff (0.35). (Panel C) compares different in silico targeting prediction algorithms with respect to predicted mitochondrial localization by experimentally validated localization. Mitofates strikes the best balance between high true positives and low false positives.
Figure 8 with 6 supplements
Footprints of an ancient endosymbiosis in the haptophyte plastid proteome.
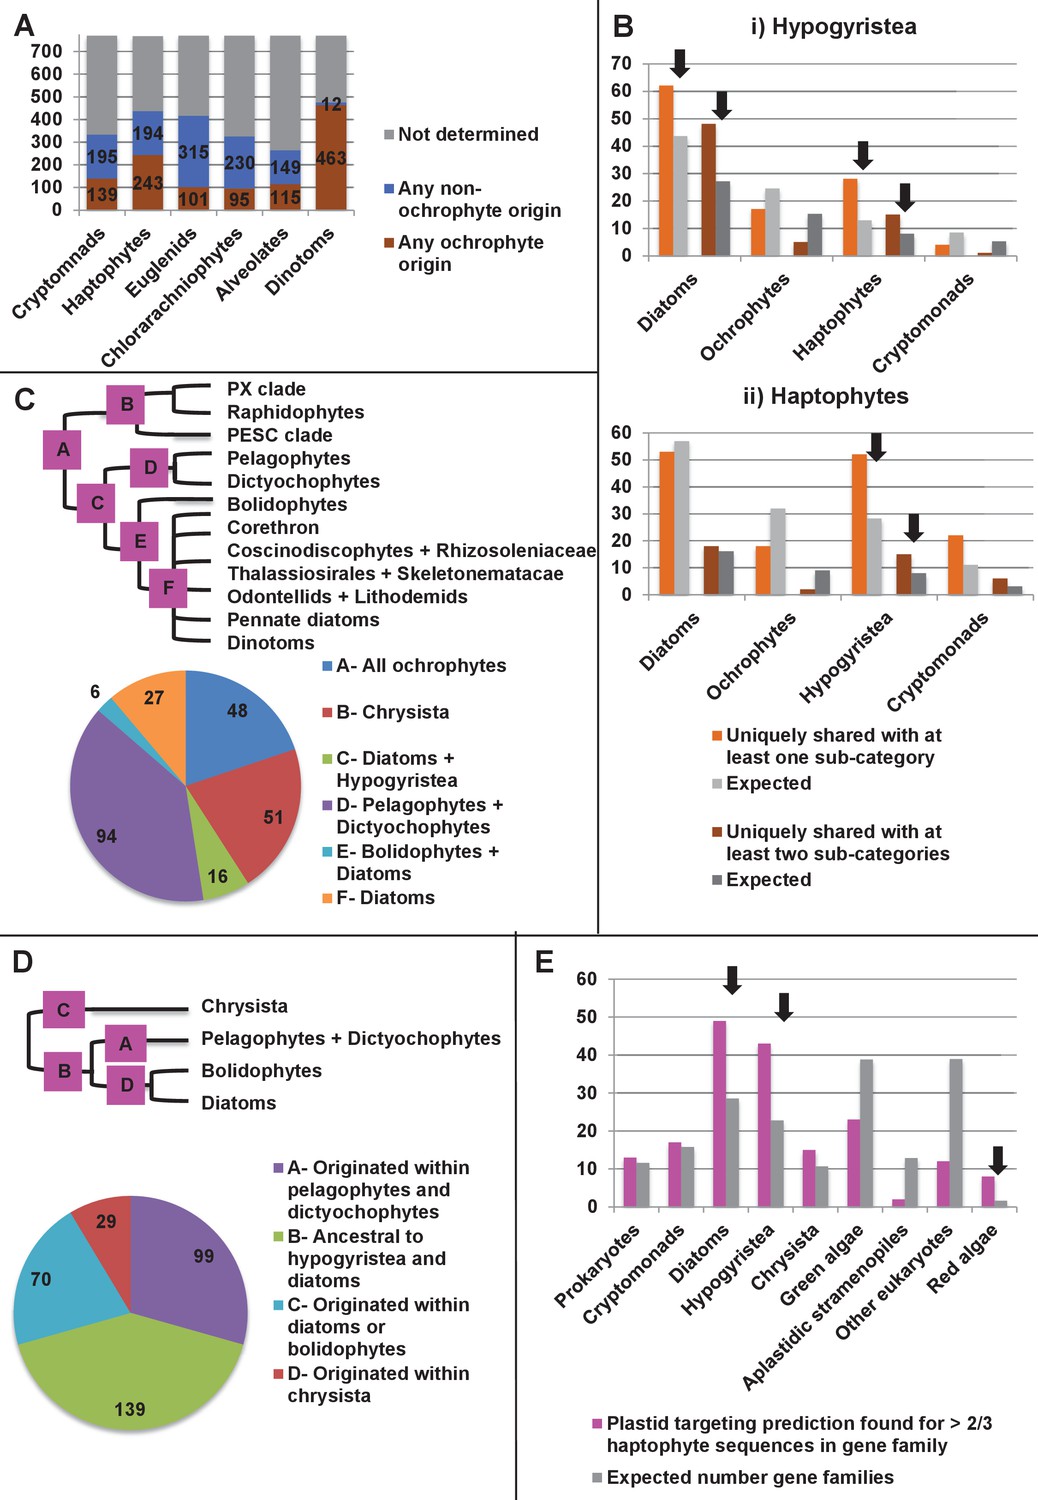
(Panel A) indicates the number of ancestral ochrophyte HPPGs that included sequences from other algal lineages in single-gene tree analyses, and whether those algal lineages branched within or external to ochrophytes. An overview of the specific origins of proteins of ochrophyte origin in each lineage is shown in Figure 8—figure supplement 1. (Panel B) compares the number of ASAFind-derived HPPGs that are uniquely shared between hypogyristea (i) or haptophytes (ii) and one other CASH lineage. Values are given for proteins found in a majority of sub-categories in hypogyristea/ haptophytes and at least one sub-category from only one other lineage (light bars), and proteins found in a majority of sub-categories in hypogyristea/ haptophytes and a majority of sub-categories from only one other lineage (dark bars). Values that are significantly greater than would be expected through random distribution are labelled with black arrows. (Panel C) shows a schematic ochrophyte tree, with six different ancestral nodes within this tree labelled with coloured boxes, and the most probable origin point for each of the 243 haptophyte plastid-targeted proteins of probable ochrophyte origin within this tree, as inferred by inspection of the nearest ochrophyte sister-group in single-gene trees. A detailed heatmap of the ochrophyte sub-categories contained in each lineage is shown in Figure 8—figure supplement 2, and BLAST top hit analyses corresponding to each plastid-targeted protein are shown in Figure 8—figure supplement 3. (Panel D) shows the number of residues that are uniquely shared between haptophytes and each node of the ochrophyte tree for 37 genes in which there has been a clear transfer from ochrophytes to haptophytes, and entirely vertical subsequent inheritance. A similar graph, showing the earliest possible inferred origin of each uniquely shared residue, is shown in Figure 8—figure supplement 4. (Panel E) shows the number of the 12728 conserved gene families inferred to have been present in the last common haptophyte ancestor that are predicted by ASAFind to encode proteins targeted to the plastid, subdivided by probable evolutionary origin, and the number expected to be present in each category assuming a random distribution of plastid-targeted proteins across the entire dataset, independent of evolutionary origin. Evolutionary categories of proteins found to be significantly more likely (chi-squared test, p=0.05) to encode plastid-targeted proteins than would be expected by random distribution are labelled with black arrows. The evolutionary origins of the ancestral gene families are shown in Figure 8—figure supplement 5.
Figure 8—figure supplement 1
Origin of proteins of ochrophyte origin in different CASH lineages.
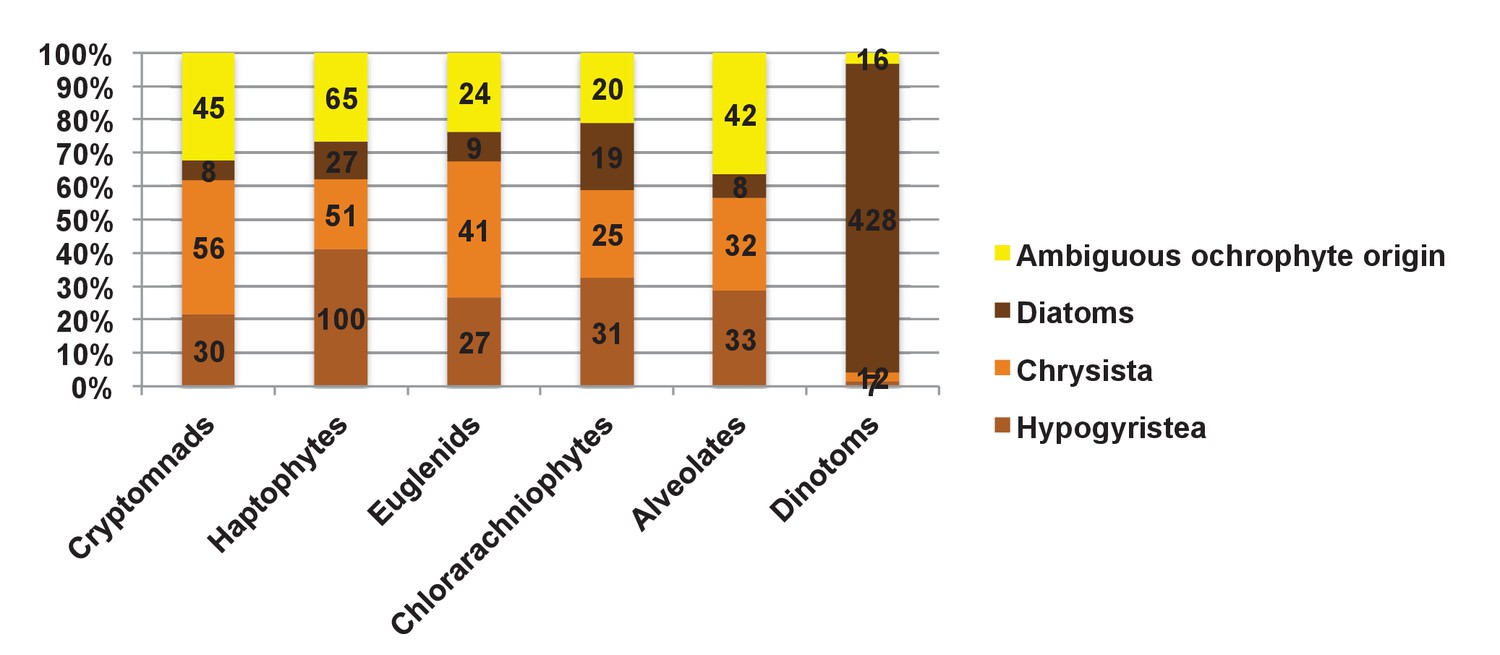
This figure profiles the evolutionary origins of proteins inferred by single-gene phylogenetic analysis to have been transferred from the ochrophytes into other lineages that have acquired plastids through secondary or more complex endosymbioses. Proteins are divided into the three major ochrophyte lineages (i.e. diatoms, chrysista, and hypogyristea); all remaining proteins (inferred to have been acquired from an ancestor of multiple ochrophyte lineages, or of ambiguous but clearly ochrophyte origin) are grouped as a final category. The haptophyte proteins that could be attributed to a specific ochrophyte lineage are particularly skewed (100/178 proteins) to origins within the hypogyristea.
Figure 8—figure supplement 2

Heatmaps of nearest sister-groups to haptophytes in ancestral ochrophyte HPPG trees.
This figure shows the specific ochrophyte lineages implicated in the origin of haptophyte plastid-targeted proteins, as inferred from the nearest ochrophyte sister-groups to haptophytes in trees of 242 haptophyte proteins of probable ochrophyte origin from combined BLAST top hit and single-gene tree analysis. At the top a schematic tree diagram of the ochrophytes is shown as per Figure 1, with six major nodes in ochrophyte evolution labelled with coloured boxes. The heatmap below shows the specific distribution of sister-groups in each tree, shown as per Figure 4—figure supplement 2.
Figure 8—figure supplement 3
Internal evolutionary affinities of haptophyte plastid-targeted proteins incorporated into ancestral ochrophyte HPPGs.
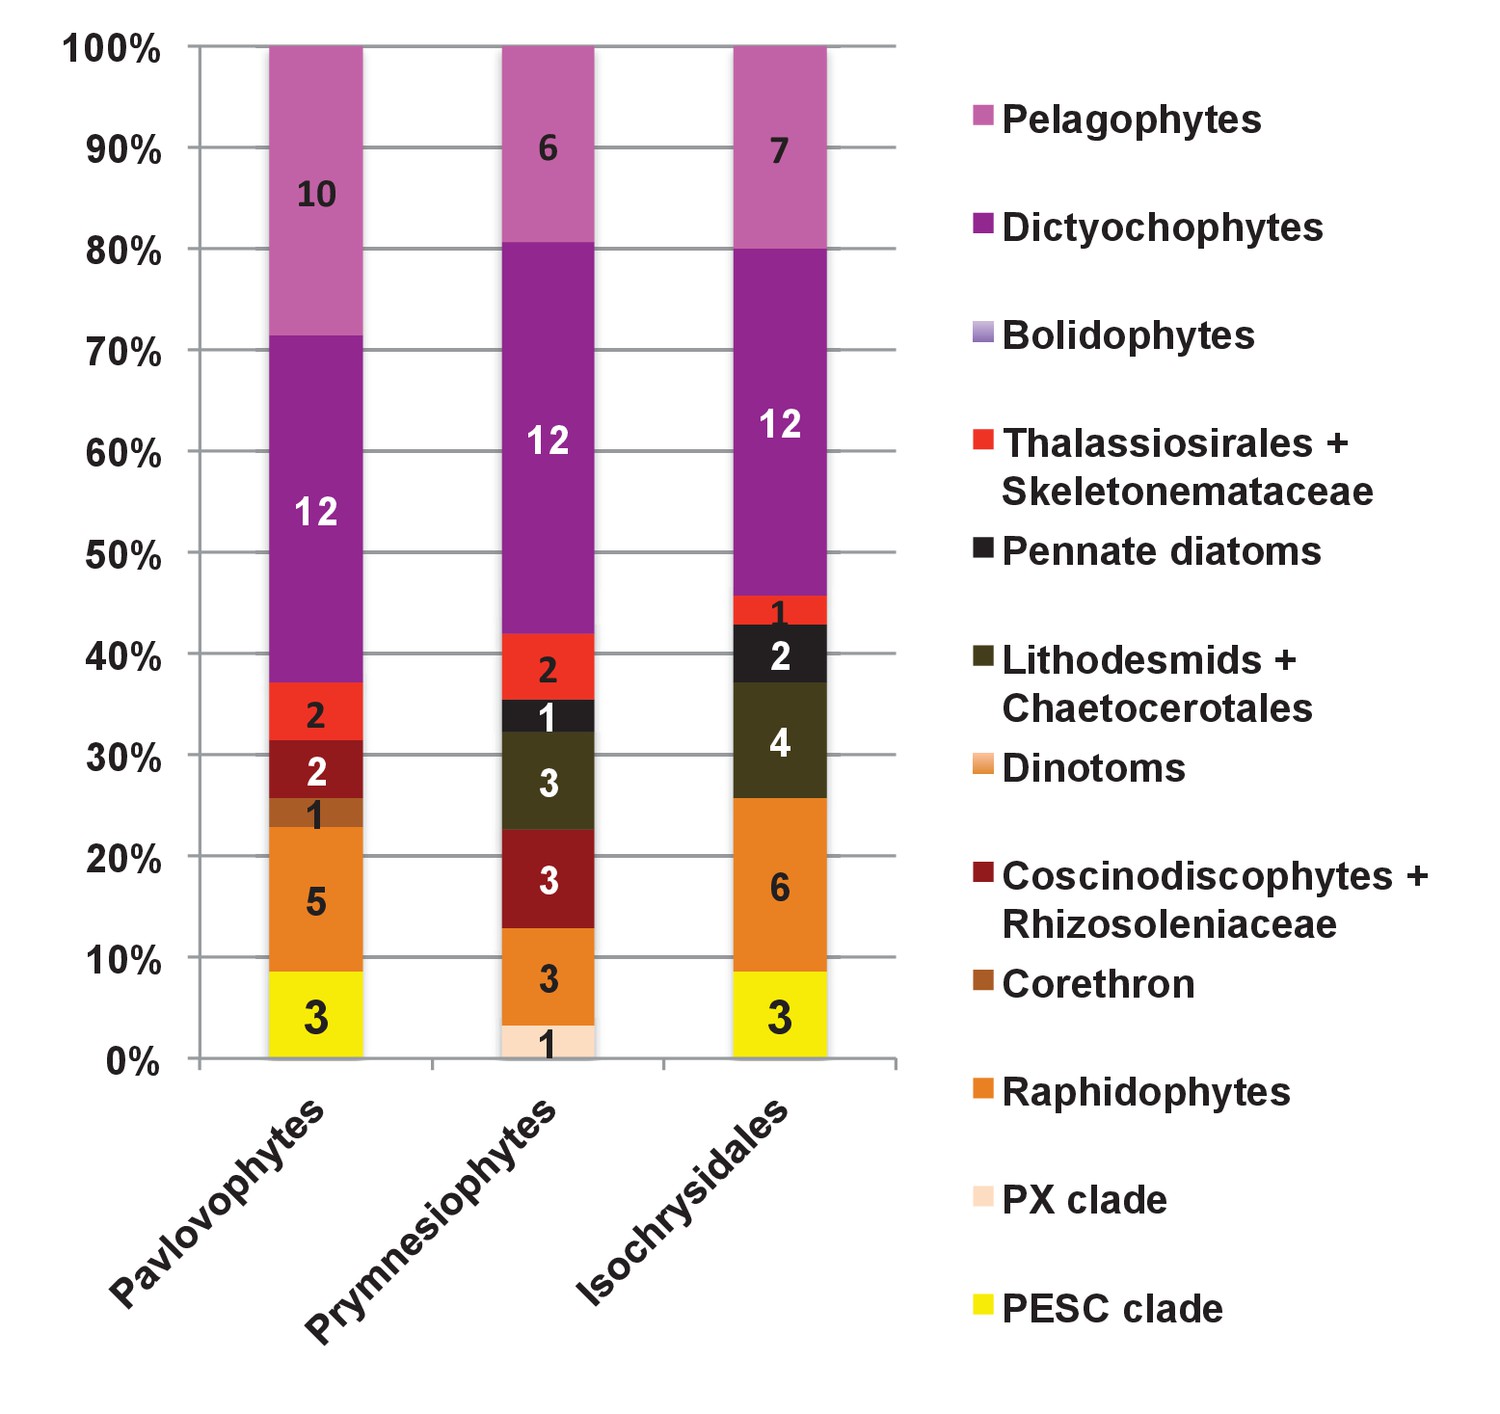
This figure profiles the evolutionary origins of haptophyte plastid-targeted proteins incorporated into ancestral ochrophyte HPPGs by BLAST top hit analysis. Separate values are provided for query sequences from each of the three haptophyte sub-categories (pavlovophytes, prymnesiophytes, and isochrysidales) considered within the analysis. Only sequences for which a consistent origin could be identified by both BLAST top hit and single-gene tree analysis are included. For each haptophyte lineage >50% of the sequences verified by combined analysis to be of a specific ochrophyte origin have either pelagophyte or dictyochophyte top hits.
Figure 8—figure supplement 4
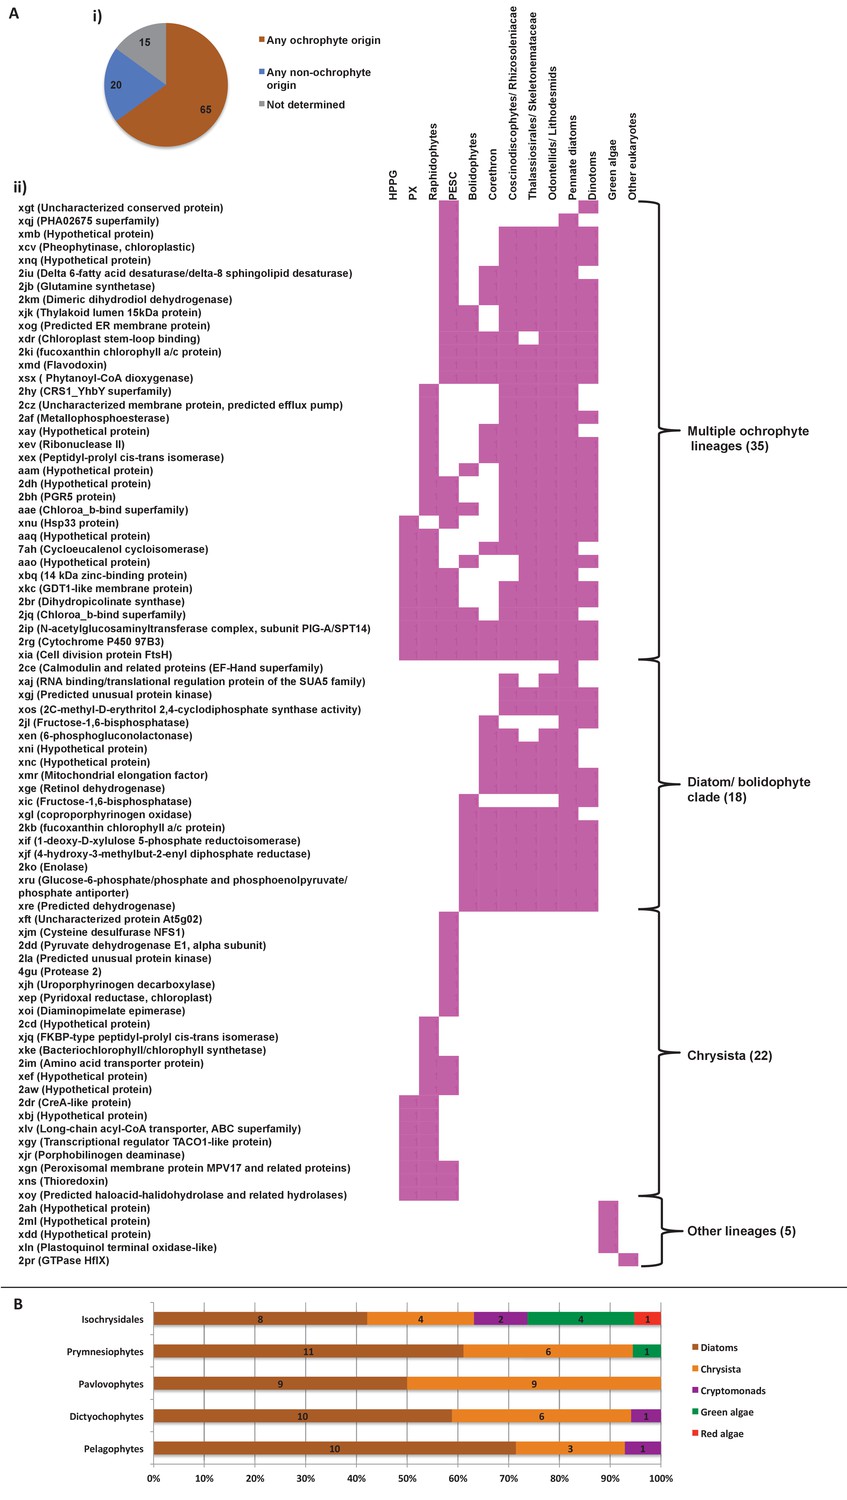
Evidence for gene transfer from pelagophytes and dictyochophytes into haptophytes.
(Panel A) shows the next deepest sister groups identified for haptophyte proteins of hypogyristean origin in single-gene trees. The pie chart (i) compares the number of single-gene trees in which the combined clade of haptophyte and hypogyristean proteins resolves within a larger clade comprising the ochrophyte HPPG, compared to the number that resolves in external positions, either with other lineages or as a sister-group to all other sequences within the HPPG clade. Sequences for which no clear next deepest sister group affinity could be identified are listed as ‘not determined’. The heatmap (ii) shows the specific sister-group sequences associated with 65 HPPGs in which the haptophyte sequences specifically resolve with the pelagophyte/dictyochophyte clade and for which a clear internal or external position for the haptophyte/ hypogyristean group relative to the remaining ochrophyte HPPG clade could be identified. Both analyses indicate a clear bias for haptophyte sequences branching within a deeper ochrophyte clade, not just restricted to the immediate sister-groups. (Panel B) tabulates the BLAST next best hits for haptophyte sequences for which a phylogenetically consistent (>3 consecutive top hits) top hit to hypogyristea could be identified, and pelagophyte/dictyochophyte sequences for which a phylogenetically consistent top hit to haptophytes could be identified. In each case either the largest number of sequences, or (in the case of pavlovophytes) the joint largest number of sequences for which a phylogenetically consistent next best hit could be identified resolved with diatoms, indicating that these sequences were probably present in the common ancestor of diatoms and hypogyristea, and subsequently transferred to the haptophytes.
Figure 8—figure supplement 5
Earliest possible origin points of uniquely conserved sites in haptophyte plastid-targeted proteins.
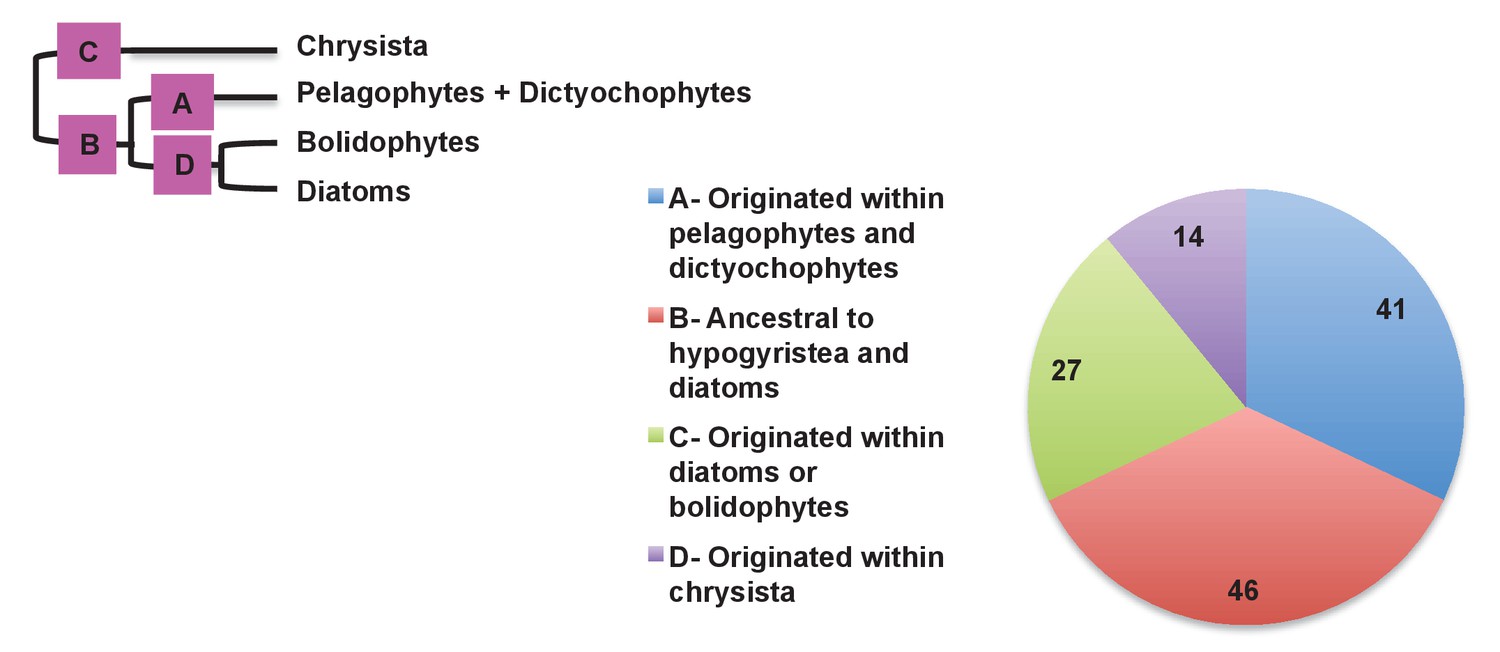
This figure shows the total number of residues that are uniquely shared between a 37 proteins that have clearly been transferred between the ochrophytes and haptophytes, and are of subsequently entirely vertical origin, assuming the earliest possible origin point for each residue (i.e. in which gapped or missing positions were interpreted as identities). 87/128 of the uniquely shared residues inferred to originate within the ochrophytes were congruent to gene transfers between the haptophytes and pelagophyte and dictyochophyte clade; of these, slightly more than half (46) are inferred to have originated in a common ancestor of all hypogyristea and diatoms, consistent with the gene transfer having occurred from an ancestor of the pelagophytes and dictyochophytes into the haptophytes, rather than the converse.
Figure 8—figure supplement 6
Evolutionary origin of ancestral haptophyte genes.
This figure shows the most likely evolutionary origin assigned by BLAST top hit analysis to the 12728 conserved gene families inferred to have been present in the last common haptophyte ancestor.
Figure 9 with 3 supplements
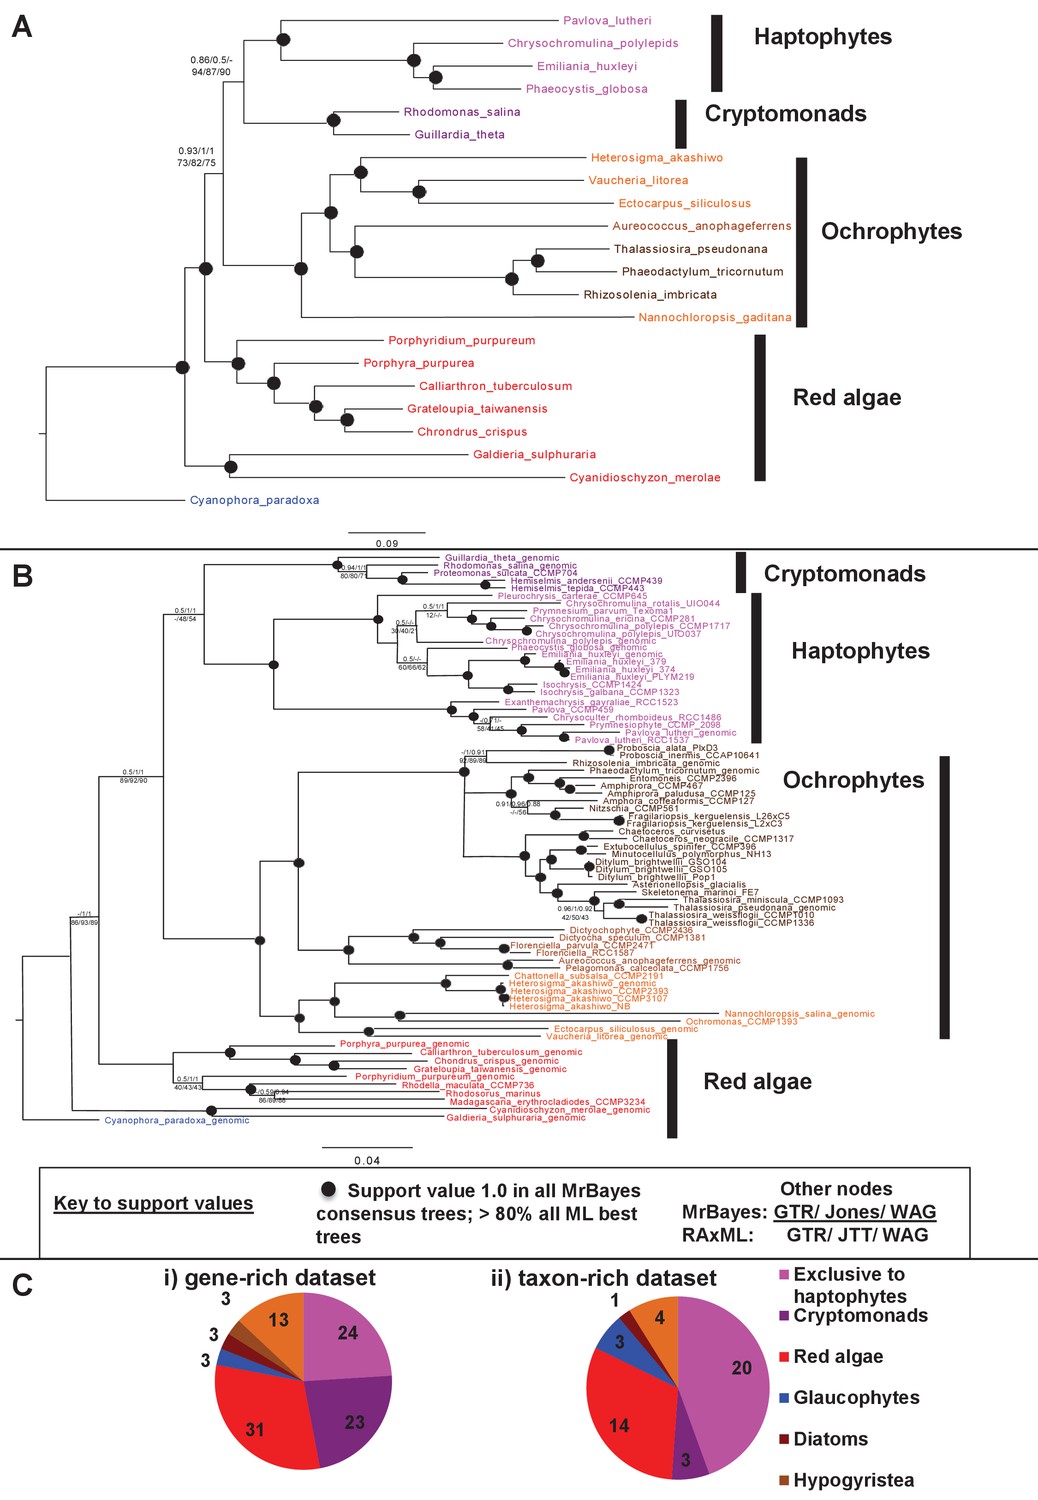
Non-ochrophyte origins of the haptophyte plastid genome.
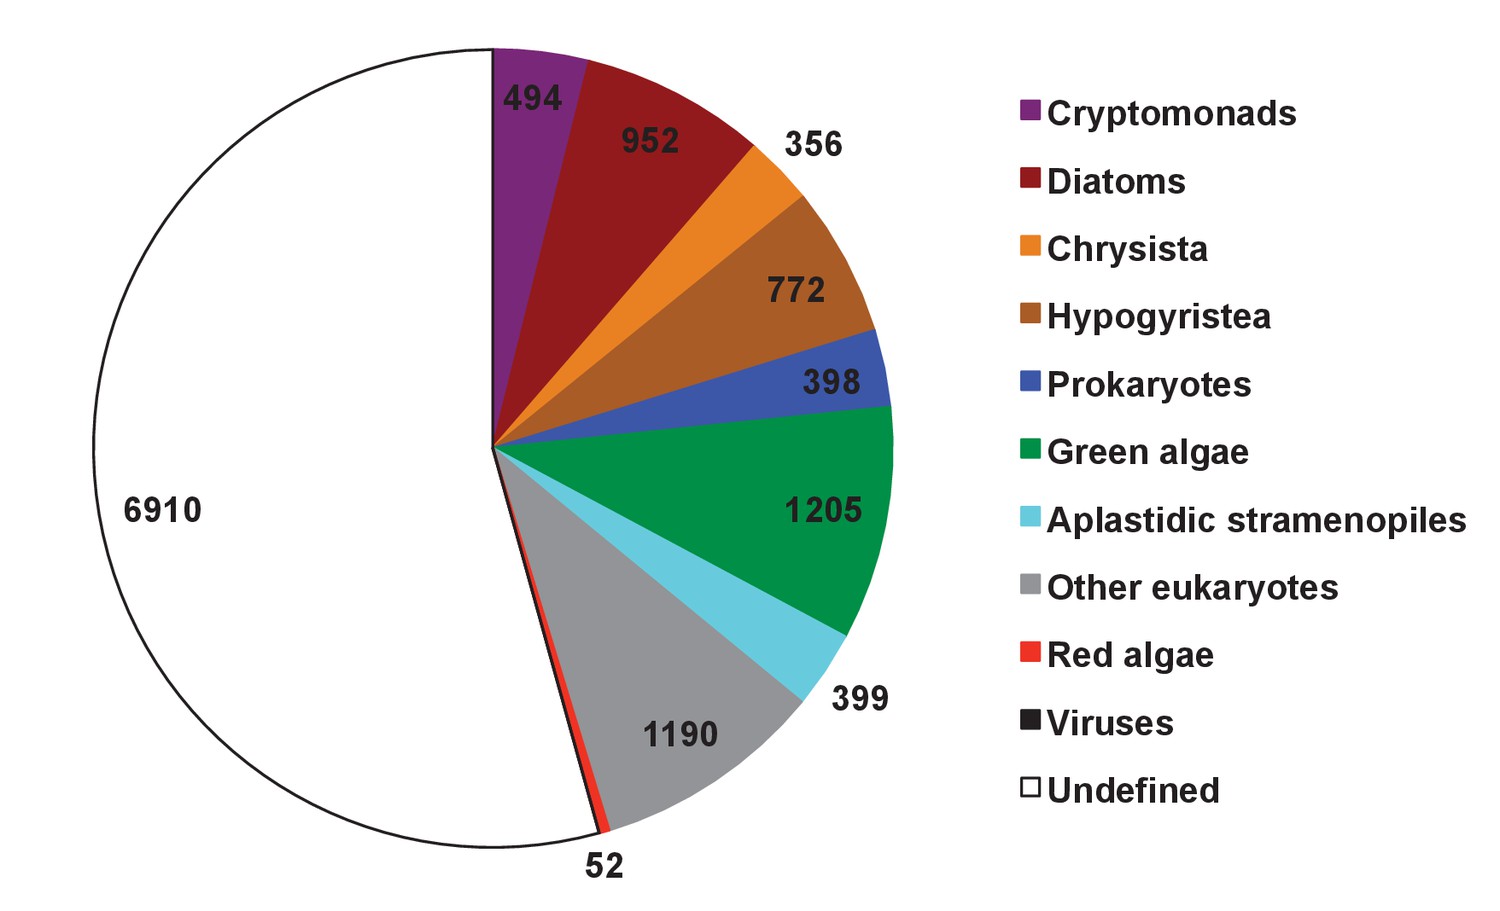
(Panels A and B), respectively, show gene-rich and taxon-rich phylogenies of plastid-encoded proteins from red algae and plastids of red algal origin with the glaucophyte Cyanophora paradoxa as outgroup. (Panel A) Combined Bayesian and Maximum Likelihood analysis (MrBayes + RAxML, GTR, JTT, WAG) of a 22 taxa x 12103 aa alignment of 54 proteins encoded by all published red and red-derived plastid genomes. (Panel B) analysis of a 75 taxa x 3737 aa alignment of 10 conserved plastid-encoded proteins detectable in a broad range of red lineage MMETSP libraries. Nodes resolve with robust support (posterior probabilities of 1 for all Bayesian trees and >80% bootstrap support for all ML trees) are shown with filled circles; individual support values for each analysis are shown for the remaining nodes are shown as detailed in the box below panel B. Alternative topology tests, the results of fast-site and clade deduction analysis for each tree, and heatmap comparisons of sister-group relationships identified for single-gene trees of each constituent gene within each concatenated alignment are shown in Figure 9—figure supplements 1–3. (Panel C) shows the number of residues in each alignment that are uniquely shared between haptophytes and only one other lineage. For the gene-rich alignment (i), which is gap-free, residues are included that are found in all four haptophyte sequences and at least one sequence from the lineage under consideration. For the taxon-rich alignment (ii), to account for the presence of gapped positions, residues are included that are found in at least 11 of the 22 haptophyte sequences and at least one sequence from the lineage under consideration.
Figure 9—figure supplement 1
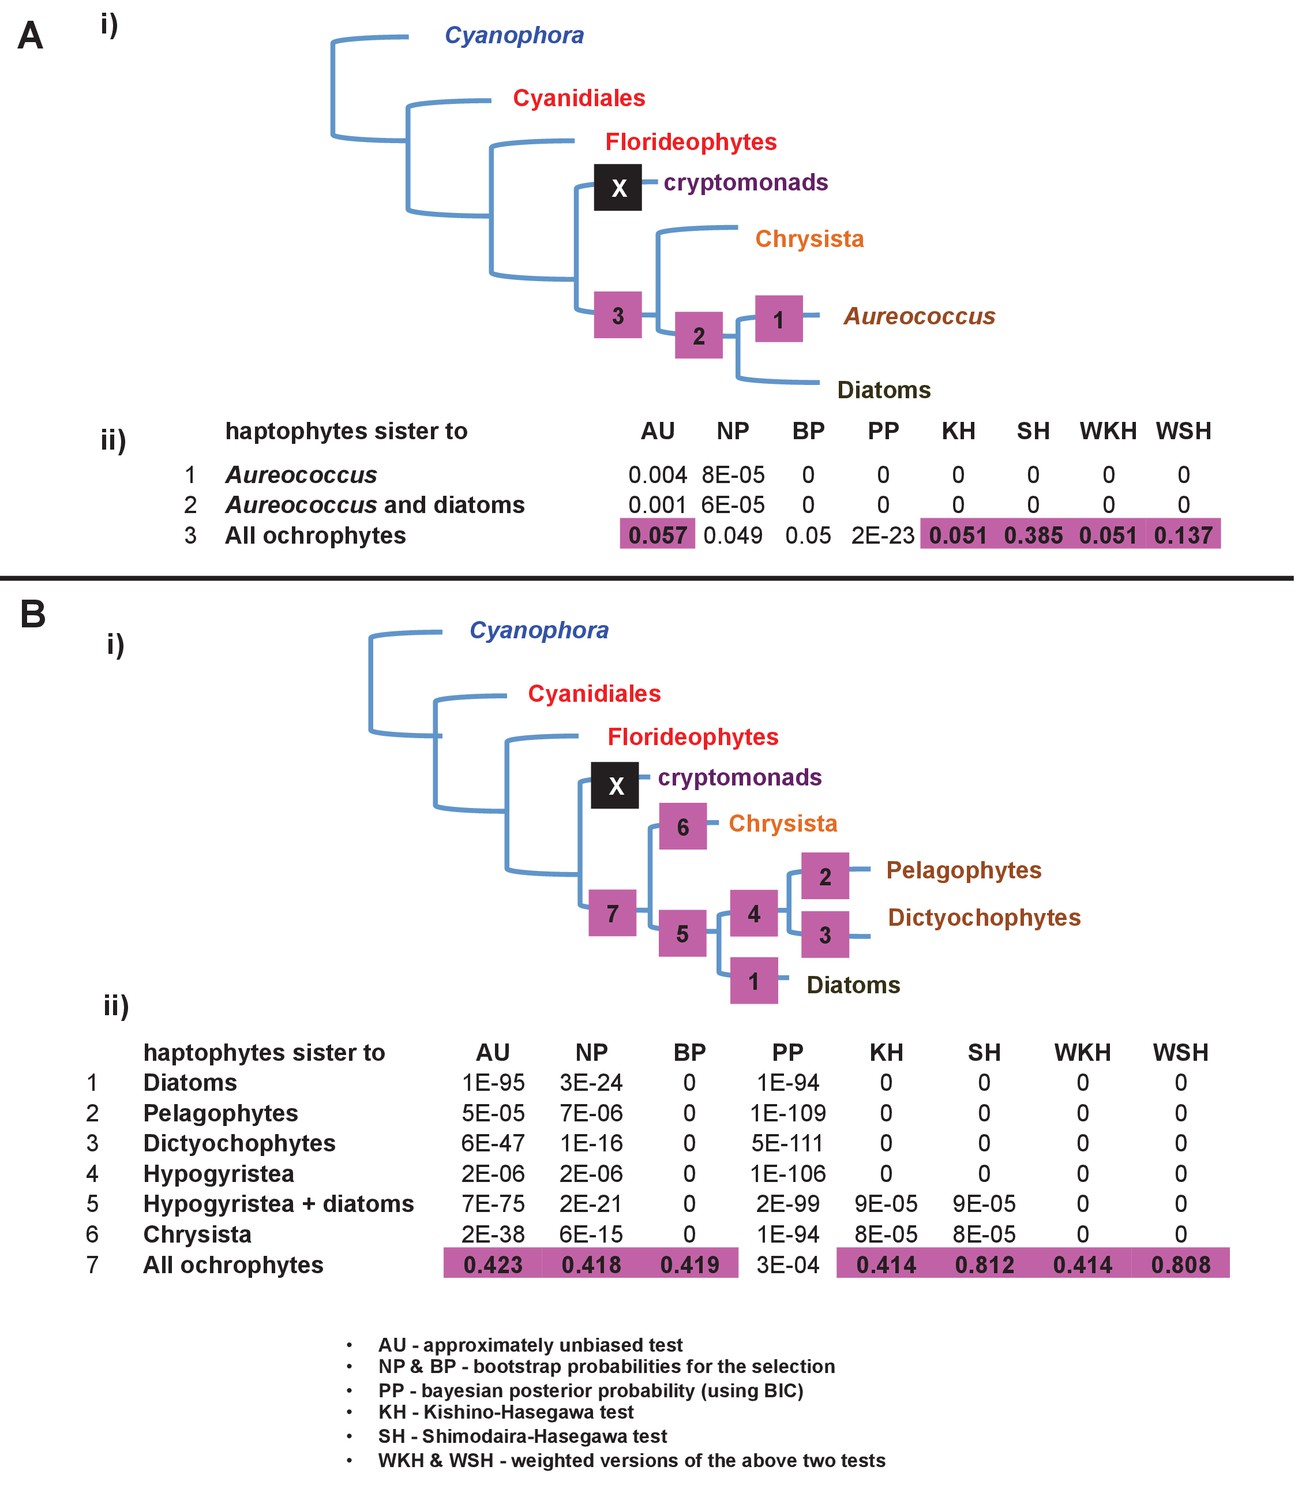
Alternative topology tests of plastid genome trees.
Tests were performed with the RAxML + JTT trees inferred for the gene-rich (panel A) and taxon-rich (panel B) plastid-encoded protein alignments. In each case, a schematic diagram of the tree topology obtained is given (i). The black box corresponds to the branch position of haptophytes in the consensus tree; alternative branching positions for the haptophyte sequences are labelled with numbered boxes. The table below (ii) lists the probabilities for each alternative position under eight different tests performed with CONSEL. Alternative positions that are not rejected by a topology test are shaded. All possible trees in which the haptophyte sequences branch within the ochrophytes are clearly rejected under all conditions, confirming that its plastid genome is of non-ochrophyte origin. The legend at the bottom of panel B gives full names for each test performed.
Figure 9—figure supplement 2
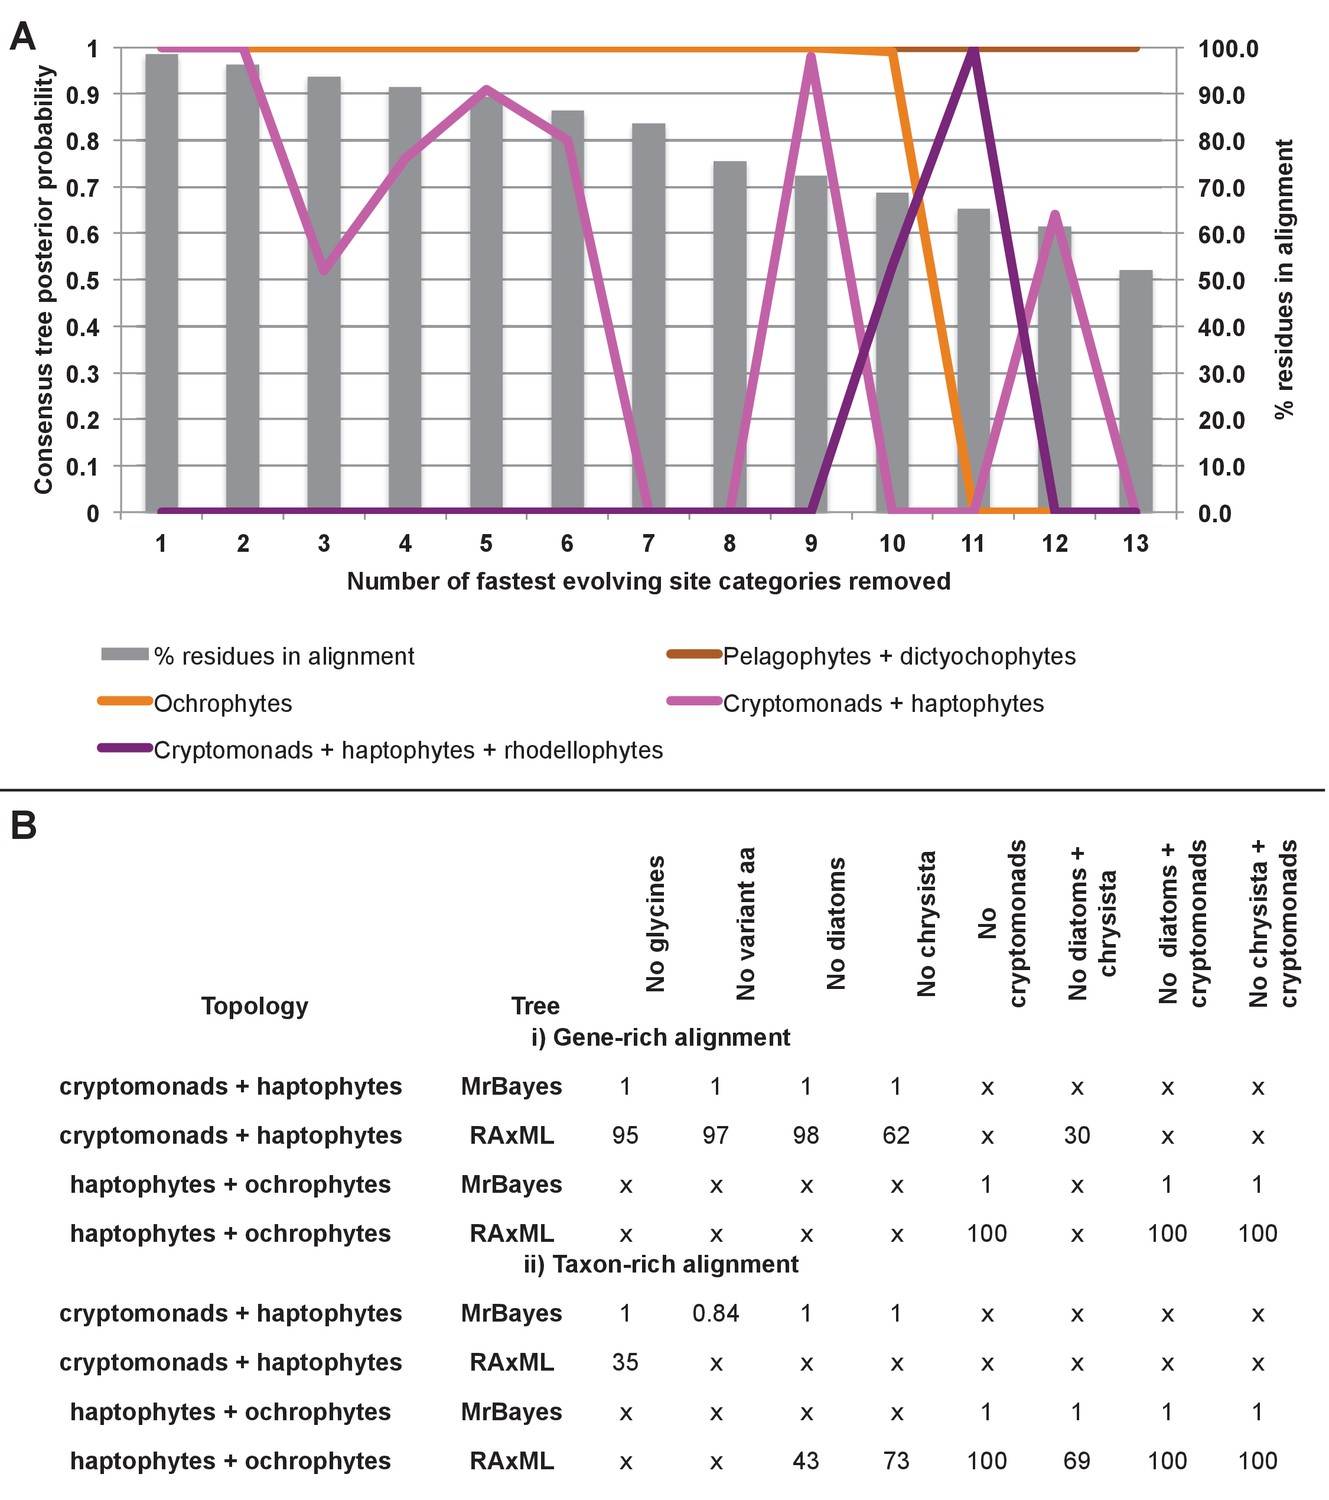
Fast site removal and clade deduction analysis of plastid genome trees.
(Panel A) shows the support values obtained for Bayesian + Jones trees inferred from modified versions of the taxon-rich plastid multigene alignment from which the 13 fastest evolving site categories had been removed for four different branching relationships pertaining to the placements of haptophyte and hypogyristean sequences. The % of residues from the original alignment retained in each modified alignment are shown with grey bars. (Panel B) tabulates the support obtained for two different evolutionary relationships (haptophytes as a sister group to all cryptomonads, and as a sister group to all ochrophytes) in gene-rich (i) and taxon-rich (ii) alignments modified to remove all amino acids that occur at different frequencies in haptophytes to ochrophyte lineages, and modified to remove individual or pairs of CASH lineages. ‘x’ indicates that the topology in question was not obtained.
Figure 9—figure supplement 3
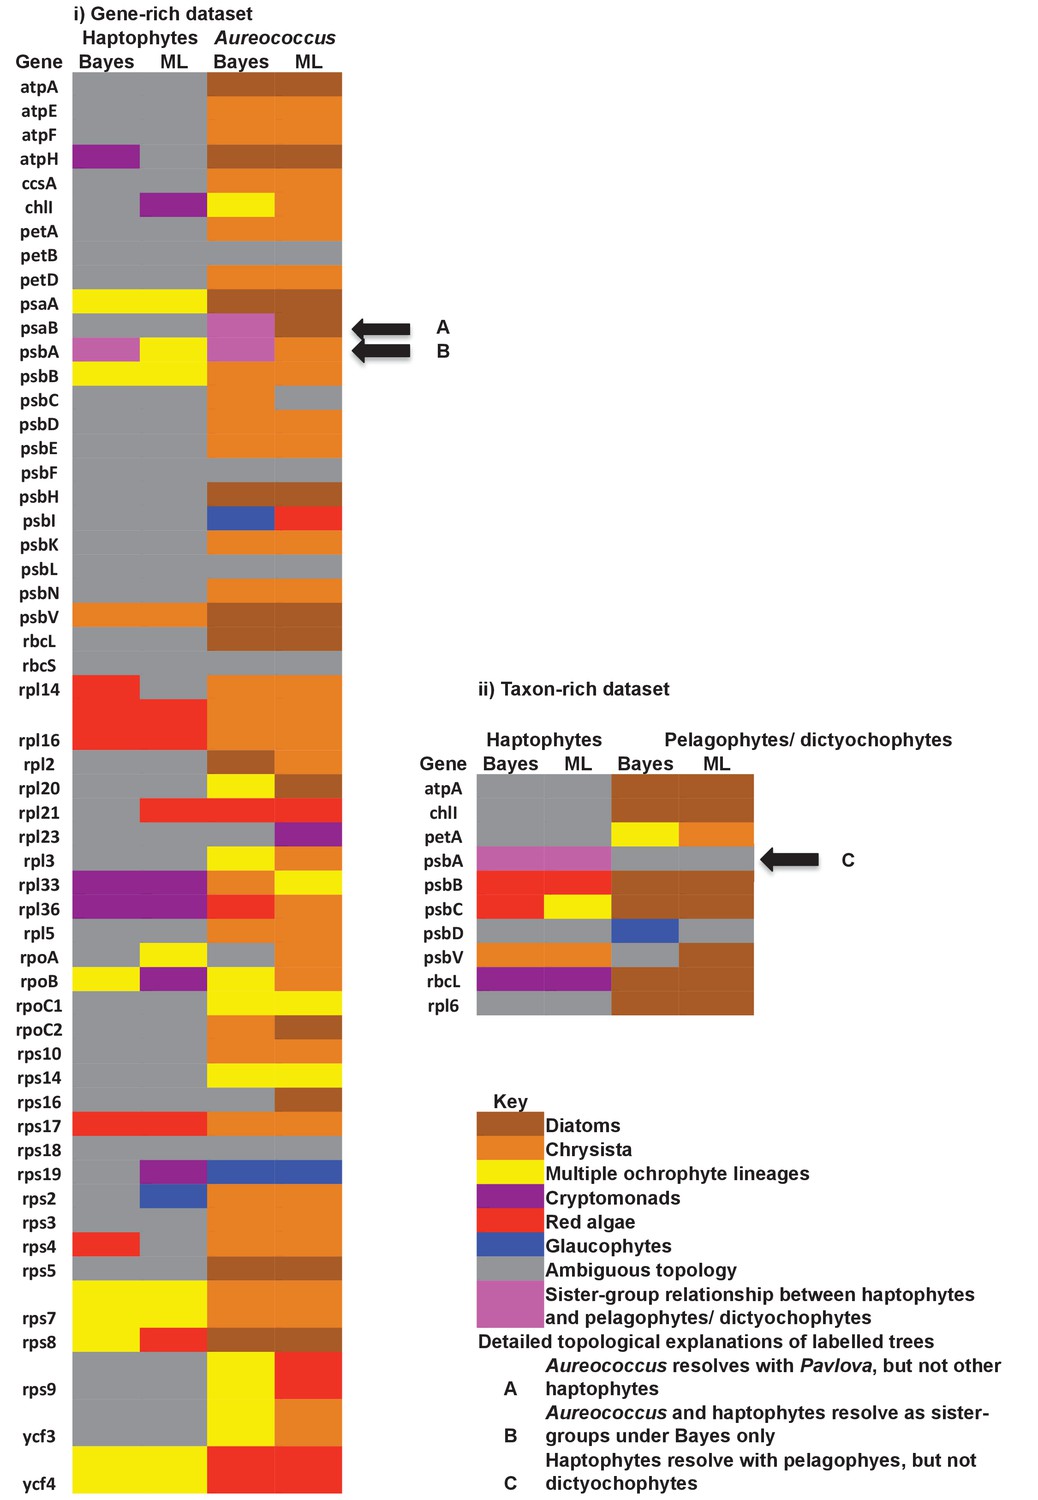
Single-gene tree topologies associated with individual plastid-encoded genes.
These heatmaps show the first sister-groups identified to haptophytes, and members of the pelagophyte/dictyochophyte clade, in single-gene trees of component genes included in concatenated trees of plastid-encoded proteins using both the gene-rich (i) and taxon-rich (ii) alignments. Topologies are given for trees inferred with MrBayes using the Jones substitution matrix, and RAxML trees inferred using JTT, under the same conditions as the multigene trees. The identity of the first sister-group is shaded according to the legend given below. Only three single-gene trees (labelled with black arrows) support any sister-group relationship between haptophytes and the pelagophyte/dictyochophyte clade; however, in each case (explained beneath the legend) this topology is not robustly supported, either due to polyphyly of one of the constituent lineages, or conflicting topologies identified via alternative methods.
Figure 10 with 2 supplements
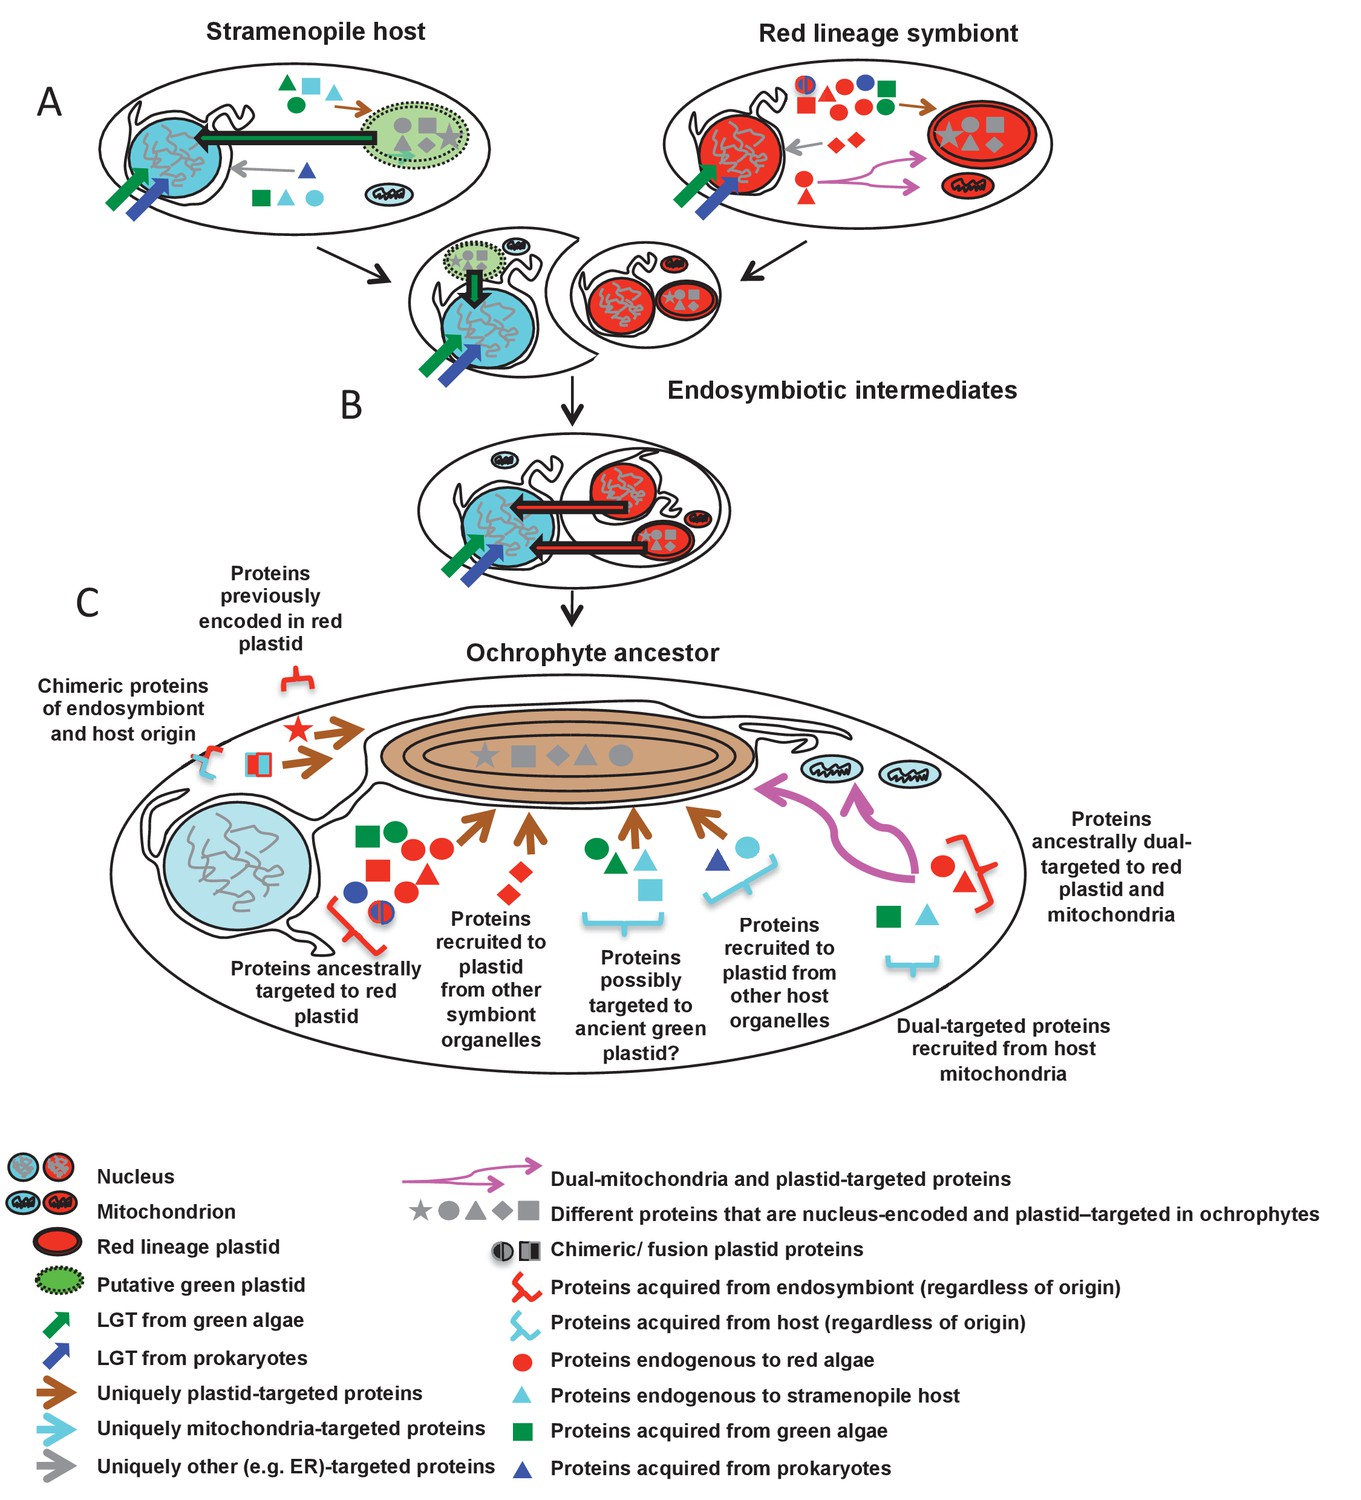
Schematic diagram of events giving rise to the ancestral ochrophyte plastid proteome.
Each cell diagram depicts a different stage in the ochrophyte plastid endosymbiosis; each protein depicted represents one or more proteins inferred in this study to have been nucleus-encoded and plastid-targeted in the last common ancestor of all ochrophytes. An ancient ochrophyte ancestor, which had already diverged from oomycetes and other aplastidic stramenopile relatives, and which may have possessed a green algal plastid (A), acquired a red lineage plastid via secondary or higher endosymbiosis (B). Both the host and the endosymbiont are likely to have been evolutionary chimeras, possessing proteins encoded by genes acquired from endosymbiotic and/or lateral gene transfer events. Both host and symbiont are additionally likely to have possessed chimeric proteins, generated through the fusion of genes of different evolutionary origins, and a large number of mitochondrial-, ER- and (in the case of the red endosymbiont) potentially dual-targeted proteins. Following genetic integration of the red endosymbiont with its stramenopile host, the first ochrophytes (C) thus possessed a wide range of proteins of plastid function acquired from different sources, with no apparent functional bias in the types of proteins that were retained from different sources. Chimeric proteins and dual-targeted proteins, either acquired directly from the endosymbiont, or generated de novo, were also widespread features of this ancestral plastid proteome. Detailed information regarding the relationship between ultimate the evolutionary origins of each HPPG, and its presence or absence in other CASH lineages, is provided in Figure 10—figure supplement 1. A schematic diagram of possible models through which the haptophyte plastid may have originated is shown in Figure 10—figure supplement 2.
Figure 10—figure supplement 1

Complex origins of different ancestral ochrophyte HPPGs.
(Panel A) shows the evolutionary positions of lineages with histories of secondary endosymbiosis in trees of ancestral ochrophyte HPPGs verified by combined BLAST top hit and single-gene tree analysis to be either of red algal (i) or green algal origin (ii). In both cases, in more than half of the constituent trees, haptophyte and cryptomonad sequences resolve as closer relatives to the ochrophytes than the red or green algal evolutionary outgroup, either due to resolving in the ochrophyte HPPG or forming a specific sister-group to the ochrophyte lineages. (Panel B) plots the distribution of cryptomonads (i) and haptophytes (ii) in trees for different categories of ancestral ochrophyte HPPG of verified evolutionary origin. HPPGs of green algal origin more frequently show internal or sister positions for the cryptomonad sequences than all other categories of HPPG, and in more than 50% of cases resolve internal or sister positions for the haptophyte sequences. This might be consistent with a green algal contribution to the endosymbiotic ancestor of cryptomonad, haptophyte and ochrophyte plastids.
Figure 10—figure supplement 2
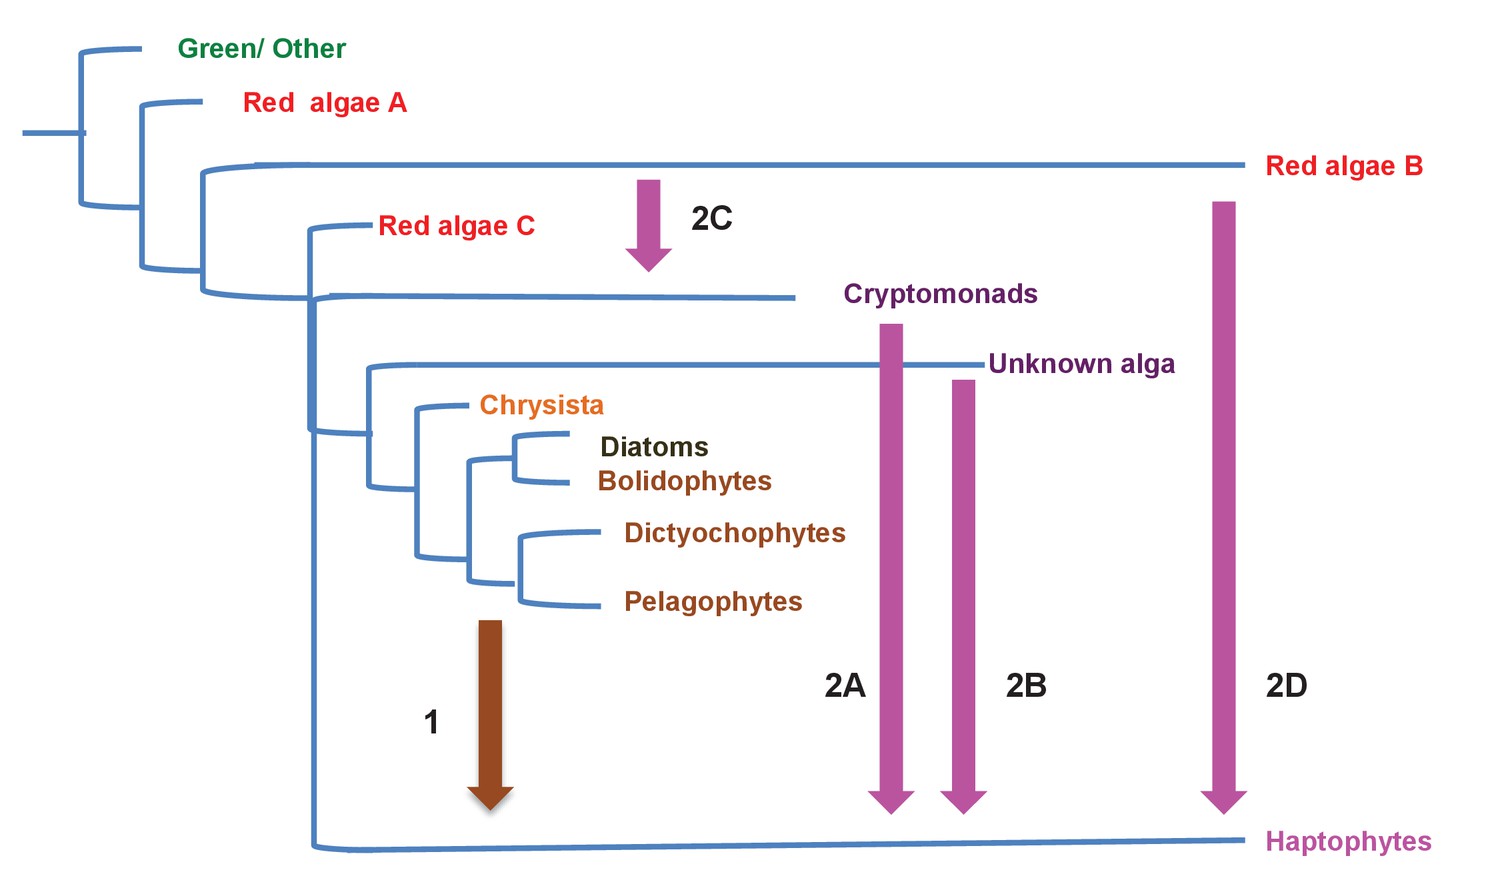
Different scenarios for the origins of haptophyte plastids.
This schematic tree diagram shows different possibilities for the origins of the haptophyte plastid as predicted from the data within this study. No inference is made here regarding the ultimate origin of the ochrophyte plastid, although the ochrophyte, cryptomonad and haptophyte plastids are likely to be closely related to one another within the red plastid lineages. First, a common ancestor of the pelagophytes and dictyochophytes was taken up by a common ancestor of the haptophytes (point 1), yielding a permanent plastid that contributed genes for a large number of plastid-targeted proteins in extant haptophytes. This plastid was subsequently replaced via serial endosymbiosis (point 2) yielding the current haptophyte plastid and plastid genome. This serial endosymbiosis event either involved a close relative of extant cryptomonads (2A) or a currently unidentified species that forms a sister-group in plastid gene trees to all extant ochrophytes, but is evolutionarily distinct from the pelagophytes (2B). It is possible that the haptophyte plastid may have been acquired through the secondary endosymbiosis of a different lineage of red algae to the ochrophyte, either via a cryptomonad intermediate (2C) or directly (2D).
Tables
Table 1
Glossary Box. A schematic figure of eukaryotic taxonomy, showing the evolutionary origins of nuclear and plastid lineages, adapted from previous reviews (Dorrell and Howe, 2012a), is shown in Figure 1—figure supplement 1.
| Complex plastids | Plastids acquired through the endosymbiosis of a eukaryotic alga. These include secondary plastids of ultimate red algal origin (such as those found in ochrophytes, haptophytes and cryptomonads), secondary plastids derived from green algae (such as those found in euglenids or chlorarachniophytes), or tertiary plastids such as those found in dinotoms and certain other dinoflagellates (resulting from the endosymbioses of eukaryotic algae that themselves contain plastids of complex origin). |
| CASH lineages | The four major lineages of algae with plastids of secondary or higher red origin, that is to say Cryptomonads, Alveolates (dinoflagellates, and apicomplexans), Stramenopiles, and Haptophytes. |
| Stramenopiles | A diverse and ecologically major component of the eukaryotic tree, containing both photosynthetic members (the ochrophytes), which possess complex plastids of red algal origin, and aplastidic and non-photosynthetic members (e.g. oomycetes, labyrinthulomycetes, and the human pathogen Blastocystis), which form the earliest-diverging branches. It is debated when within stramenopile evolution the extant ochrophyte plastid was acquired. |
| Ochrophytes | Photosynthetic and plastid-bearing members of the stramenopiles, including many ecologically important lineages (diatoms, kelps, pelagophytes) and potential model lineages for biofuels research (Nannochloropsis). Ochrophytes possess plastids of ultimate red origin, and form the most significant component of eukaryotic marine phytoplankton (Dorrell and Smith, 2011; de Vargas et al., 2015). |
| Haptophytes | Single-celled, photosynthetic eukaryotes, possessing complex plastids of ultimate red origin. Some haptophytes (the coccolithophorids) are renowned for their ability to form large blooms (visible from space), and to form intricate calcareous shells (Dorrell and Smith, 2011; Bown, 1998), which if deposited on the ocean floor go on to form a major component of limestone and other sedimentary rocks. |
| HPPG | ‘Homologous plastid protein group’. Proteins identified in this study to possess plastid-targeting sequences that are homologous to one another, as defined by BLAST-based HPPG assembly and single gene phylogenetic analysis. |
Download links
A two-part list of links to download the article, or parts of the article, in various formats.
Downloads (link to download the article as PDF)
Open citations (links to open the citations from this article in various online reference manager services)
Cite this article (links to download the citations from this article in formats compatible with various reference manager tools)
Chimeric origins of ochrophytes and haptophytes revealed through an ancient plastid proteome
eLife 6:e23717.
https://doi.org/10.7554/eLife.23717


