Autophagy functions as an antiviral mechanism against geminiviruses in plants
- Tsinghua University, China
- Hangzhou Normal University, China
Figures
Figure 1 with 3 supplements
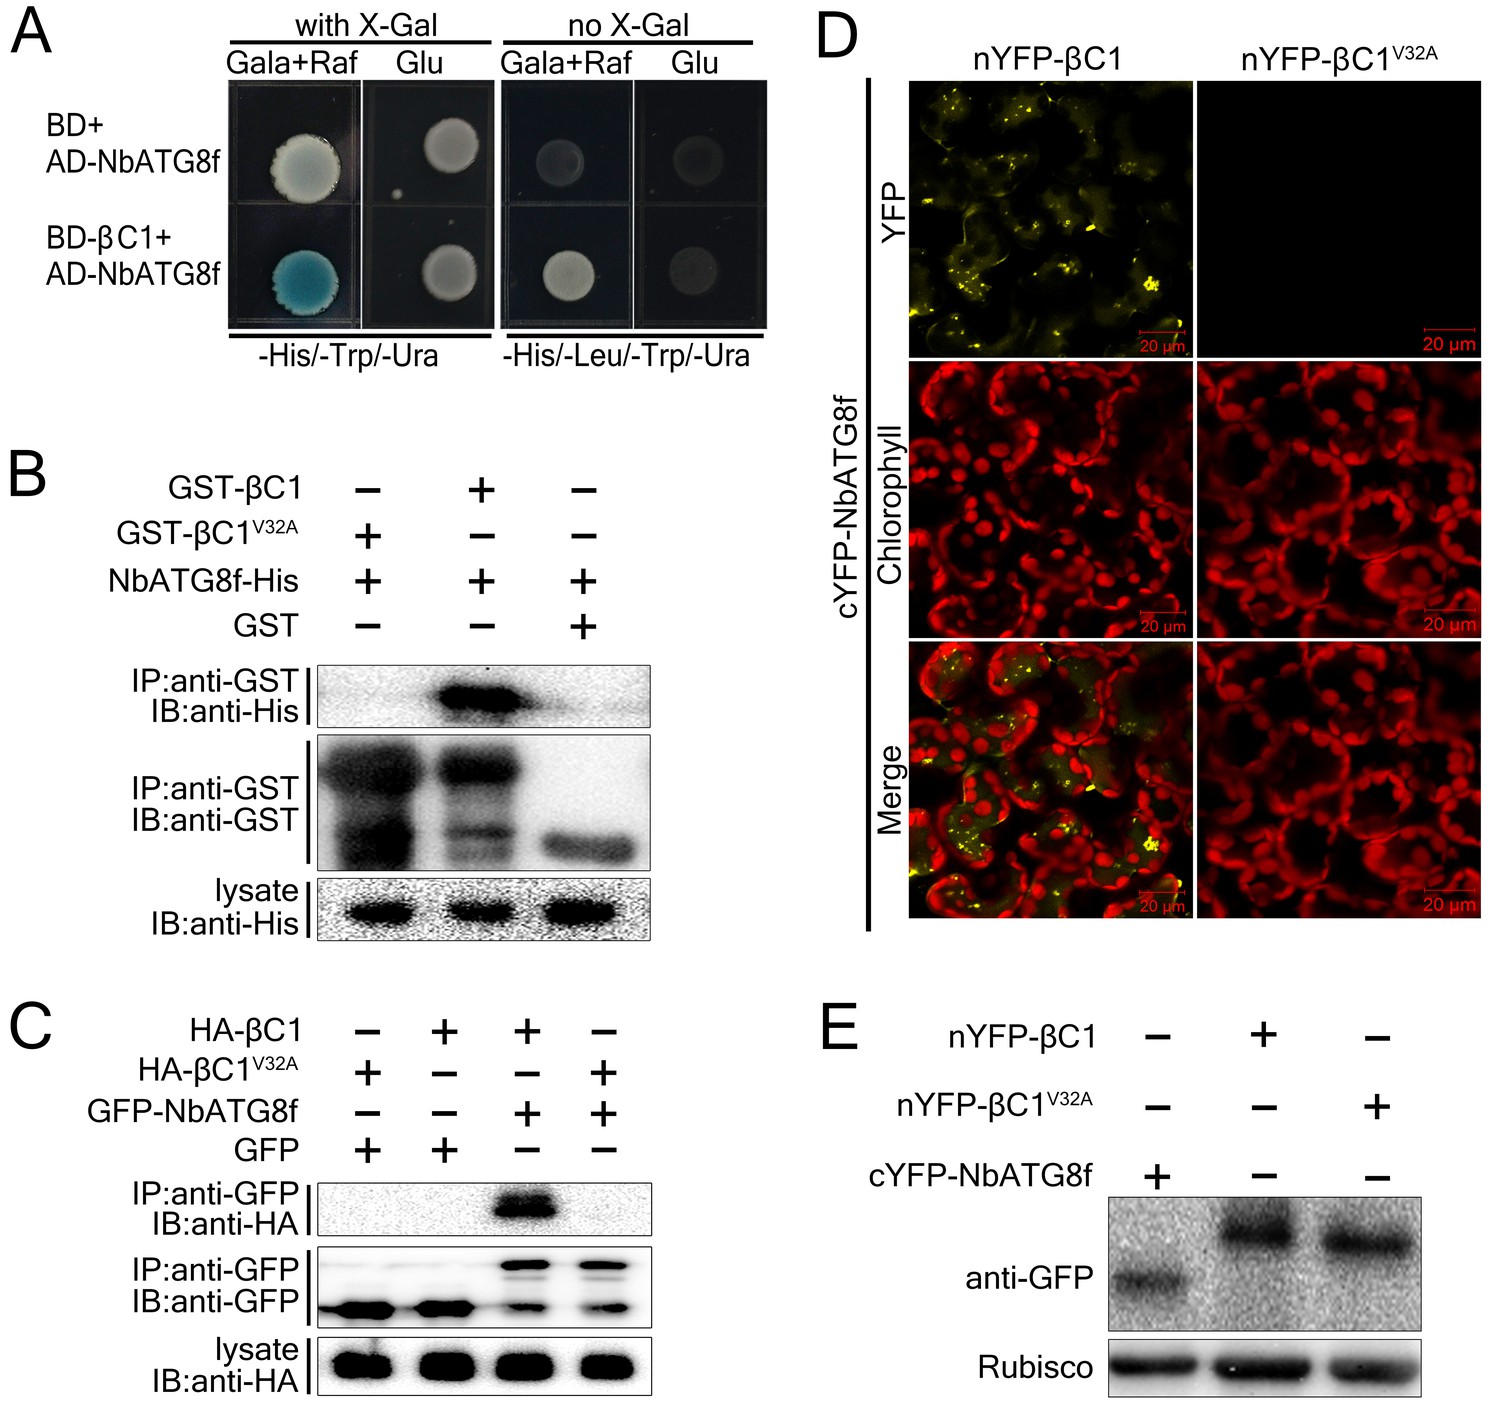
CLCuMuB βC1 interacts with NbATG8f in vivo and in vitro.
(A) βC1 interacts with NbATG8f in yeast. SKY48 yeast strains containing AD-NbATG8f transformed with BD-βC1 or BD (control) were grown on Leu- selection plates at 28°C for 4 d. The positive interaction was indicated by the blue colony formation on X-gal-containing galactose (Gala) and raffinose (Raf) but not on plates containing glucose (Glu). (B) GST pull-down assay to show the in vitro interaction of NbATG8f with βC1, but not βC1V32A. The total soluble proteins of E. coli expressing NbATG8f-6×His were incubated with GST-βC1 or GST-βC1V32A immobilized on glutathione-sepharose beads and monitored by anti-His antibody. (C) βC1 was co-immunoprecipitated with NbATG8f. GFP-NbATG8f was transiently co-expressed with and HA-βC1 or its mutant HA-βC1V32A in N. benthamiana leaves. At 60 hr post agroinfiltration (hpi), leaf lysates were immunoprecipitated with anti-GFP beads and then the precipitants were assessed by immunoblotting (IB) using anti-HA (upper panel) or anti-GFP antibodies (middle panel). (D) BiFC analyses in N. benthamiana. Representative images of nYFP-βC1 or nYFP-βC1V32A BiFC co-expressed with cYFP-NbATG8f. (E) Western blot analyses of BiFC construct combinations from the same experiments as in (D). All combinations were detected with anti-GFP polyclonal antibody.
Figure 1—figure supplement 1
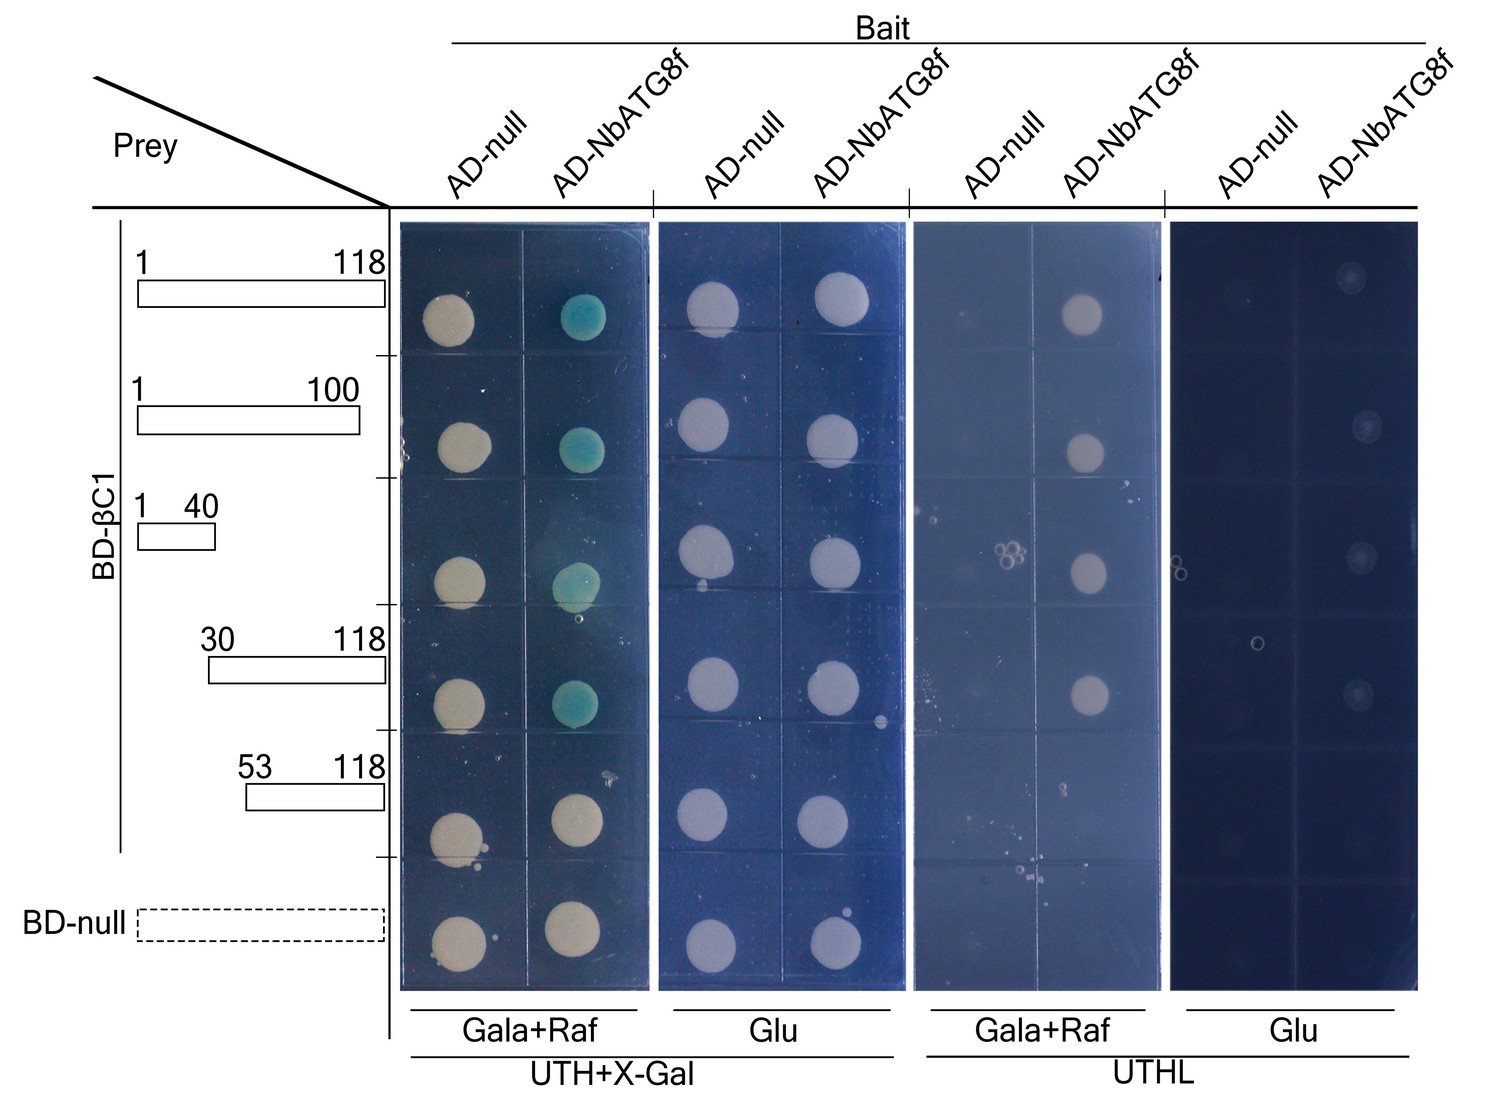
N terminus of βC1 is responsible for binding to NbATG8f.
Schematic representation of the truncated mutants of βC1, their interactions with NbATG8f in yeast. Yeast cells transformed with four truncated mutants of βC1 and NbATG8f were selected on X-Gal-containing medium.
Figure 1—figure supplement 2
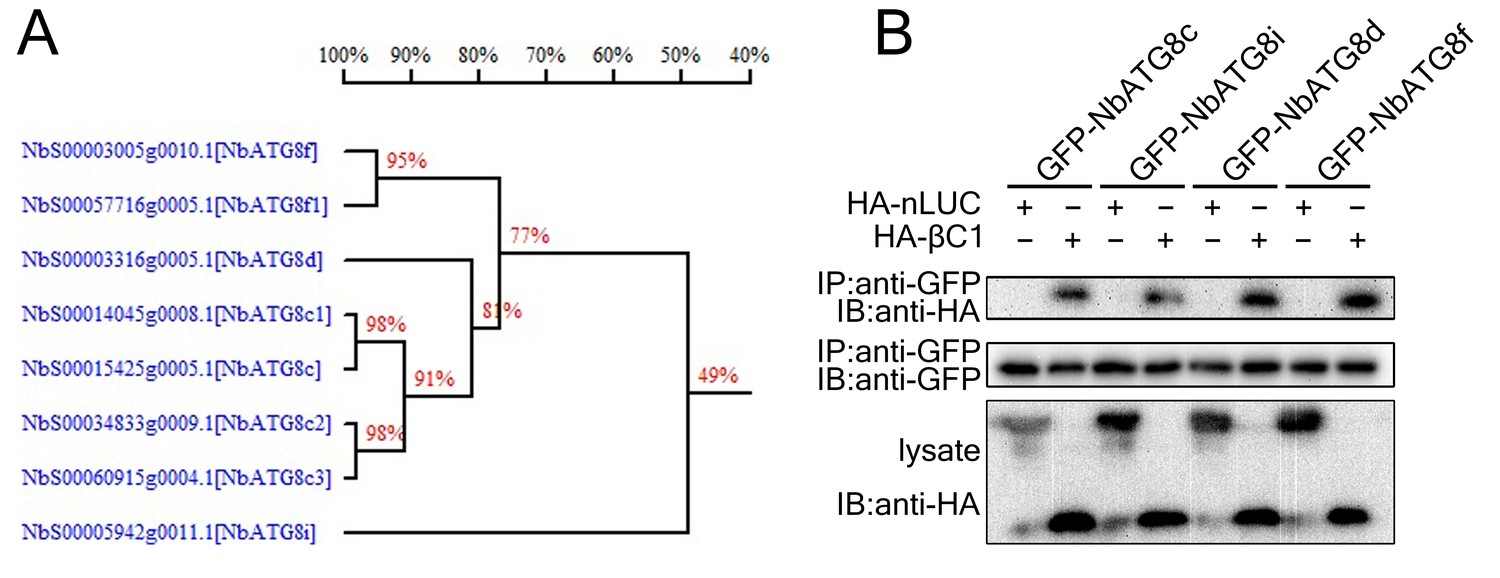
βC1 co-immunoprecipitated with multiple ATG8 homologs.
(A) Homology tree of NbATG8s. Homology tree of eight homologs of NbATG8 in N. benthamiana. The results were produced by DNAMAN package and the observed divergency method was applied to calculate distance. (B) GFP-NbATG8s were transiently co-expressed with HA-βC1 in N. benthamiana leaves. At 60 hpi, leaf lysates were immunoprecipitated with anti-GFP beads and then the precipitants were assessed by immunoblotting (IB) using anti-HA (upper panel) or anti-GFP antibodies (middle panel).
Figure 1—figure supplement 3
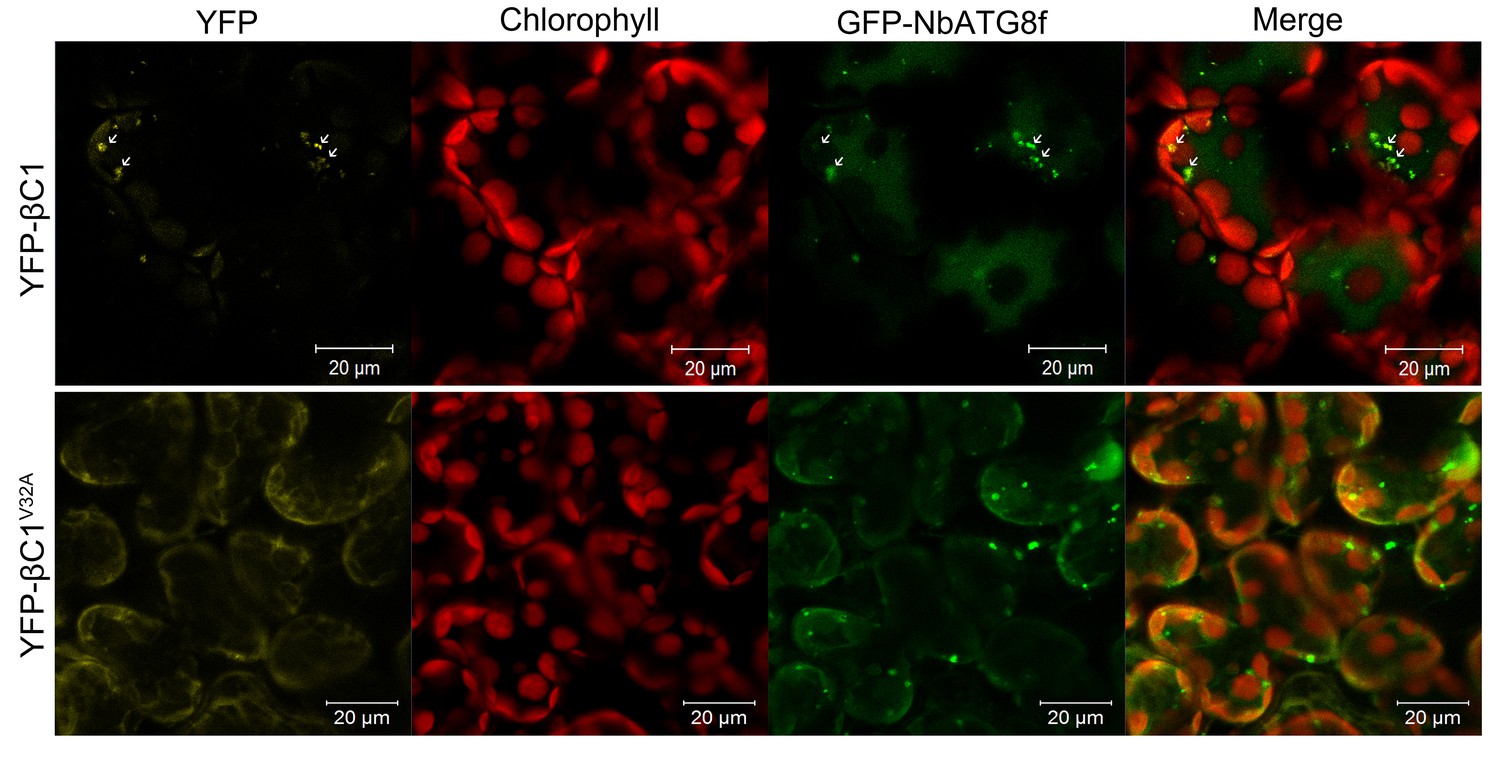
βC1 is co-localized with NbATG8f.
CFP-NbATG8f was transiently co-expressed with YFP-βC1 or YFP-βC1V32A in N. benthamiana leaves via agroinfiltration. The confocal microscope images of mesophyll cells were taken at 60 hpi.
Figure 2 with 2 supplements

CLCuMuV infection activates autophagy.
(A) Representative confocal microscopy images of dynamic autophagic activity revealed by specific autophagy marker CFP-NbATG8f in plants infected with CLCuMuV plus CLCuMuB (CA+β). (B) Quantification of the CFP-NbATG8f-labeled autophagic puncta per cell from (A). More than 500 mesophyll cells for each treatment were used for the quantification. Relative autophagic activity in virus infected plants was normalized to that of control plants, which was set to 1.0. Values represent means ± SE from three independent experiments. (*) p<0.05. (C) Representative TEM images of autophagic structures. Ultrastructure of autophagic bodies (arrows) was observed in the vacuoles of mesophyll cells of uninfected control and plants infected with CA+β. V for vacuole. (D) Autophagosome-like structures from (C) were quantified. At least 30 cells for each treatment were used for the quantification. Relative autophagic activity in virus infected plants was normalized to that of control plants, which was set to 1.0. Values represent means ± SE from three independent experiments. (*) p<0.05.
Figure 2—figure supplement 1
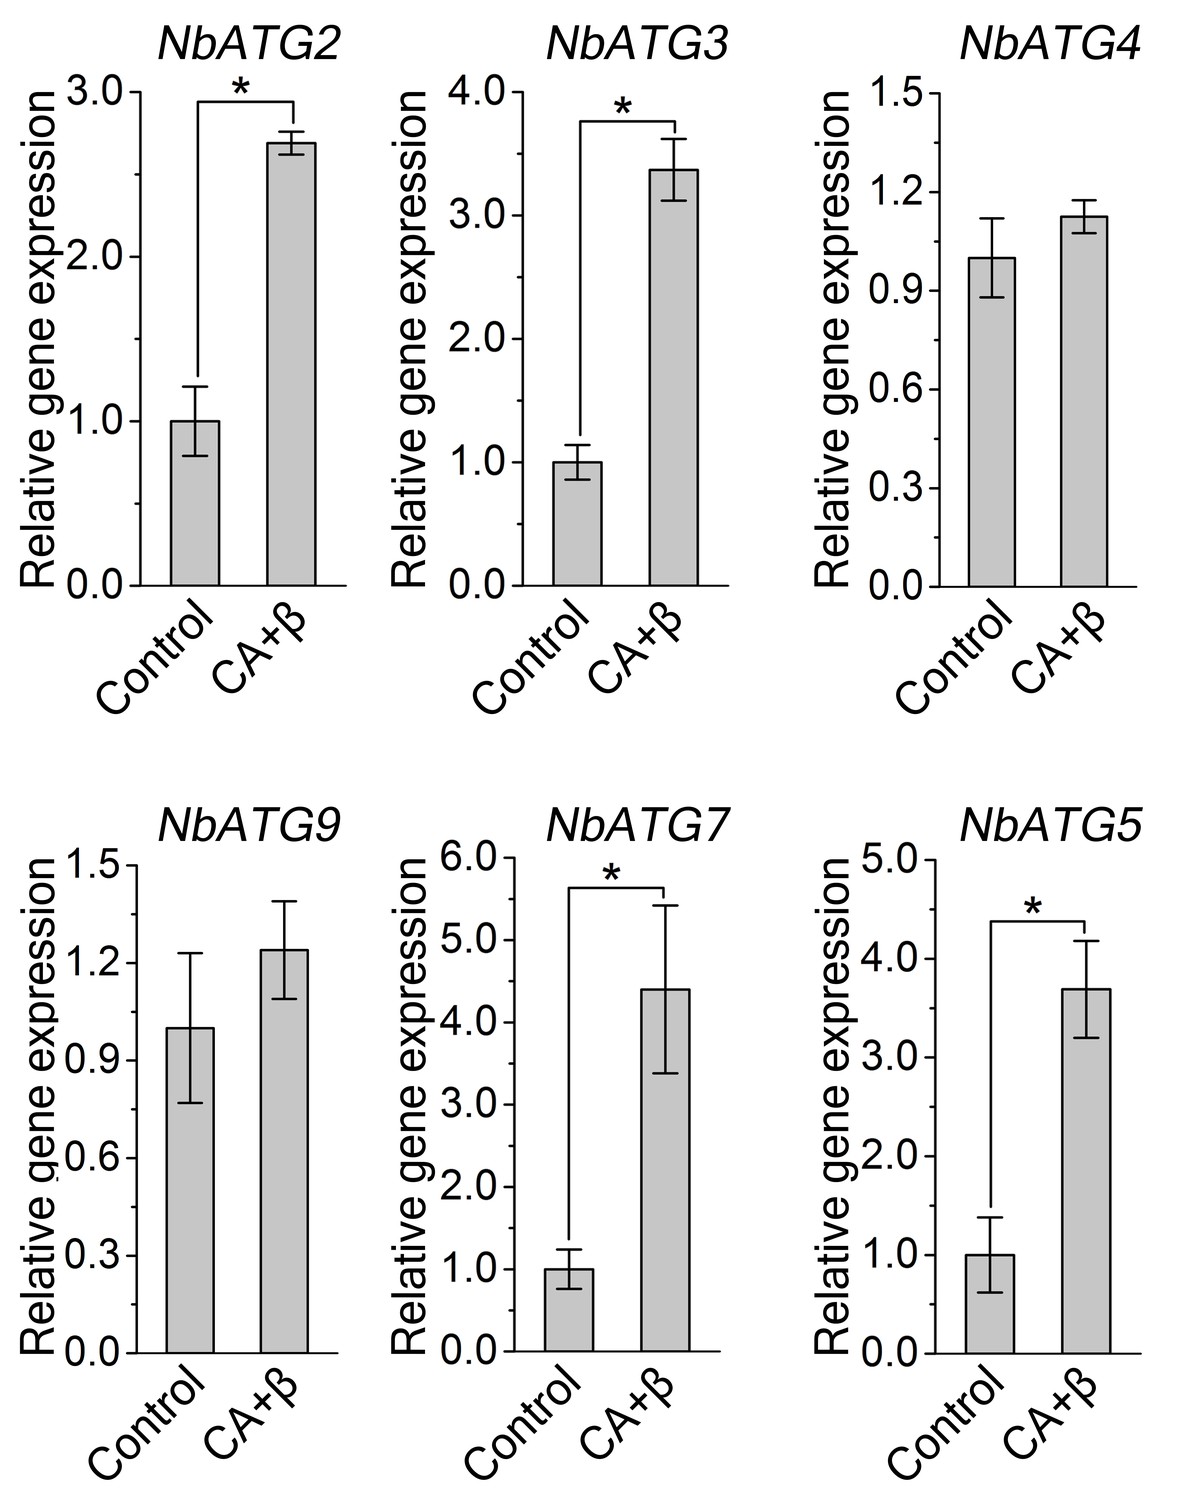
Transcription pattern of autophagy-related genes were altered during CLCuMuV infection.
Quantitative RT-PCR was performed using total RNA isolated from the leaves of virus infected plants and non-infected plants. Expression data relative to non-infected plants are normalized to that of NbeIF4α. Values are means ± SE from three independent experiments. (*) p<0.05.
Figure 2—figure supplement 2
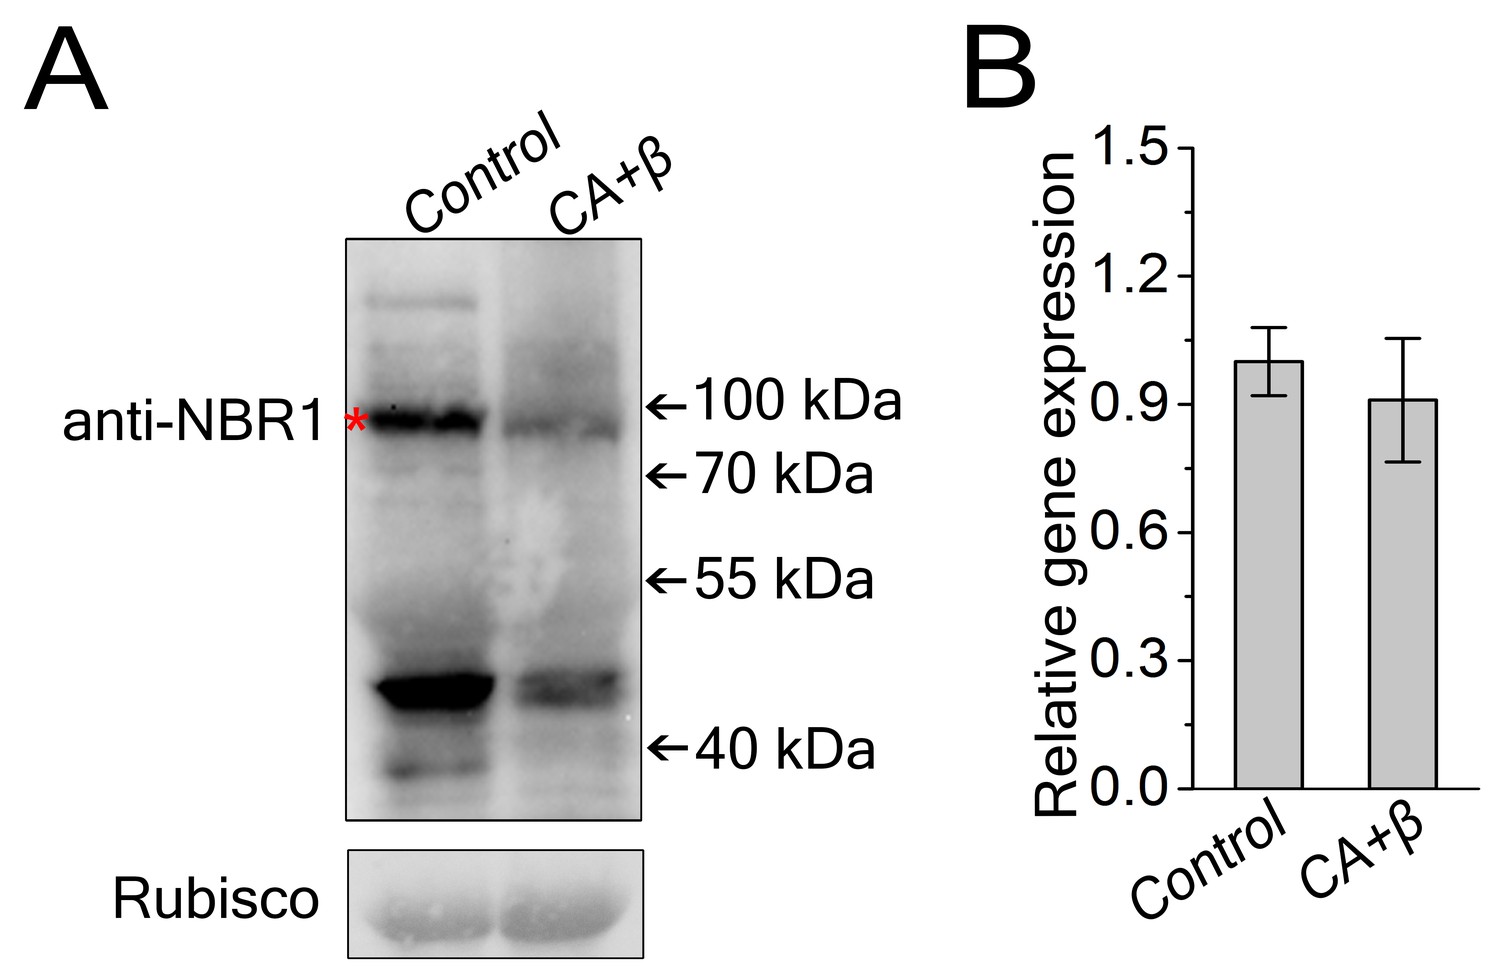
Viral infection decreased NbJoka2/NBR1 protein level.
(A) Western blot assays showed that NbJoka2 protein level was reduced due to the increased autophagy flux in CLCuMuV-infected plants. NbJoka2 was detected with anti-NBR1 polyclonal antibody. Stars indicate expected band size. (B) mRNA level of NbJoka2 was unchanged in CLCuMuV-infected plants. Real-time RT-PCR of NbJoka2 was used to determine mRNA level. Values represent means ± SE from three independent experiments. (*) p<0.05.
Figure 3 with 4 supplements
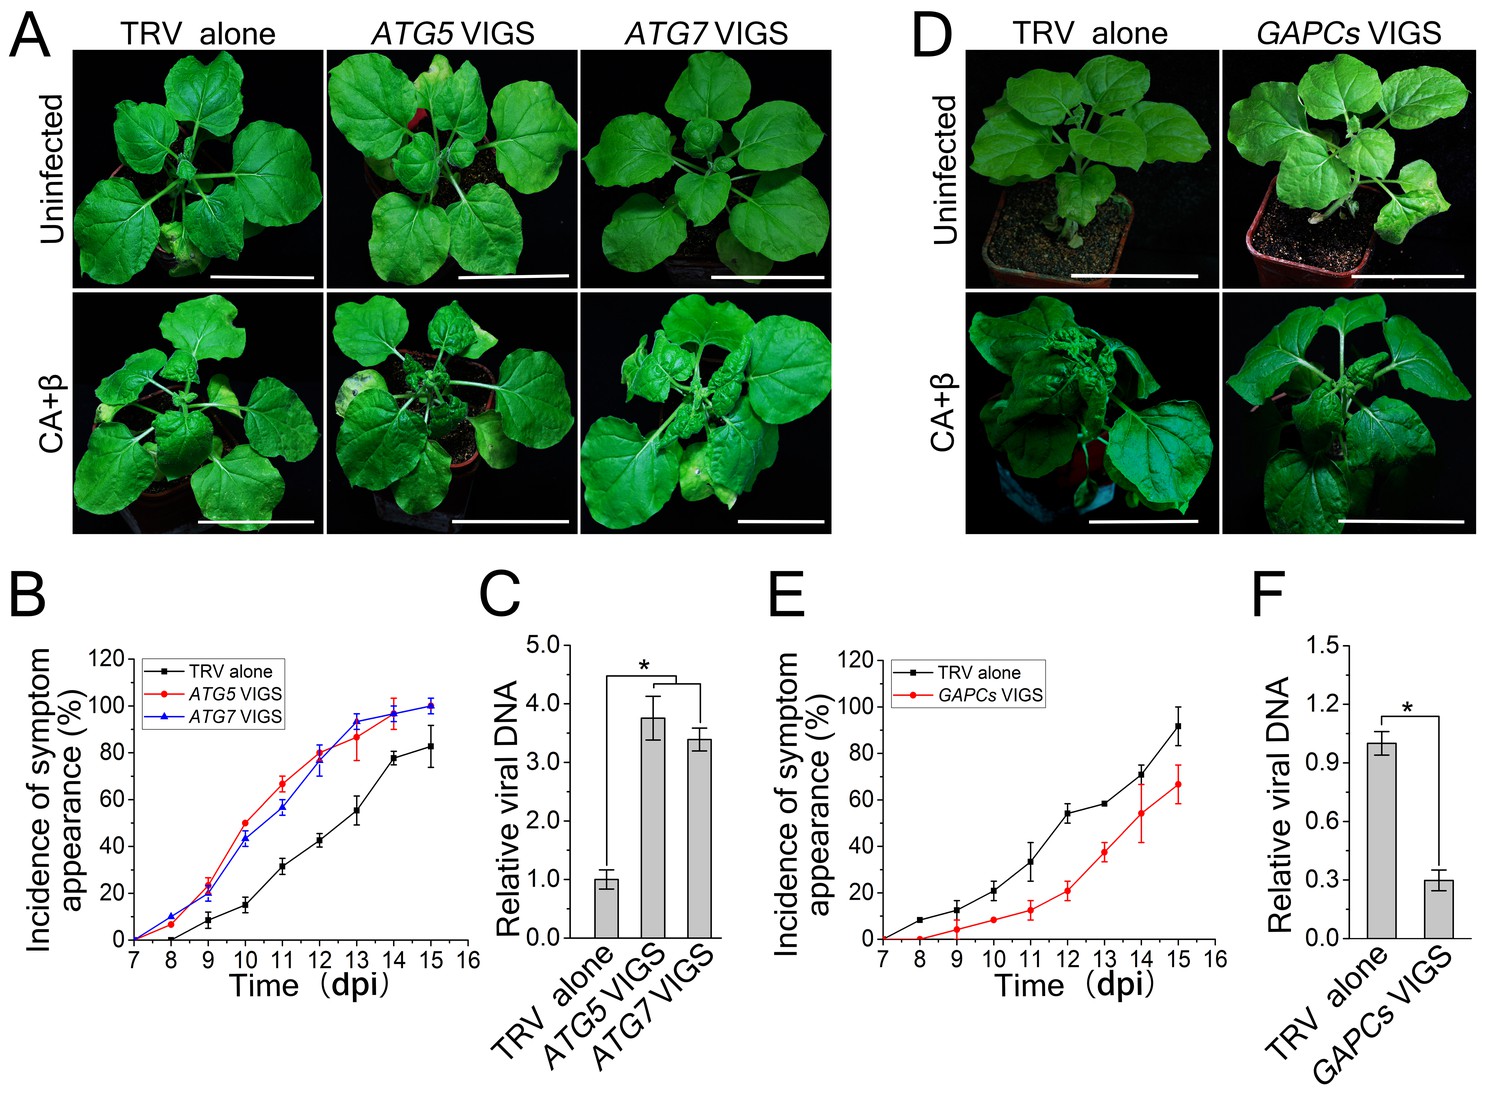
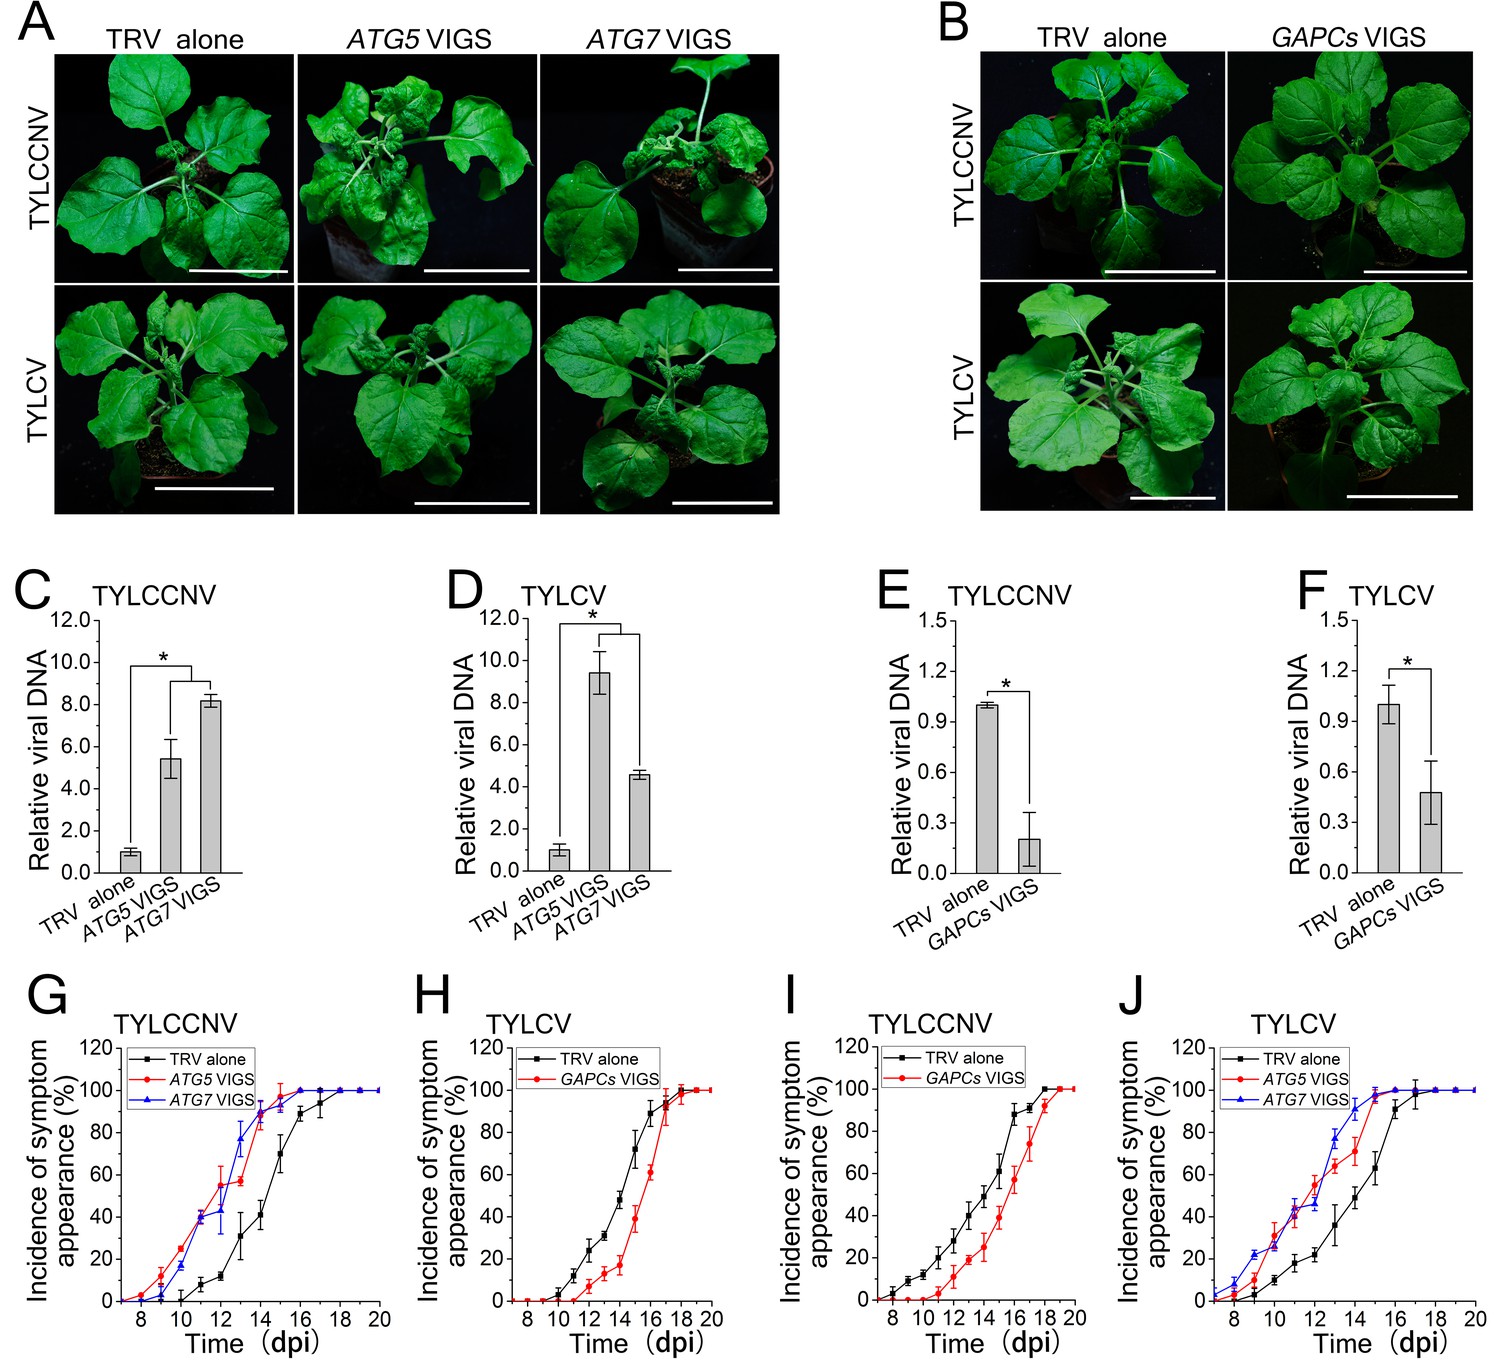
CLCuMuV DNA accumulation is affected by host cell autophagy.
(A) Viral symptoms in ATG5- and ATG7–silenced plants infected with CLCuMuV plus CLCuMuB (CA+β) at 12 dpi. Bar represents 7 cm. (B) The incidence of viral symptom appearance at different time points of post infection in ATG5- and ATG7-silenced plants. Symptom was indicated as the appearance of curled leaf caused by CA+β. Values represent means ± SE from three independent experiments. (C) Relative viral DNA accumulation in ATG5- and ATG7–silenced plants infected with CA+β. Real-time PCR analysis of V1 gene from CLCuMuV was used to determine viral DNA level. Values represent means ± SE from three independent experiments. (*) p<0.05. (D) Viral symptoms in GAPCs–silenced plants infected with CA+β at 15 dpi. Bar represents 7 cm. (E) The incidence of symptom appearance at different time points of post infection in GAPCs-silenced plants. Symptom was indicated as the appearance of curled leaf caused by CLCuMuV infection. Values represent means ± SE from three independent experiments. (F) Relative viral DNA accumulation in GAPCs-silenced plants. Real-time PCR analysis of V1 gene from CLCuMuV was used to determine viral DNA level. Values represent means ± SE from three independent experiments. (*) p<0.05.
Figure 3—figure supplement 1
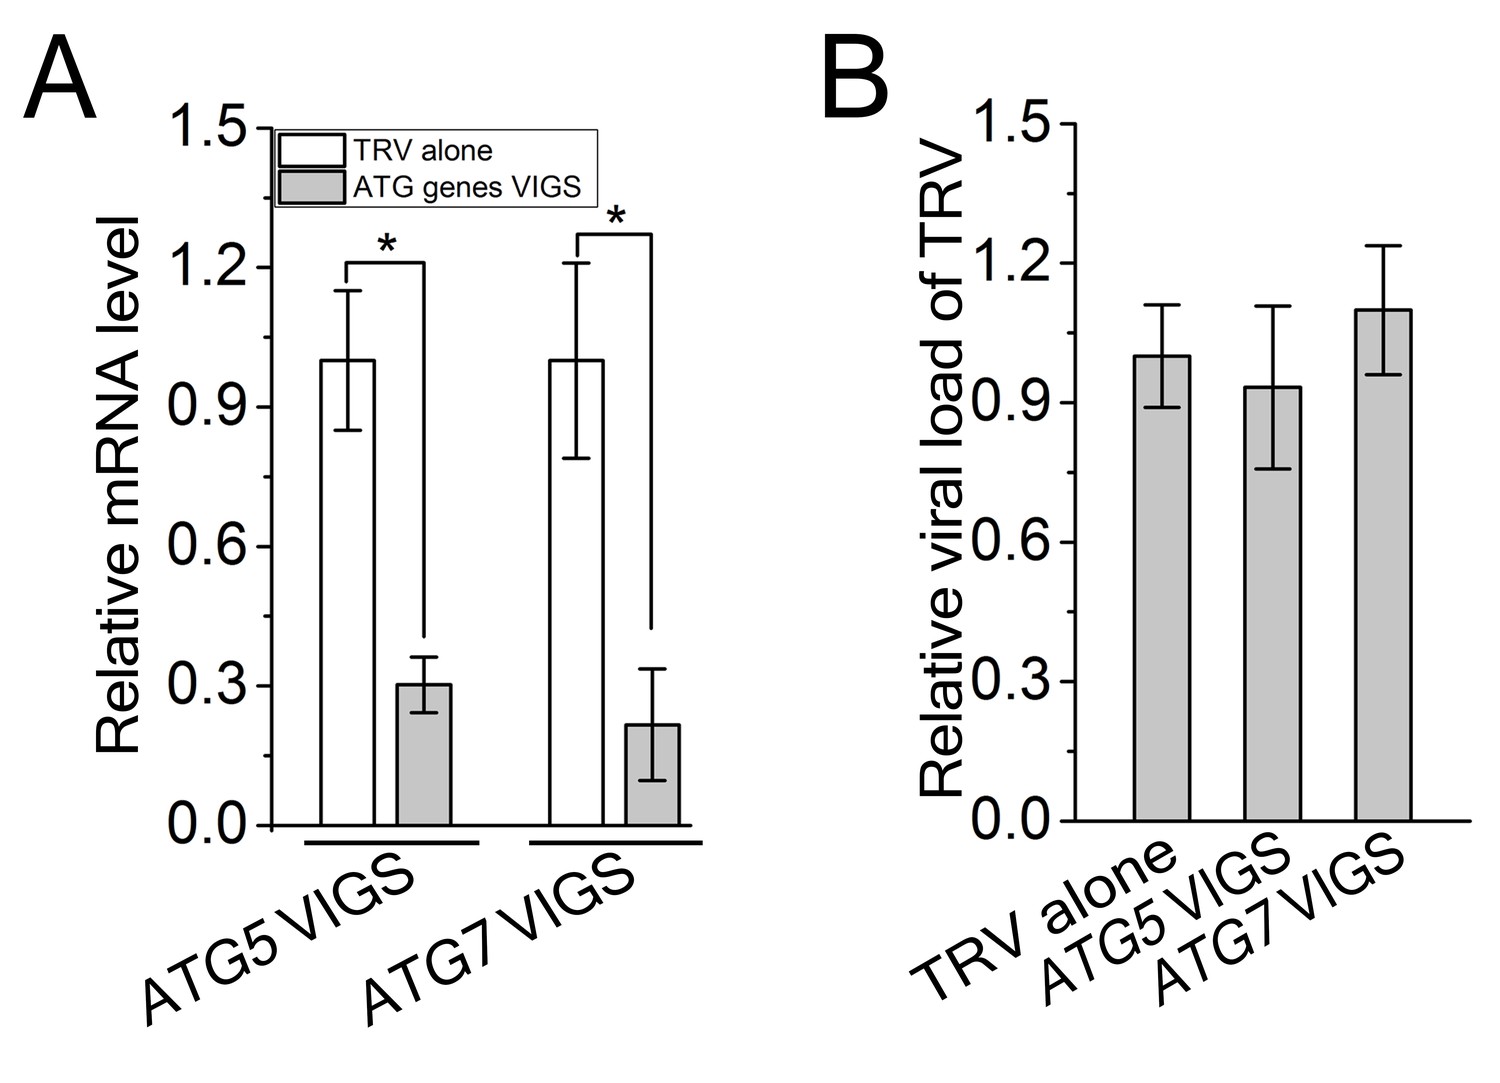
TRV viral titers were not changed during VIGS.
(A) Reduced mRNA levels of ATG5 and ATG7 in the silenced plants. Real-time RT-PCR was performed using gene-specific primers. NbeIF4α was used as an internal control. Values are means ±S E from three independent experiments. (B) Relative viral load of TRV in ATG5- and ATG7-silenced plants. Real-time PCR analysis of CP gene from TRV was used to determine viral load. Values represent means ± SE from three independent experiments. (*) p<0.05.
Figure 3—figure supplement 2
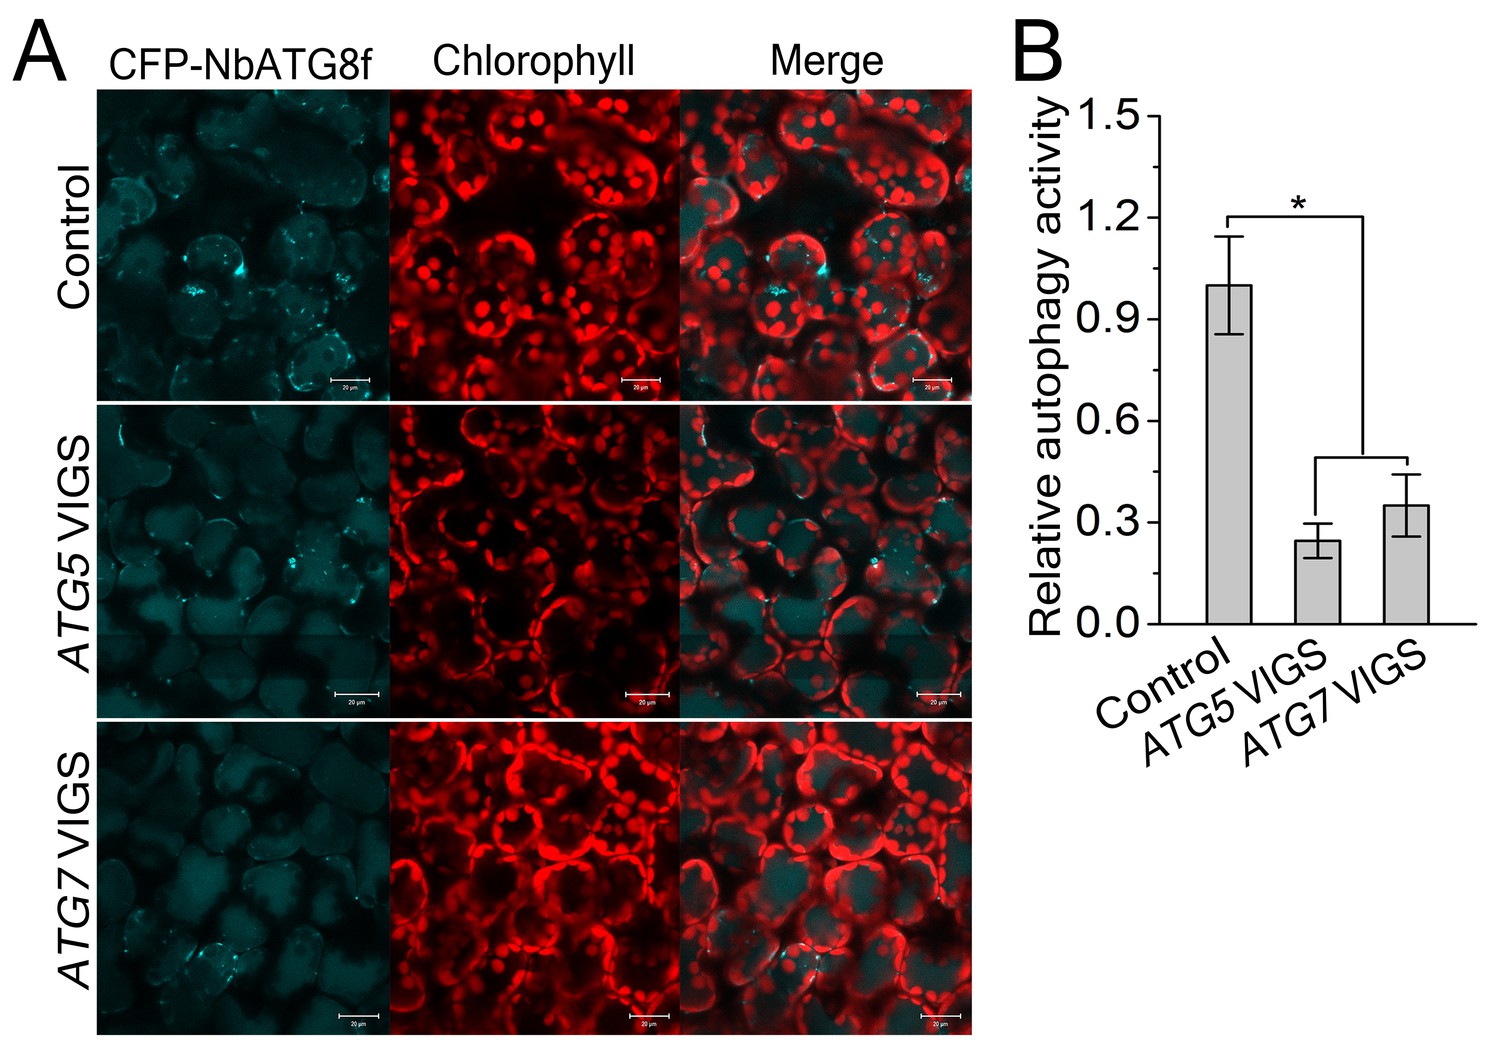
Involvement of ATG5 and ATG7 in autophagy is confirmed by VIGS.
(A) Representative confocal images of dynamic autophagic activity revealed by specific autophagy marker CFP-NbATG8f in ATG5- and ATG7-silenced plants and control plants. (B) Reduced autophagic activity in ATG5- and ATG7-silenced plants. Quantification of the CFP-NbATG8f-labeled autophagic puncta per cell was performed. More than 500 mesophyll cells for each treatment were used for the quantification. Relative autophagic activity was normalized to that in TRV control plants, which was set to 1.0. Values represent means ± SE from three independent experiments. (*) p<0.05 compared with control.
Figure 3—figure supplement 3
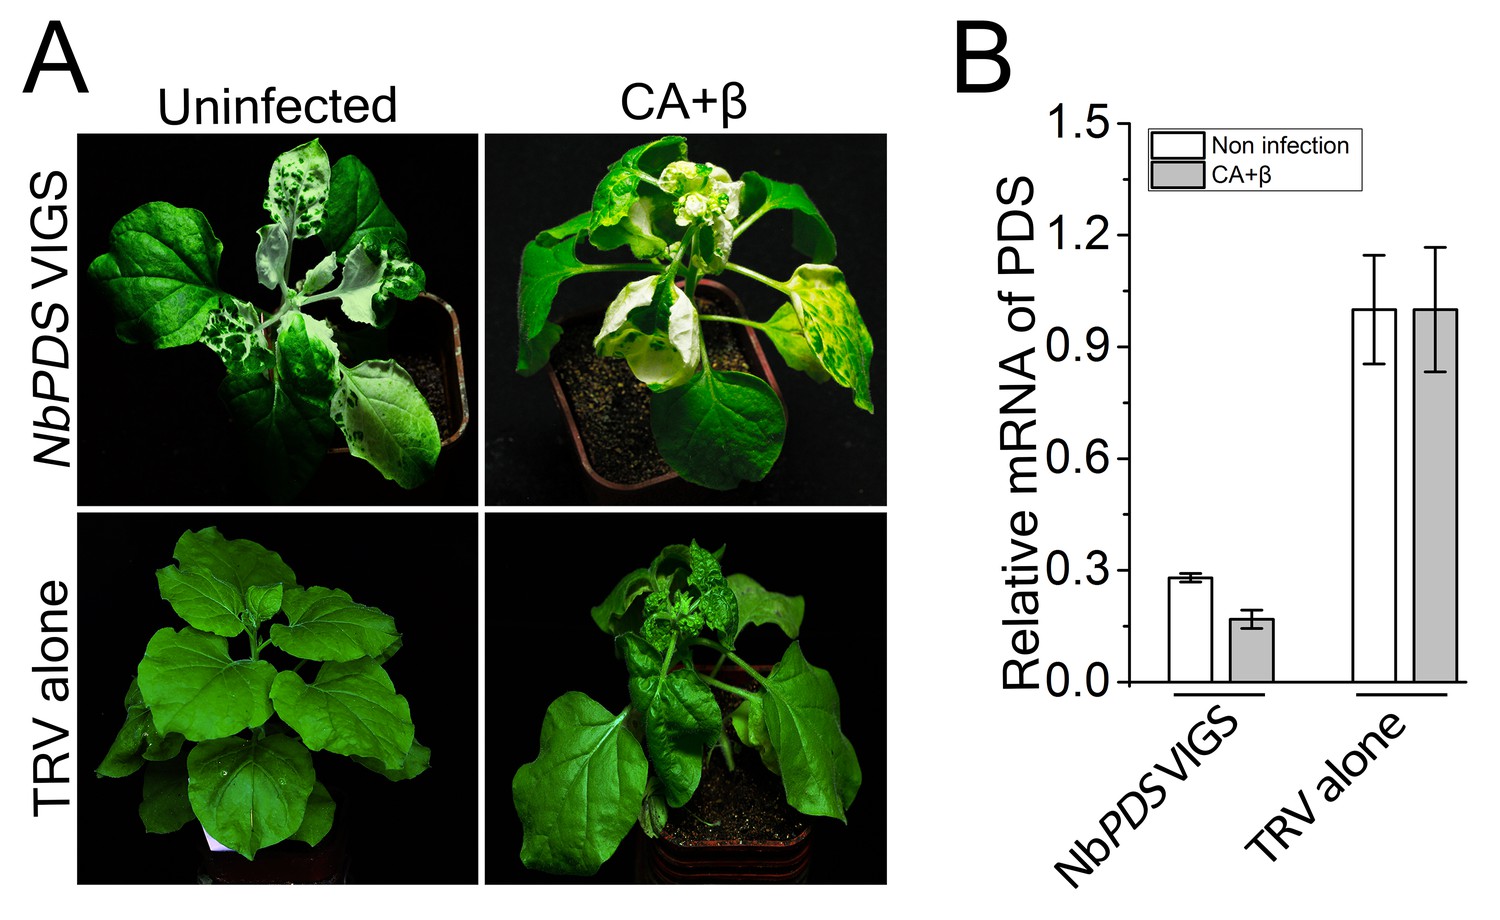
CLCuMuV infection has no effect on TRV-based VIGS of NbPDS.
(A) TRV-based VIGS of PDS still caused a bleached phenotype in plants infected with CLCuMuV (CA) plus CLCuMuB (β) at 15 dpi. (B) Relative mRNA level of NbPDS in plants infected with CA+β and non-infection. Leaf tissue was taken from NbPDS-silenced plants or control (TRV alone) at 15 dpi and total RNA was isolated. Real-time RT-PCR of NbPDS was used to determine mRNA level in virus infected or control plants. Values represent means ± SE from three independent experiments.
Figure 3—figure supplement 4
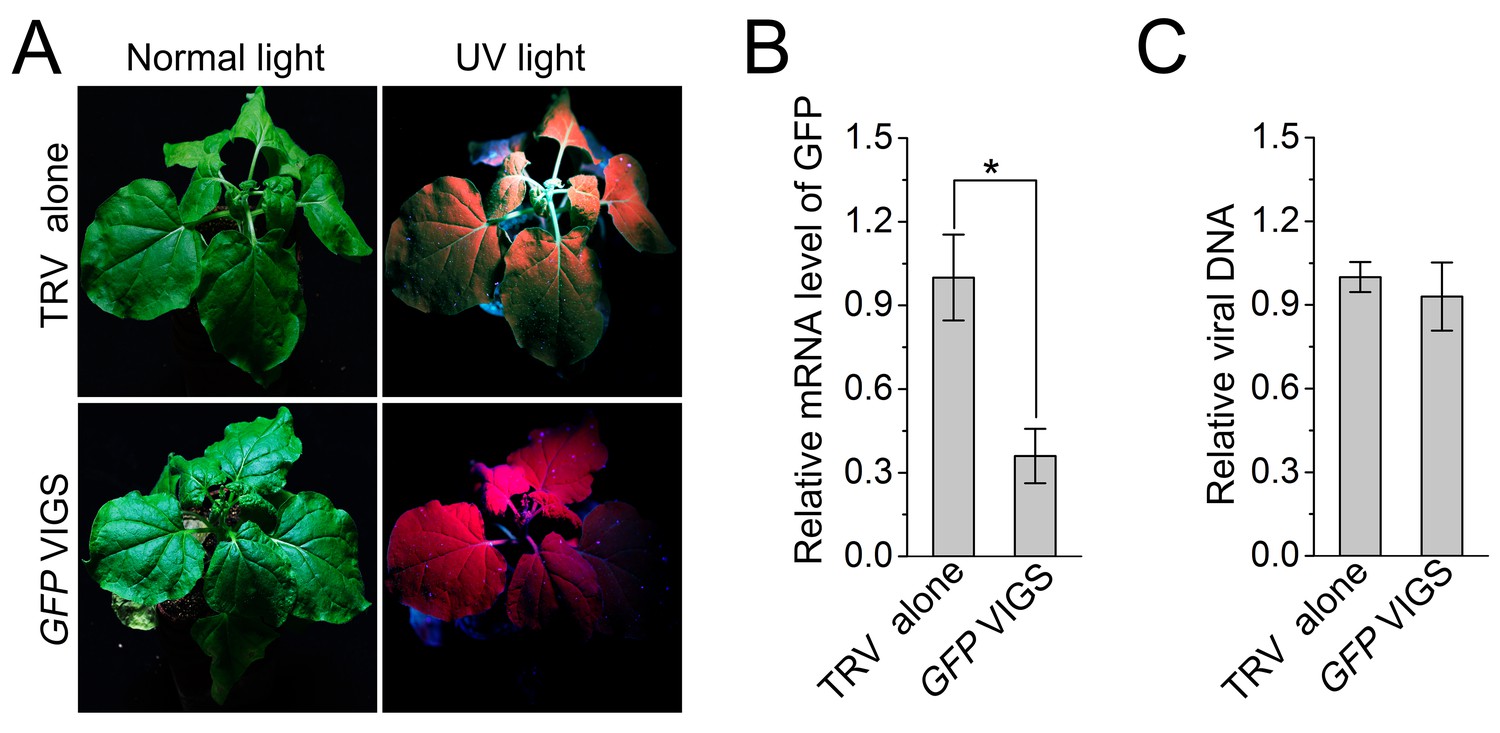
Silencing of a non-autophagy related gene GFP has no effect on CLCuMuV infection.
(A) Viral symptom in GFP-silenced N. benthamiana GFP-transgenic16c line. The pictures were taken at 12 dpi. (B) mRNA level of GFP in GFP-silenced N. benthamiana GFP-transgenic16c line. Real-time RT-PCR was performed using GFP-specific primers. eIF4α was used as an internal control. Values are means ± SE from three independent experiments. (*) p<0.05. (C) Relative CLCuMuV DNA accumulation in GFP-silenced N. benthamiana GFP-transgenic16c line. Real-time PCR analysis of CLCuMuV V1 gene was used to determine viral DNA level. Values represent means ± SE from three independent experiments.
Figure 4
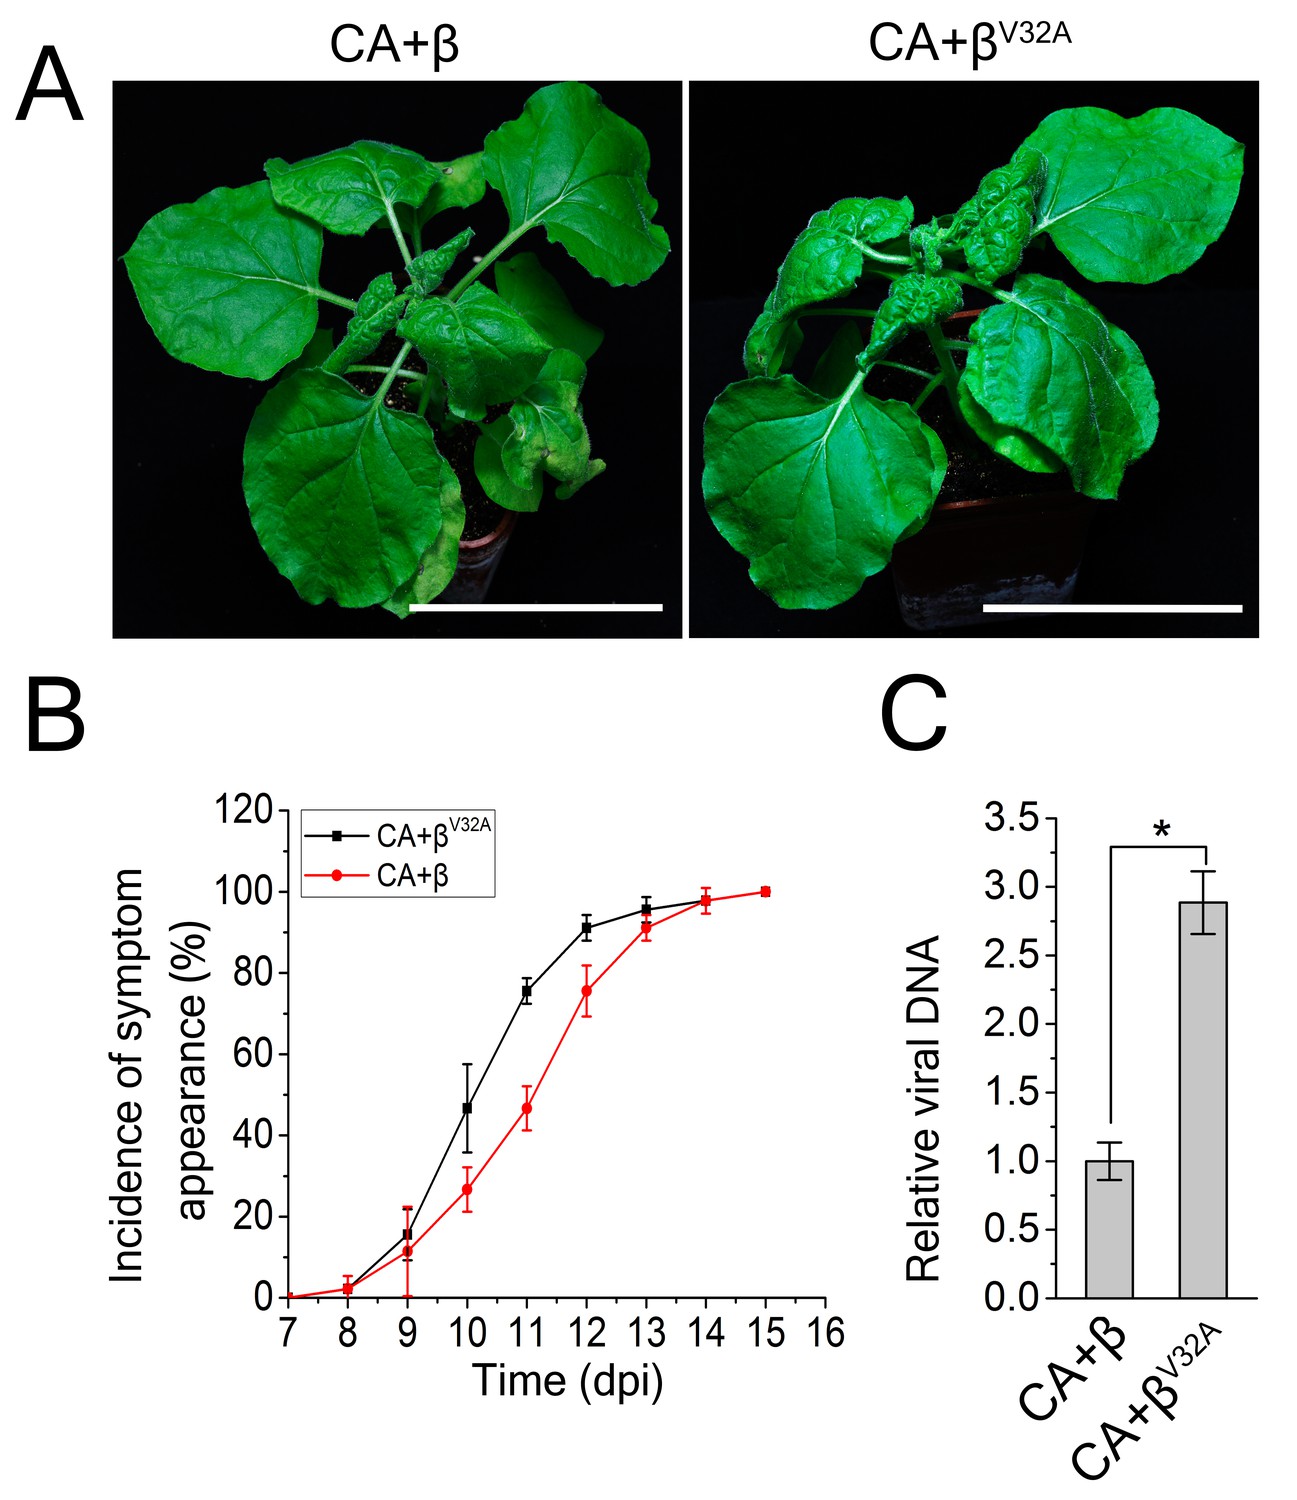
A V32A point mutation in βC1 enhanced CLCuMuV infection.
(A) CLCuMuB mutant (βV32A), which encodes a mutant βC1V32A, caused the enhanced viral symptom compared to wild type CLCuMuB (β) when co-infected with CLCuMuV (CA). The pictures were taken at 12 dpi. A V32A point mutation in βC1 (βC1V32A) eliminates its interaction with NbATG8f. (B) The incidence of symptom appearance at different time points of post infection. Symptom was indicated as the appearance of curled leaf caused by the infection with CA+β or CA+βV32A. (C) Relative viral accumulation of CLCuMuV DNA. Real-time PCR analysis of V1 gene from CLCuMuV was used to determine viral DNA level. Values represent means ± SE from three independent experiments. (*) p<0.05.
Figure 5 with 2 supplements
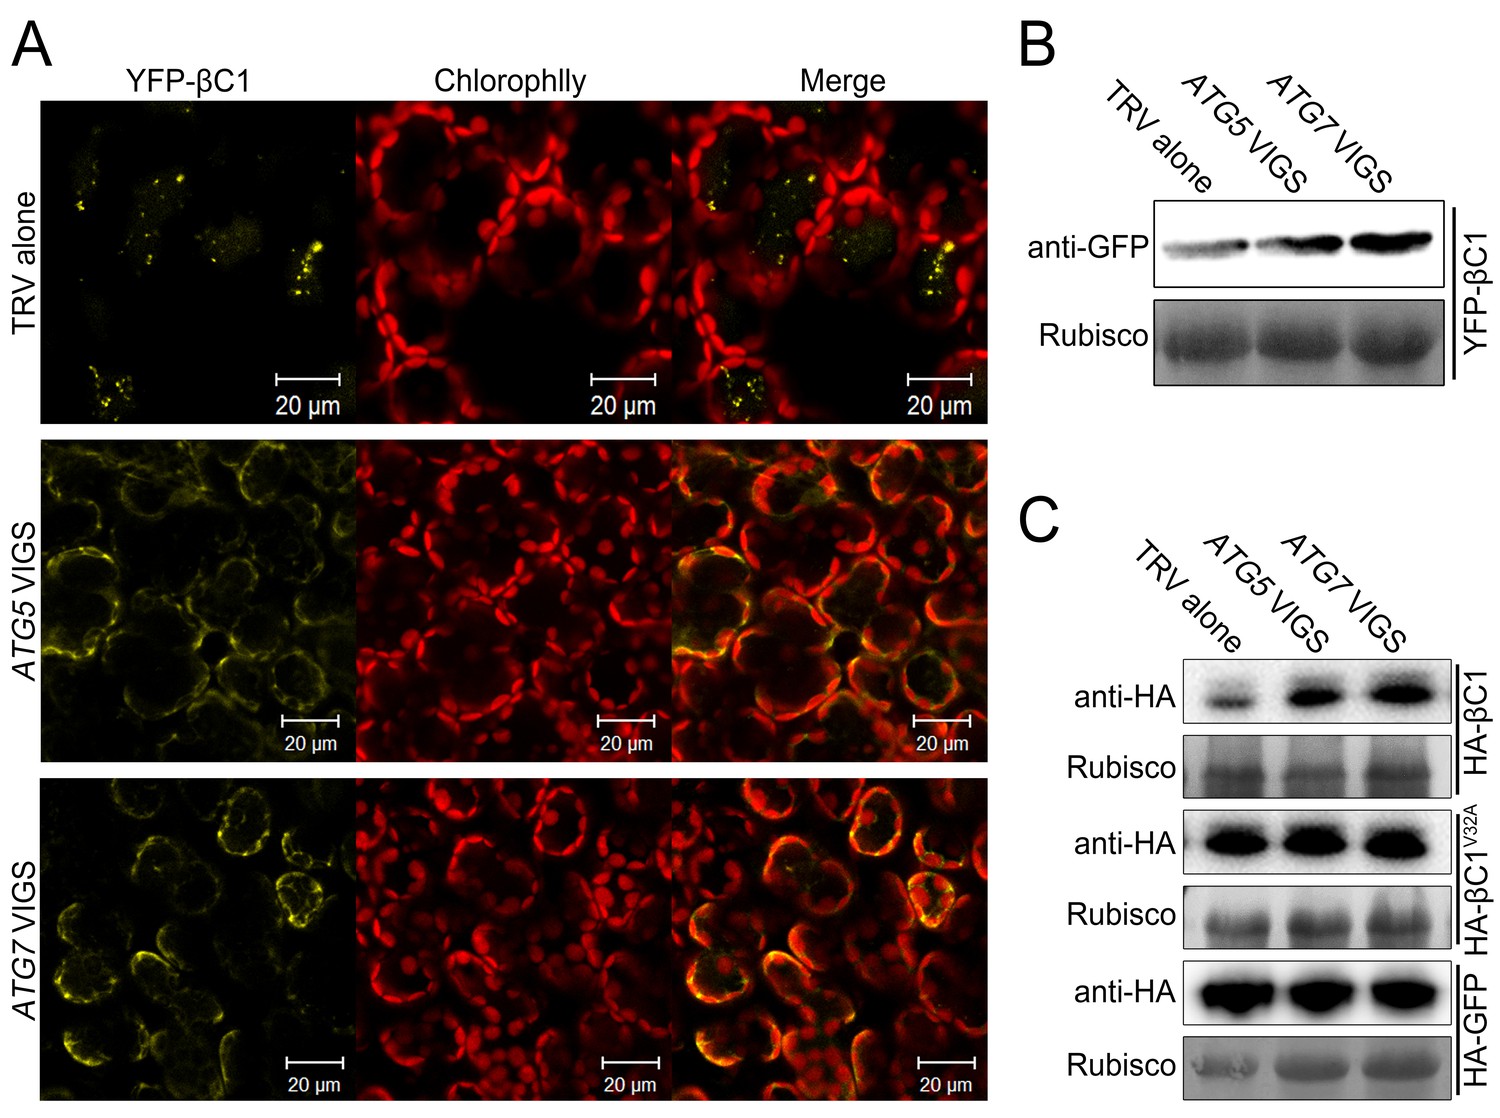
βC1 proteins is targeted for autophagic degradation.
(A) Confocal microscopy images of YFP-βC1 in mesophyll cells of N. benthamiana leaves. YFP-βC1 was transiently expressed in non-silenced control (TRV alone), ATG5 or ATG7 silenced plants. The confocal microscope images of mesophyll cells were taken at 60 hpi. (B) Western blot analyses of YFP-βC1 construct from the same experiments as in (A). Level of the fusion protein, YFP-βC1, was detected with anti-GFP polyclonal antibody. (C) Silencing of either ATG5 or ATG7 enhanced the accumulation of HA-βC1, but not HA-βC1V32A. Each expression constructs were agroinfiltrated into N. benthamiana leaf. At 60 hpi leaf lysates were separated by SDS-PAGE and fusion proteins were detected by anti-GFP or anti-HA antibodies.
Figure 5—figure supplement 1
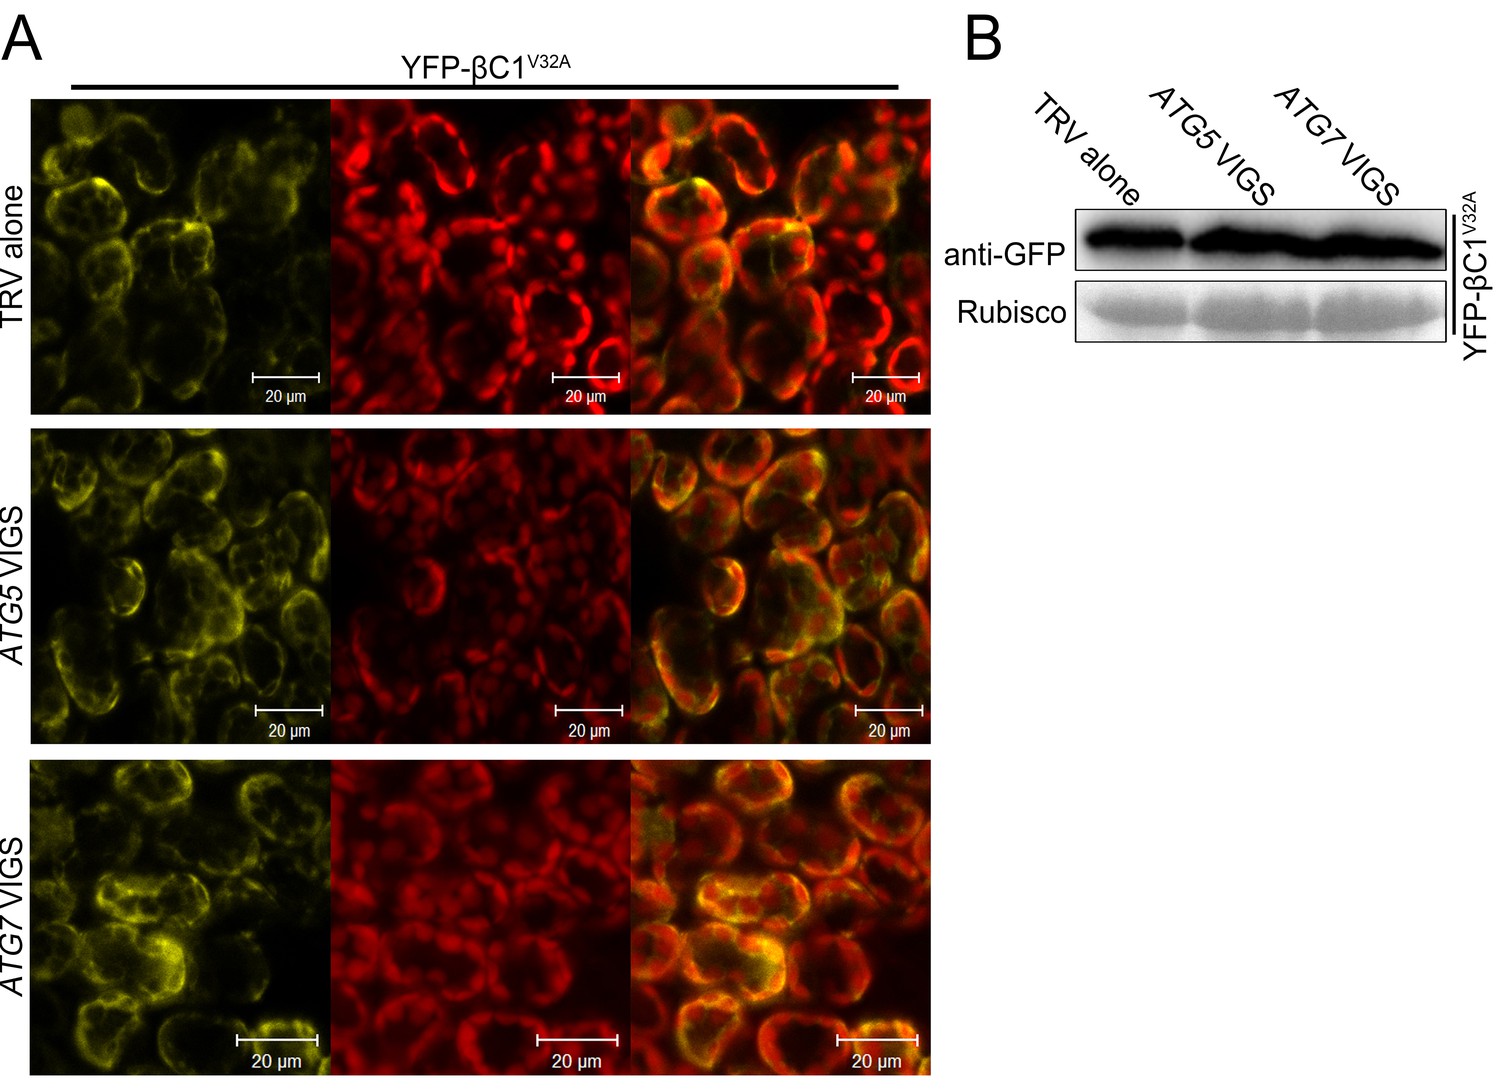
Silencing of either ATG5 or ATG7 has no effect on localization of YFP-βC1V32A.
(A) Confocal microscopy images of YFP-βC1V32A in mesophyll cells of N. benthamiana leaves. YFP-βC1 was transiently expressed in non-silenced control (TRV alone), ATG5 or ATG7 silenced plants. The confocal microscope images of mesophyll cells were taken at 60 hpi. (B) Western blot analyses of YFP-βC1V32A construct from the same experiments as in (A). Level of the fusion protein, YFP-βC1V32A, was detected with anti-GFP polyclonal antibody.
Figure 5—figure supplement 2
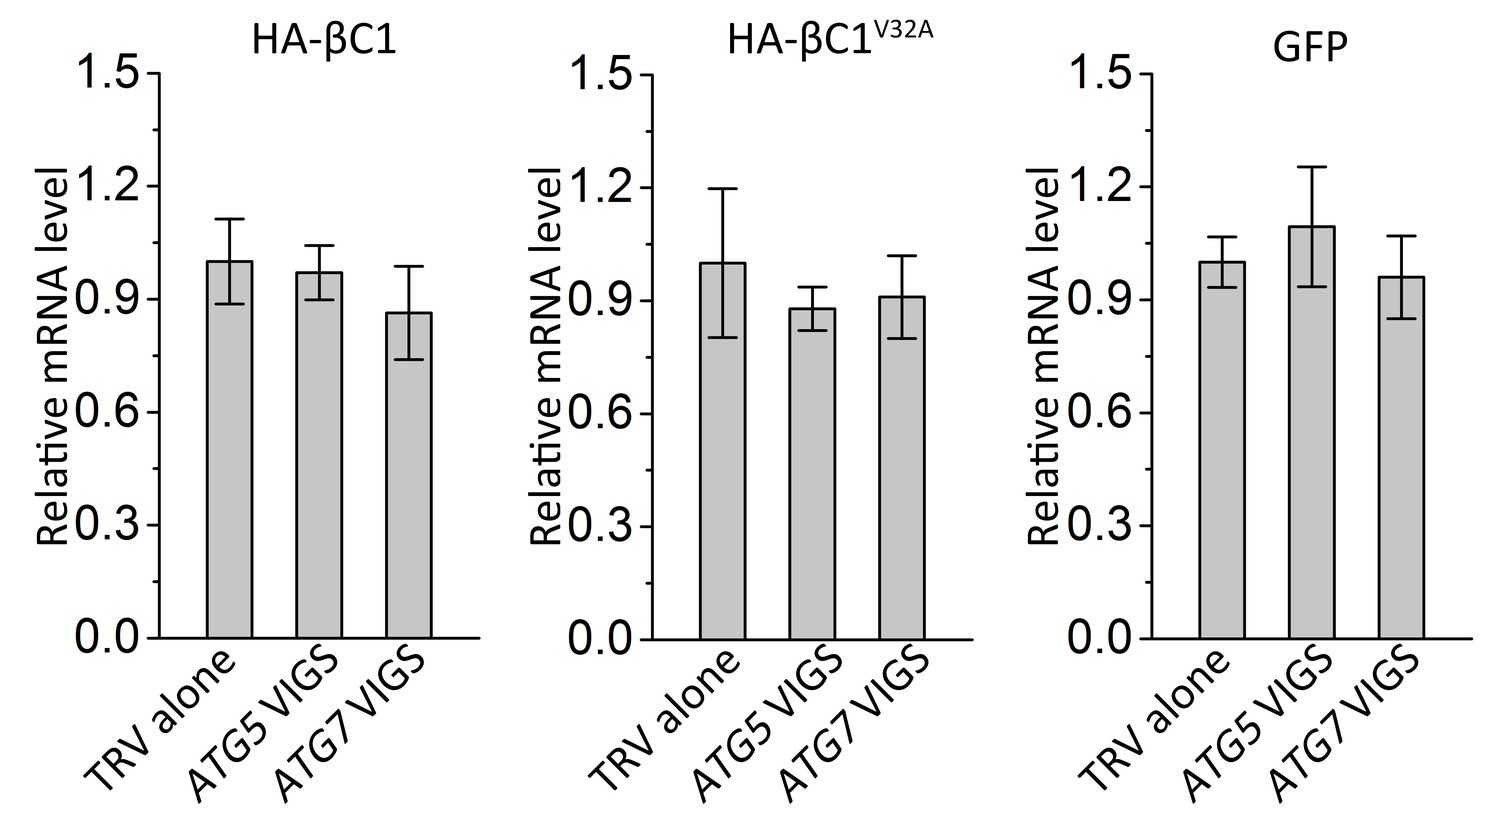
Silencing of either ATG5 or ATG7 has no effect on transcript levels of target genes.
Real-time RT-PCR was performed to detect mRNA levels of target genes using gene-specific primers and total RNAs extracted from the infiltrated leaves of different plants. eIF4α was used as an internal control. Expression data relative to TRV alone groups are normalized to that of eIF4α. Values are means ± SE from three independent experiments. (*) p<0.05.
Figure 6
Autophagy regulates viral infection of TYLCV and TYLCCNV.
(A) Viral symptoms in ATG5- and ATG7-silenced plants at 12 dpi. Bar represents 7 cm. (B) Viral symptoms in GAPCs–silenced (GAPCs VIGS) plants at 15 dpi. Bar represents 7 cm. (C) and (D) Relative viral DNA accumulation in ATG5- and ATG7-silenced plants. Real-time PCR analysis of V1 gene from TYLCCNV (C) or TYLCV (D) was used to determine viral DNA level in infected or control (TRV alone) plants. Values represent means ± SE from three independent experiments. (*) p<0.05. (E) and (F) Relative viral DNA accumulation in GAPCs–silenced plants. Real-time PCR analysis of V1 gene from TYLCCNV (E) or TYLCV (F) was used to determine viral DNA level in infected or control (TRV alone) plants. Values represent means ± SE from three independent experiments. (*) p<0.05. (G), (H), (I) and (J). The incidence of symptom appearance at different time points of post infection in VIGS plants. Symptom was indicated as the appearance of curled leaf caused by TYLCCNV in ATG5- and ATG7-silenced (G) and GAPCs–silenced (I) plants or TYLCV infection in ATG5- and ATG7-silenced (H) and GAPCs–silenced (J) plants. Values represent means ± SE from three independent experiments.
Figure 7
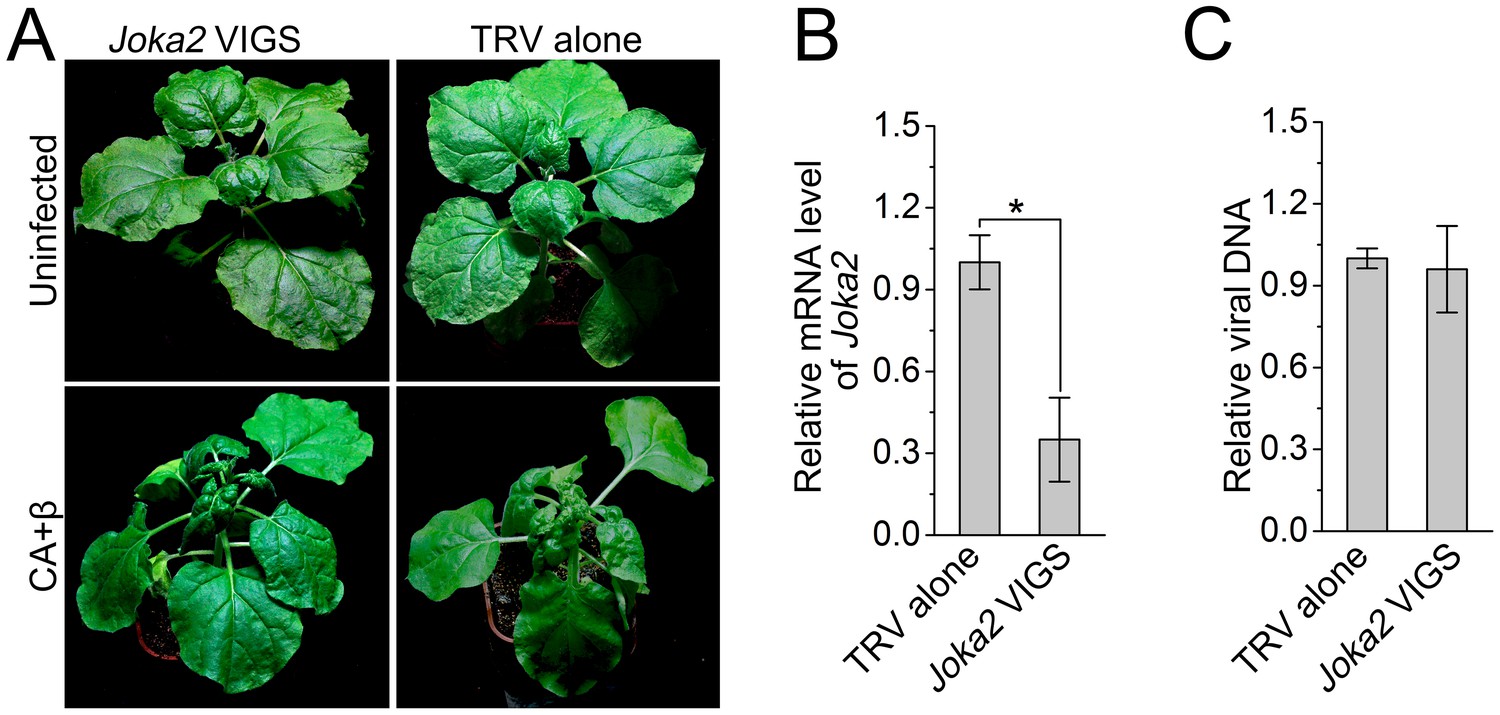
Silencing of Joka2, a plant selective autophagy cargo receptor, has no effect on CLCuMuV infection.
(A) Viral symptoms in Joka2-silenced N. benthamiana at 12 dpi. (B) mRNA level of Joka2 was reduced in Joka2-silenced plants. Real-time RT-PCR of Joka2 was used to determine mRNA level. Values represent means ± SE from three independent experiments. (*) p<0.05. (C) Relative viral DNA accumulation in Joka2–silenced plants. Real-time PCR analysis of CLCuMuV V1 gene was used to determine viral DNA level. Values represent means ±SE from three independent experiments. (*) p<0.05.
Videos
Video 1
βC1- NbATG8f Interaction Is Localized in Vacuoles.
nYFP-βC1 transiently expressed with cYFP-NbATG8f in N. benthamiana leaves and examined by confocal laser scanning microscopy at 60 hpi. Yellow color represents YFP fusion fluorescence and red color for chlorophyll.
Video 2
βC1 Is Co-localized with NbATG8f.
YFP-βC1 transiently expressed with CFP-NbATG8f in N. benthamiana leaves and examined by confocal laser scanning microscopy at 60 hpi. Cyan color represents CFP-ATG8f, yellow color YFP-βC1 and red color for chlorophyll.
Download links
A two-part list of links to download the article, or parts of the article, in various formats.
Downloads (link to download the article as PDF)
Open citations (links to open the citations from this article in various online reference manager services)
Cite this article (links to download the citations from this article in formats compatible with various reference manager tools)
Autophagy functions as an antiviral mechanism against geminiviruses in plants
eLife 6:e23897.
https://doi.org/10.7554/eLife.23897


