Elucidation of the anti-autophagy mechanism of the Legionella effector RavZ using semisynthetic LC3 proteins
- Zhongshan School of Medicine, Sun Yat-Sen University, China
- Chemical Genomics Centre of the Max Planck Society, Germany
- Max-Planck-Institute of Molecular Physiology, Germany
Figures
Figure 1 with 1 supplement
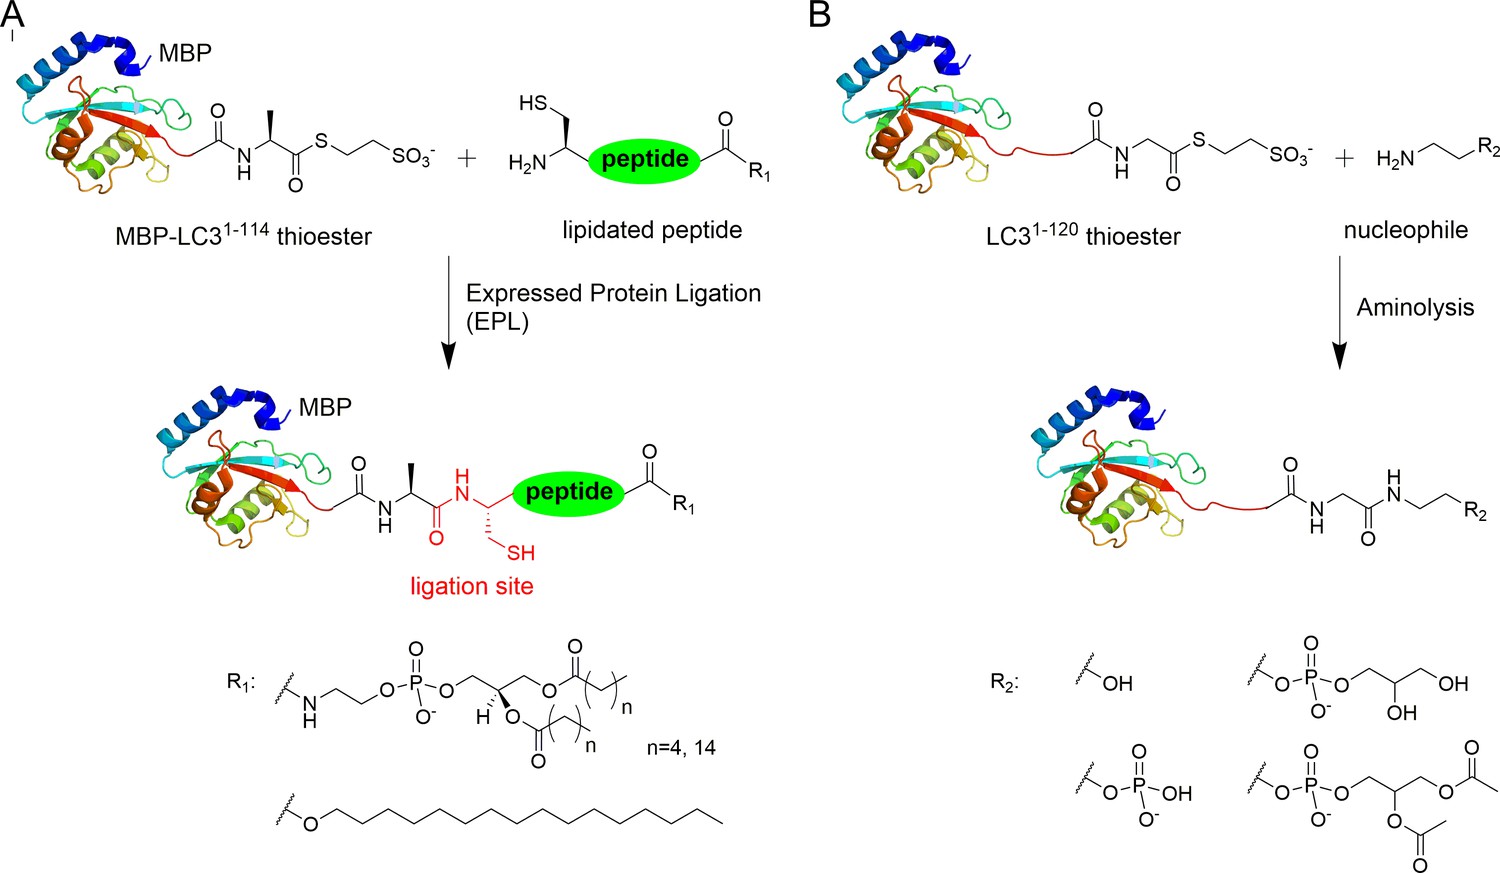
Semisynthesis of LC3 proteins with various C-terminal modifications.
(A) Strategy for the semisynthesis of lipidated LC3 proteins using expressed protein ligation (EPL). (B) Strategy for the semisynthesis of LC3 proteins containing soluble fragments of PE by direct aminolysis.
Figure 1—figure supplement 1
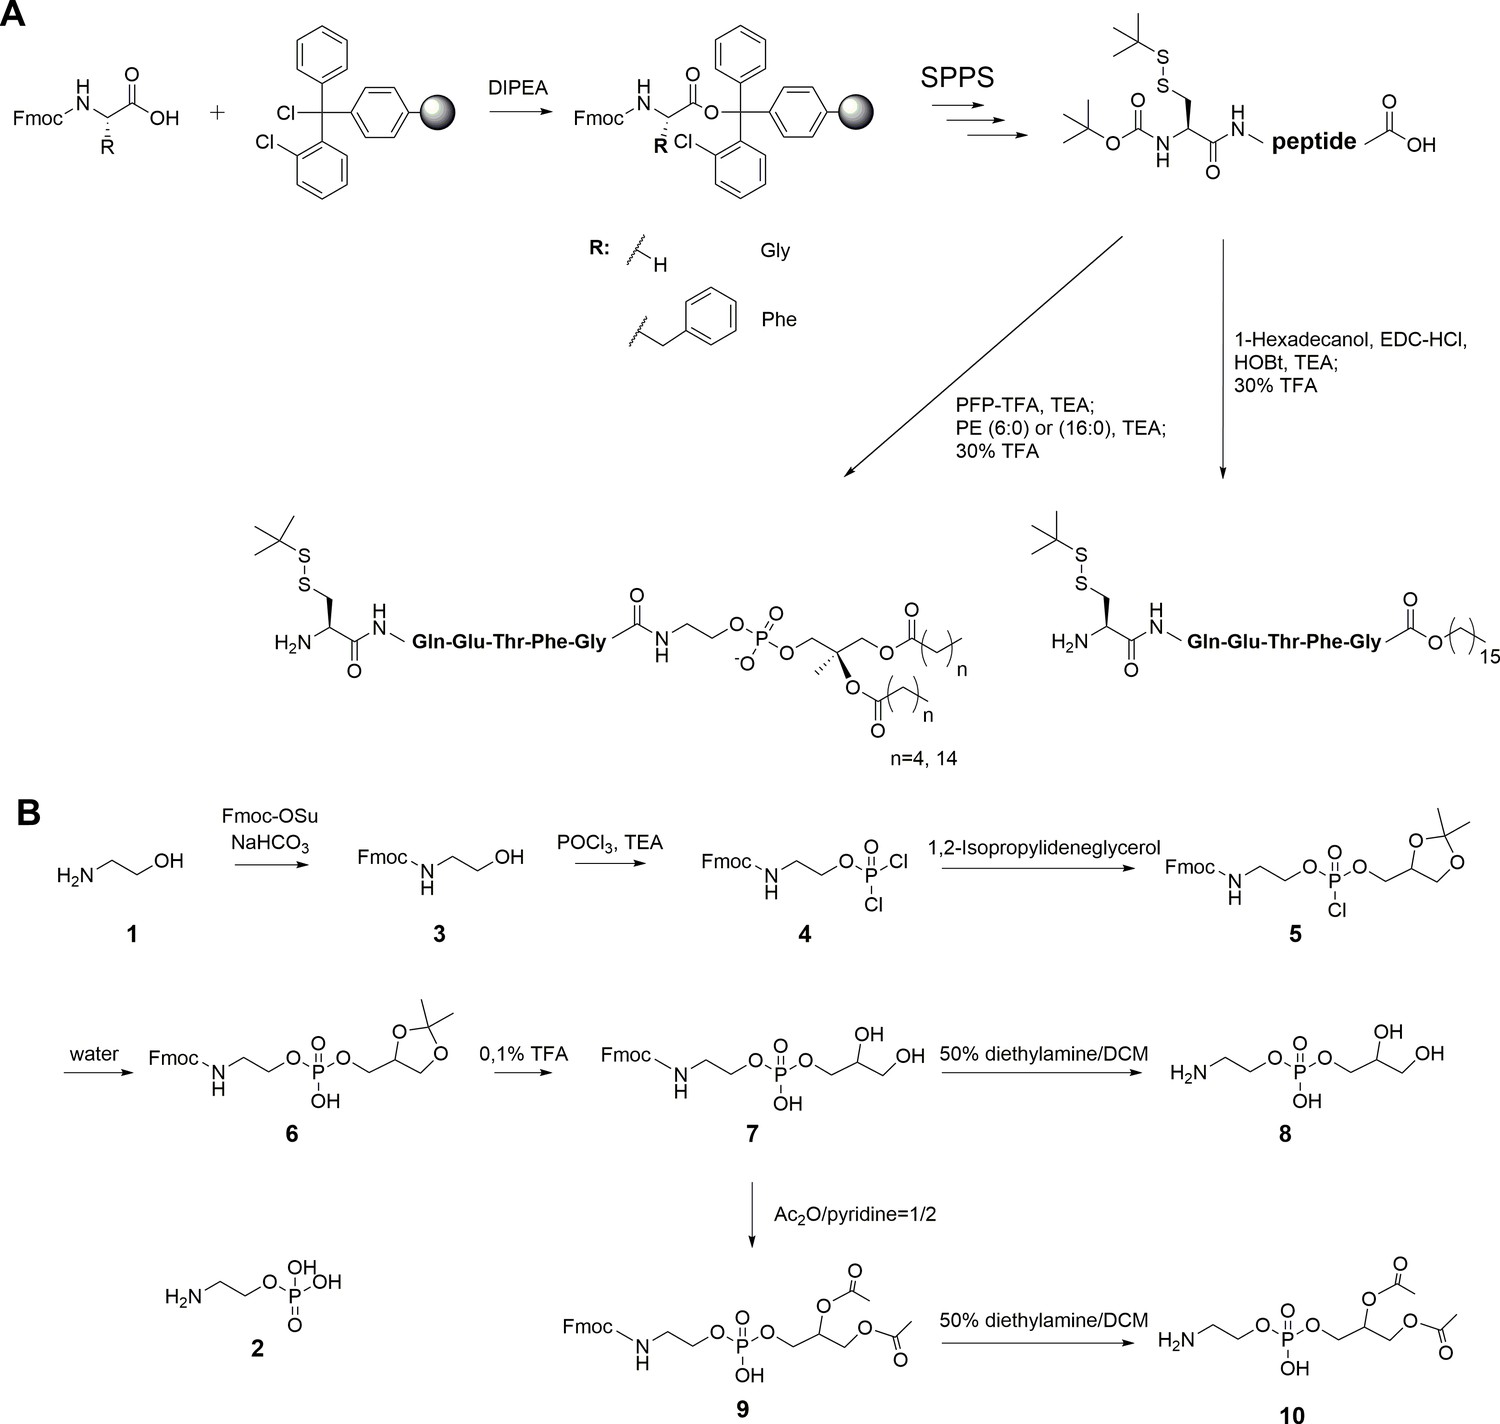
Synthesis of peptides and PE fragments.
(A) Synthesis of C-terminal lipidated peptides of LC3. (B) Chemical synthesis of compounds 8 and 10.
Figure 2 with 2 supplements
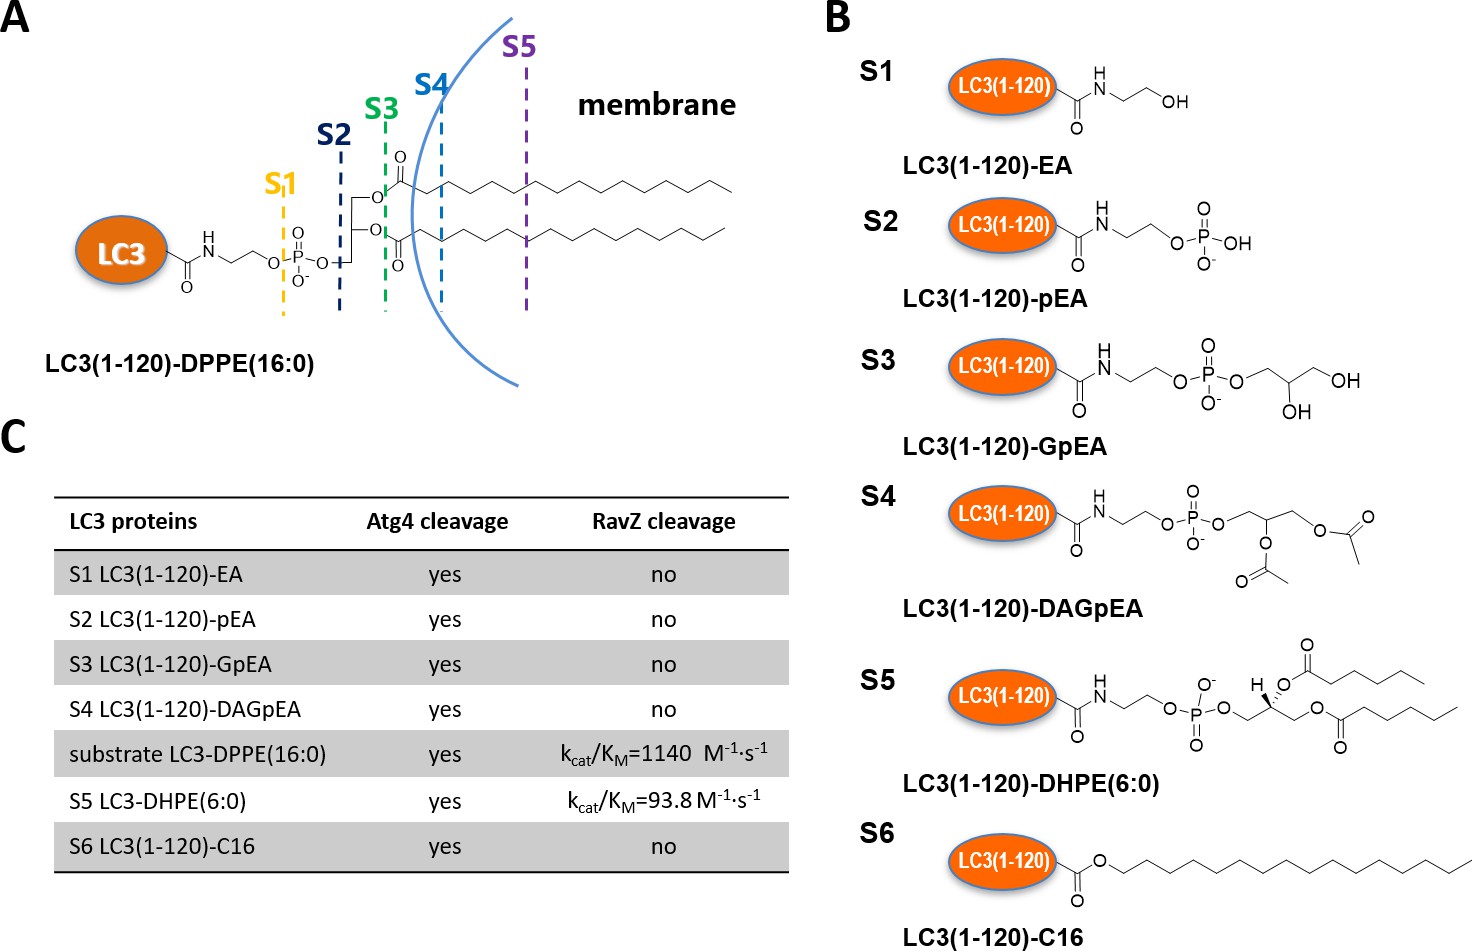
Structure-function relationship of LC3-deconjugation by RavZ.
(A) Schematic diagram of proteo-membrane containing LC3-PE. The fatty acid chains of PE are buried in the lipid bilayer, serving as the membrane anchor. (B) LC3 proteins containing different fragments derived from the PE. Ethanolamine, EA; phosphoethanolamine, pEA; glycerophosphoethanolamine, GpEA and diacetyl glycerophosphoenthanolamine, DAGpEA. (C) In vitro cleavage of semisynthetic LC3 proteins by Atg4B and RavZ.
Figure 2—figure supplement 1
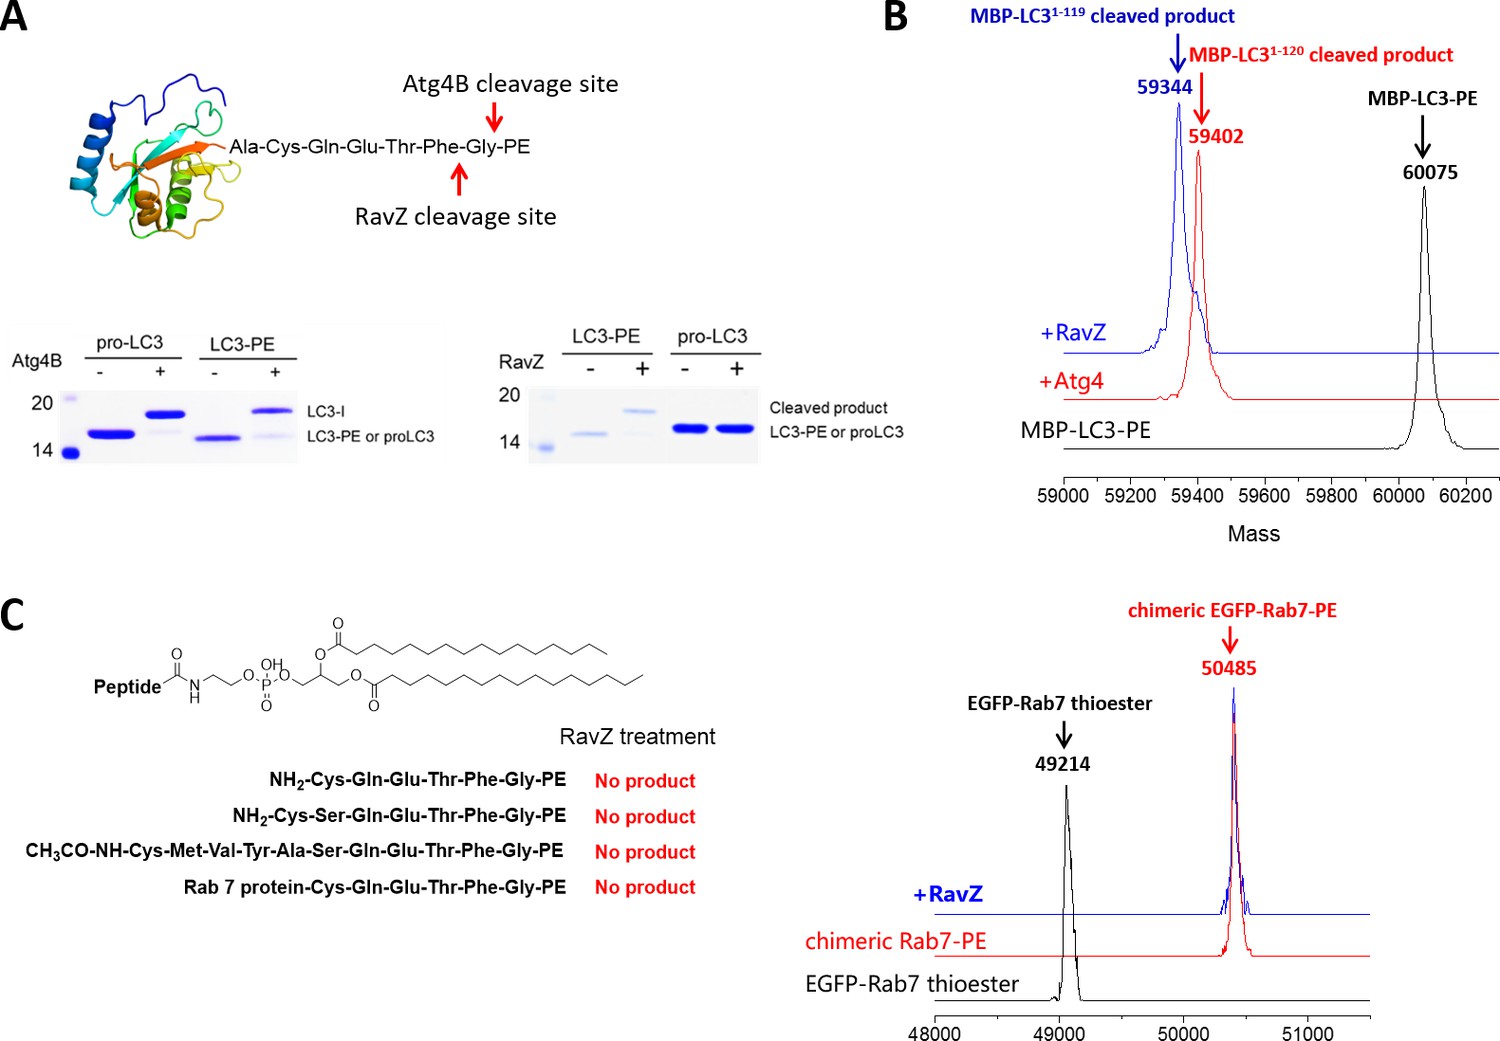
In vitro cleavage of LC3 proteins with various C-terminal modifications.
(A) In vitro LC3 cleavage assay by SDS-PAGE. RavZ only cleaves LC3-PE but not pro-LC3, while Atg4B processes both of them. (B) RavZ and Atg4 deconjugate LC3-PE at different sites. ESI-MS spectra of MBP-LC3-PE before and after Atg4B and RavZ treatments were shown. MBP-LC3-PE, Mw calculated 60078, found 60075; MBP-LC31–120, Mw calculated 59391, found 59402; MBP-LC31–119, Mw calculated 59344, found 59344. (C) The C-terminal lipidated peptide of LC3-PE is insufficient for RavZ proteolysis. The C-terminal lipidated peptide of LC3-PE and chimeric PE-modified Rab7 were subjected to RavZ treatment. The lipidated peptides were solved in the HEPES buffer containing detergent (30 mM HEPES 7.4, 50 mM NaCl, 2 mM DTT, 0.1% Triton X-100). RavZ (2 µM) was added to the peptide solution (2 µM) and chimeric PE-modified Rab7 (7 µM). After overnight incubation at 37°C, the reactions were subjected to LC-MS. No cleavage products were observed in these conditions. Right panel shows ESI-MS spectra of EGFP-Rab7 thioester, EGFP-Rab7-PE chimeric protein and RavZ-treated EGFP-Rab7-PE. Chimeric EGFP-Rab7-PE protein, Mw calculated 50500, found 50485.
Figure 2—figure supplement 2
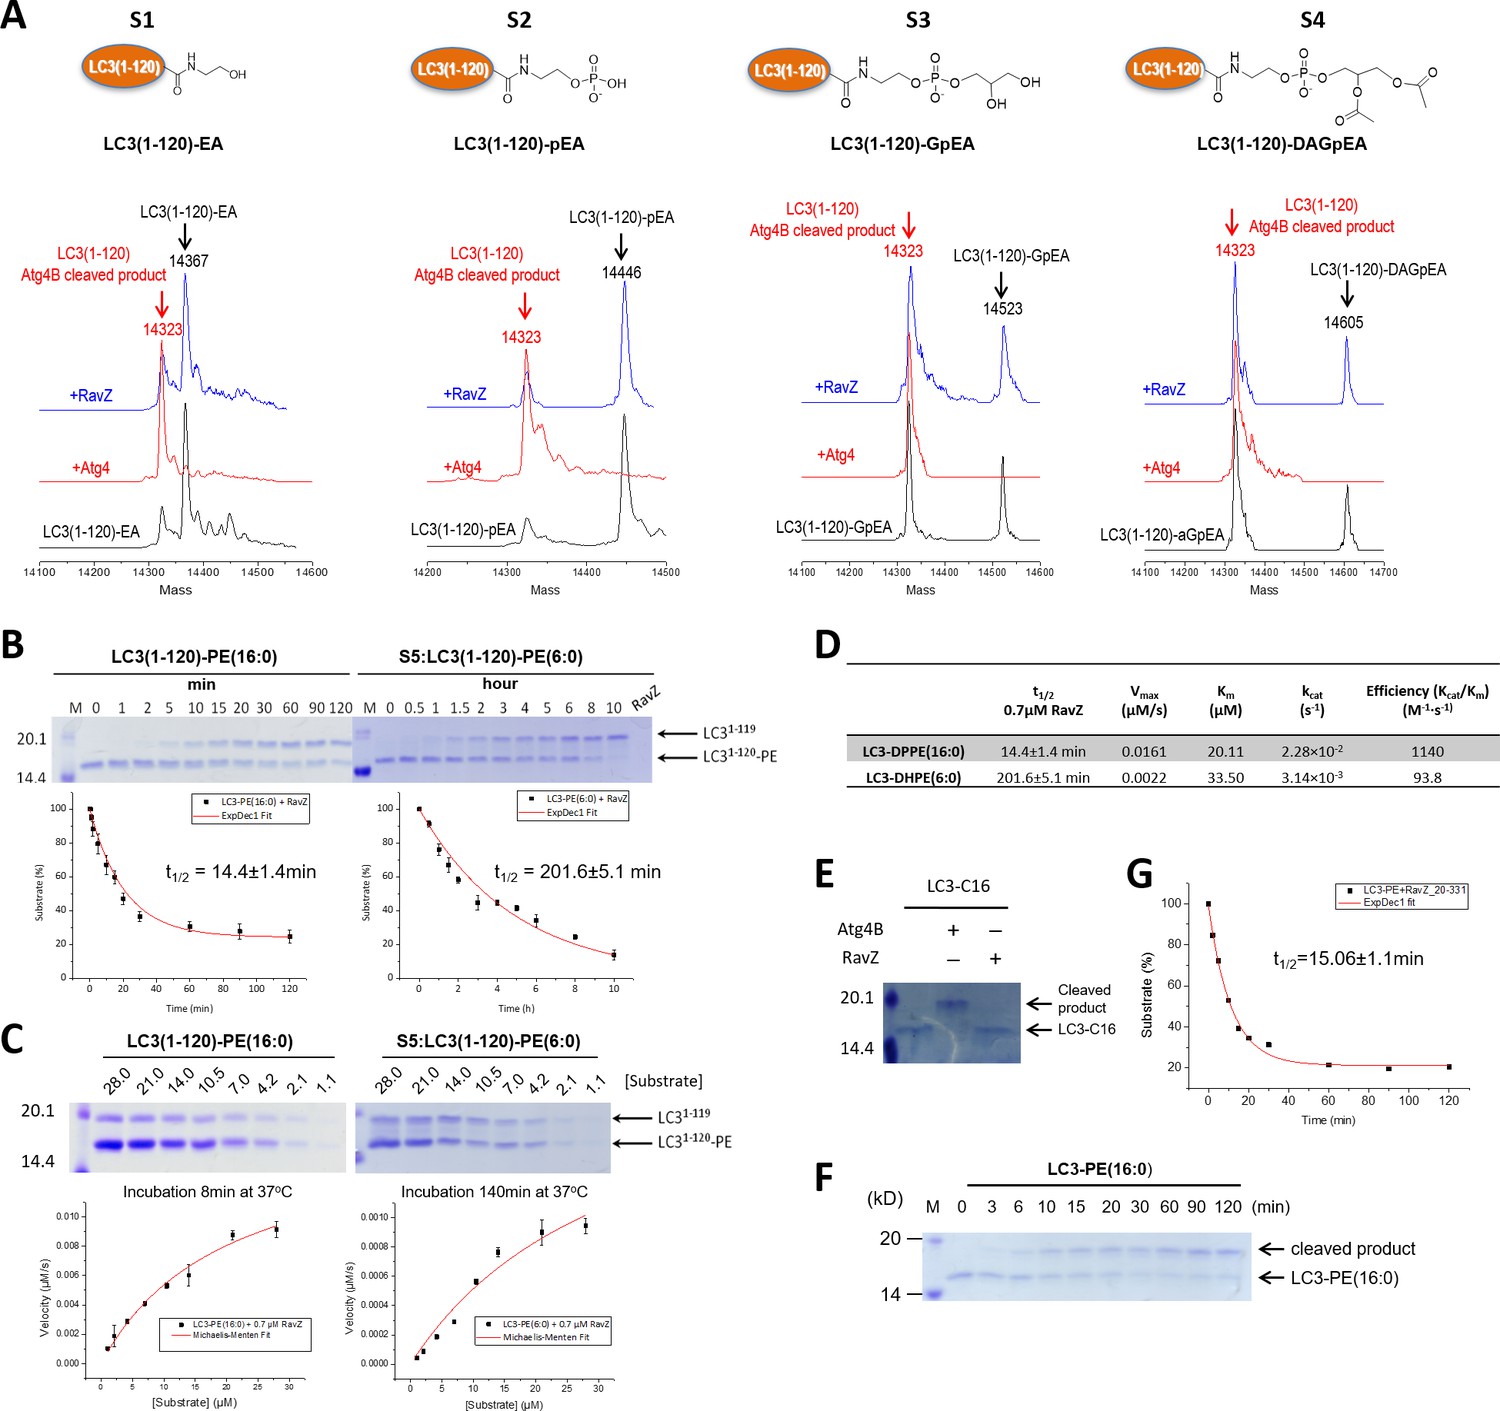
Structure-function relationship study of LC3-deconjugation by RavZ.
(A) ESI-MS spectra of modified LC3 (S1–S4) before (black line) and after Atg4B (red line) or RavZ treatment (blue line). 0.7 µM LC3 proteins were incubated with 0.7 µM Atg4B or RavZ for 8 hr at 37°C. (B) Kinetics of RavZ-medicated cleavage reactions with LC3-PE (16:0) and LC3-PE (6:0) (S5). 7 µM LC3-PE (16:0) or LC3-PE (6:0) was incubated with RavZ (0.7 µM) at 37°C. The reaction was quenched at different time points and subjected to SDS-PAGE. The graphs in the lower panel show reaction progress. The red solid line shows the fitting to a single-exponential equation to obtain t1/2. (C) Enzyme kinetics of RavZ reaction. Varying concentrations of LC3-PE (16:0) or LC3-PE (6:0) were incubated with RavZ (0.7 µM) for 8 min or for 140 min at 37°C, respectively. The reaction was quenched and subjected to SDS-PAGE. In the lower panel, the reaction rates were plotted against substrate concentrations. The red solid line shows the fitting to Michaelis-Menten equation. (D) Summary of Michaelis-Menten kinetic parameters. n = 3 independent experiments. Mean and SD are presented. (E) In vitro cleavage assay of LC3-C16 (S6). LC3-C16 was treated with Atg4B or RavZ (0.7 µM) at 37°C for 2 hr and subjected to SDS-PAGE. (F) Kinetics of RavZ20-331-medicated cleavage reaction with LC3-PE (16:0). The same conditions were used as in (B). (G) The exponential decay curve showing the half-time (t1/2) of LC3-PE cleavage activity of RavZ20-331. n = 3 independent experiments. Mean and SD are presented.
Figure 3 with 1 supplement
RavZ extracts LC3-PE from membranes.
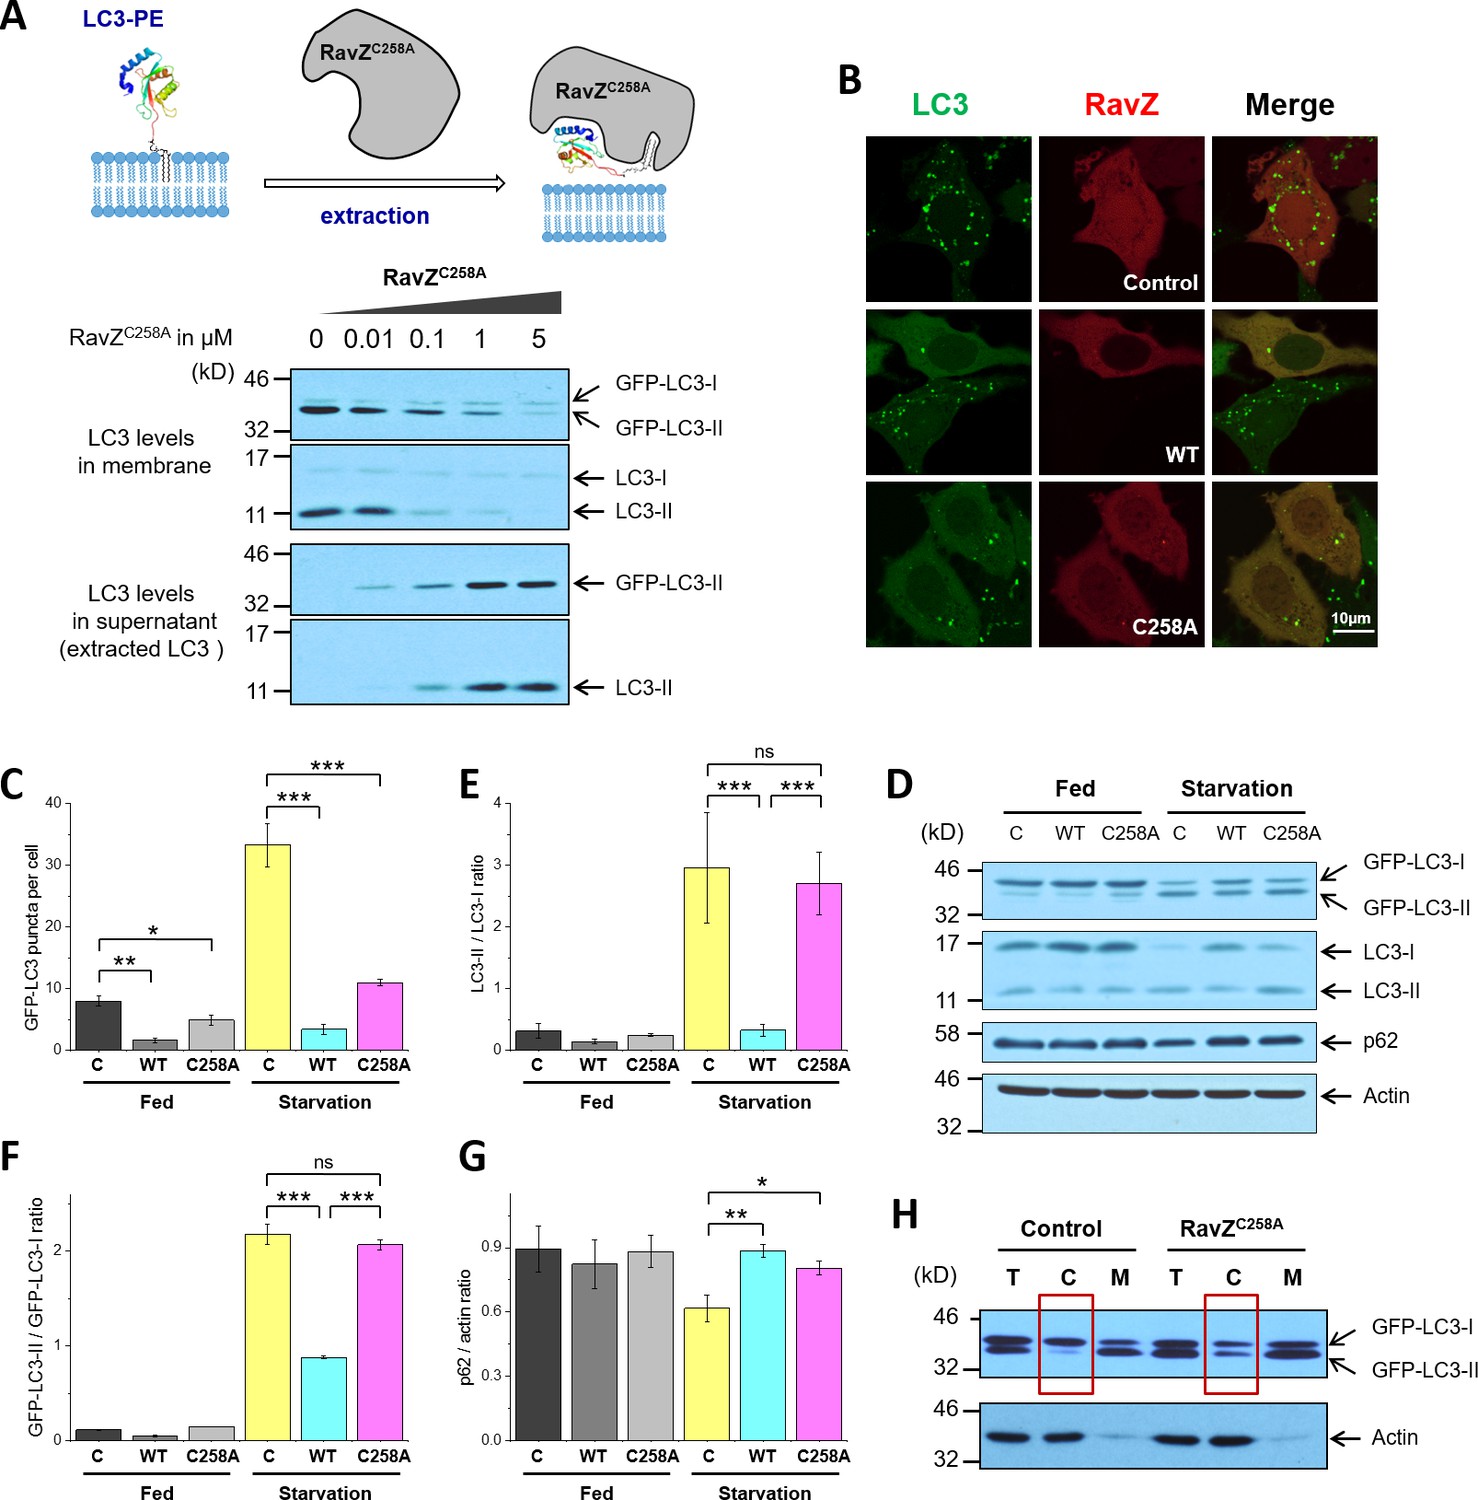
(A) LC3-PE extraction assay. Endogenous LC3-PE and GFP-LC3-PE on membranes from GFP-LC3 stable cells (20 µg) were treated with increasing concentrations of recombinant RavZC258A. After incubation for 2 hr at 37°C, the membrane and soluble fractions were separated by ultracentrifuge and subjected to western blotting with LC3-specific antibody. Upper panel shows the schematic diagram of LC3-PE extraction by RavZC258A. (B) Confocal microscopy of GFP-LC3 stable cells transfected with mCherry-RavZ constructs. Cells were treated for 2 hr under starvation medium (EBSS). A complete set of images for GFP-LC3 cells transfected with all mCherry-RabZ constructs (WT, C258A, and their mutants) are shown in Figure 6—figure supplement 2A and B. (C) Quantification of GFP-LC3 puncta shown in (B). n = 21–32 cells. Mean and SD are presented; ***p<0.001, *p<0.05. (D) Effect of RavZ on LC3-II level in cells. GFP-LC3 stable cells were transfected with wild-type RavZ (WT) and RavZC258A and cultured either in growth or in starvation medium. (E–G) Quantification of ratio of endogenous LC3-II to LC3-I (E), GFP-LC3-II to GFP-LC3-I (F) and p62 to actin (G) in (D). n = 3 independent experiments. Mean and SD are presented; ***p<0.001, *p<0.05, ns: not significant. (H) Validation of LC3-PE extraction by RavZ in the cell. GFP-LC3 stable cells were transfected with RavZC258A. After starvation, cells were lysed. Membrane fractionation was performed by ultracentrifuge. The membrane and soluble fractions were subjected to western blotting.
Figure 3—figure supplement 1
Membrane binding and α3 are required for extraction activity of RavZ.
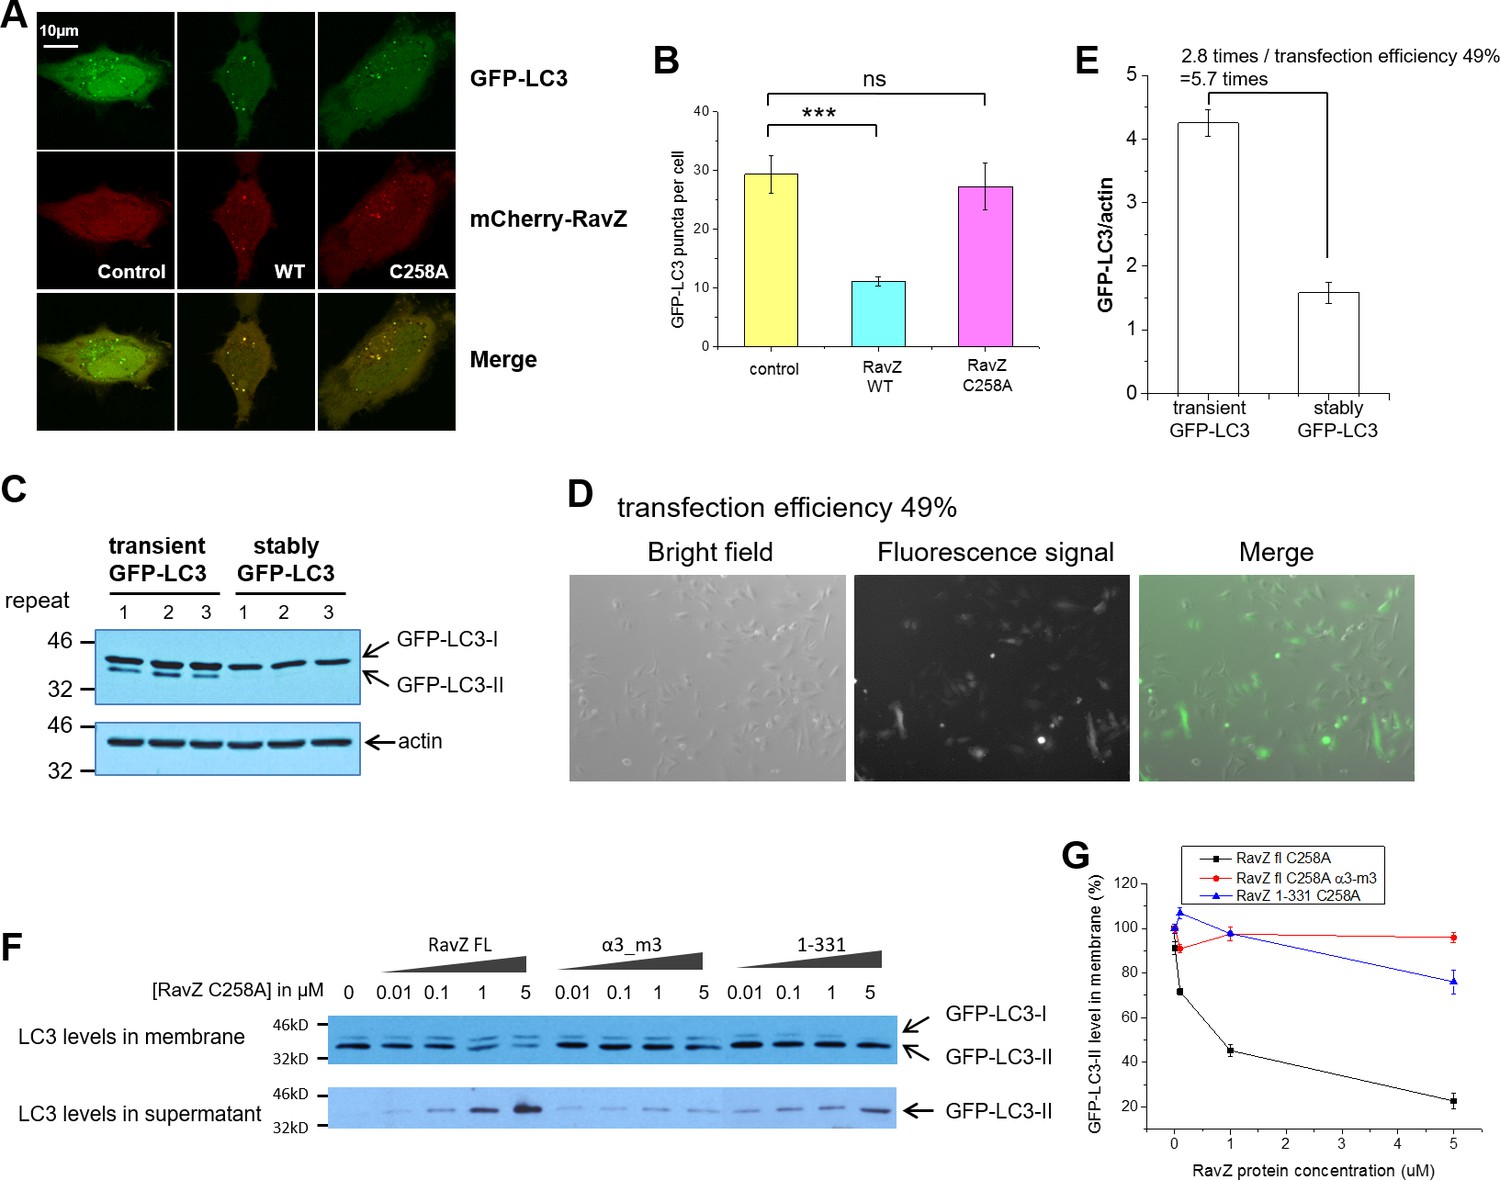
(A) Confocal microscopy of HeLa cells co-transfected with GFP-LC3 and mCherry-RavZ constructs after starvation for 2 hr in EBSS. (B) Quantification of GFP-LC3 puncta in (A). n = 25–30 cells. Mean and SD are presented; ***p<0.001, ns: not significant. (C) GFP-LC3 expression levels in stable and transient cells by western blot. (D) Fluorescence microscopy of GFP-LC3 transiently transfected cells. The percentage of transfection efficiency = (number of cells stained with fluorescent/total number of cells per field) X 100. (E) Quantification of the ratio of transient and stable GFP-LC3 expression level to actin in (C). n = 3. Mean and SD are presented. (F) LC3-PE extraction assay. GFP-LC3-PE on membranes from GFP-LC3 stable cells (20 µg) was treated with increasing concentrations of recombinant RavZC258A, α3-m3 (C258A) mutant or 1-331(C258A) fragment. After incubation for 2 hr at 37°C, the membrane and soluble fractions were separated by ultracentrifuge and subjected to Western blotting with LC3-specific antibody. (G) Quantification of the LC3-II level in membrane and supernatant fractions in (F). n = 3 independent experiments. Mean and SD are presented.
Figure 4 with 1 supplement
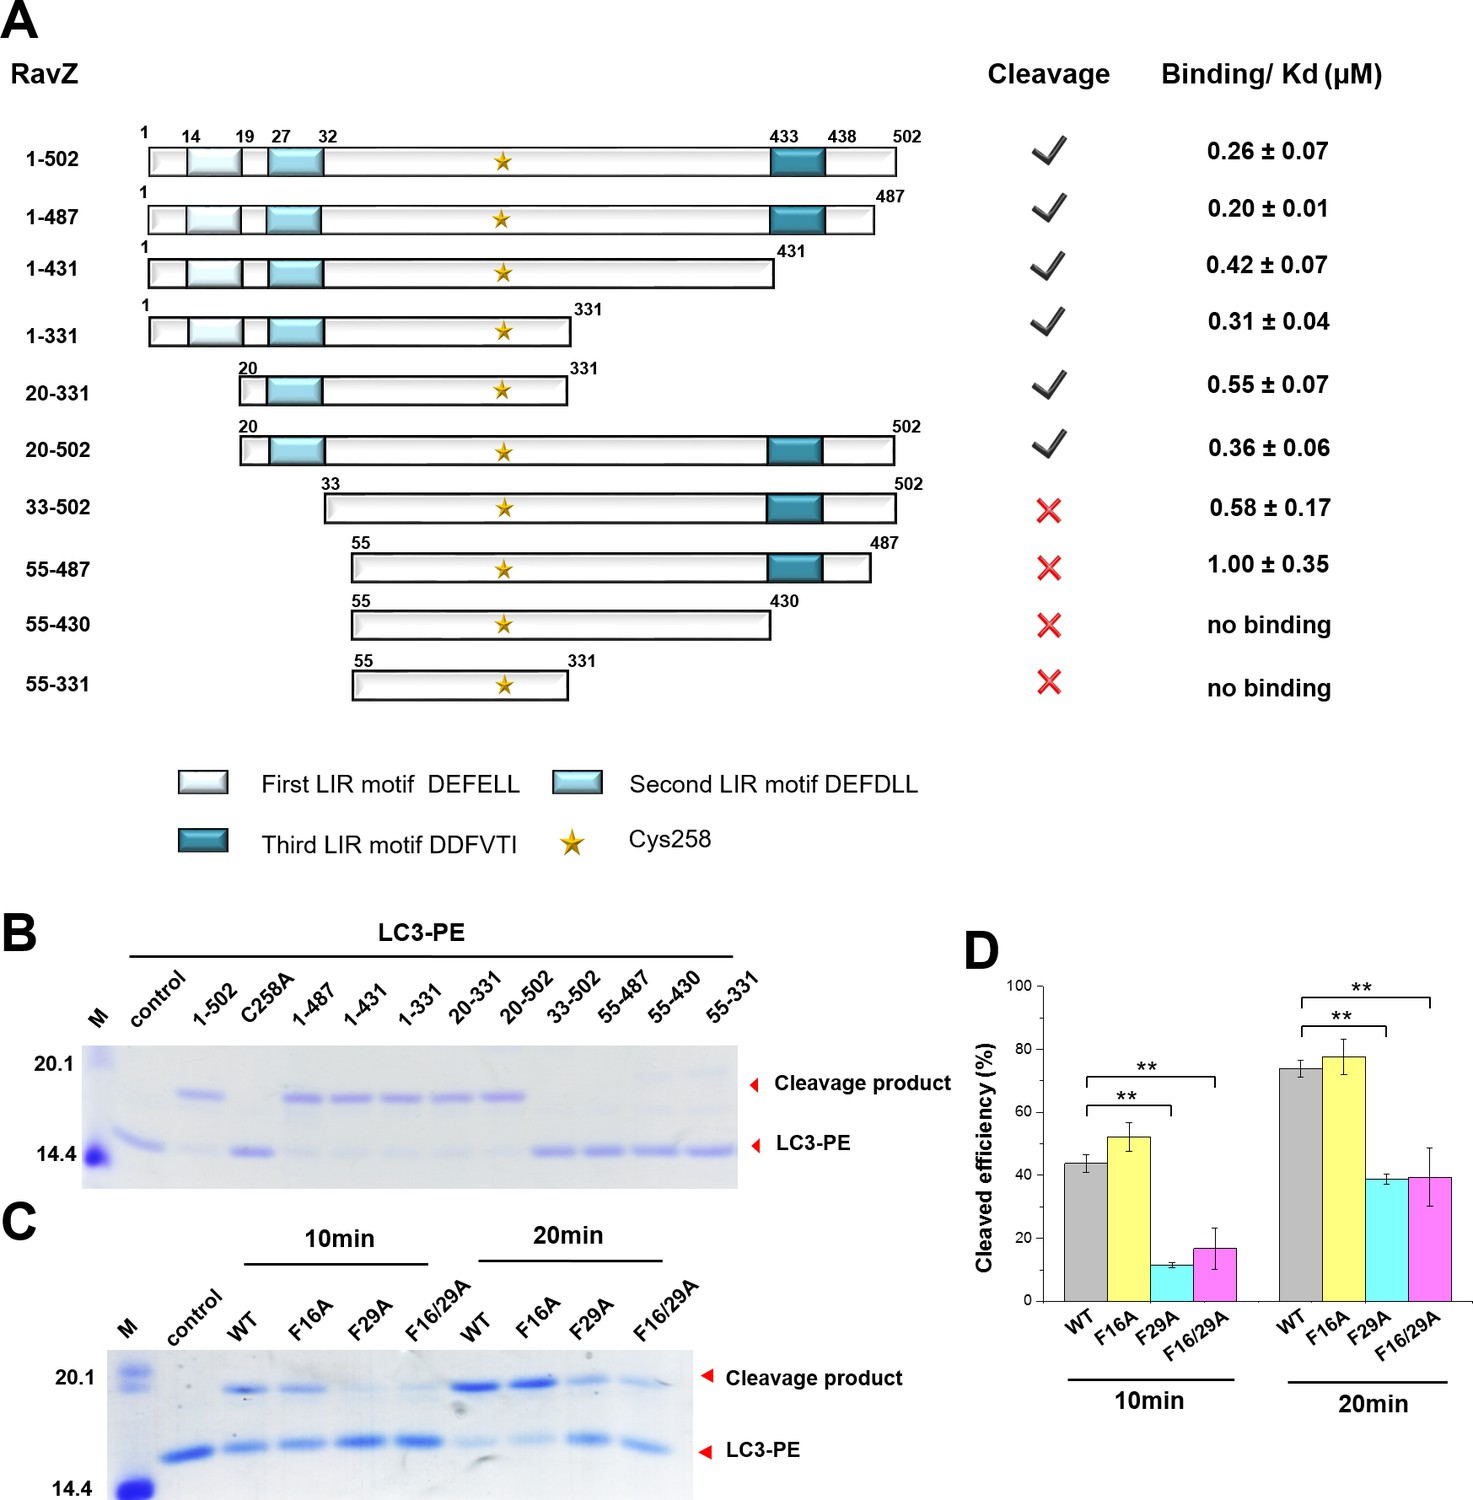
The LIR motif is essential for RavZ:LC3 binding and cleavage activity of RavZ.
(A) Schematic diagram of RavZ fragments showing LIR motifs and the catalytic residue Cys258. Binding and cleavage activities of the fragments are shown. (B) In vitro LC3-PE cleavage assay of the RavZ fragments. (C) In vitro LC3-PE cleavage assay of RavZ containing LIR mutations. The LC3-PE protein (7 µM) was treated with RavZ mutants (700 nM) at 37°C for 10 min or 20 min and then resolved by SDS-PAGE. (D) Quantification of the LC3-PE cleavage in (C). n = 3 independent experiments. Mean and SD are presented; **p<0.01.
Figure 4—figure supplement 1
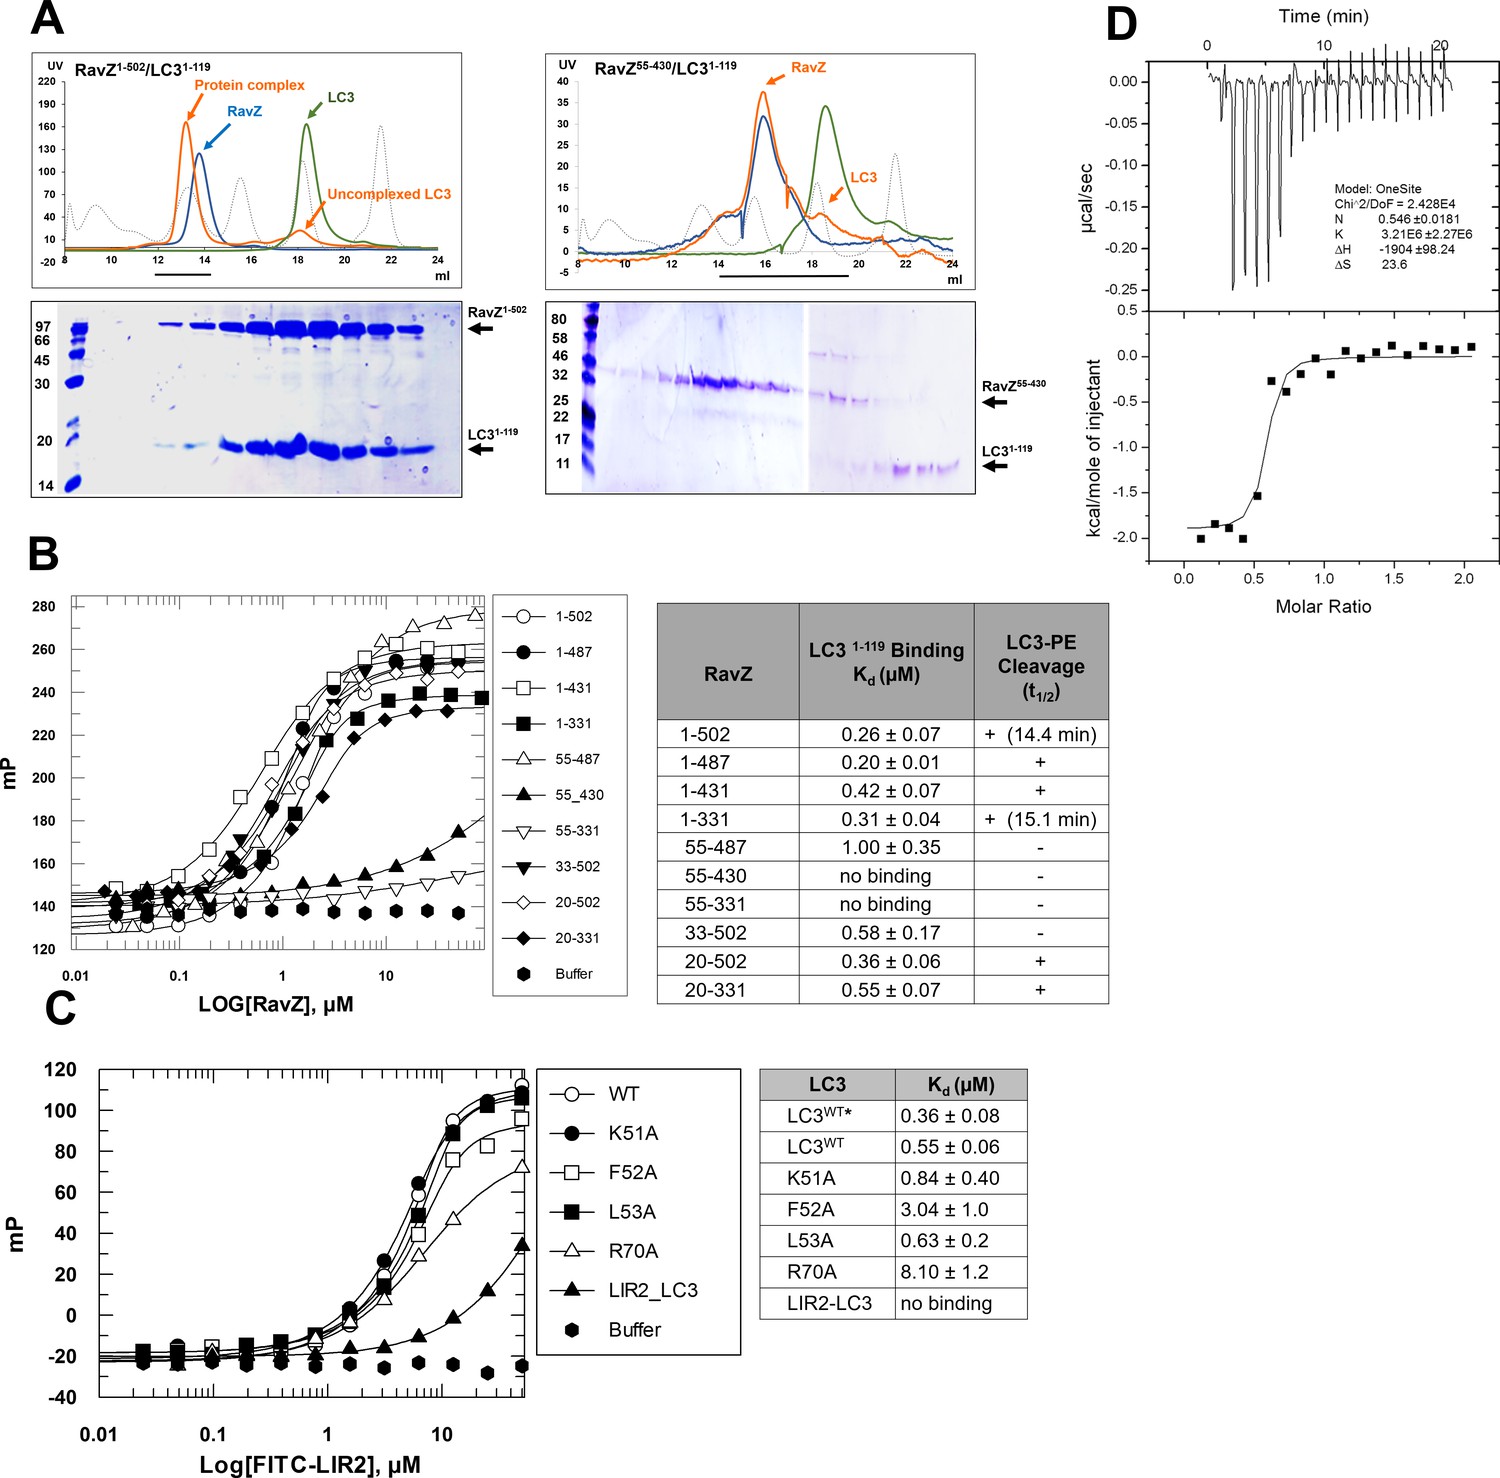
LIR2 is required for RavZ:LC3 interaction.
(A) Gel filtration analysis of complex formation of LC31–119 with RavZ1–502 or RavZ55-430. Orange line indicates elution profile of the mixture of RavZ and LC3, blue and green lines indicate profiles of RavZ and LC3 alone, respectively. Gray dashed line indicates elution profile of protein markers (from left to right): 670, 158, 44, 17 and 1.3 kDa. The black line underneath the profile indicates collected fractions for SDS-PAGE analysis shown below. (B) Interaction analysis of RavZ fragments with LC31–119 by fluorescence polarization. Dissociation constants are shown in the table (right). (C) Interaction analysis of the FITC-LIR2 peptide with LC3 by fluorescence polarization. Dissociation constants are shown in the table (right). (D) Interaction analysis of LIR2 with LC3 using ITC technique. Upper panel is thermographic binding isotherm and lower panel is the fit of the binding. * The Kd was obtained from three independent ITC experiments.
Figure 5 with 2 supplements
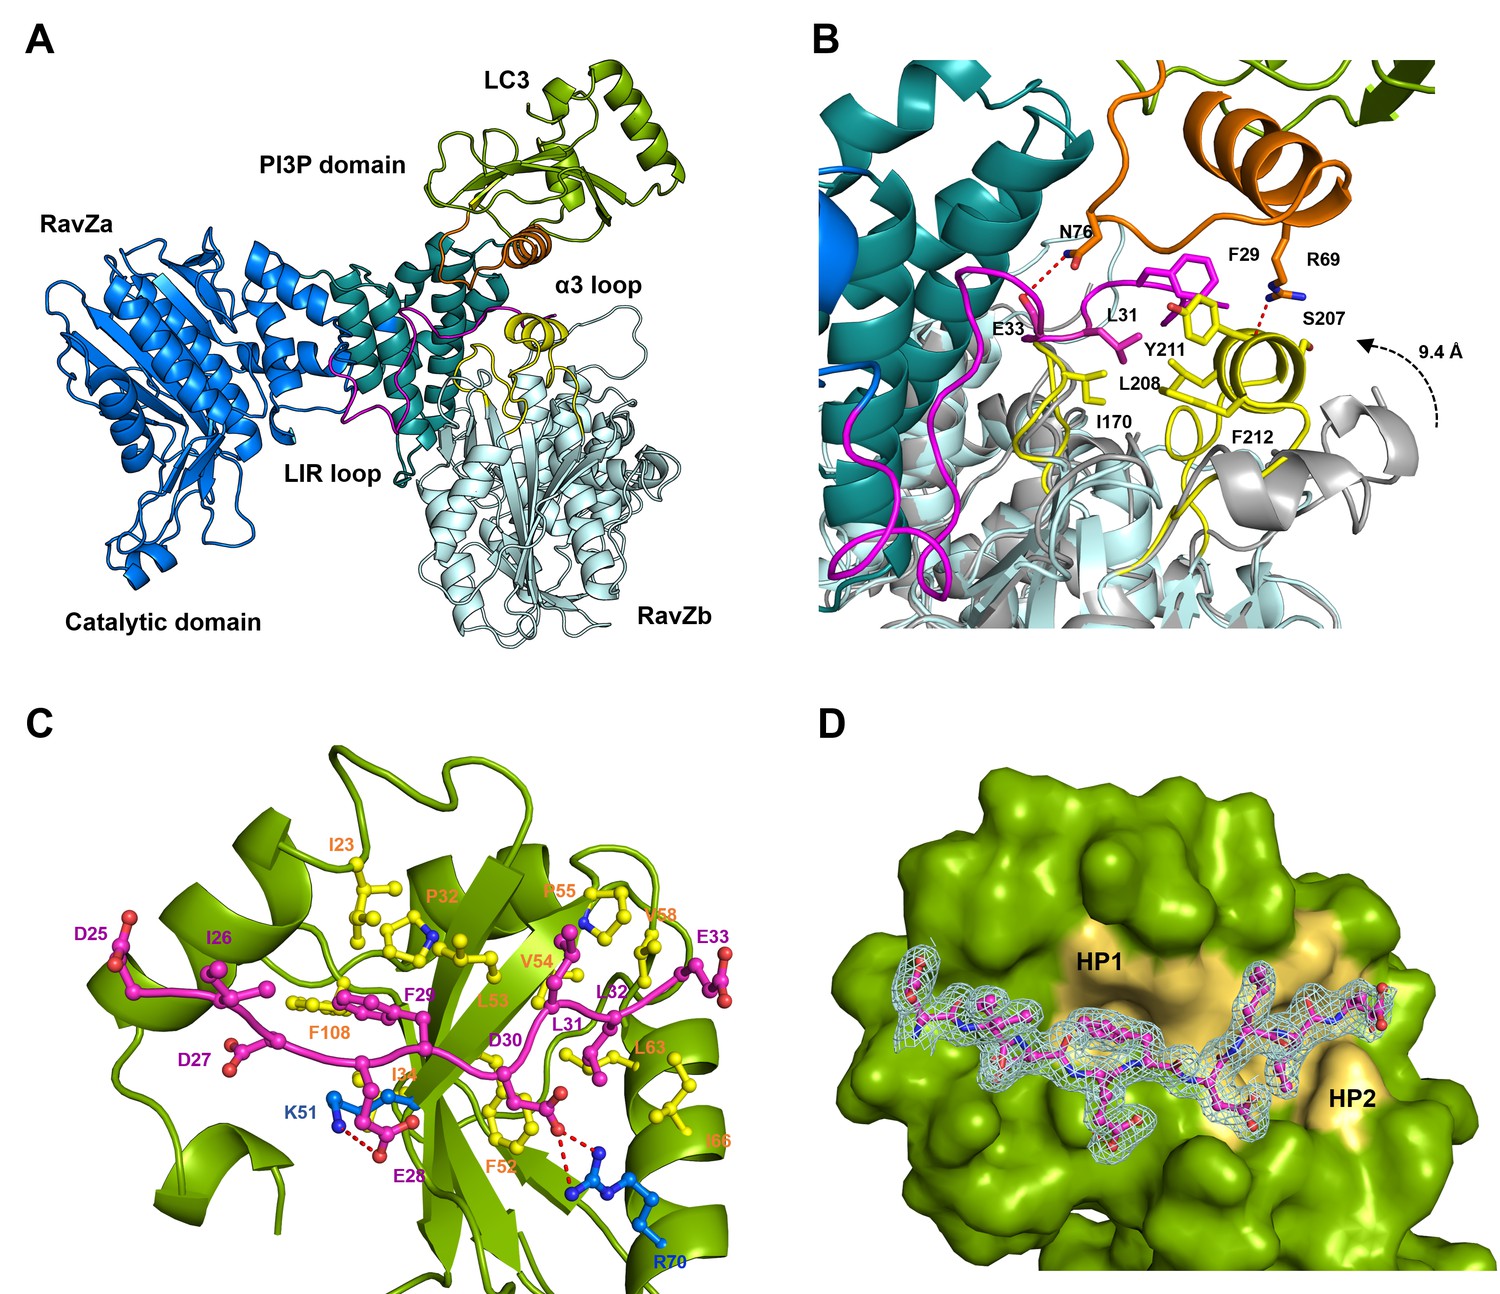
Structural basis of RavZ:LC3 interaction.
(A) Crystal structure of the RavZ:LC3 complex. Catalytic domain, the PIP3-binding domain and the N-terminal loop containing LIR2 of RavZa are shown in blue, teal and pink, respectively. The LC3 molecule is shown in green with its α2 and the α2–β3 loop colored in orange. The symmetry-related RavZ (RavZb) molecule is shown in pale cyan with its α3 and the the β6–β7 loop colored in yellow. (B) Binding interface between LC3 with RavZa and RavZb. Free RavZ structure (gray) is superimposed with RavZb to show the conformational change of α3. Hydrogen bonds are shown as red dashed lines. (C) Crystal structure of the LIR2:LC3 complex. LC3 is colored in green and the LIR2 peptide is coloured in pink. Hydrogen bonds are shown as red dashed lines. (D) Interaction of LIR2 with LC3. LIR peptide is shown as pink stick and LC3 is displayed as surface. Two hydrophobic binding pockets (HP1 and HP2) are shown in pale yellow. The 2Fo–Fc map of the LIR2 motif is contoured density at α of 1.0.
Figure 5—figure supplement 1
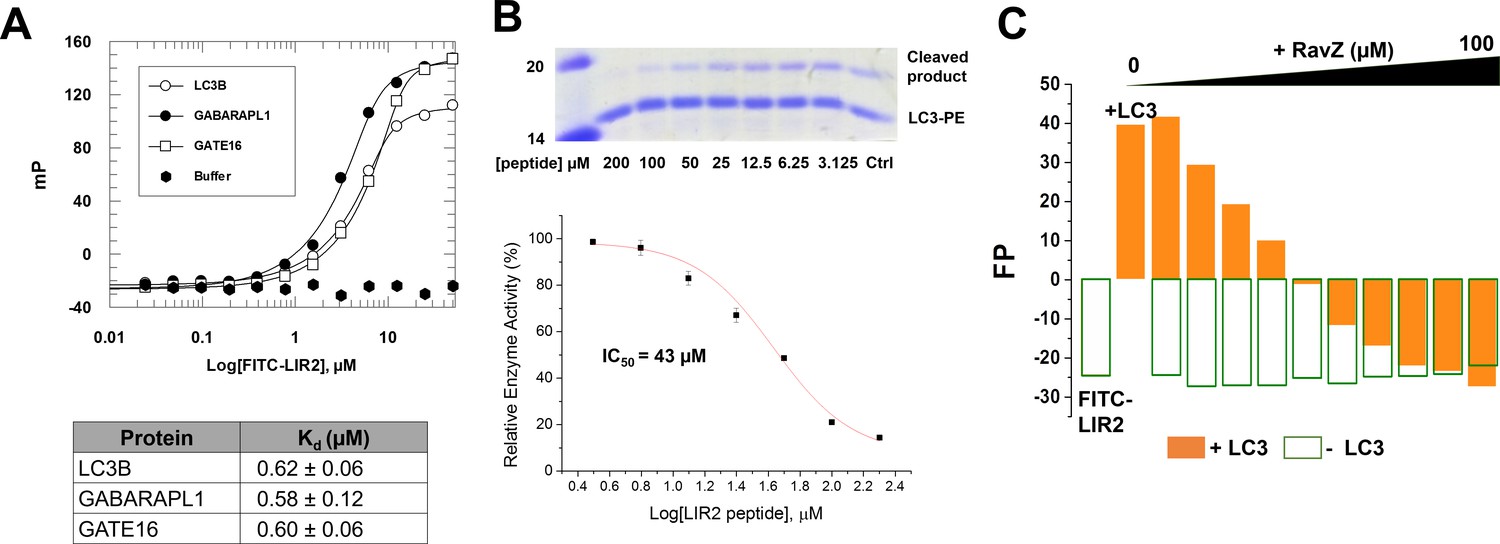
LIR2 is required for RavZ:LC3 interaction.
(A) Interaction analysis of the FITC-LIR2 peptide with LC3, GABARAPL1 and GATE16 by fluorescence polarization. Dissociation constants are shown in the table (below). (B) Inhibition of RavZ activity by the LIR2 peptide. The LC3-PE protein (7 µM) was incubated with different concentrations of LIR2 peptide for 1 hr on ice and was subjected to RavZ (0.7 µM) treatment for 10 min at 37°C. The reaction was resolved by SDS-PAGE. The data were fitted to a sigmoidal equation, leading to IC50 value. n = 3 independent experiments. Mean and SD are presented. (C) Competitive titration assay by fluorescence polarization measurement. 1.25 µM FITC-LIR2 was titrated with 6.25 µM LC3 and then with increasing concentrations of RavZ. Full recovery of fluorescence polarization signal for FITC-LIR2 was observed (orange columns). In the control experiment, LC3 was omitted (green unfilled columns). No binding between FITC-LIR2 and RavZ was observed.
Figure 5—figure supplement 2
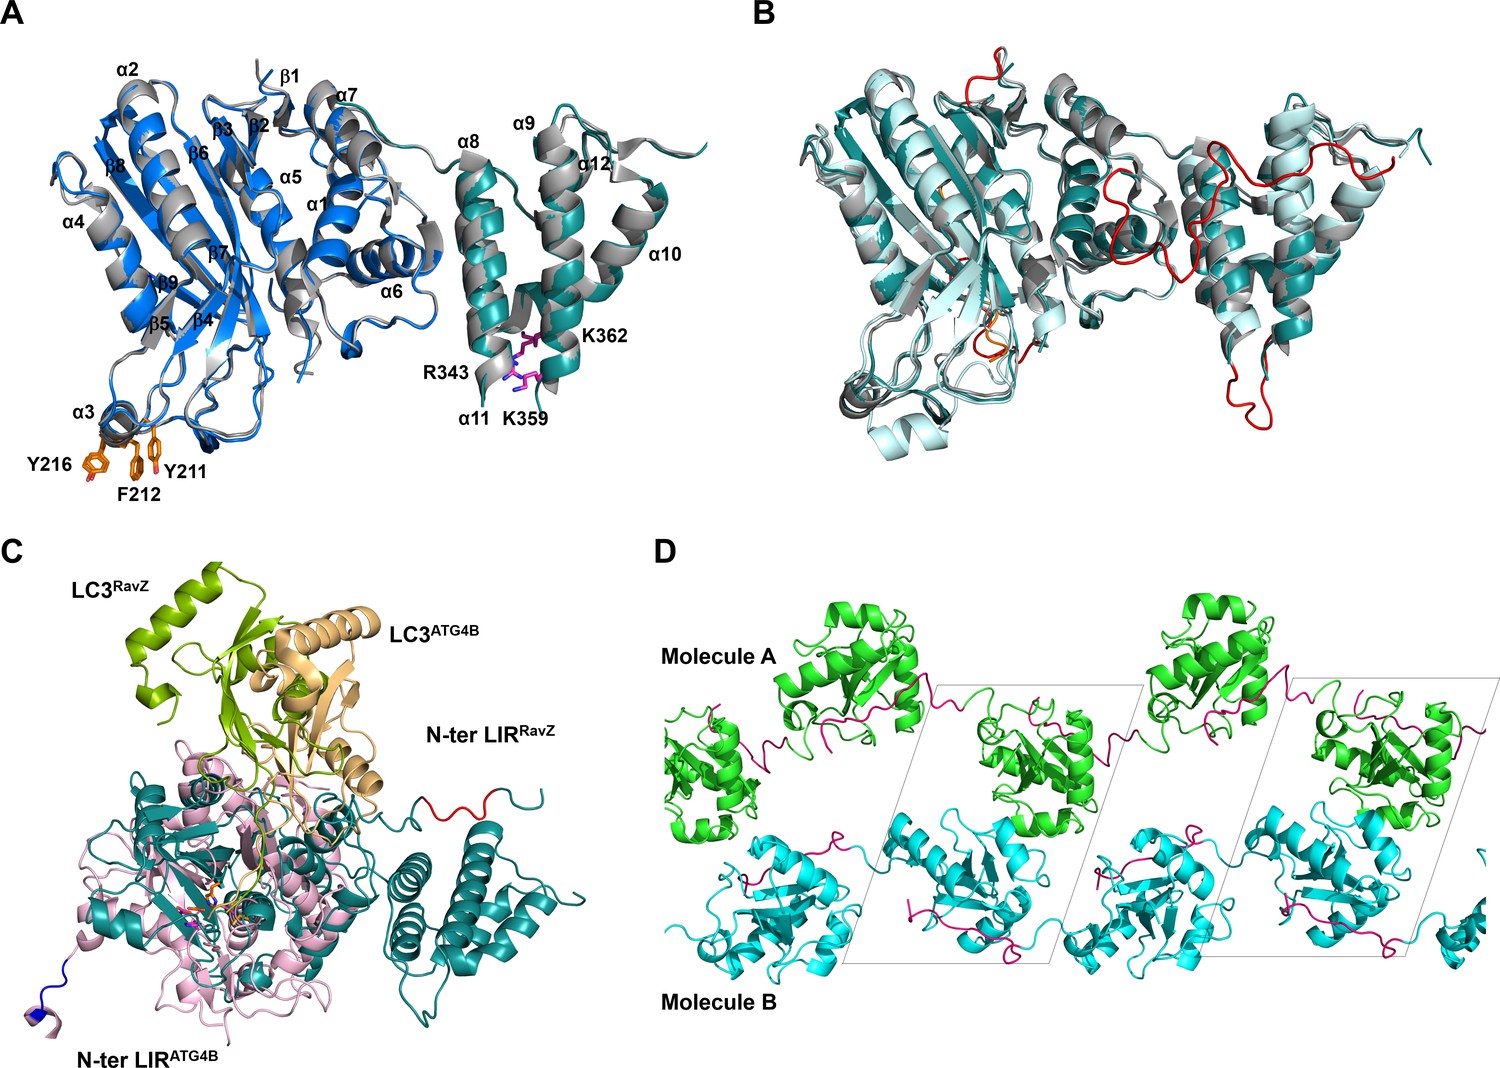
Structural analysis of free RavZ and RavZ:LC3 complex.
(A) Structural comparison of free RavZ with the published RavZ (PDB: 5CQC). Catalytic domain and PI3P-binding domain of our RavZ structures are colored in blue and deep-teal, respectively. Published RavZ structure is colored in gray, α3 hydrophobic residues and PI3P binding residues are shown as stick models and colored in orange and magenta, respectively. (B) Structural comparison of free RavZ(deep-teal), RavZ in complex with LC3 (pale cyan) and published RavZ (gray). The missing loops in the published RavZ that are found in our free RavZ and complexed RavZ are colored in orange and red, respectively. (C) Structural comparison of the docking structure of RavZ:LC3 complex and the crystal structure of Atg4B:LC3. RavZ is shown in deep-teal, Atg4B is shown in light pink, LC3RavZ is shown in green and LC3Atg4B is shown in light orange. N-terminal LIR2RavZ and N-terminal LIRATG4B are indicated in red and blue, respectively. The catalytic triad is shown as a stick model. (D) Crystal packing of the LIR2-fused LC3 protein. LC3 molecules in chain A and chain B are shown in green and cyan, respectively. LIR2 is colored in magenta. Black dashed line indicates asymmetric unit.
Figure 6 with 2 supplements

Identification of the lipid-binding site (LBS) of RavZ.
(A) Structural alignment between the lipid-binding sites of yeast Sec14 homolog (Shf1) (PDB: 3B74) and RavZ. RavZ is colored in pale yellow, while Shf1 is shown as a green transparent cartoon and its secondary elements are indicated. The phosphatidylethanolamine (PE) is shown as stick model with carbon atoms colored in magenta. (B) Structure of N-terminal catalytic domain of RavZ showing the LBS of RavZ and the predicted lipid-binding residues. The α3 loop and α4 are colored in orange and light pink, respectively. The residues involved in lipid binding are highlighted and displayed as side chain sticks. (C) In vitro LC3-PE cleavage assay of RavZ mutants. (D) Effect of RavZ mutants on LC3-II level in the cell. GFP-LC3 stable cells were transfected with RavZ mutants and subjected for starvation for 2 hr. (E) Quantification of the ratio of endogenous LC3-II to LC3-I (left) and GFP-LC3-II to GFP-LC3-I (right) shown in (D). n = 3 independent experiments. Mean and SD are presented; ***p<0.001, **p<0.01, ns: not significant. (F) Effect of RavZ mutants on GFP-LC3 puncta formation in the cell as shown in Figure 6—figure supplement 2A. n = 25–37 cells. Mean and SD are presented; ***p<0.001, **p<0.01, ns: not significant. (G) Effect of RavZC258A mutants on GFP-LC3 puncta formation in the cell as shown in Figure 6—figure supplement 2B. n = 22–35 cells. Mean and SD are presented; ***p<0.001, **p<0.01, ns: not significant.
Figure 6—figure supplement 1
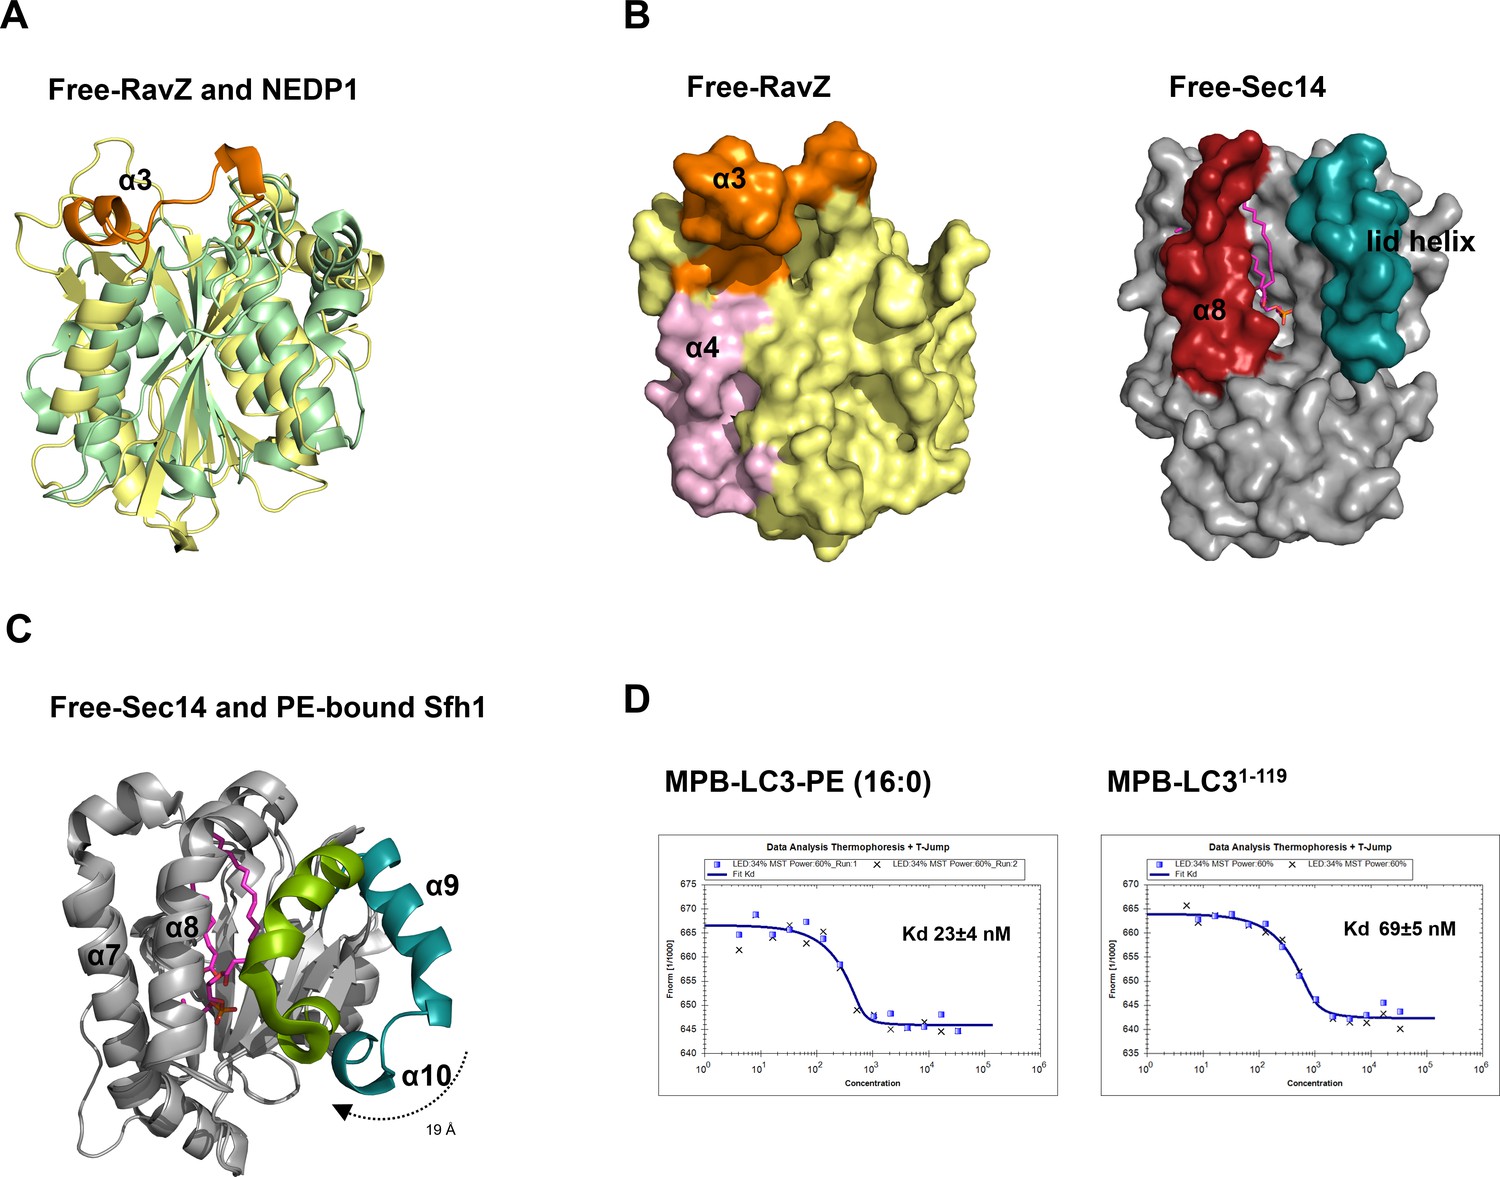
Structural analysis of the lipid-binding site of free RavZ, free Sec14 and PE-bound Sfh1.
(A) Structural comparison of N-terminal catalytic domain of RavZ with NEDP1. RavZ and NEDP1 are colored in pale yellow and pale green, respectively. The α3 loop of RavZ is shown in orange. (B) Surface representation of LBS of free RavZ and free Sec14 (PDB: 1AUA). The lipid-binding cavity of Sec14 is observed. The PE group is shown in the cavity by alignment with the PE-bound Sfh1 (3B74). (C) Structural comparison of free Sec14 (PDB: 1AUA) and PE-bound Sfh1. The lid helix (α9-α10) of free Sec14 and PE-bound Sfh1 is colored in deep teal and green, respectively. (D) Interaction analysis of RavZC258A with MBP-LC3-PE (16:0) or MBP-LC31–119 using MST technique.
Figure 6—figure supplement 2
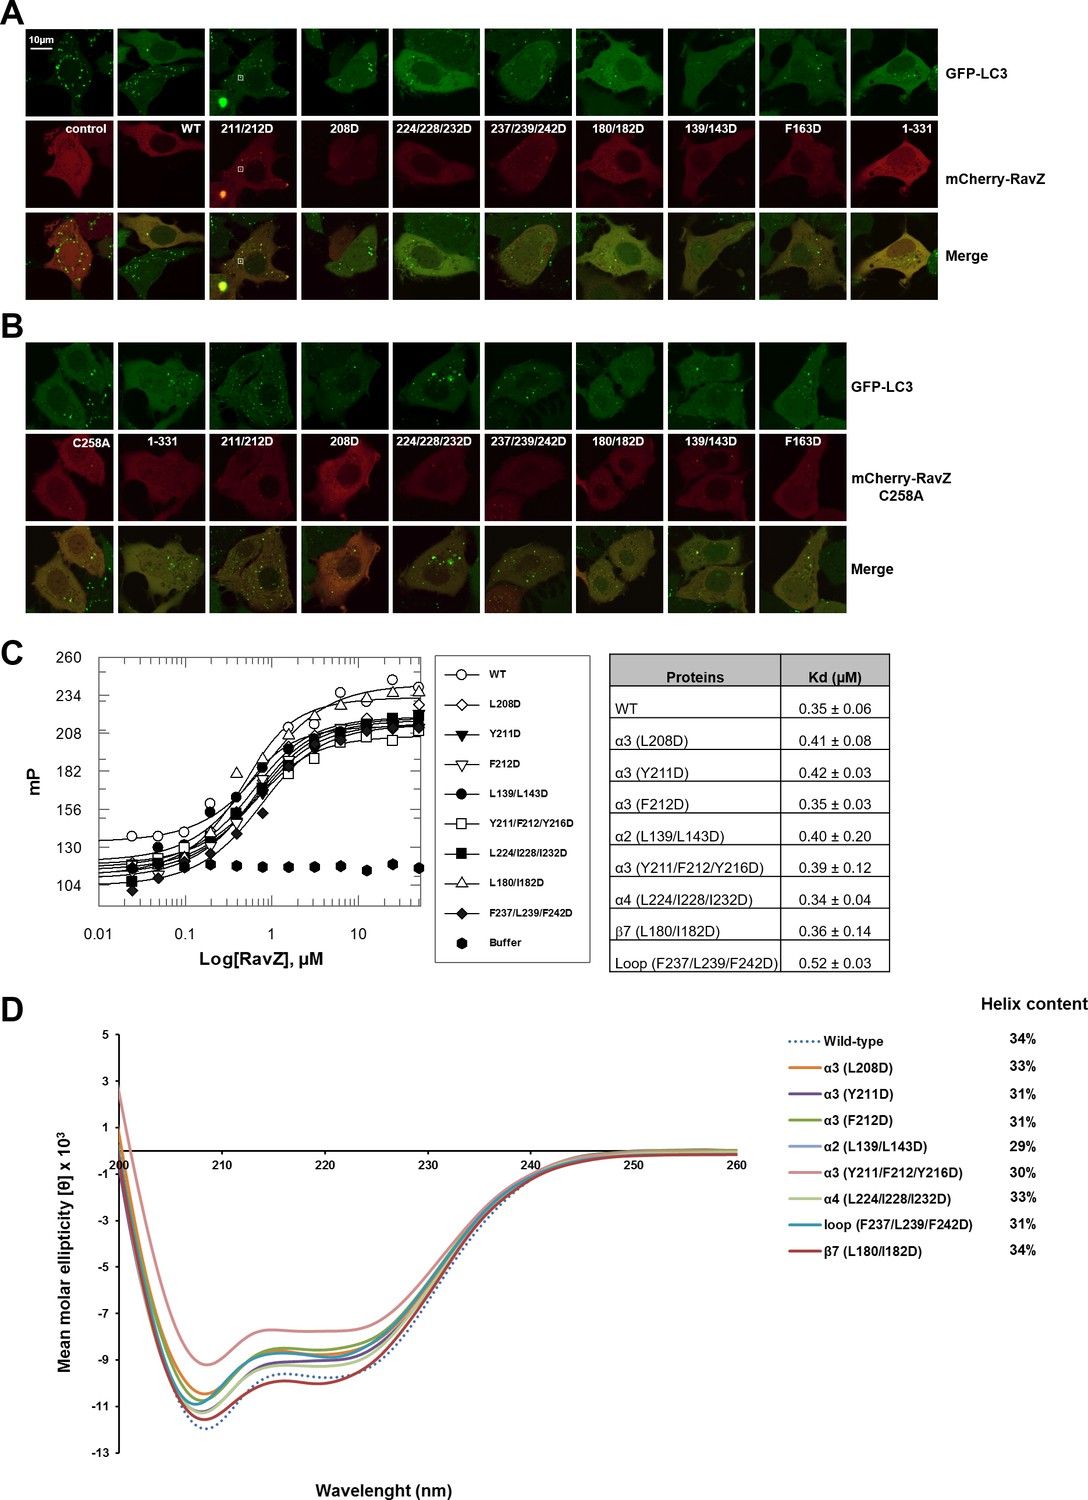
Functional characterization of the lipid-binding site of RavZ.
(A) Confocal microscopy of GFP-LC3 stable cells transfected with mCherry-RavZ constructs. Before imaging, cells were treated for 2 hr under starvation medium (EBSS). (B) Confocal microscopy of GFP-LC3 stable cells transfected with mCherry-RavZ C258A constructs. Before imaging, cells were treated for 2 hr under starvation media (EBSS). (C) Binding of RavZ LBS mutants with LC3 by fluorescence polarization. Dissociation constants are shown in the table. (D) Circular dichroism (CD) spectra of RavZ and its variants.
Figure 7
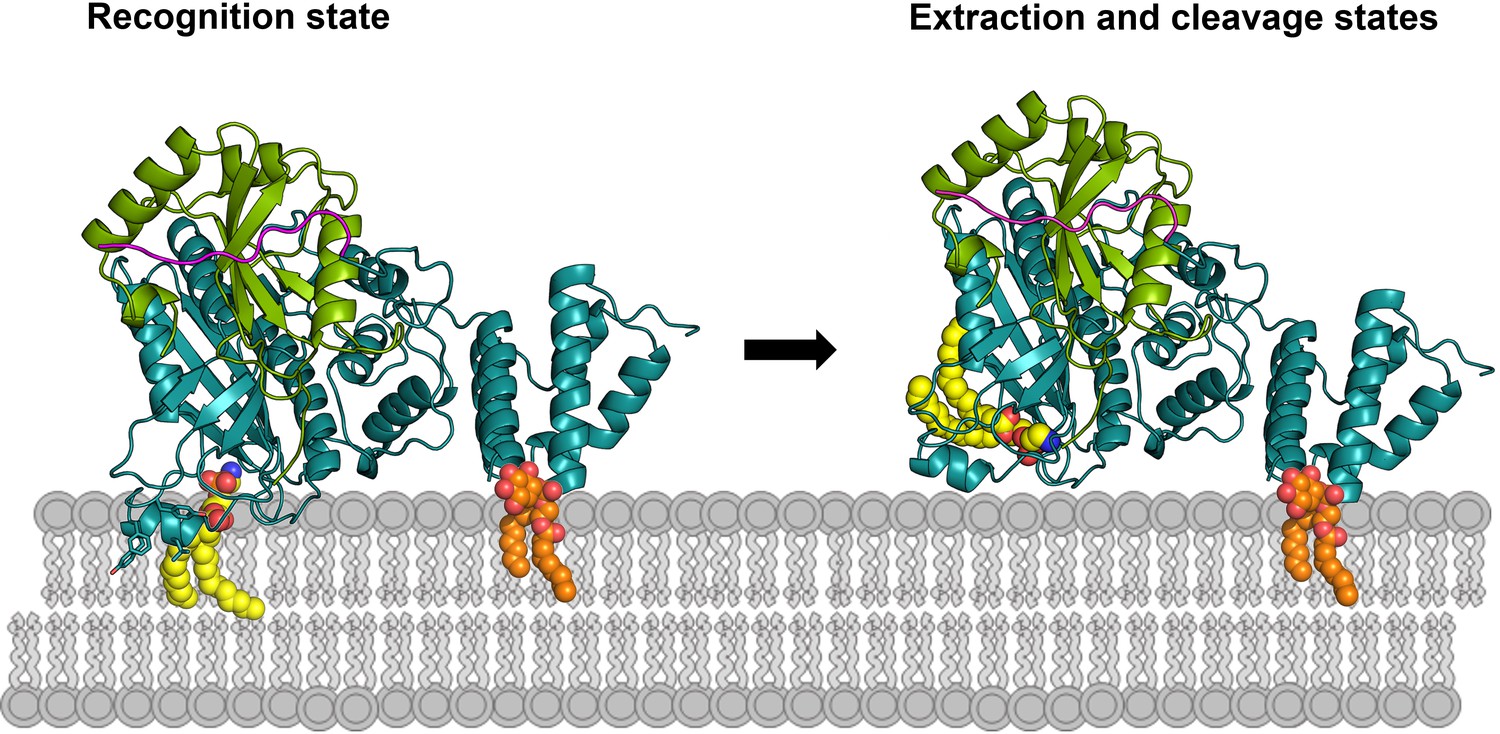
Working model of RavZ-mediated LC3-PE deconjugation on the membrane.
RavZ (deep teal) recognizes LC3 molecule (green) on the membrane via its LIR2 motif (magenta). RavZ targets to autophagosome membrane by interaction of its C-terminal domain with PI3P (orange) and association of the α3 helix (the helix inserted into the membrane) with membranes. α3 facilitates extraction of the PE moiety (yellow) from the membrane and docking of the fatty acid chains into the lipid-binding site of RavZ. The interaction of the PE moiety with LBS and the LIR2:LC3 binding orient the C-terminal tail into the active site for cleavage. RavZ:LC3 complex was generated by molecular docking using ZDOCK server: an automatic protein docking server (http://zdock.umassmed.edu). The LC31–120 structure from Atg4B:LC3 complex (PDB: 2Z0D) was docked onto the structure of RavZ20-502 (residues 48–432). The C-terminal residues (115-120) of LC31–120 and catalytic residues (C258, H176 and D197) located in the active site of RavZ were selected as the binding residues. The model was selected from top 10 scoring models. Binding of N-terminal LIR2 loop of RavZ with LC3 was generated by superimposition of the LIR2:LC3 structure onto LC3 in the docking structure.
Author response image 1
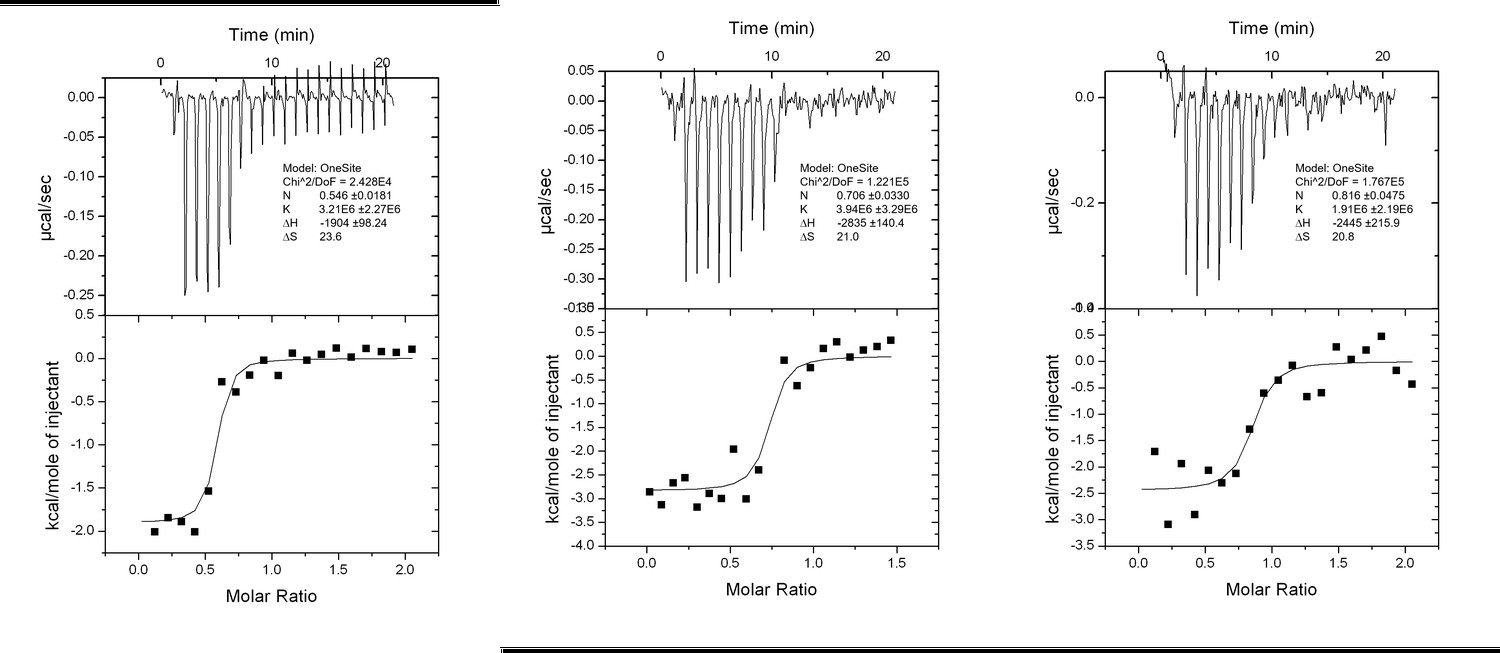
Interaction analysis of LIR II with LC3 using ITC technique.
https://doi.org/10.7554/eLife.23905.023
Author response image 2
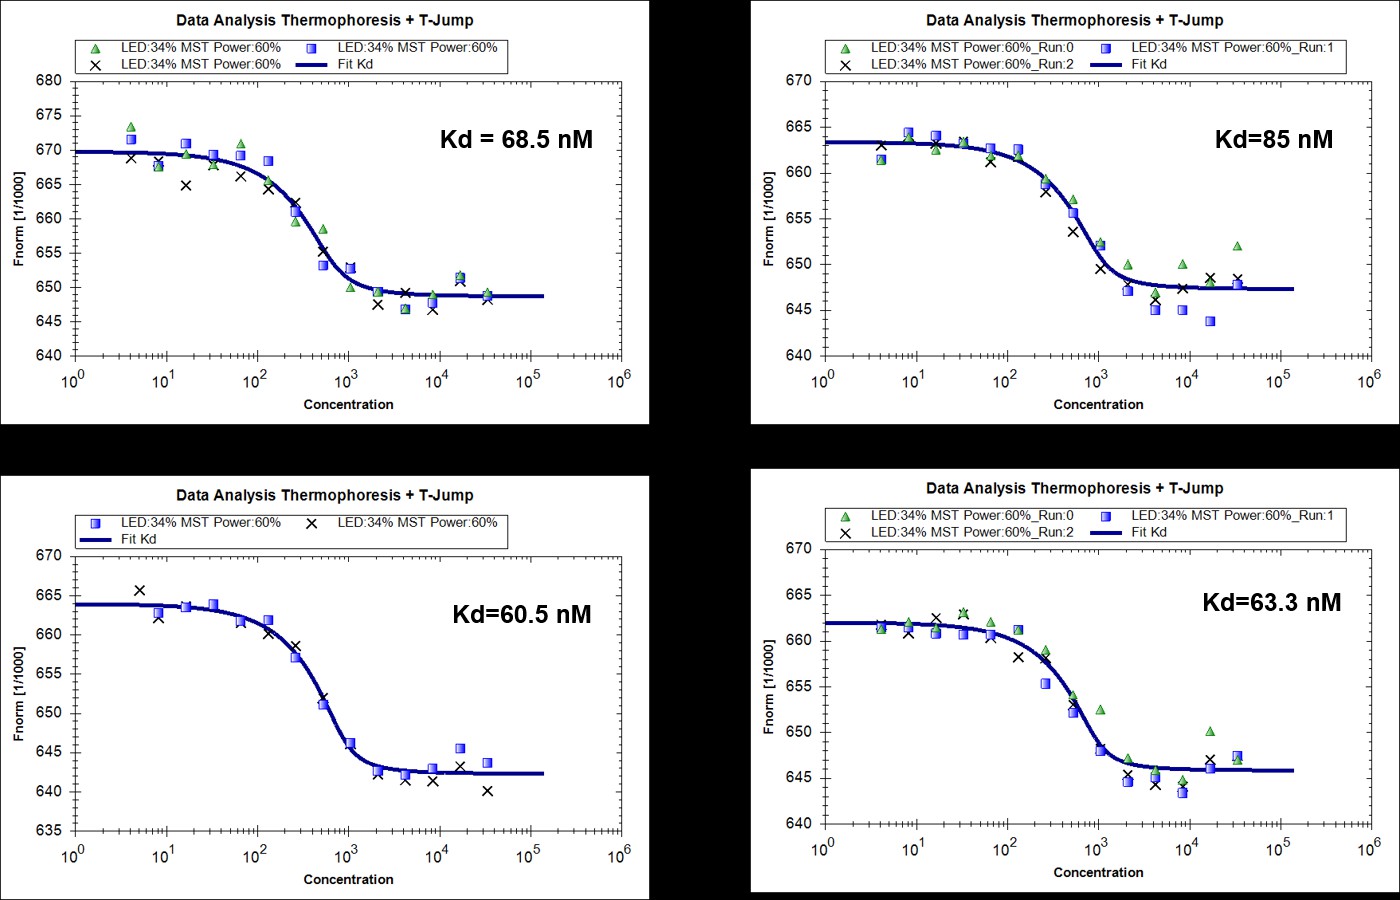
MST measurements of binding of RavZ(C258A) with MBP-LC31-119 (4 replicated experiments).
https://doi.org/10.7554/eLife.23905.024
Author response image 3
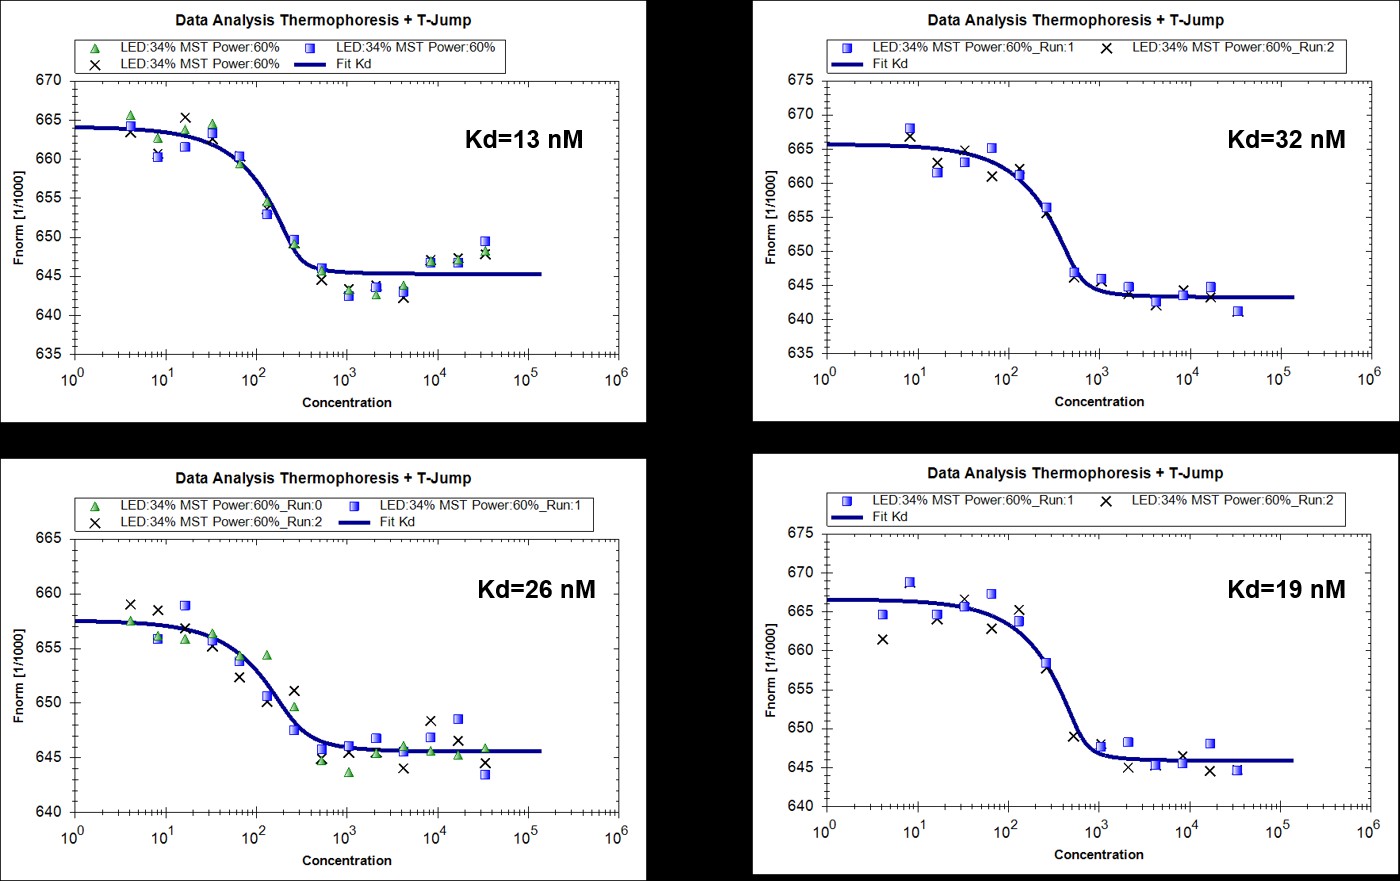
MST measurments of binding of RavZ(C258A) with MBP-LC3-PE (4 replicated experiments).
https://doi.org/10.7554/eLife.23905.025Additional files
-
Supplementary file 1
Mass characterization of peptides by HR-MS.
- https://doi.org/10.7554/eLife.23905.019
-
Supplementary file 2
Chemical synthesis of compound 8 and 10.
- https://doi.org/10.7554/eLife.23905.020
-
Supplementary file 3
Mass characterization of modified LC3 proteins by ESI-MS.
- https://doi.org/10.7554/eLife.23905.021
-
Supplementary file 4
Data collection and refinement statistics.
- https://doi.org/10.7554/eLife.23905.022
Download links
A two-part list of links to download the article, or parts of the article, in various formats.
Downloads (link to download the article as PDF)
Open citations (links to open the citations from this article in various online reference manager services)
Cite this article (links to download the citations from this article in formats compatible with various reference manager tools)
Elucidation of the anti-autophagy mechanism of the Legionella effector RavZ using semisynthetic LC3 proteins
eLife 6:e23905.
https://doi.org/10.7554/eLife.23905


