Structure of Fam20A reveals a pseudokinase featuring a unique disulfide pattern and inverted ATP-binding
- University of California, United States
- Peking University, China
- Peking-Tsinghua Center for Life Sciences, Peking University, China
Figures
Figure 1 with 2 supplements
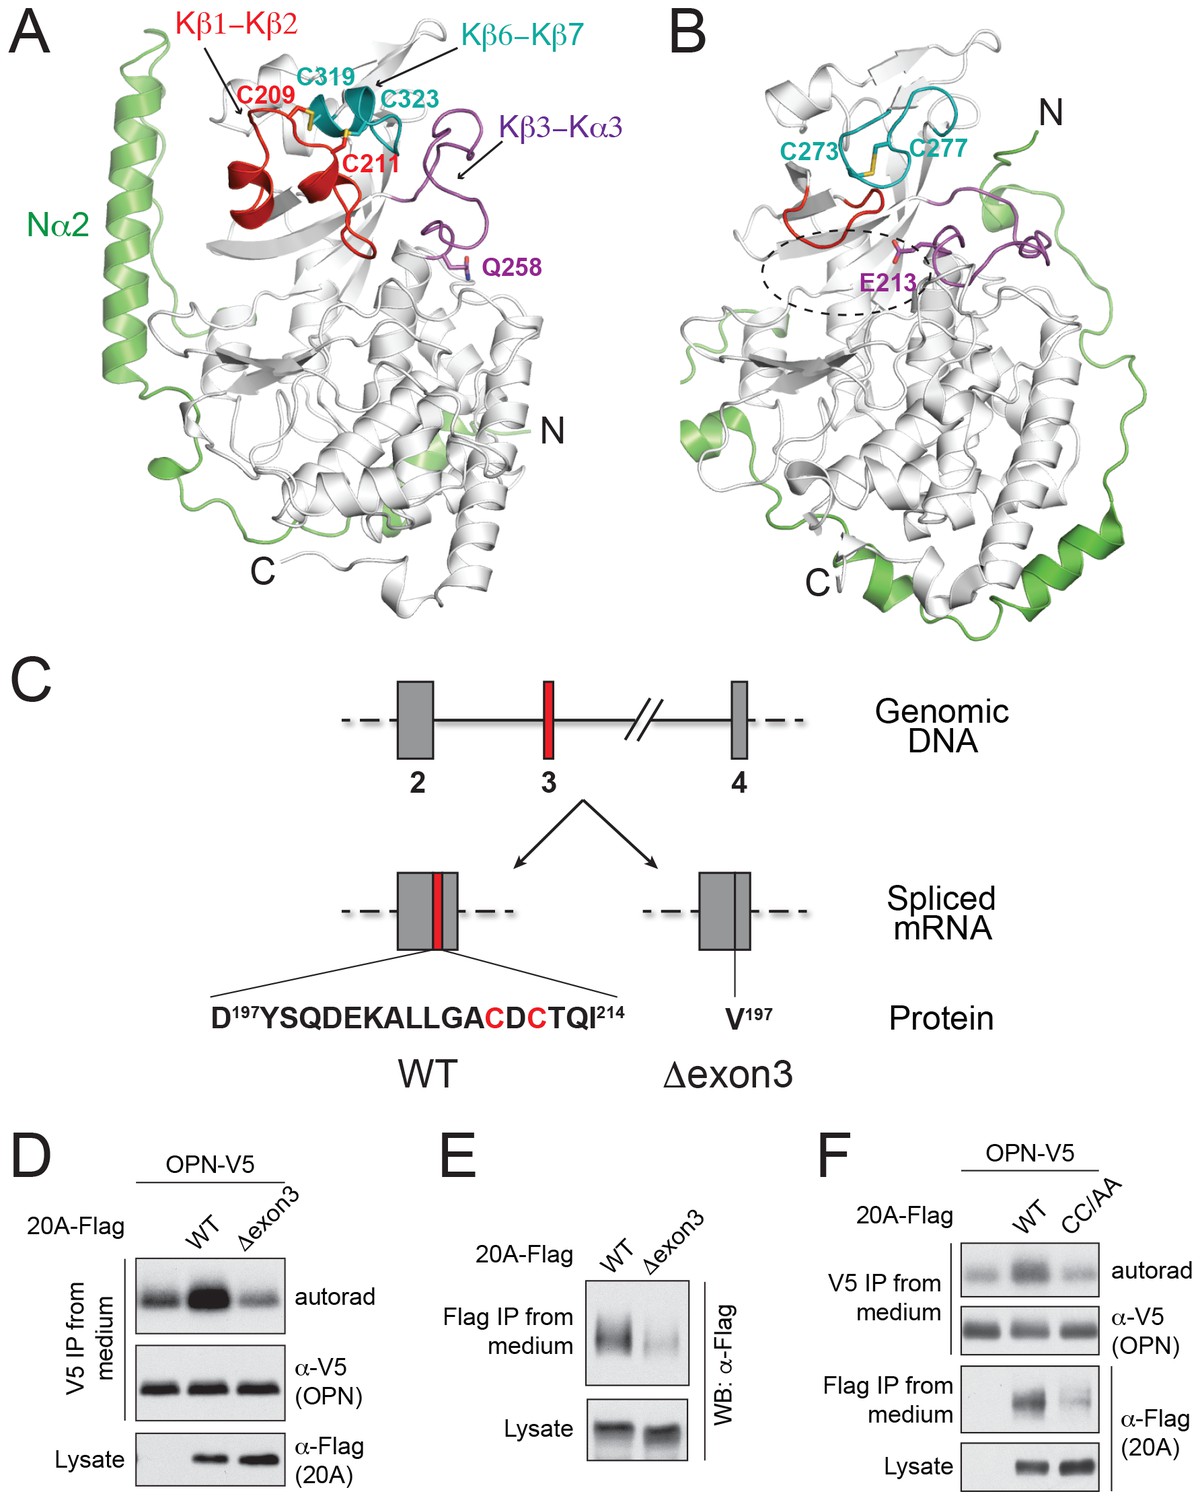
The structure of Fam20A reveals a unique disulfide pattern.
(A) Structure of human Fam20A. The N-terminal segment was colored in green. The Kβ1-Kβ2, Kβ6-Kβ7, and Kβ3-Kα3 loops were colored in red, teal, and magenta, respectively. The rest of the kinase core is shown in white. The side chains of Cys209, Cys211, Cys319, Cys323, and Gln258 are shown as sticks. The N- and C-termini of the molecule are indicated. (B) Structure of ceFam20 (PDB ID: 4KQA) is shown in the same orientation as Fam20A in (A) and colored in the same color scheme. The side chains Cys273, Cys277, and Glu213 are shown as sticks. The active site of ceFam20 is indicated with an oval in dashed line. (C) The schematic of the human Fam20A gene structure and RNA splicing. Exon three is highlighted in red. Relevant amino acid sequences are shown at the bottom. The two Cys residues in the Kβ1-Kβ2 loop are highlighted in red. (D) Effect of Fam20A exon three deletion on OPN phosphorylation. C-terminal V5-tagged OPN was expressed alone or co-expressed with Flag-tagged Fam20A WT or Δexon3 in U2OS cells that were metabolically labeled with 32P orthophosphate. OPN-V5 was immunoprecipitated from the medium. Total OPN and 32P incorporation were detected by anti-V5 immunoblotting and autoradiography. Expression of Fam20A was monitored by anti-Flag immunoblotting. (E) Effect of exon three deletion on Fam20A secretion. Flag-tagged Fam20A WT or Δexon3 was expressed in U2OS cells and immunoprecipitated from conditioned media using anti-Flag antibody. (F) Effect of C209A/C211A mutation (CC/AA) on Fam20A secretion and OPN phosphorylation.
Figure 1—figure supplement 1

Sequence alignment of Fam20A, Fam20C, and ceFam20 in the kinase core region.
The Kβ1-Kβ2, Kβ6-Kβ7, and Kβ3-Kα3 loops of the three proteins are highlighted in red, teal, and magenta, respectively. The Cys residues are highlighted in orange. Disulfide bonds conserved in Fam20A and ceFam20 are indicated with black dots and lines. Disulfide bonds specific for Fam20A or ceFam20 are indicated with orange dots and lines. The secondary structures of Fam20A and ceFam20 are shown above and below the sequence blocks, respectively. Residues in Fam20A that are involved in ATP-binding and dimer formation are highlighted with unfilled rhombuses and triangles, respectively, at the top. Residues involved in binding to Mn/ADP in ceFam20 are highlighted with filled gray rhombuses at the bottom.
Figure 1—figure supplement 2

Sequence alignment of Fam20A, Fam20B, and Fam20C family members around the Fam20A-specific insertion region.
Conserved residues are highlighted with black rectangles. The Fam20A-specific insertion is highlighted using a red rectangle, and the two conserved Cys are shaded in red. The secondary structures of Fam20A are shown above the sequence blocks and labeled.
Figure 2 with 2 supplements

Fam20A binds ATP without cations.
(A) Thermal stability shift assays of ATP binding to Fam20A or Fam20C in the presence or absence of Mn2+. ATP, 250 μM; MnCl2, 1 mM. (B) Fam20A thermal stability shift assay. The ΔTm values are plotted against ATP concentration. Data points are represented as mean ± SD and fitted by non-linear regression of the equation Y = ΔTm max*X/(Kd + X). (C) Thermal stability shift assays of ATP, GTP, CTP or UTP binding to Fam20A or Fam20C. Nucleotide concentration is 10 μM for Fam20A and 250 μM for Fam20C. (D) Thermal stability shift assays of ATP or ADP binding to Fam20A without cations. Data were plotted and fitted as in (B). (E) Gel filtration analyses of the Fam20A/Fam20C complex in the absence or presence of 250 μM ATP. (F) 2D class averages of the negatively stained Fam20A/20C complexes. Representative 2D class averages of the complex assembled in the presence or absence of ATP (250 μM) are shown at the same pixel size to highlight the overall size changes between the two samples. Scale bar, 200 Å.
Figure 2—figure supplement 1
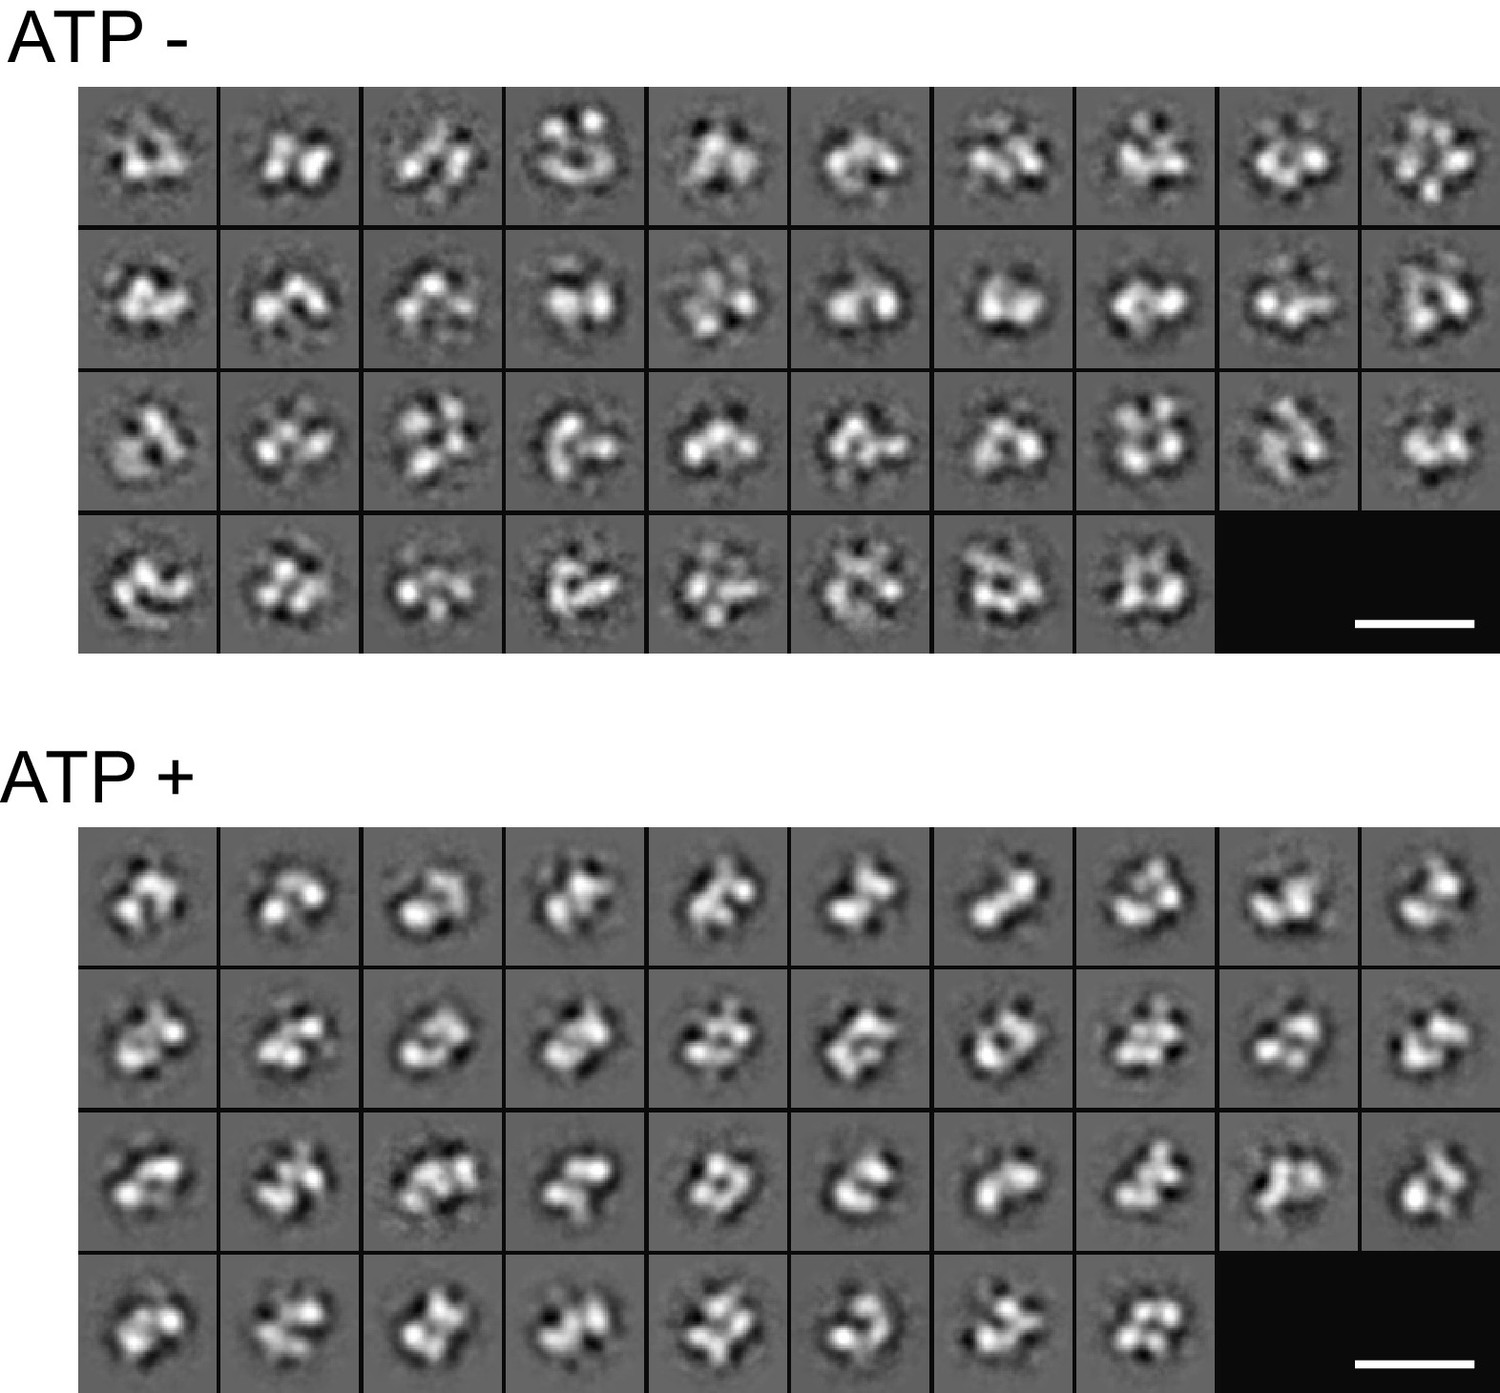
2D class averages of the Fam20A/20C complex assembled in the presence or absence of ATP (250 μM) determined by negative-stain single particle electron microscopy.
Scale bar, 200 Å.
Figure 2—figure supplement 2
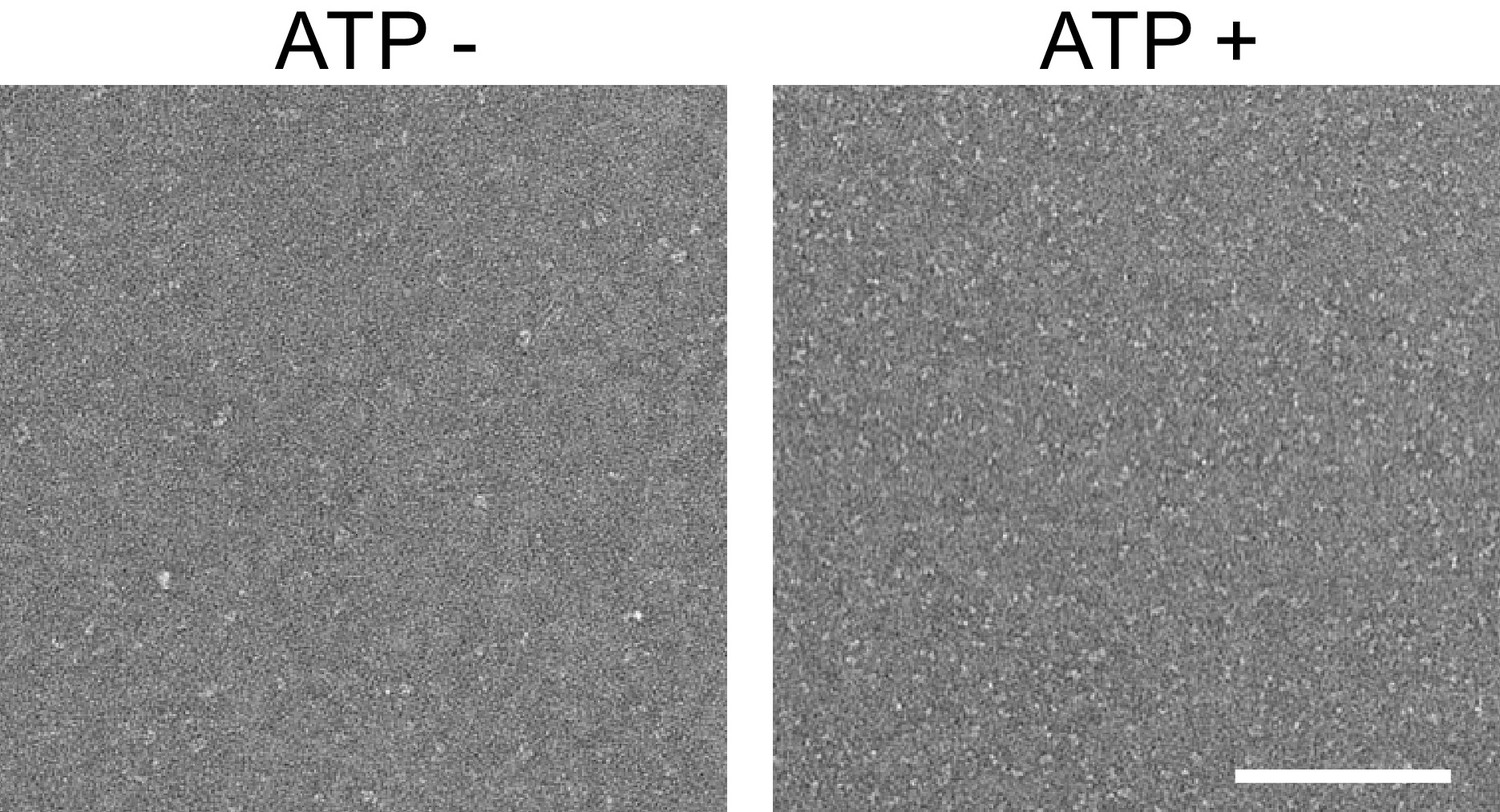
Representative negative stain micrographs of the Fam20A/20C complex assembled in the presence or absence of ATP (250 μM).
Scale bar, 200 nm.
Figure 3
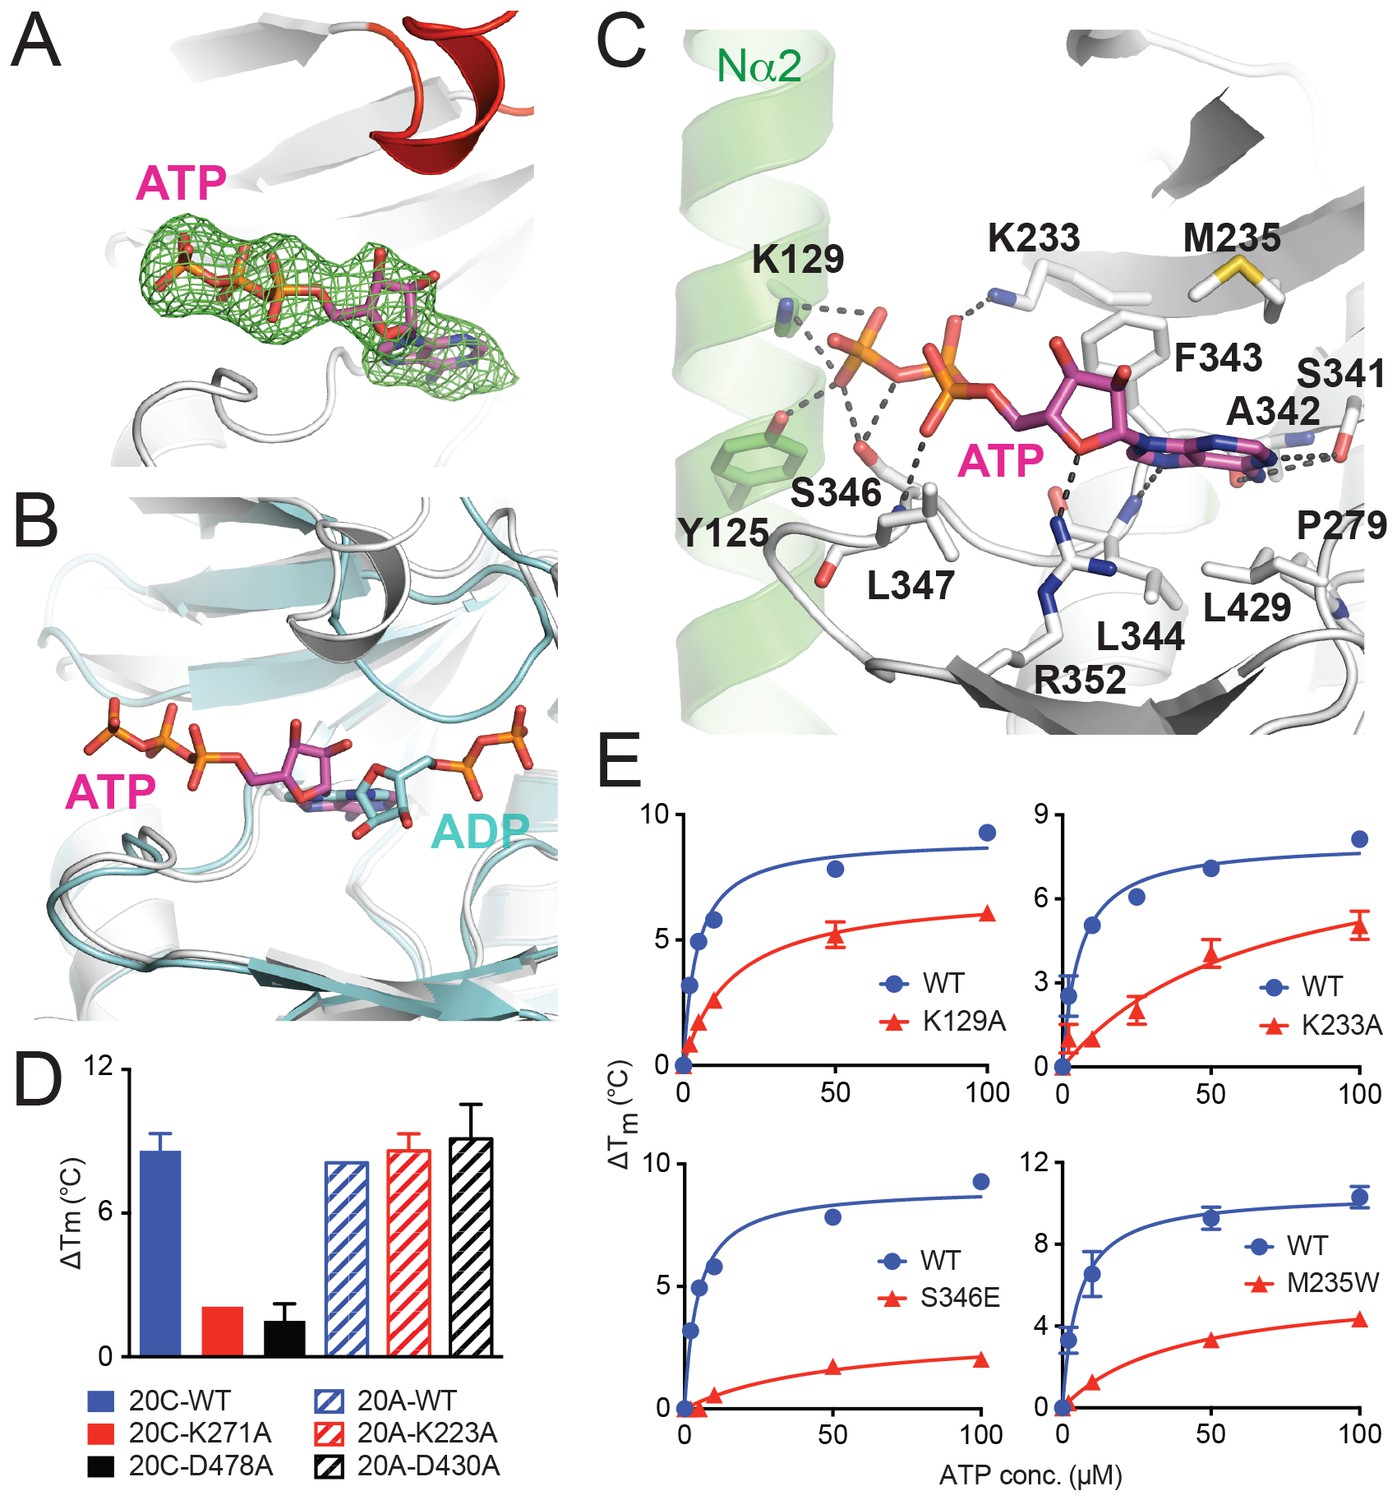
ATP binds to Fam20A in an inverted orientation.
(A) The Fo-Fc difference electron density map (calculated before ATP is built and contoured at 3σ) is shown as a green mesh, revealing the presence of ATP. Fam20A is shown as ribbons and colored in the same scheme as Figure 1A (the Kβ1-Kβ2 loop in red). The ATP molecule built afterwards is shown in sticks, and its carbon atoms are colored in magenta. (B) Superimposition of Fam20A/ATP and ceFam20/ADP. Fam20A and ceFam20 are shown in white and cyan, respectively. The carbons in ATP and ADP are colored in magenta and cyan, respectively. (C) An enlarged image of the ATP-binding pocket of Fam20A showing the detailed molecular interactions with ATP. Fam20A is colored in the same scheme as in Figure 1A, with the Nα2 helix highlighted in green. Salt-bridge and hydrogen-bond interactions are shown as dashed lines. (D) Thermal stability shift assays of ATP binding to Fam20C or Fam20A. 100 μM and 250 μM ATP were used to assay Fam20A and Fam20C, respectively. 5 mM MnCl2 was present in the Fam20C assay conditions. (E) Thermal stability shift assays of ATP binding to Fam20A WT, K129A, K233A, S346E, and M235W. Data were plotted and fitted as in Figure 2B.
Figure 4 with 1 supplement
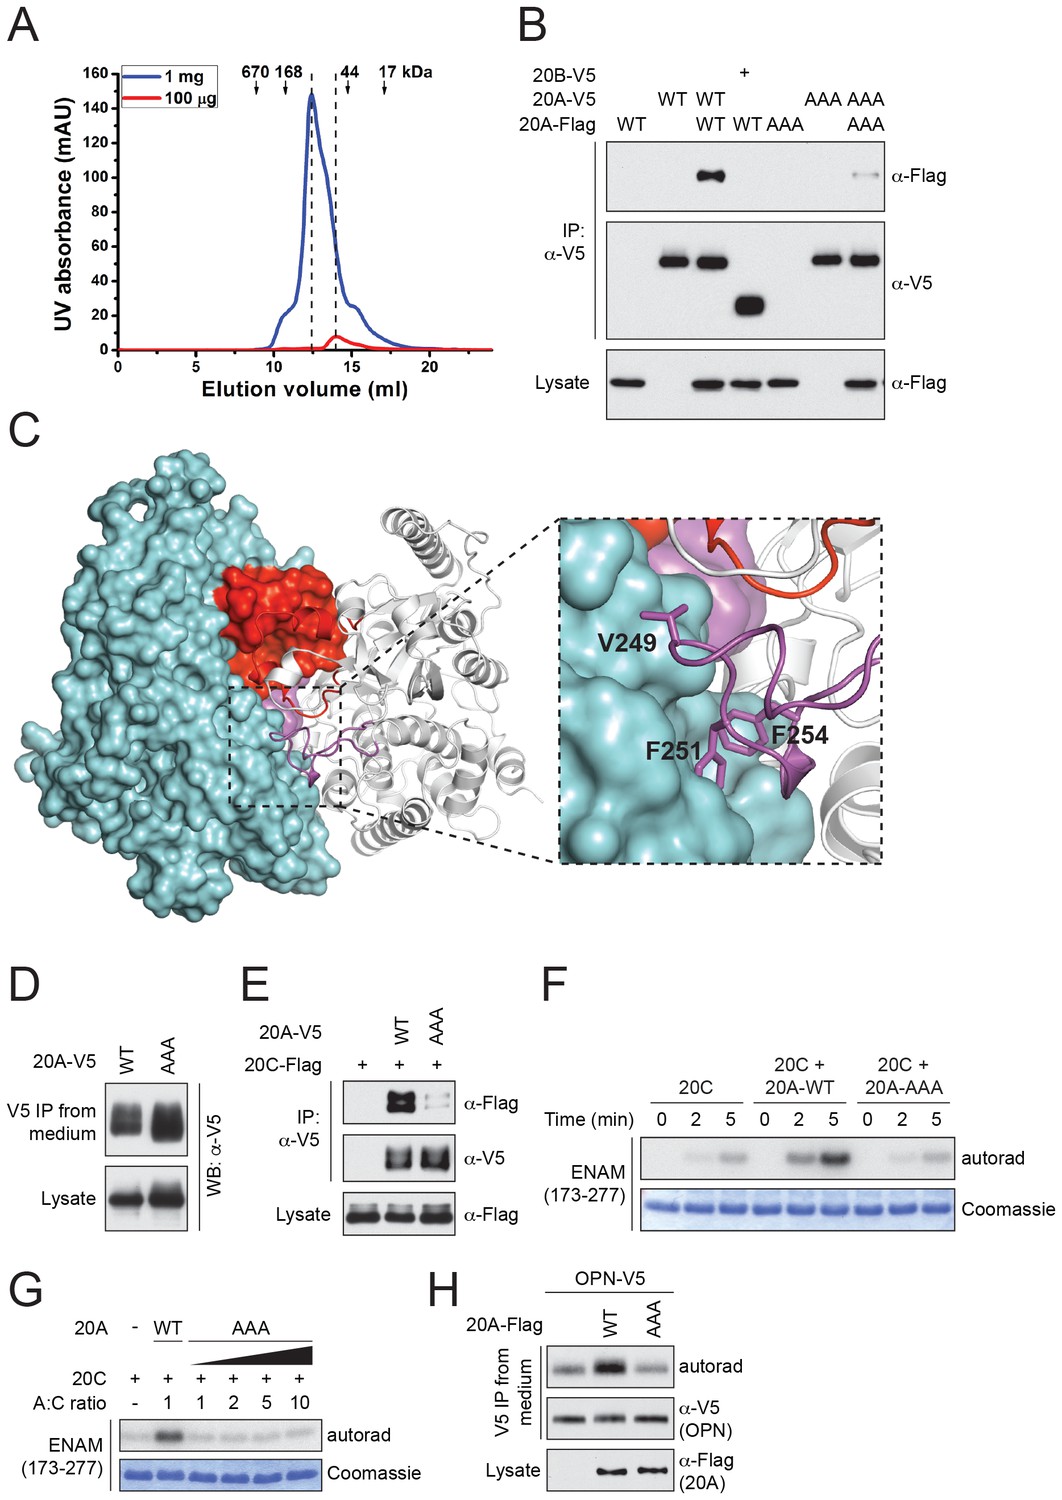
Fam20A forms a dimer in the crystal and an intact dimer interface is essential for its function.
(A) Fam20A dimerizes in solution in a concentration-dependent manner. 1 mg or 100 µg purified Fam20A (both in 500 µl) were individually loaded on a Superdex 200 increase 10/300 GL column (GE healthcare) and eluted using 20 mM HEPES, pH 7.5, and 100 mM NaCl. The peak positions of the two runs are highlighted with dashed lines. The elution volumes of the molecular weight standards are indicated. (B) Co-immunoprecipitation of Fam20A-Flag and Fam20A-V5 (or Fam20B-V5) from U2OS cells. AAA, Fam20A V249A/F251A/F254A mutant. (C) The structure of Fam20A dimer. One protomer in the dimer is shown in ribbons, and the other is shown in surface representation. The Kβ1-Kβ2 and Kβ3-Kα3 loops are highlighted in red and magenta, respectively. The rest of the two molecules are shown in white and cyan. A close view of the Kβ3-Kα3 loop interaction is shown on the right. The side chains of Val249, Phe251, Phe254 are shown as sticks. (D) Secretion of Fam20A WT and V249A/F251A/F254A. (E) Effect of V249A/F251A/F254A mutation on Fam20A-Fam20C interaction. Fam20A-V5 (WT or AAA) and Fam20C-Flag were co-expressed in U2OS cells and coimmunoprecipitated from the cell lysate. (F and G) Effect of Fam20A-AAA on ENAM phosphorylation by Fam20C in vitro. (H) Effect of Fam20A-AAA on OPN phosphorylation in metabolically 32P radiolabeled U2OS cells.
Figure 4—figure supplement 1
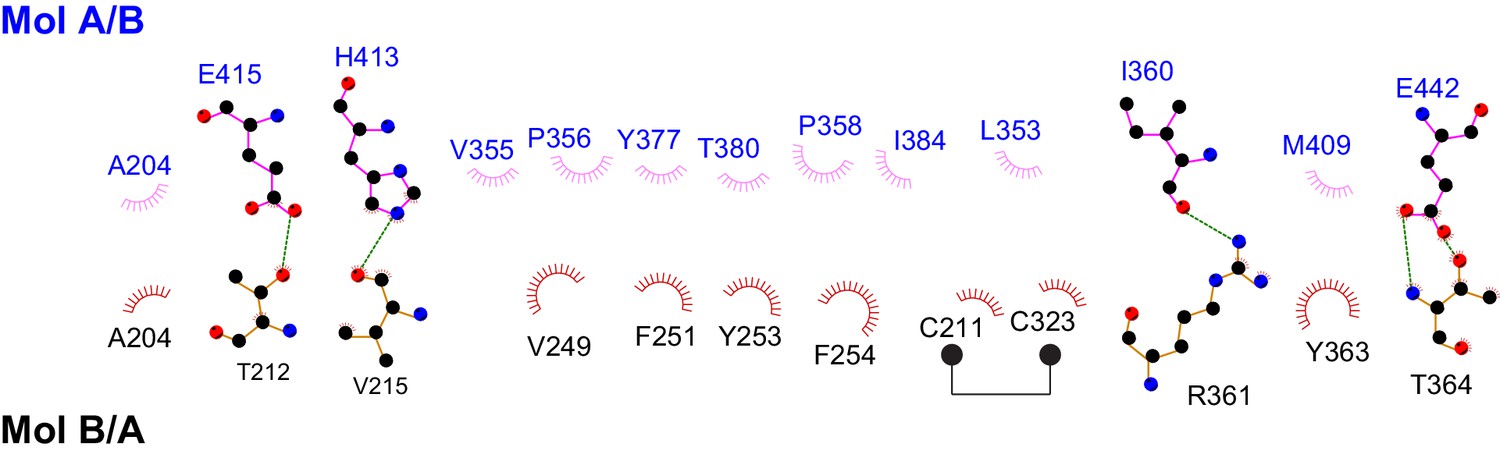
Schematic drawing of the interactions between the two protomers in the Fam20A dimer.
Residues involved in forming hydrophobic interactions are indicated, and the hydrophobic contacts are represented by spoked arcs. Residues participating in hydrogen bonds are shown in ball-and-stick representation, and the hydrogen bonds are shown as green dashed lines. Note that the Fam20A dimer is symmetrical, therefore, two sets of interactions shown in the picture are present in the dimer structure.
Author response image 1

Tables
Table 1
Data collection and refinement statistics.
| Fam20A (PDB ID: 5WRR) | Fam20A with ATP (PDB ID: 5WRS) | |
|---|---|---|
| Data collection | ||
| Space group | P 32 2 1 | P 32 2 1 |
| Cell dimensions | a = 156.854 Å, b = 156.854 Å, c = 143.655 Å | a = 157.202 Å, b = 157.202 Å, c = 144.802 Å |
| Wavelength (Å) | 0.979 | 1.009 |
| Resolution (Å) | 2.50 | 2.75 |
| Rmerge | 0.172 (1.804) | 0.168 (1.470) |
| Rpim | 0.055 (0.566) | 0.053 (0.472) |
| CC1/2 (highest-resolution shell) | 0.841 | 0.788 |
| I / σI | 28.8 (2.8) | 21.2 (2.4) |
| Completeness (%) | 99.9 (100.0) | 99.9 (100.0) |
| Multiplicity | 10.9 (11.1) | 10.7 (10.6) |
| Wilson B-factor | 54.1 | 57.9 |
| Refinement | ||
| Reflections used in refinement | 70216 (6906) | 53997 (5329) |
| Reflections used for Rfree | 1994 (197) | 1946 (193) |
| Rwork / Rfree | 0.215/0.231 | 0.203/0.238 |
| No. of non-hydrogen atoms | ||
| Protein | 7039 | 7018 |
| Ligands | 98 | 146 |
| Protein residues | 876 | 874 |
| B-factors | ||
| Protein | 75.1 | 72.3 |
| Ligands | 116.7 | 101.4 |
| R.m.s deviations | ||
| Bond lengths (Å) | 0.002 | 0.003 |
| Bond angles (°) | 0.62 | 1.01 |
| Ramachandran | ||
| Favored (%) | 96.8 | 96.5 |
| Allowed (%) | 3.1 | 3.5 |
| Outliers (%) | 0.1 | 0 |
-
Each dataset was collected from a single crystal. Values in parentheses are for highest-resolution shell.
Download links
A two-part list of links to download the article, or parts of the article, in various formats.
Downloads (link to download the article as PDF)
Open citations (links to open the citations from this article in various online reference manager services)
Cite this article (links to download the citations from this article in formats compatible with various reference manager tools)
Structure of Fam20A reveals a pseudokinase featuring a unique disulfide pattern and inverted ATP-binding
eLife 6:e23990.
https://doi.org/10.7554/eLife.23990


