Autoinhibition of Munc18-1 modulates synaptobrevin binding and helps to enable Munc13-dependent regulation of membrane fusion
- University of Texas Southwestern Medical Center, United States
- University of Toronto, Canada
Figures
Figure 1 with 1 supplement
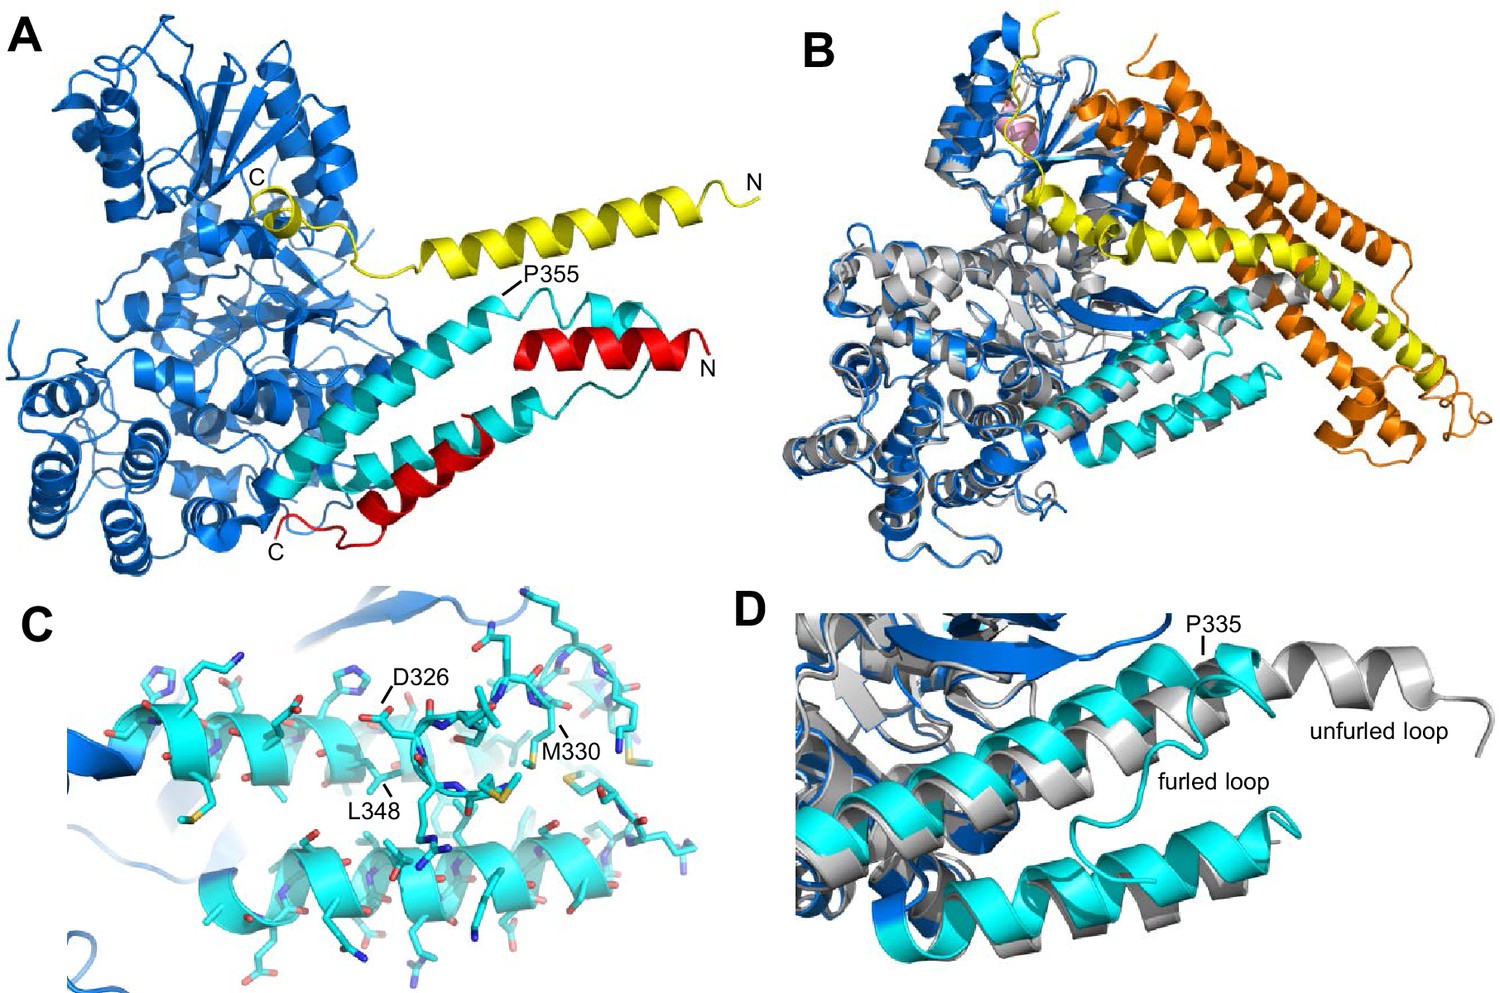
Autoinhibition by a loop of Munc18-1 is likely to inhibit binding to synaptobrevin.
(A) Ribbon diagram of the structure of Vps33 (blue) bound to the Nyv1 SNARE motif (red) (PDB code 5BV0) superimposed with the structure of Vps33 (not shown) bound to the Vam3 SNARE motif (yellow) (PDB code 5BUZ) (Baker et al., 2015). The two helices connected by a loop in domain 3a of Vps33, which are involved in Nyv1 binding, are shown in cyan. (B) Crystal structure of Munc18-1 (blue) bound to closed syntaxin-1 (SNARE motif in yellow; N-terminal region in orange) (PDB code 3C98) (Burkhardt et al., 2008) superimposed to the crystal structure of Munc18-1 (gray) bound to a syntaxin-4 N-terminal peptide (pink) (PDB code 3PUJ) (Hu et al., 2011). The helix-loop-helix of domain 3a of Munc18-1 in the complex with syntaxin-1 is in cyan. (C) Close-up of the helix-loop-helix of domain 3a of Munc18-1 bound to syntaxin-1 (not shown) illustrating how the loop forms a ‘furled conformation’ by folding back onto the groove between the two helices that is putatively involved in synaptobrevin binding. Side chains are shown as stick models and those that were mutated to disrupt synaptobrevin binding are labeled. (D) Close-up of the helix-loop-helix region from the superposition shown in (B) but without showing syntaxin-1. Note how in the complex with closed syntaxin-1, the Munc18-1 loop is furled (cyan). whereas in the complex with the syntaxin-4 N-terminal peptide, the loop is unfurled and forms a helical extension of one of the helices but with a bend (gray). This bend has P335 in the corner, and the homologous residue of Vps33 (P355) is also in the corner of the helix bend (A).
Figure 1—figure supplement 1
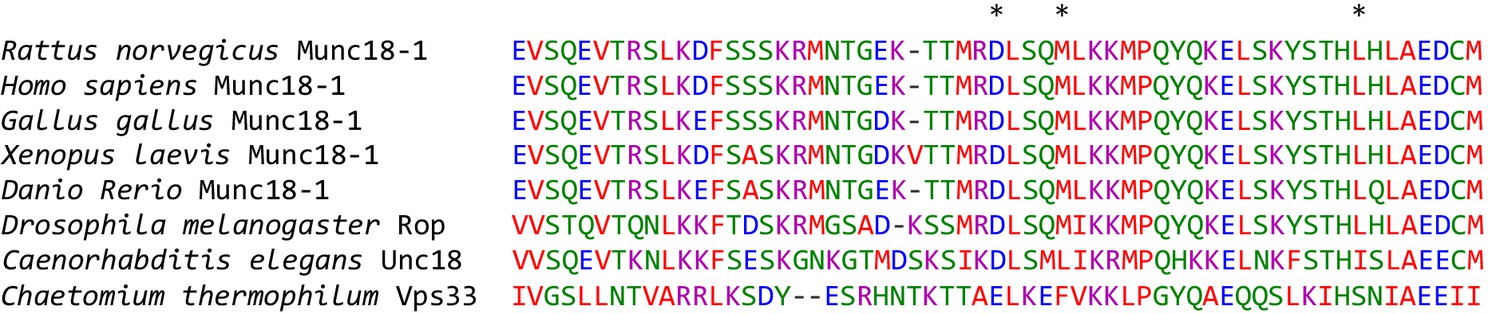
Sequence alignment of the helix-loop-helix region of domain 3a of rat Munc18-1 (residues 298–355) with the corresponding sequences of Munc18-1 from different species and of Vps33 from Chaetomium thermophilum.
Residues D326, M330 and L348 of rat Munc18-1 are marked by a *. The alignment was prepared using Clustal Omega (http://www.ebi.ac.uk/Tools/msa/clustalo/).
Figure 2 with 2 supplements
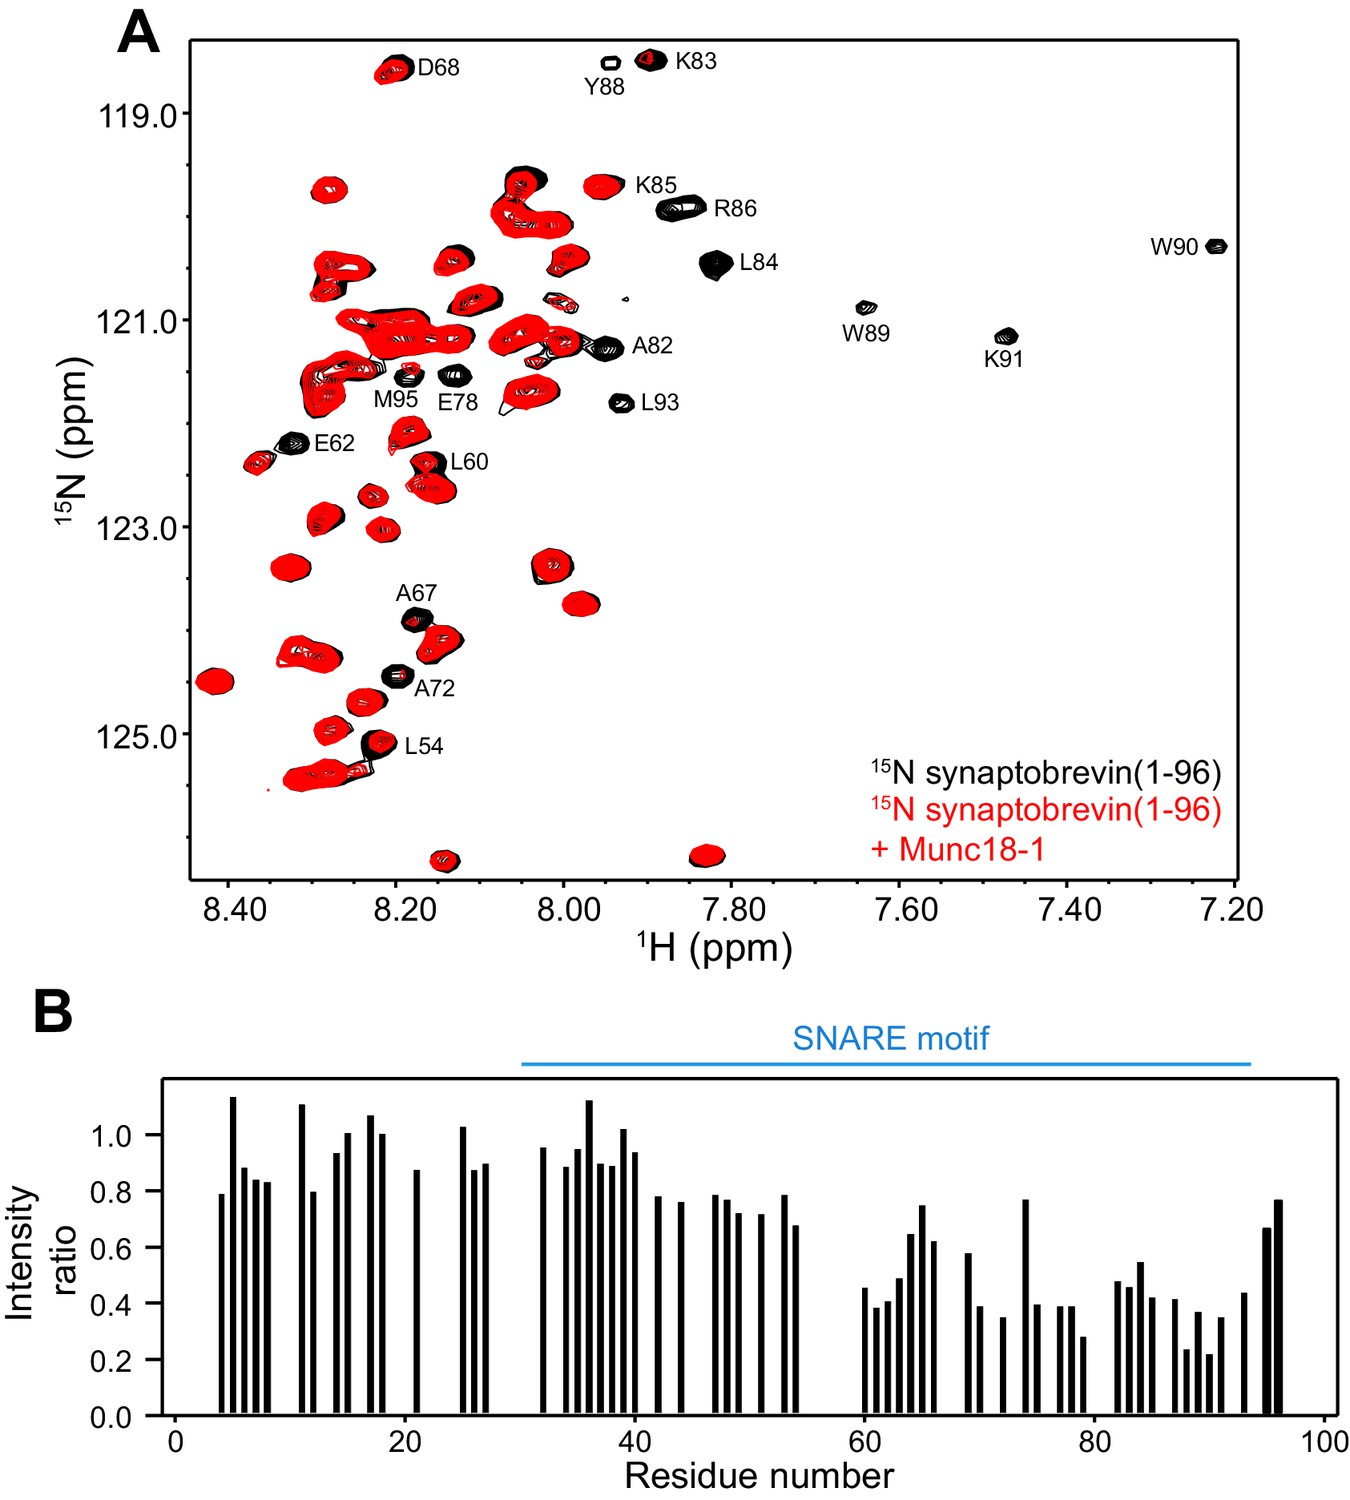
Munc18-1 binds to central sequences and the C-terminus of the synaptobrevin SNARE motif.
(A) 1H-15N HSQC spectra of 14.5 µM 15N-synaptobrevin(1-96) in the absence (black contours) and presence (red contours) of 14.5 µM Munc18-1. Selected cross-peaks that were particularly broadened by Munc18-1 binding are labeled. (B) Plots of the ratios of the intensities of the synaptobrevin(1-96) 1H-15N HSQC cross-peaks observed in the presence of Munc18-1 versus those observed in its absence, as a function of residue number. Intensities were measured only for well-resolved cross-peaks. Ratios were calculated from experiments performed with two separate samples and averaged. Note that the synaptobrevin SNARE motif spans approximately residues 29–91 (Sutton et al., 1998).
Figure 2—figure supplement 1

The Munc13-1 MUN domain binds to the C-terminus of the synaptobrevin SNARE motif but not to more central sequences.
(A) 1H-15N TROSY-HSQC spectra of 20 µM 15N-synaptobrevin(29-93) in the absence (black contours) and presence (red contours) of 16.5 µM Munc13-1 MUN domain. Selected cross-peaks that were particularly broadened as a result of MUN domain binding are labeled. (B) Plots of the ratios of the intensities of the synaptobrevin(29-93) 1H-15N TROSY-HSQC cross-peaks observed in the presence of Munc13-1 MUN domain versus those observed in its absence, as a function of residue number. Intensities were measured only for well-resolved cross-peaks.
Figure 2—figure supplement 2
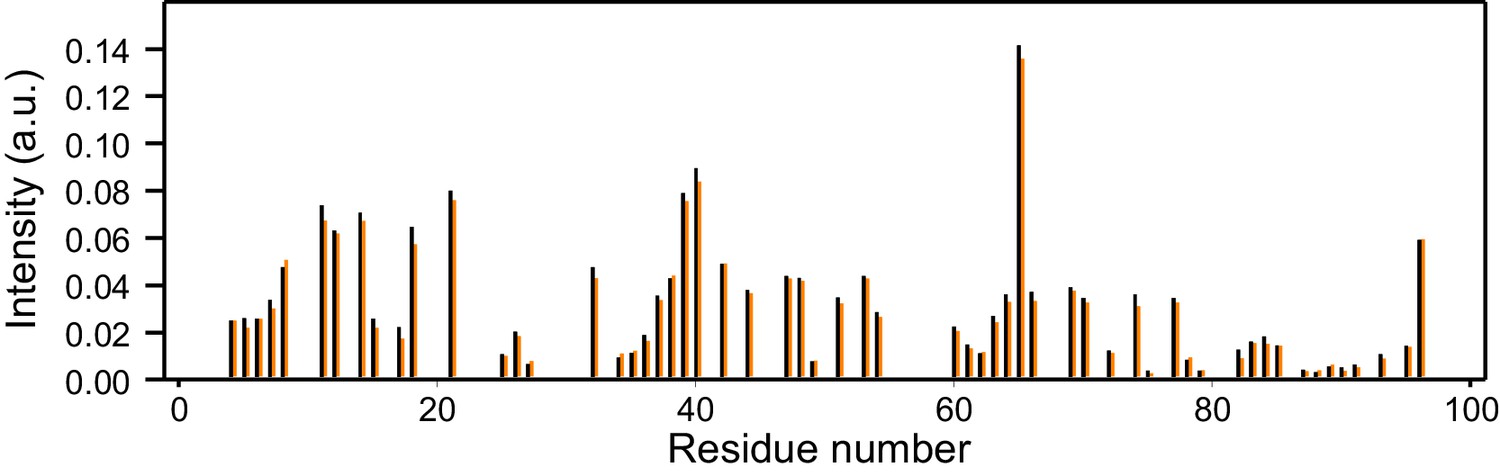
Reproducibility of 1H-15N HSQC cross-peak intensities.
The plot shows the intensities (arbitrary units) from the 1H-15N HSQC cross-peaks of two separate samples of 14.5 µM 15N-synaptobrevin(1-96) in the presence of 14.5 µM Munc18-1. Intensities were measured only for well-resolved cross-peaks. There is one black bar and one orange bar for each residue, representing the measurements made in the two separate experiments.
Figure 3
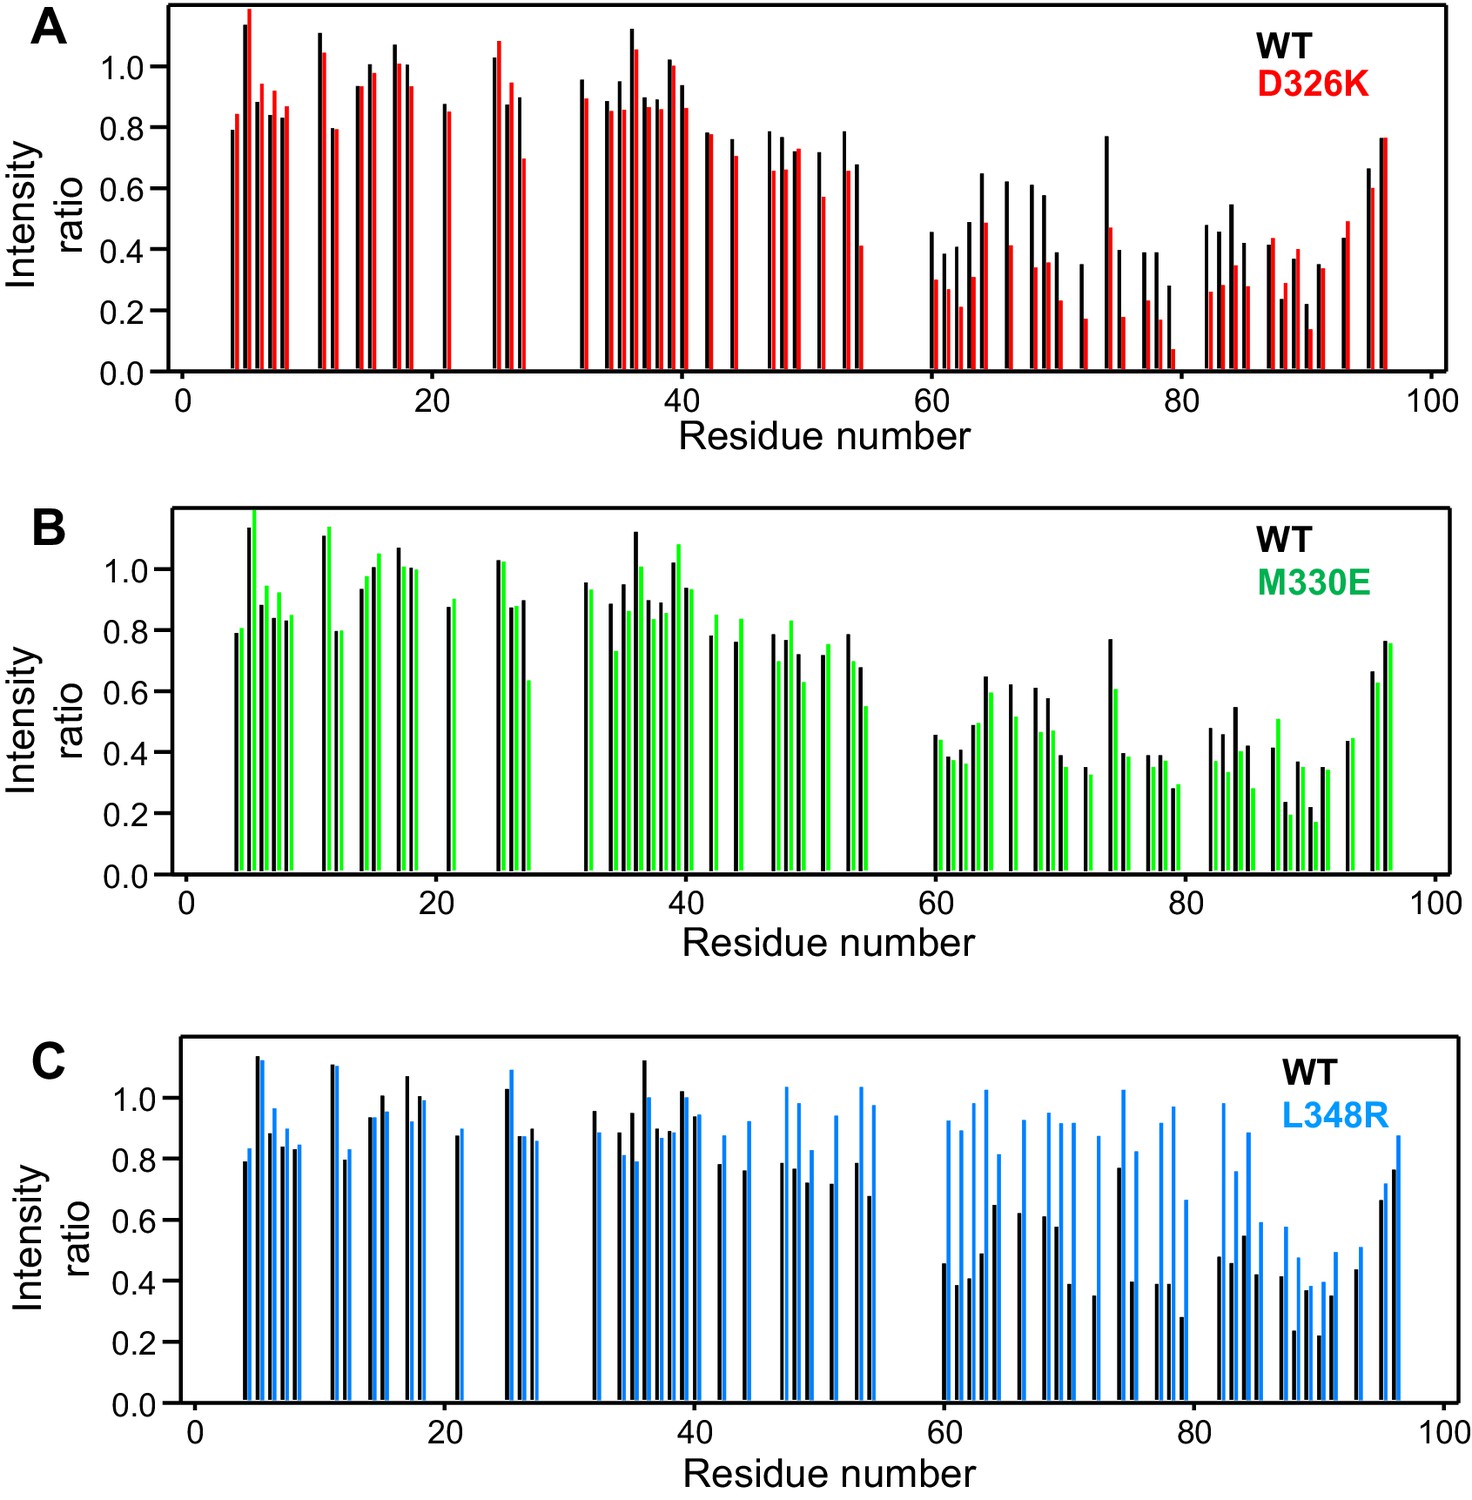
Selective enhancement and disruption of synaptobrevin binding by Munc18-1 mutations.
(A–C) Plots of the ratios of the intensities of the synaptobrevin(1-96) 1H-15N HSQC cross-peaks observed in the presence of WT or mutant Munc18-1 versus those observed in its absence, as a function of residue number. The plots compare the results obtained with WT Munc18-1 (black bars) with those obtained with the D326K (red bars, [A]), M330E (green bars, [B]) or L348R (blue bars, [C]) Munc18-1 mutants. Intensities were measured only for well-resolved cross-peaks. Ratios were calculated from experiments performed with two separate samples and averaged.
Figure 4 with 2 supplements
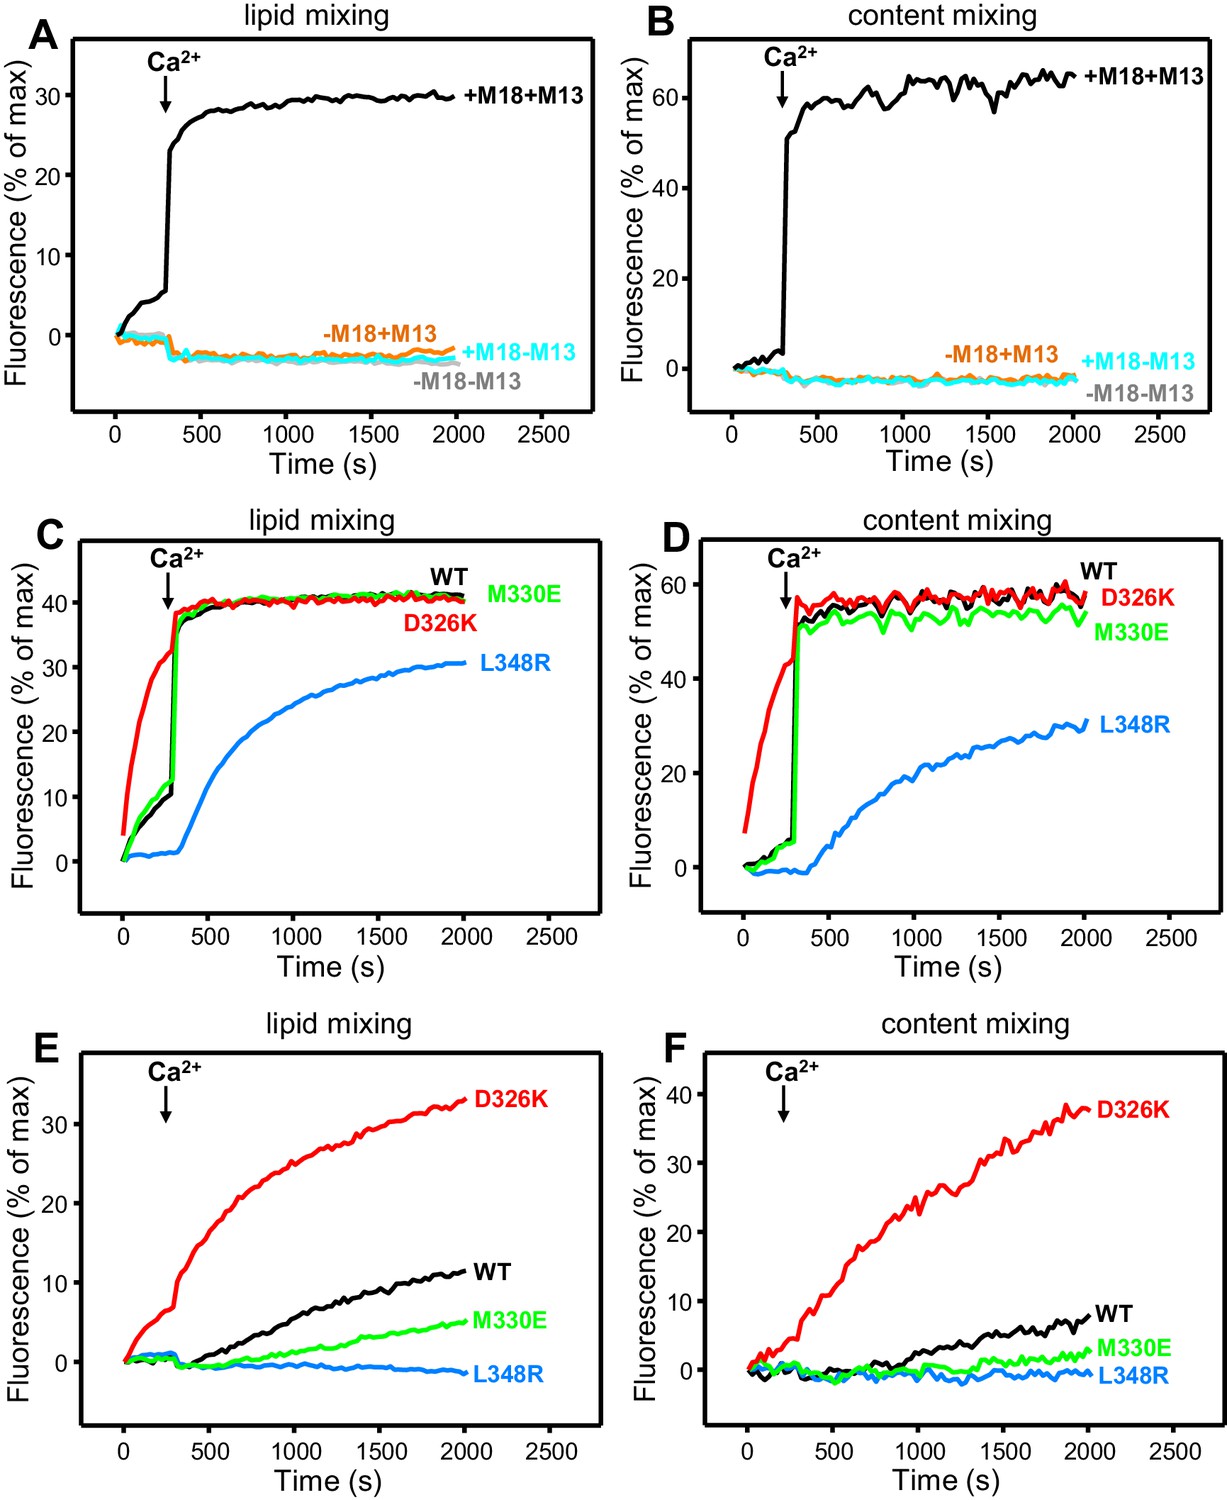
Effects of Munc18-1 mutations that alter synaptobrevin binding on membrane fusion in reconstitution assays.
Lipid mixing (A,C,E) between V- and T-liposomes was measured from the fluorescence de-quenching of Marina Blue-labeled lipids. Content mixing (B,D,F) was monitored from the development of FRET between PhycoE-Biotin trapped in the T-liposomes and Cy5-Streptavidin trapped in the V-liposomes. In (A,B), the assays were performed in the presence of NSF-αSNAP with or without WT Munc18-1 (M18) and/or Munc13-1 C1C2BMUNC2C (M13) as indicated. In (C,D), assays were performed in the presence of NSF-αSNAP, Munc13-1 C1C2BMUNC2C and WT or mutant Munc18-1s as indicated. In (E,F), assays were performed in the presence of NSF-αSNAP, synaptotagmin-1 C2AB fragment and WT or mutant Munc18-1s as indicated. Experiments were started in the presence of 100 μM EGTA and 5 µM streptavidin, and Ca2+ (600 μM) was added after 300 s.
Figure 4—figure supplement 1
Effects of Munc18-1 mutations that alter synaptobrevin binding on membrane fusion in reconstitution assays.
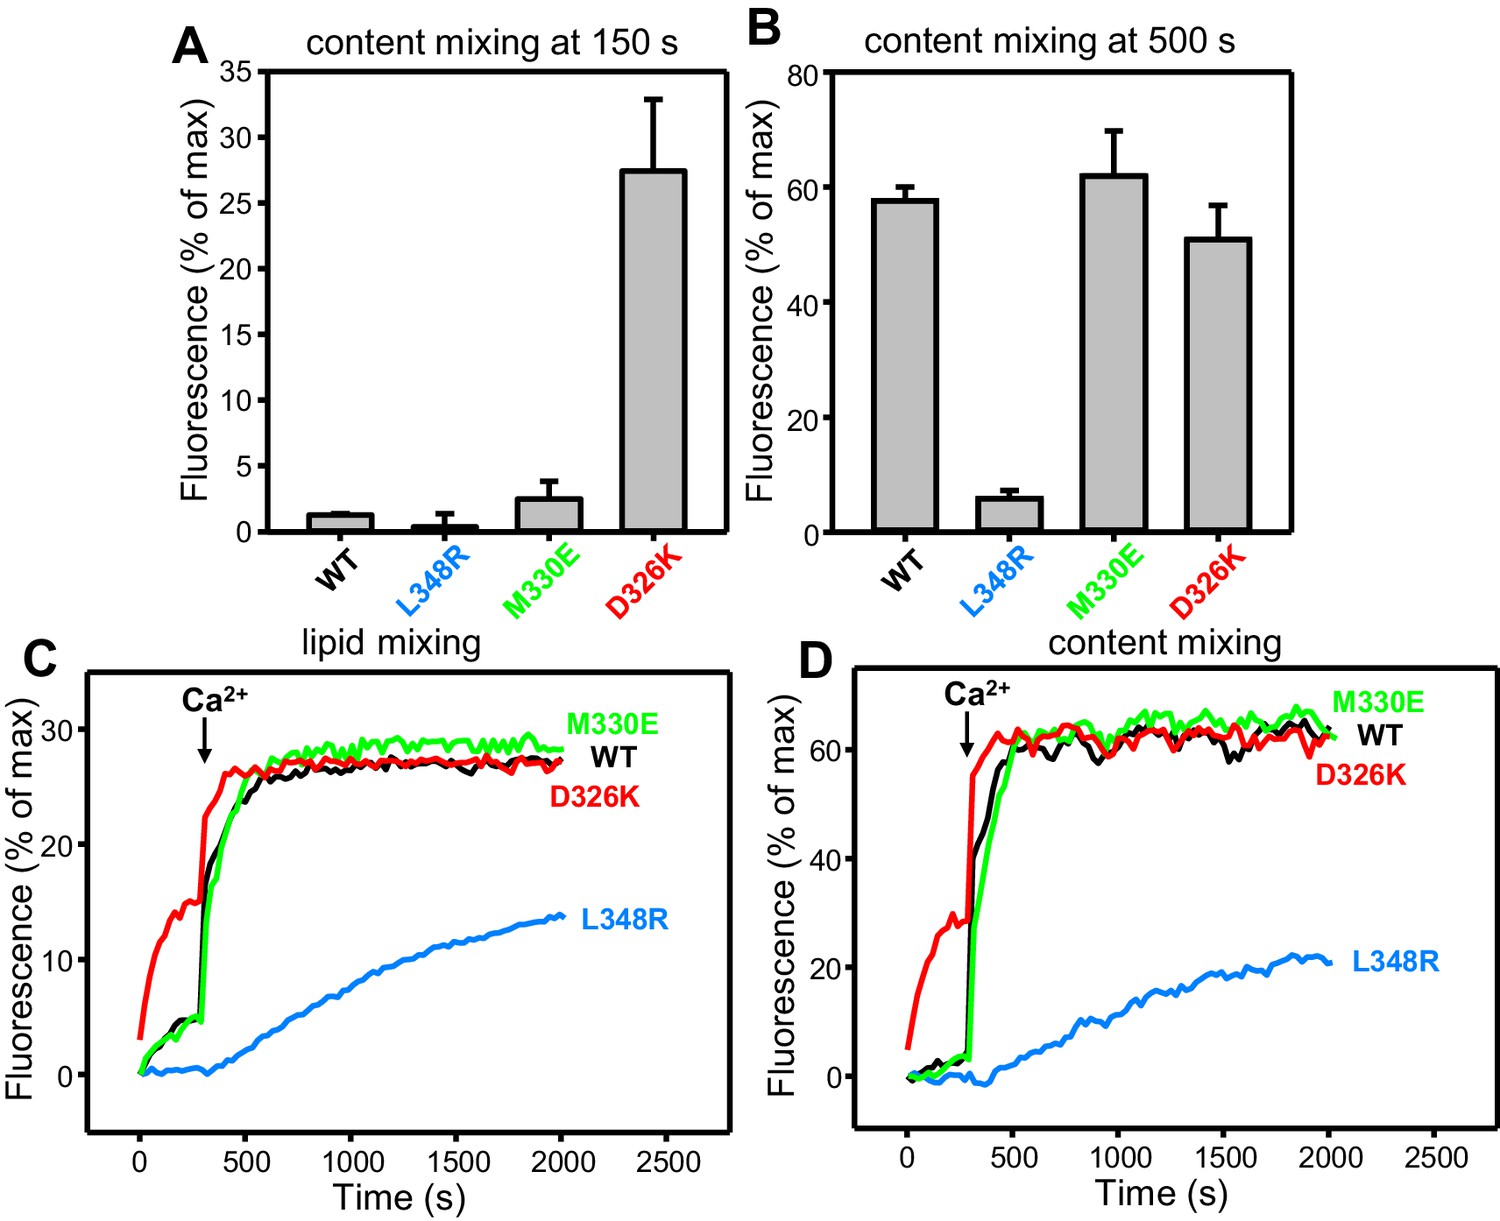
(A,B) Quantification of content mixing in the experiments of Figure 4D. Bars represent averages of the normalized fluorescence observed after 150 s (A) and after 500 s (200 s after Ca2+ addition) (B) in experiments performed at least in triplicate. Error bars represent standard deviations. (C,D) Lipid and content mixing assays performed under the same conditions as those shown in Figure 4C,D but containing in addition synaptotagmin-1 C2AB fragment.
Figure 4—figure supplement 2

Effects of Munc18-1 mutations that alter synaptobrevin binding on membrane fusion in reconstitution assays.
(A,B) Lipid and content mixing assays performed under the same conditions as those shown in Figure 4E,F but in the absence of the synaptotagmin-1 C2AB fragment. The gray curves show a reference experiment performed in the presence of NSF-αSNAP, Munc13-1 C1C2BMUNC2C and WT Munc18-1. (C) Quantification of content mixing in the experiments shown in Figure 4F. Bars represent averages of the normalized fluorescence observed after 800 s (500 s after Ca2+ addition) in experiments performed at least in triplicate. Error bars represent standard deviations.
Figure 5
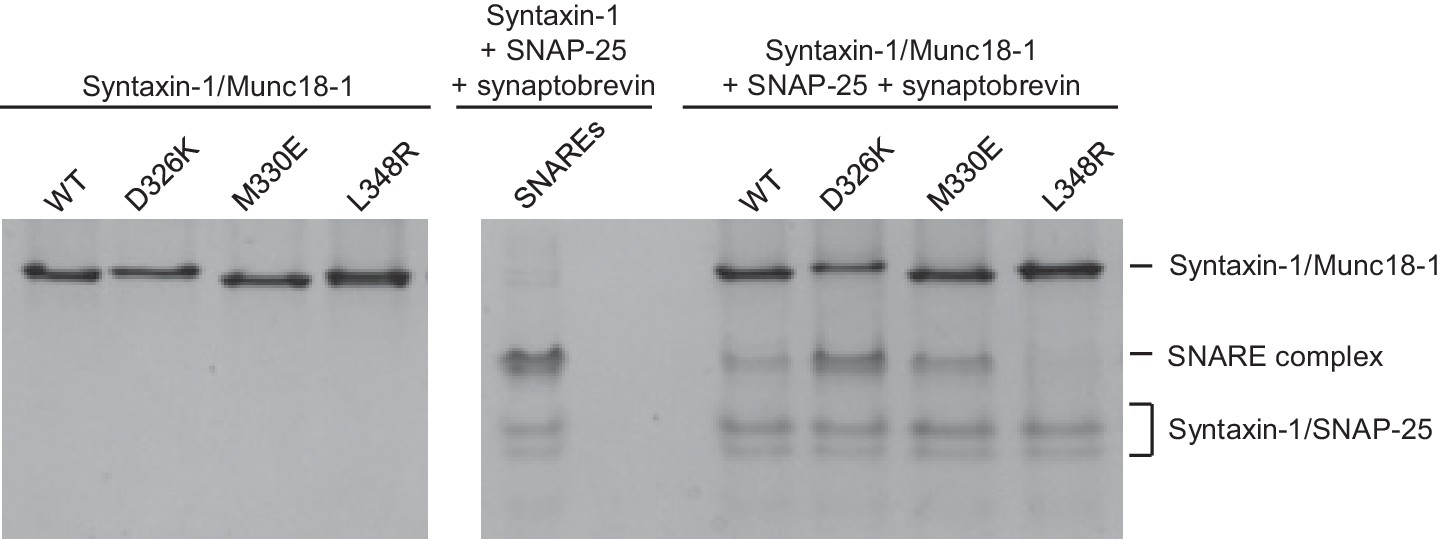
Effects of Munc18-1 mutations on SNARE complex assembly starting with the binary syntaxin-1–Munc18-1 complex.
Complexes of syntaxin-1 (2–253) with WT or mutant Munc18-1 were incubated with SNAP-25 and the synaptobrevin SNARE motif, and analyzed by native PAGE followed by Coomassie blue staining (five lanes on the right). The four lanes on the left show controls with the same amounts of the syntaxin-1–Munc18-1 complexes. The middle lane shows a SNARE complex assembly reaction performed with syntaxin-1 (2–253), the synaptobrevin SNARE motif and SNAP-25 in the absence of Munc18-1. The positions of the different complexes are indicated on the right.
Figure 6 with 3 supplements
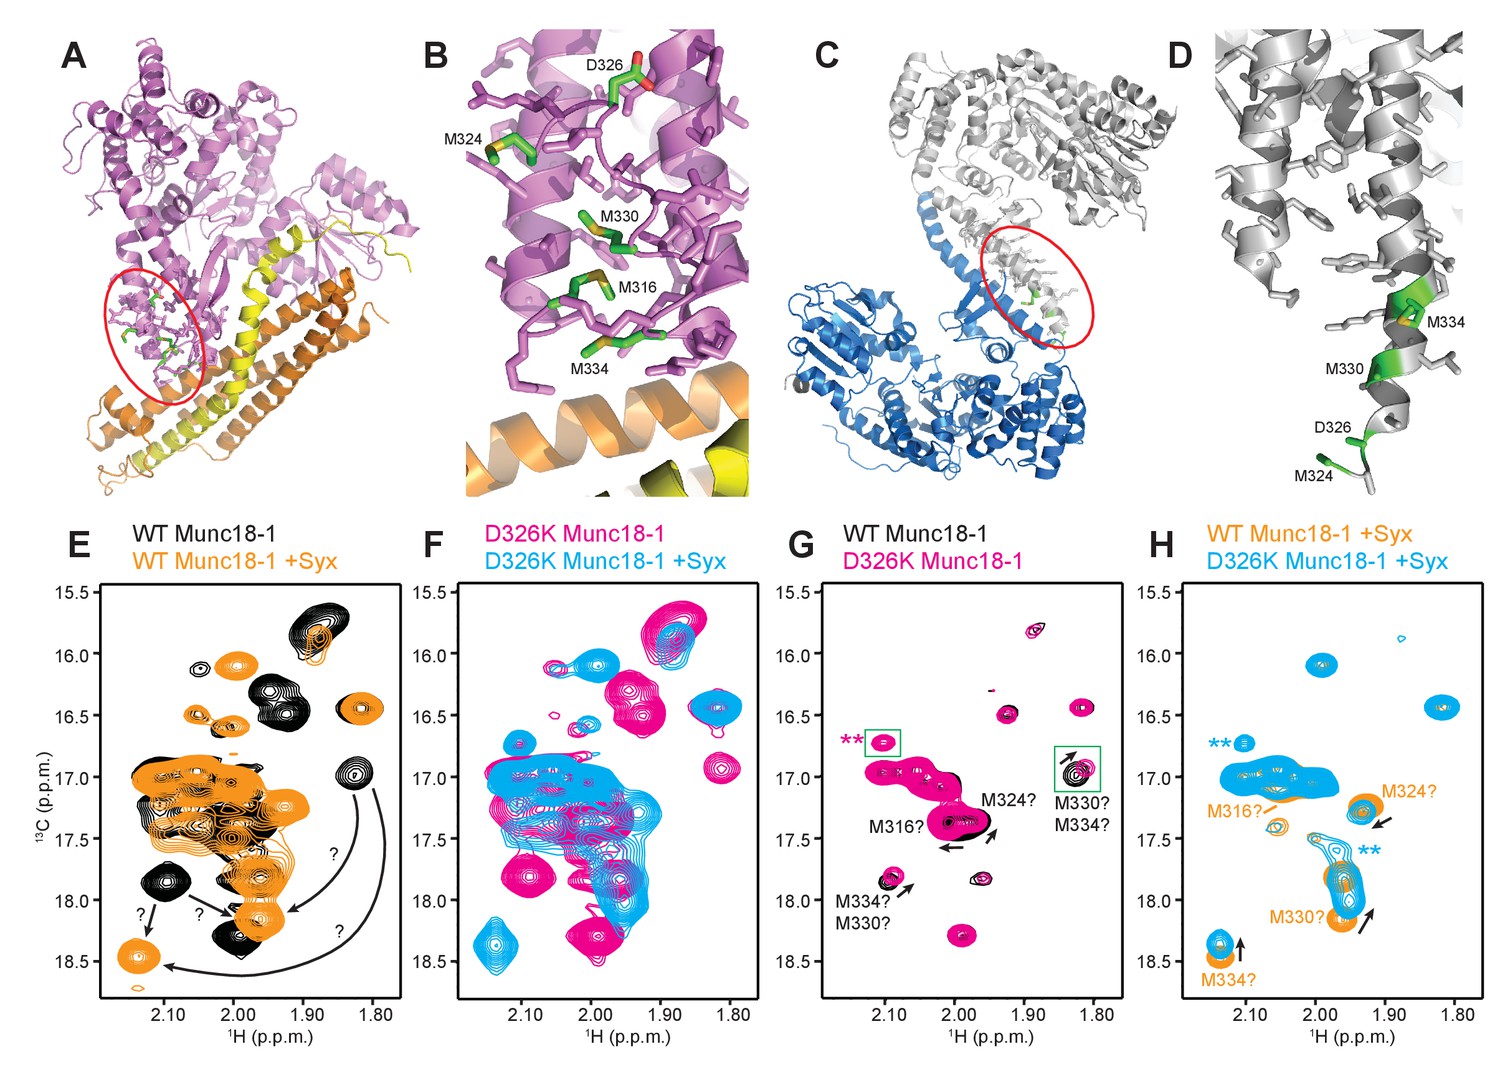
The D326K mutation destabilizes the structure of the Munc18-1 loop.
(A) Ribbon diagram of Munc18-1 (violet) bound to syntaxin-1 (SNARE motif in yellow; N-terminal region in orange) (PDB code 3C98) (Burkhardt et al., 2008). The red ellipse shows the location of the loop that connects two helices of domain 3a of Munc18-1. (B) Close-up view of the domain 3a loop region from panel A. Side chains from the loop and the two helices are shown as stick models, and the atoms of the side chains from D326, M316, M324, M330 and M334 are color-coded (carbon green; oxygen red; sulfur yellow). The diagram illustrates that these side chains are well packed within the furled structure of the loop, although they have different degrees of solvent accessibility. (C) Ribbon diagram showing the dimeric structure observed in the crystals of Munc18-1 bound to a syntaxin-4 N-terminal peptide (not shown) (PDB code 3PUJ) (Hu et al., 2011). One Munc18-1 molecules is shown in gray and the other in blue. Note that dimerization involves the two domain 3a helices but the loop is at the end of the dimerization interface. The red ellipse shows the location of the loop for the gray molecule. (D) Close-up view of the loop in the gray Munc18-1 molecule of panel C. Atoms from the loop and the two helices are shown as stick models, and the atoms observed for M324, D326, M330 and M334 are color-coded (carbon green; oxygen red; sulfur yellow). Note that residues 315–323, as well as the side chains of M324, D326 and M330, were not observable, probably because they are not packed against other regions of Munc18-1 and they are thus dynamic. (E) Expansions from the methionine methyl region of 1H-13C HMQC spectra of WT 50%-2H-ILMV-13CH3-Munc18-1 free (black contours) and bound to syntaxin-1 (2–253) (orange contours). The arrows indicate potential shifts caused by syntaxin-1 (2–253) binding on the cross-peaks tentatively assigned to M330 and M334 (Figure 6—figure supplement 2). (F) Expansions from the methionine methyl region of 1H-13C HMQC spectra of D326K 50%-2H-ILMV-13CH3-Munc18-1 free (magenta contours) and bound to syntaxin-1 (2–253) (cyan contours). (G,H) Expansions of the 1H-13C HMQC spectra shown in panels E, F but superimposing the spectra of WT and D326K 50%-2H-ILMV-13CH3-Munc18-1 in isolation (G) or bound to syntaxin-1 (2–253) (H). The spectra were plotted at higher contour levels to emphasize the spectral changes induced by the D326K mutation. Arrows indicate cross-peak shifts. Cross-peaks are labeled with residue assignments based on spectra acquired on methionine mutants (Figure 6—figure supplement 2); the ? symbols after the residue numbers indicate the tentative nature of the assignments. Green boxes indicate regions of the spectra that were plotted at lower levels to show weak cross-peaks. New cross-peaks caused by the D326K mutation are indicated by **.
Figure 6—figure supplement 1
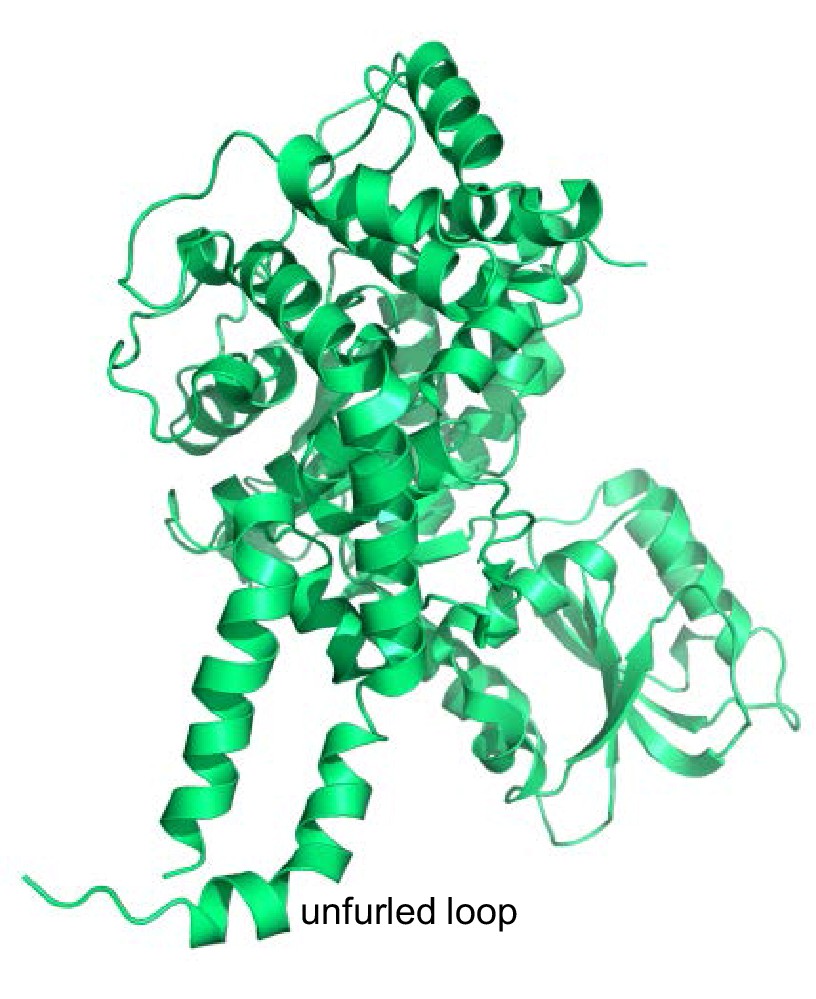
Structure of squid Munc18-1.
Ribbon diagram of the crystal structure of squid Munc18-1 (PDB code 1EPU) (Bracher et al., 2000) showing the unfurled structure of the loop connecting two helices of domain 3a.
Figure 6—figure supplement 2
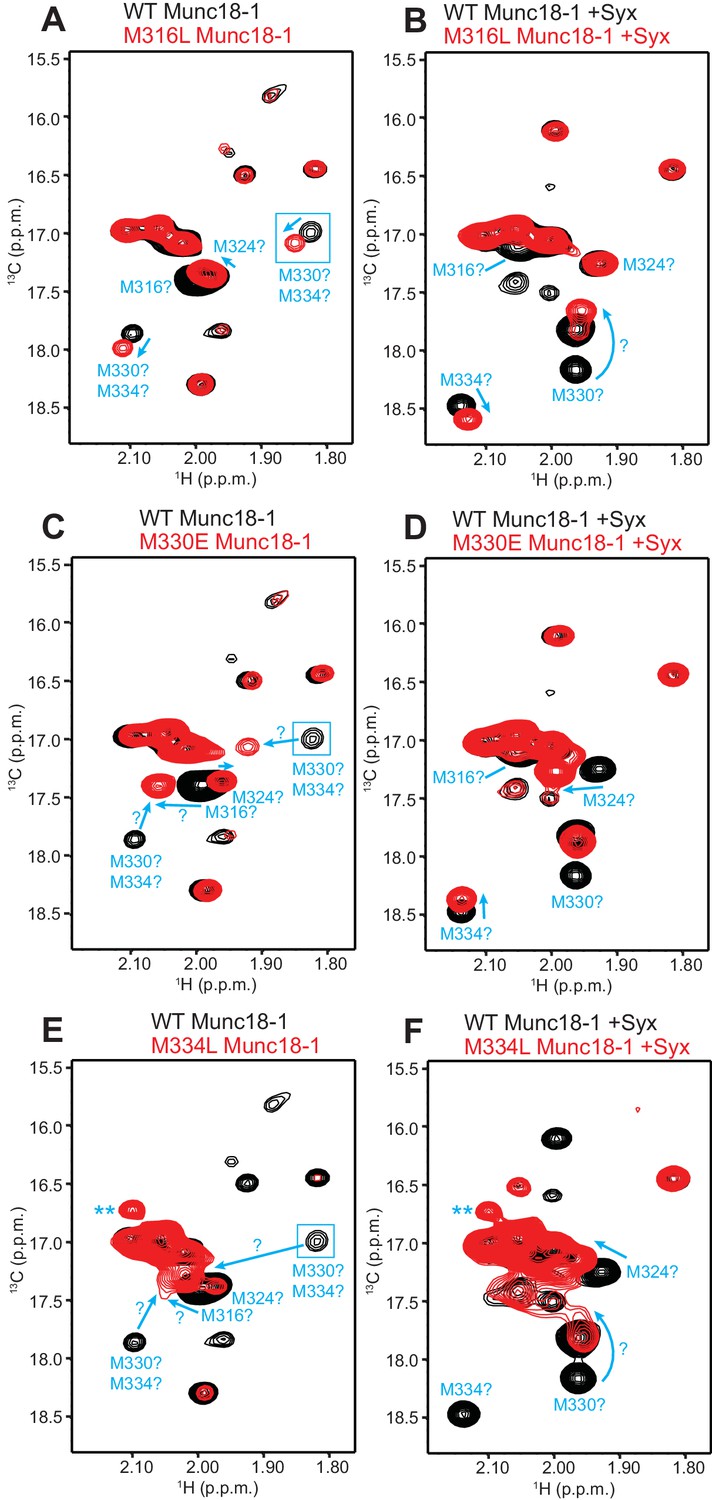
Assignment of methionine cross-peaks in 1H-13C HMQC spectra of 50%-2H-ILMV-13CH3-Munc18-1.
(A–F) Superpositions of the methionine methyl region of 1H-13C HMQC spectra of WT (black contours) and M316L (A,B), M330E (C,D) or M334L (E,F) mutants (red contours) 50%-2H-ILMV-13CH3-Munc18-1 free (A,C,E) or bound to syntaxin-1 (2–253) (B,D,F). The spectra were plotted at different contour levels to help with visualizing the most pronounced perturbations caused by the mutations. Arrows show cross-peak shifts. Tentative assignments are indicated for cross-peaks that shift or disappear due to the mutations. All assignments must be considered tentative (hence the ? symbols) because of the complexity of the perturbations caused by the mutations, but we feel more confident with the assignments of the syntaxin-1 (2–253)-bound form. Blue boxes indicate regions of the spectra that were plotted at lower levels to show weak cross-peaks. New cross-peaks caused by the mutations that do not arise from an obvious cross-peak shift are labeled with **.
Figure 6—figure supplement 3
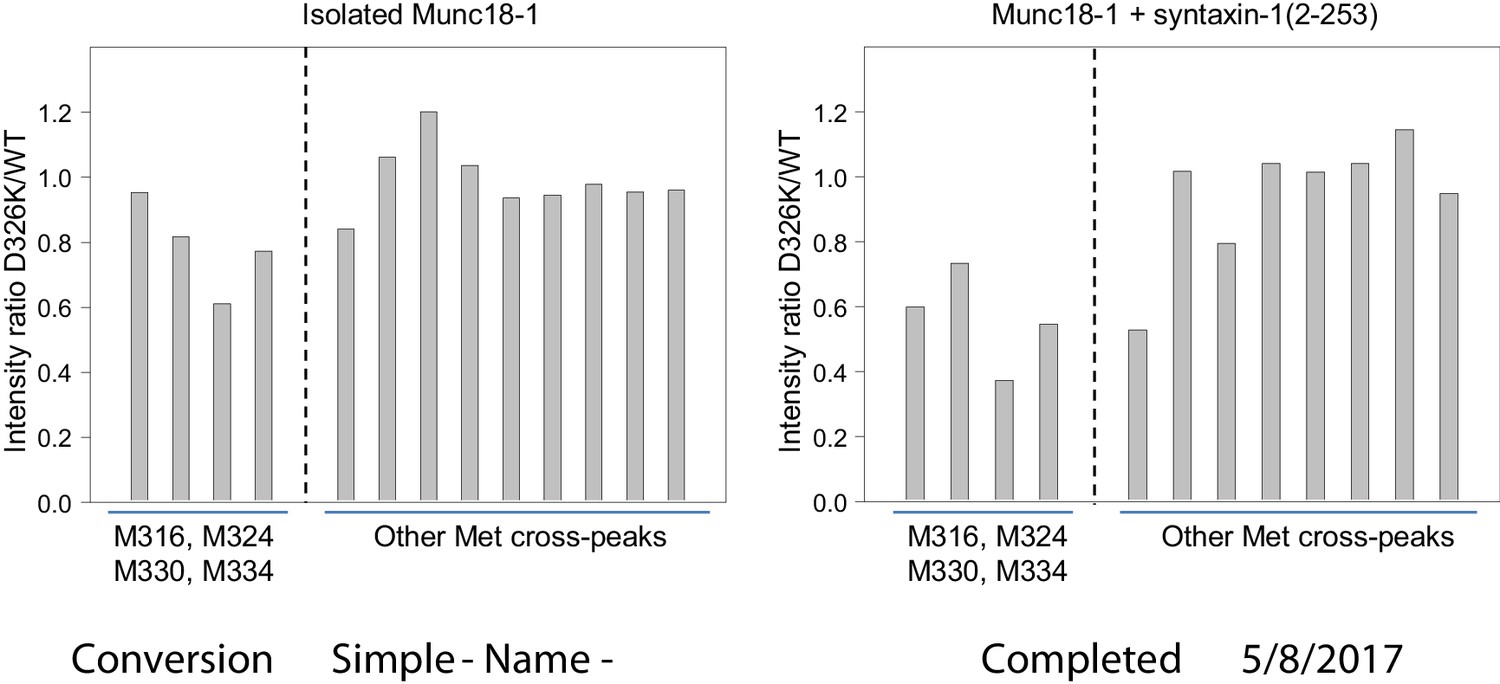
The D326K mutation causes selective decreases in the intensities of the 1H-13C HMQC cross-peaks of methionines from the domain 3a loop of Munc18-1.
The plots show the ratios between the intensities of methionine cross-peaks observed for D326K 50%-2H-ILMV-13CH3-Munc18-1 and those observed for WT 50%-2H-ILMV-13CH3-Munc18-1 in the absence (left panel) and presence (right panel) of syntaxin-1 (2–253). The data for the cross-peaks assigned to the four methionines from the domain 3a loop are grouped on the left of each plot, while those for other well-resolved (unassigned) cross-peaks are grouped on the right. To account for small differences in protein concentrations, all intensities in each spectrum were normalized with the average intensity of the unassigned cross-peaks.
Figure 7 with 1 supplement
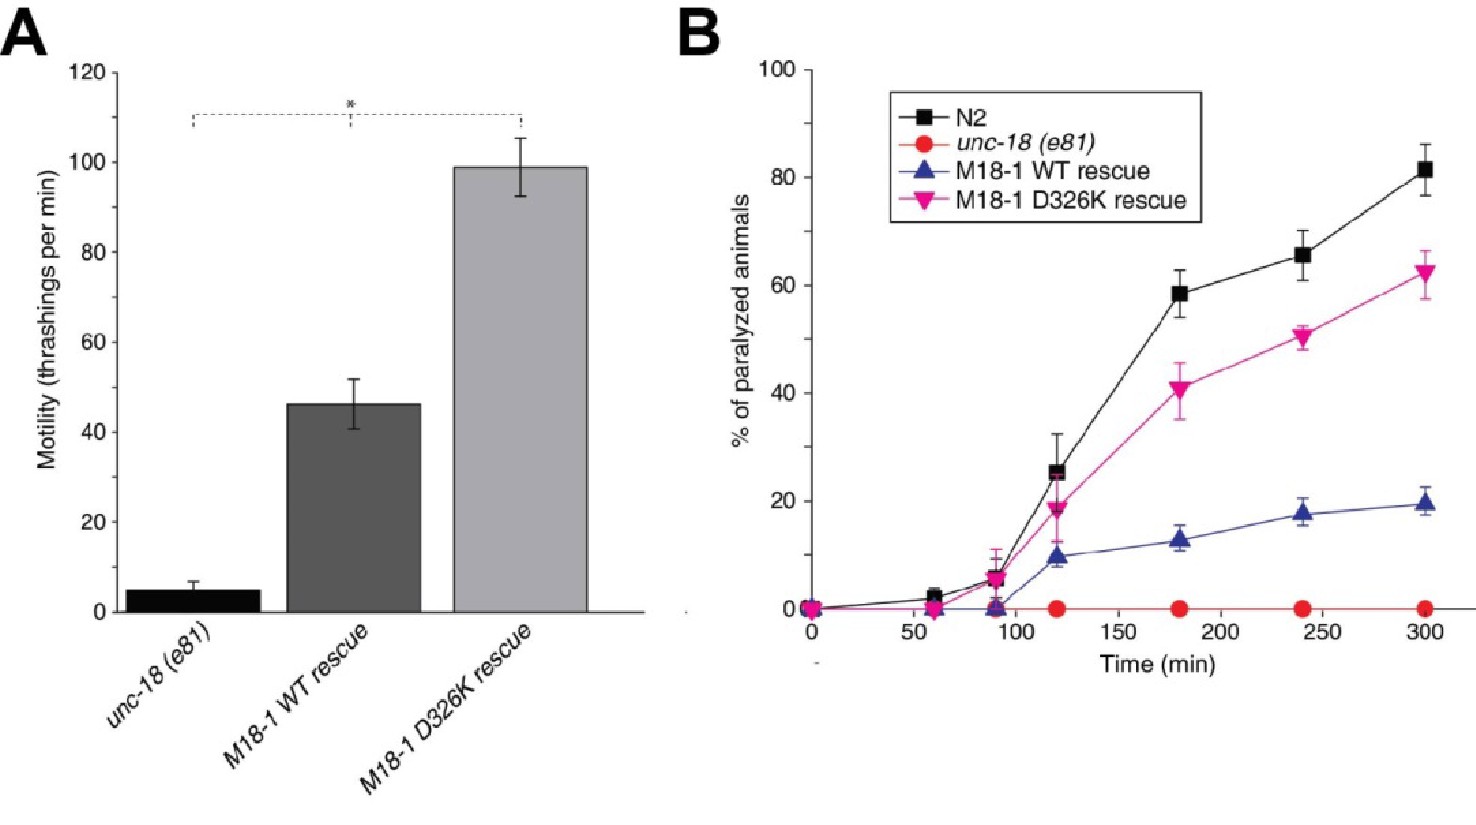
The Munc18-1 D326K mutation leads to a gain-of-function in C. elegans.
(A) The motility of C. elegans was measured by counting the number of thrashings per min in liquid medium. unc-18 null mutants expressing multiple copies of D326K Munc18-1 swim with higher thrashing rates than those expressing multiple copies of WT Munc18-1. Error bars indicate SEM (number n of worms per strain = 16–21). An asterisk indicates statistical significance at p<0.05. (B) Aldicarb assays were conducted to assess the sensitivity of rescued unc-18 null mutants to 1 mM aldicarb. unc-18 null mutants expressing multiple copies of D326K Munc18-1 were more sensitive to aldicarb than those expressing multiple copies of WT Munc18-1. The sensitivity of unc-18 nulls expressing multiple copies of D326K Munc18-1 was similar to that of WT N2 worms. Error bars indicate SEM (number n of experiments = 4, where 10–20 worms per strain were analyzed in each experiment).
Figure 7—figure supplement 1

Immunoblot analysis of unc-18 (e81) mutants expressing WT and D326K mutant forms of rat Munc18-1.
Anti-Munc18-1 monoclonal antibody (1:1000) from BD Biosciences detected a similar expression level of WT and D326K mutant forms of Munc18-1 in transgenic animals, but the antibody did not cross-react with endogenous UNC-18 protein expressed in N2 worms.
Tables
Table 1
Summary of the ITC data obtained to analyze the binding of WT and mutant Munc18-1s to syntaxin-1 and the SNARE complex*.
| Syringe | Cell | Cell concentration correct factor† | KD [nM] | ΔH[kcal/Mol] |
|---|---|---|---|---|
| Syx2-253 | WT-1 | 0.98 [0.97, 0.98] | 0.10 [0, 0.15] | −22.80 [–23.13, –22.46] |
| WT-2 | 0.92 [0.92, 0.93] | 0.34 [0, 0.67] | −22.03 [–22.36, –21.71] | |
| D326K-1 | 0.89 [0.89, 0.89] | 0.23 [0.11, 0.37] | −23.56 [–23.75, –23.37] | |
| D326K-2 | 0.86 [0.85, 0.87] | 0.30 [0, 0.67] | −25.45 [–26.30, –24.61] | |
| M330E-1 | 0.92 [0.91, 0.94] | 1.76 [0.82, 3.23] | −21.56 [–22.21, –20.92] | |
| M330E-2 | 0.97 [0.94, 1.00] | 1.52 [0.49, 3.47] | −25.67 [–27.43, –24.04] | |
| L348R-1 | 0.86 [0.85, 0.87] | 0.54 [0.23, 0.98] | −25.42 [–25.90, –24.95] | |
| L348R-2 | 0.85 [0.85, 0.85] | 0.71 [0.51, 0.93] | −25.12 [–25.31, –24.92] | |
| SNARE complex‡ | WT-1 | 1.07 [0.90, 1.18] | 1,382 [952, 2172] | −5.21 [–7.31, –4.24] |
| WT-2 | 1.01 [0.84, 1.11] | 1,479 [1018, 2355] | −5.46 [–7.99, –4.38] | |
| D326K-1 | 1.05 [0.98, 1.12] | 442 [296, 681] | −4.29 [–4.94, –3.84] | |
| D326K-2 | 0.98 [0.81, 1.11] | 361 [179, 834] | −3.13 [–4.66, –2.51] | |
| M330E-1 | 0.96 [0.79, 1.08] | 730 [414, 1459] | −2.48 [–3.72, –1.99] | |
| M330E-2 | 0.95 [0.82, 1.12] | 1,205 [993, 1462] | −3.69 [–4.30, –3.25] | |
| L348R-1 | 0.95 [0.89, 1.00] | 677 [521, 895] | −5.06 [–5.74, –4.56] | |
| L348R-2 | 0.89 [0.77, 0.98] | 781 [527, 1245] | −5.20 [–7.00, –4.30] | |
-
*Two independent experiments were performed for WT Munc18-1 and for each mutant. For all parameters, 68.3% confidence intervals calculated using the error-surface projection method are indicated between square brackets.
-
†Correction factor calculated as part of the fitting procedure to account for differences in the concentrations of active proteins (Brautigam et al., 2016).
-
‡The SNARE complex was formed with syntaxin-1 (2–253), synaptobrevin(1–96), SNAP-25(11-82) and SNAP-25(141–203).
Download links
A two-part list of links to download the article, or parts of the article, in various formats.
Downloads (link to download the article as PDF)
Open citations (links to open the citations from this article in various online reference manager services)
Cite this article (links to download the citations from this article in formats compatible with various reference manager tools)
Autoinhibition of Munc18-1 modulates synaptobrevin binding and helps to enable Munc13-dependent regulation of membrane fusion
eLife 6:e24278.
https://doi.org/10.7554/eLife.24278


