Environment determines evolutionary trajectory in a constrained phenotypic space
- University of Illinois at Urbana-Champaign, United States
Figures
Figure 1 with 5 supplements
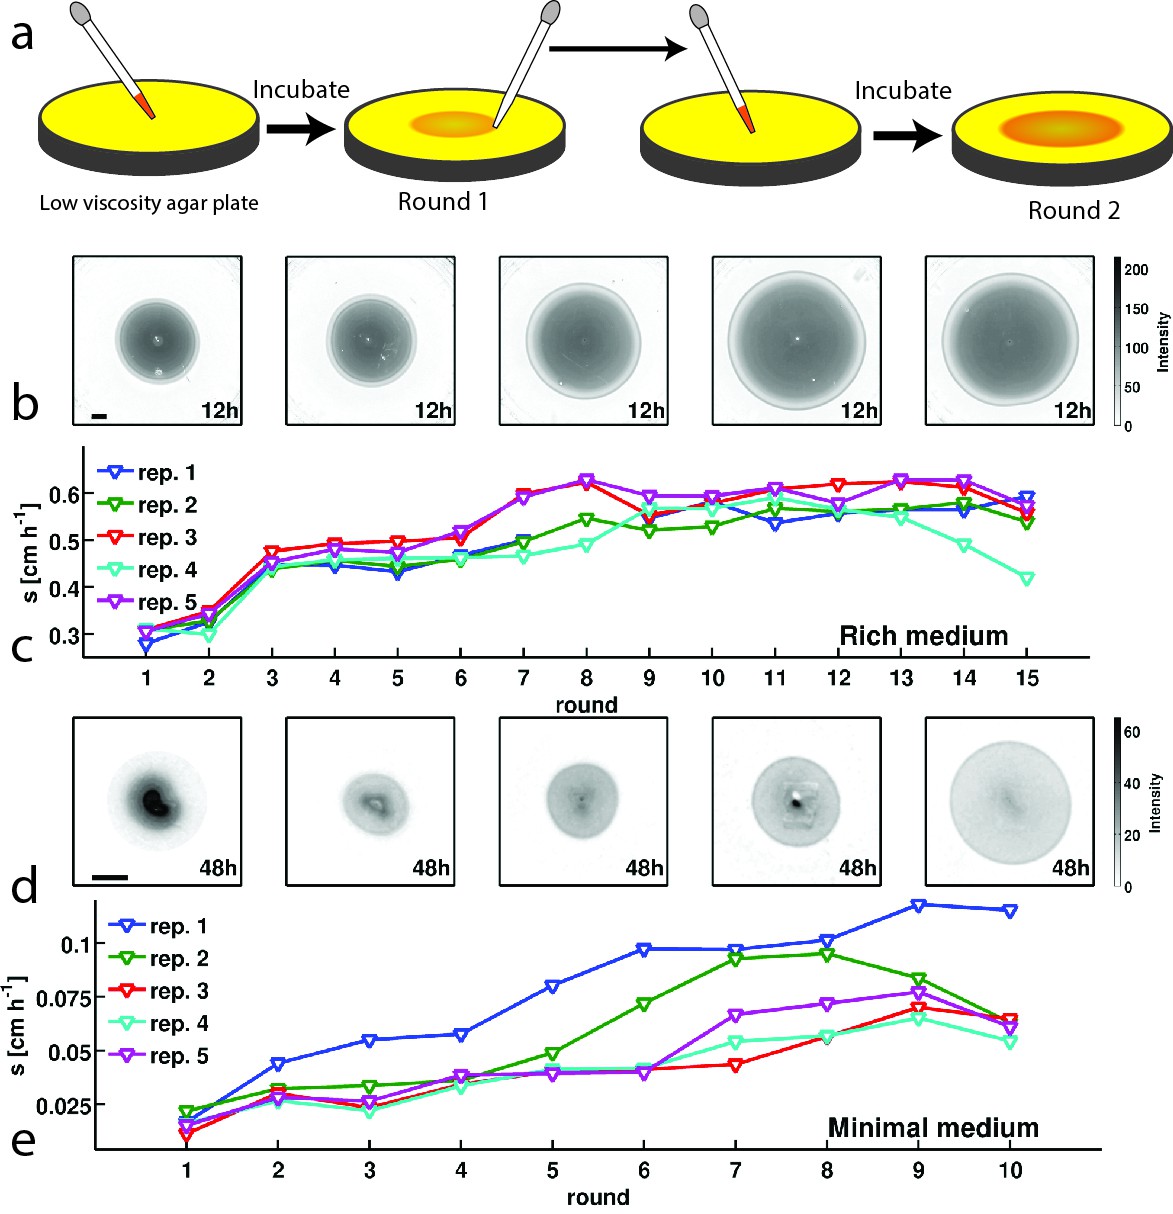
E. coli evolves faster migration through a porous environment in rich and minimal media.
(a) A schematic of the selection procedure. E. coli are inoculated into the center of a low viscosity (0.3 % w/v) agar plate where they form an expanding colony driven by metabolism and motility. After a fixed period of incubation, samples are taken from eight locations around the outer edge of the expanded colony, mixed, and used to inoculate a fresh plate. (b) Shows expanded colonies in rich medium (LB) plates after 12 hr of incubation over five successive rounds of selection. The color bar to the right applies to all panels in (b), with darker gray indicating higher cell density. Image intensity is assumed to be monotonic but not linear with cell density in the plate. Scale bar in the left panel is 1 cm and applies to all panels in (b). (c) Shows the rate of migration as a function of round of selection over 15 rounds for five replicate selection experiments in rich medium. No rate is reported for replicate 1 round 8 due to failure of the imaging device. Errors in measured rates of migration are smaller than the size of the markers. (d) Shows colonies (gray regions) in minimal medium (M63, 0.18 mM galactose) after 48 hr of incubation. The color bar to the right applies to all panels in (d). The scale bar in the left panel is 1 cm. (e) Shows the rate of migration as a function of round of selection over 10 rounds for five replicate selection experiments in minimal medium. Errors in migration rates were smaller than the size of markers. See Materials and methods for details of image processing in both experiments.
Figure 1—figure supplement 1
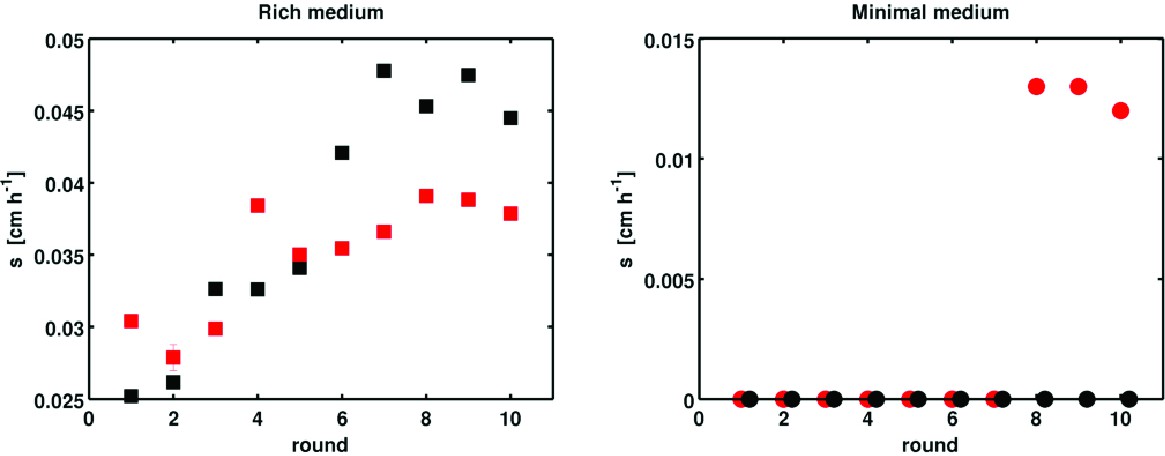
Selection with non-chemotactic (cheA-Z) mutant.
Front migration rates of non-chemotactic mutants in 0.3 % w/v agar at 30°C with LB (left panel) and M63 0.18 mM galactose (right panel). Errors are smaller than the size of the markers, except for the red replicate in rich medium at round 2. Red and black correspond to two independent selection experiments. Note the vertical scales. In minimal medium, zero migration rate denotes plates where density increased in the vicinity of the site of inoculation but no migration was observed. In these cases no measurable migration rate was obtained.
Figure 1—figure supplement 2

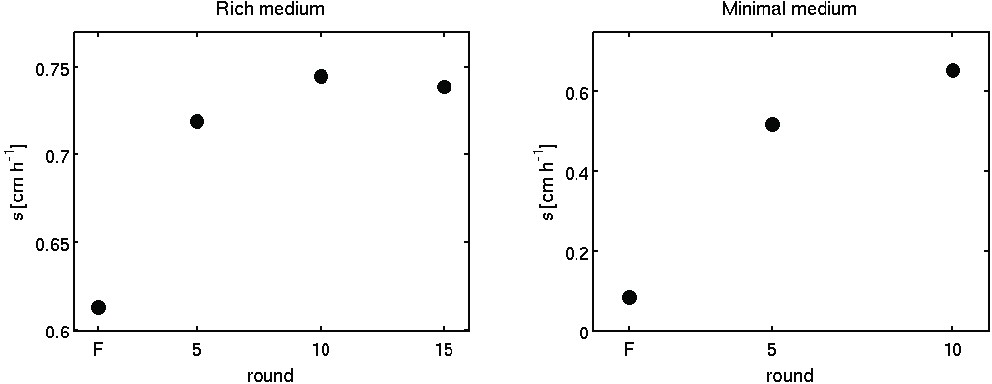
Change in migration rate during long-term liquid culture.
(left) The founder strain (Figure 1c, main text, 0.3 0.01 cm h−1) was inoculated into a turbidostat and continuously cultured in LB at 30°C for approximately 200 generations. Samples were periodically drawn from the turbidostat and used to inoculate 0.3 % w/v agar LB plates in duplicate. Migration was recorded via webcam as described in the main text. Error bars are standard errors from regression of radius with time. Note the scale on the y-axis. (right) Identical experiment in minimal medium conditions. Founding strain was grown in a single chemostat (doubling time 5.7 hr) in minimal medium for 120 generations. Plates were inoculated from samples drawn from the chemostat, two plates at each time point for the first four time points and then one plate at each time point. The last four time points (where the rate appears to saturate) exhibit a slower migration rate than the round 10 migration rates in Figure 1e ().
Figure 1—figure supplement 3
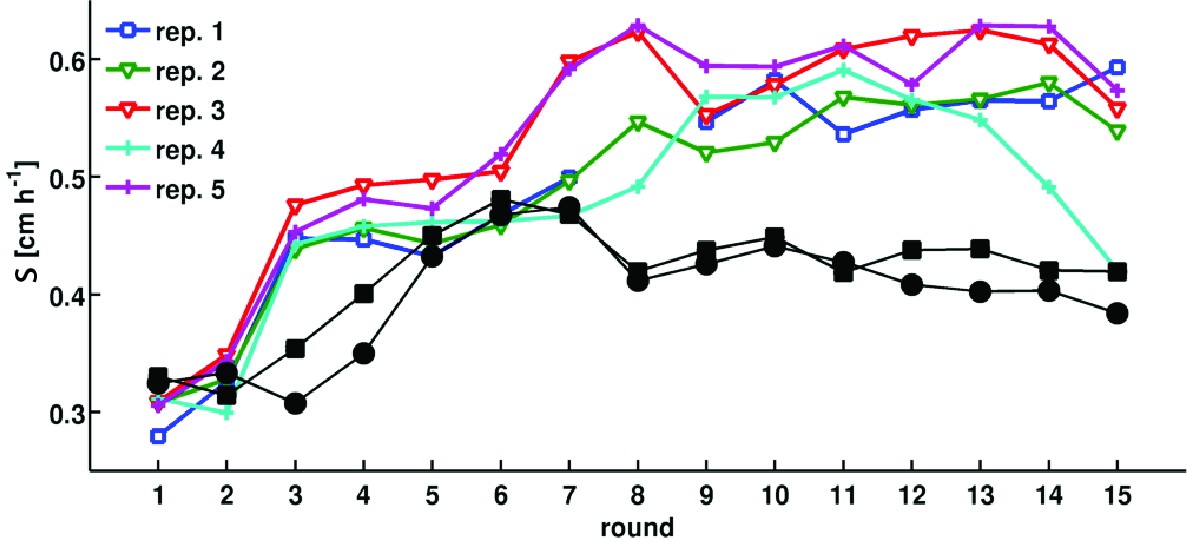
Adaptation in rich medium depends on sampling location.
Migration rate as a function of the round of selection. Colored traces are reproduced from Figure 1 in the main text. Black circles and squares are two replicate selection experiments where populations are sampled halfway between the center of the colony and the outer edge after each round of selection.
Figure 1—figure supplement 4
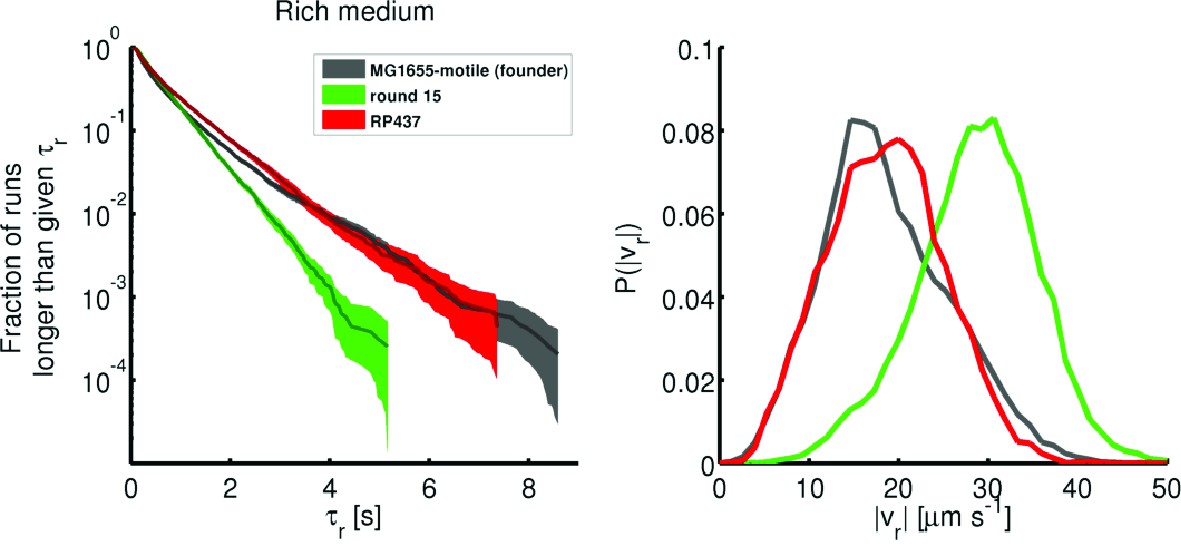
Comparison of founding and evolved strains to RP437.
Single-cell swimming in rich medium: (left) Run duration distributions identical to those shown in Figure 3a–b of the main text. 77 RP437 individuals were tracked from a culture at the same optical density as founder and round 15 (replicate 1). A total of 9218 run events were recorded. The average standard deviation in run duration for RP437 is 0.76 0.82 s. (right) Comparison of run speeds for the same three strains. RP437 has an average standard deviation in run speed of 18.6 6.4 μm s−1. The average run duration for RP437 exceeds that of round 15 (), and the average run speed is smaller than that of round 15 (). For the RP437 strain in rich medium, we measure a migration rate of 0.15 0.01 cm h−1 and a liquid culture growth rate of 1.1 0.02 h−1.
Figure 1—figure supplement 5

Persistence of rich medium fast migrating phenotype in liquid culture.
A strain isolated after 15 rounds of selection in rich medium (Figure 1c, replicate 1, main text, 0.6 cm h−1) was inoculated into a turbidostat and continuously cultured in LB at 30°C for approximately 140 generations. The number of generations was estimated assuming a constant generation time of 36 min. Samples were periodically drawn from the turbidostat and used to inoculate 0.3 % w/v agar LB plates. Migration was recorded via webcam as as described in the main text. Error bars are standard errors from regression of radius with time.
Figure 2 with 3 supplements

Migration rate increases with run speed and growth rate.
(a) Front migration rate (heatmap) as a function of run speed () and maximum growth rate () simulated using the reaction-diffusion model discussed in the text with parameters appropriate for rich medium conditions (Table 1). Model parameters were estimated using the method developed by Croze et al (Appendix 1). Black square shows the run speed and growth rates measured for the founding strain in rich medium (Figure 3). Standard error in is smaller than the size of the marker; error bar in is the standard deviation across three replicate measurements. (b) Identical to panel (a) except for minimal medium. The abrupt change in migration rate around 0.2 h−1 corresponds to a transition from diffusion dominated front migration to a traveling wave (Appendix 1). The founding strain’s phenotype is shown as a black circle, error bars are constructed identically to those in (a).
Figure 2—figure supplement 1
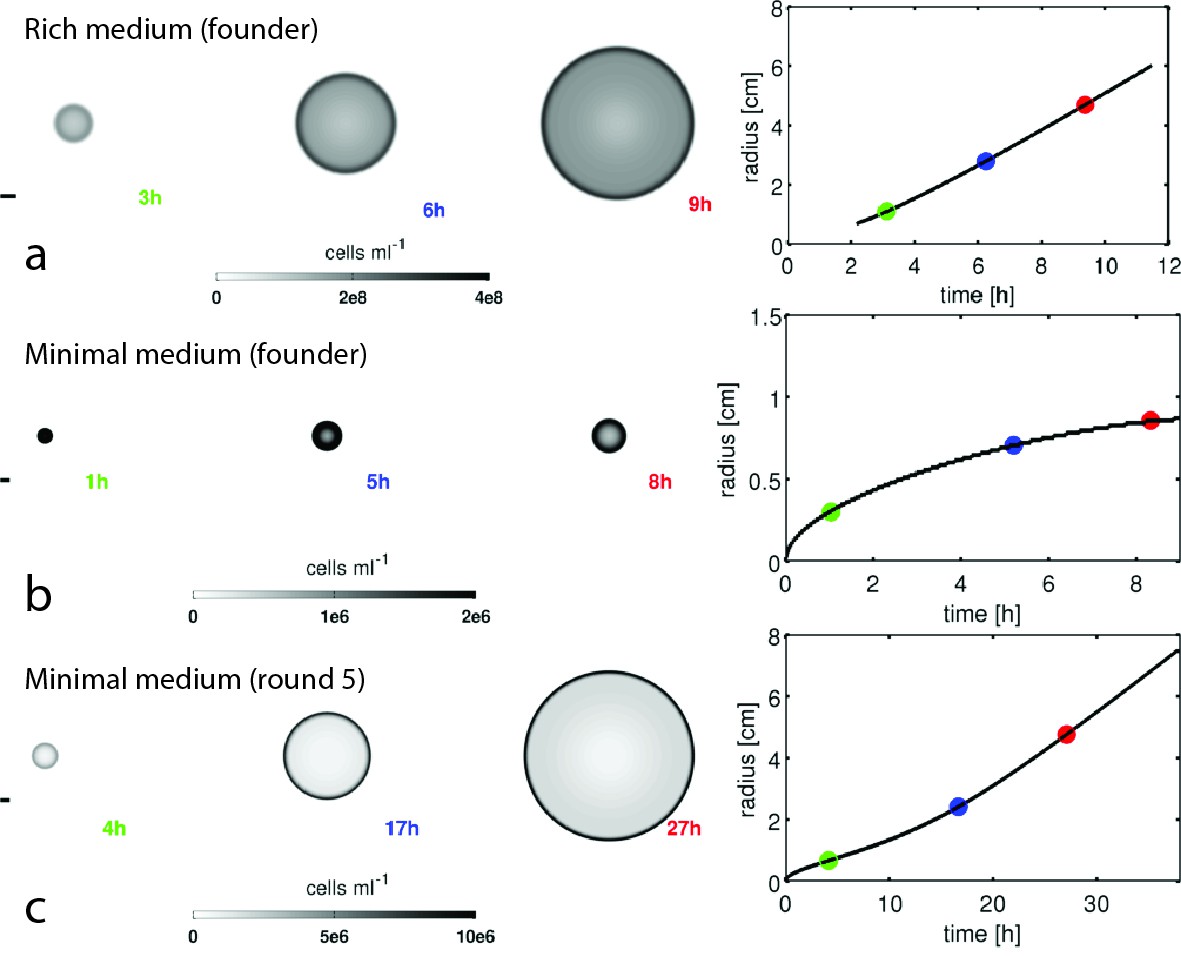
Reaction-diffusion model recapitulates qualitative features of colony expansion.
Results from numerical simulations of the reaction-diffusion model in the main text. Simulations for founding strain in rich medium (a), founding strain in minimal medium (b), and round 5 strain in minimal medium (c) are shown. Three snapshots of for each simulation are shown as greyscale heatmaps (note independent color maps). The panel on the right in (a–c) shows the location of the front in time (black trace) and the time points corresponding to the three snapshots are labeled by the colored points. The parameters for each simulation are given in Table 1. The founding strain in minimal medium exhibits diffusive transport due to slow growth, this is also observed experimentally (Figure 1, main text). Scale bars on the left of each panel are 1 cm.
Figure 2—figure supplement 2
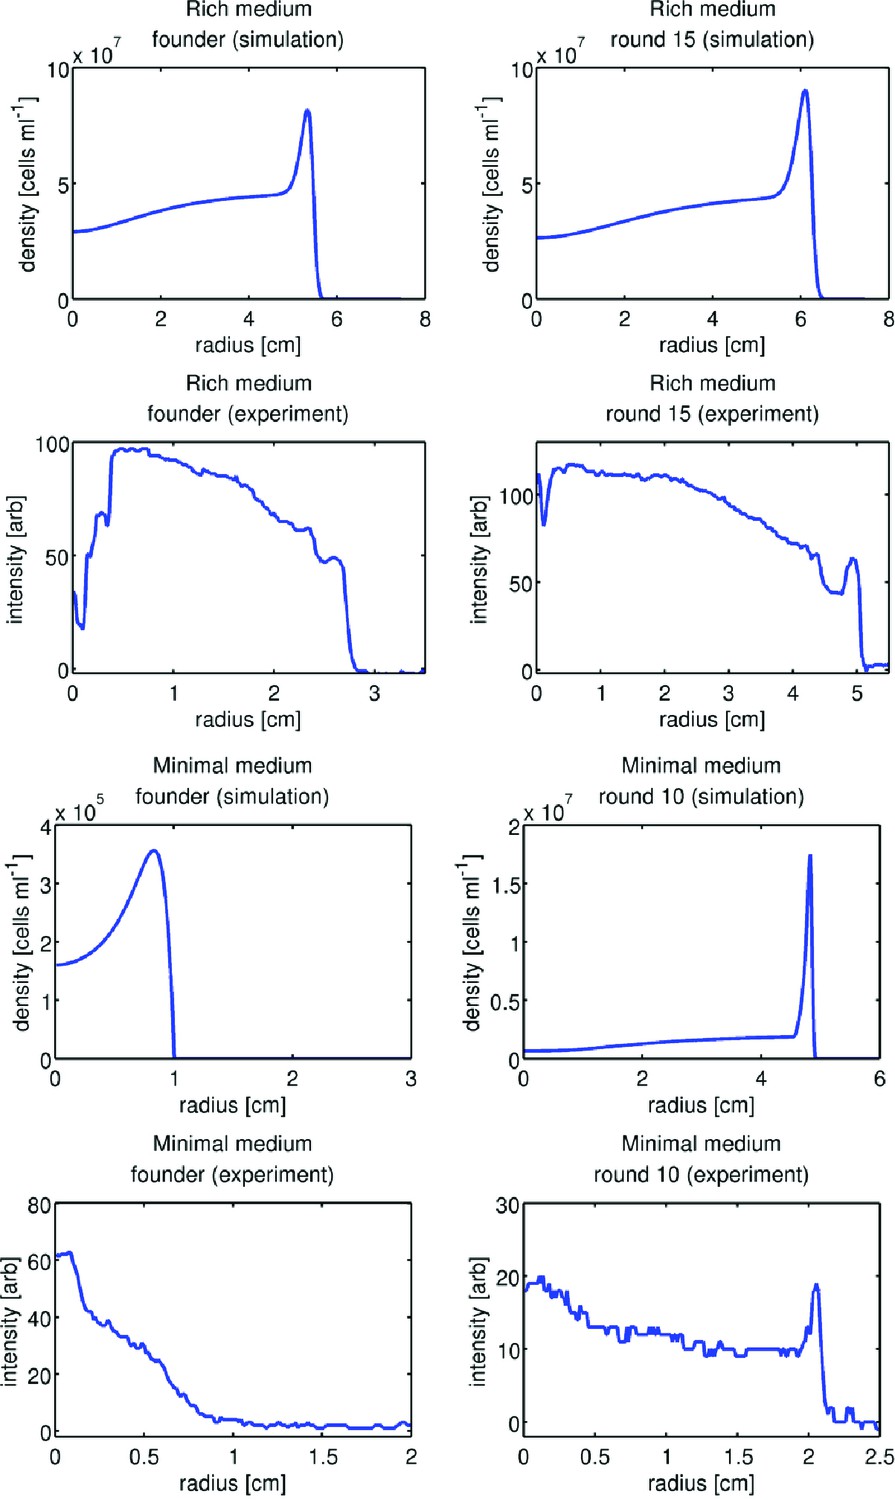
Comparison of front profiles from simulation and experiment.
Upper four panels show front density profiles from simulation and experiment for the rich medium condition. Left column shows founder and right column round 15. Simulation profiles are taken from time points after a constant rate of expansion has been attained. Experimental front profiles are taken at the end of colony expansion (12 hr). In the experimental front profiles, the high-density regions arise from metabolism of amino acids other than serine. The lower four panels are identical to the upper four but are taken from minimal medium simulations and experiments.
Figure 2—figure supplement 3
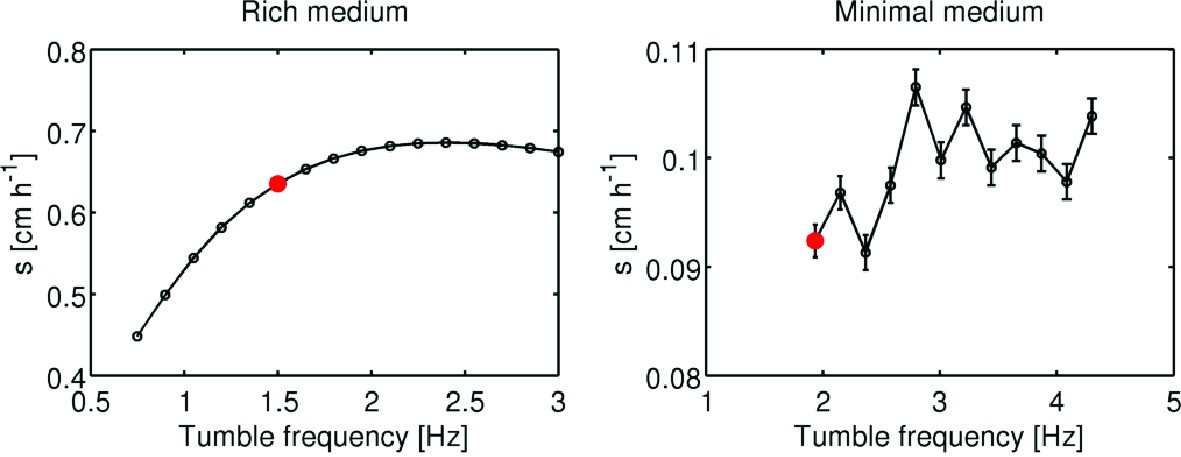
Simulation of migration rate versus tumble frequency.
Using the formalism of Croze et al., migration rate as a function of tumble frequency (Appendix 1) was computed using the reaction-diffusion model presented in the main text. Panels show migration rate () as a function of tumble frequency () for rich medium and minimal medium conditions. Red dots indicate measured tumble frequency for founder in each condition (Figure 3, main text). Error bars in the left panel are smaller than the size of the markers. Error bars in the right panel are standard errors from a linear regression on the front location in time. The non-monotonic variation of migration rate with tumble frequency in minimal medium results from the slight curvature in the front location as a function of time in these conditions (Figure 2—figure supplement 1 [right panel]).
Figure 3 with 4 supplements
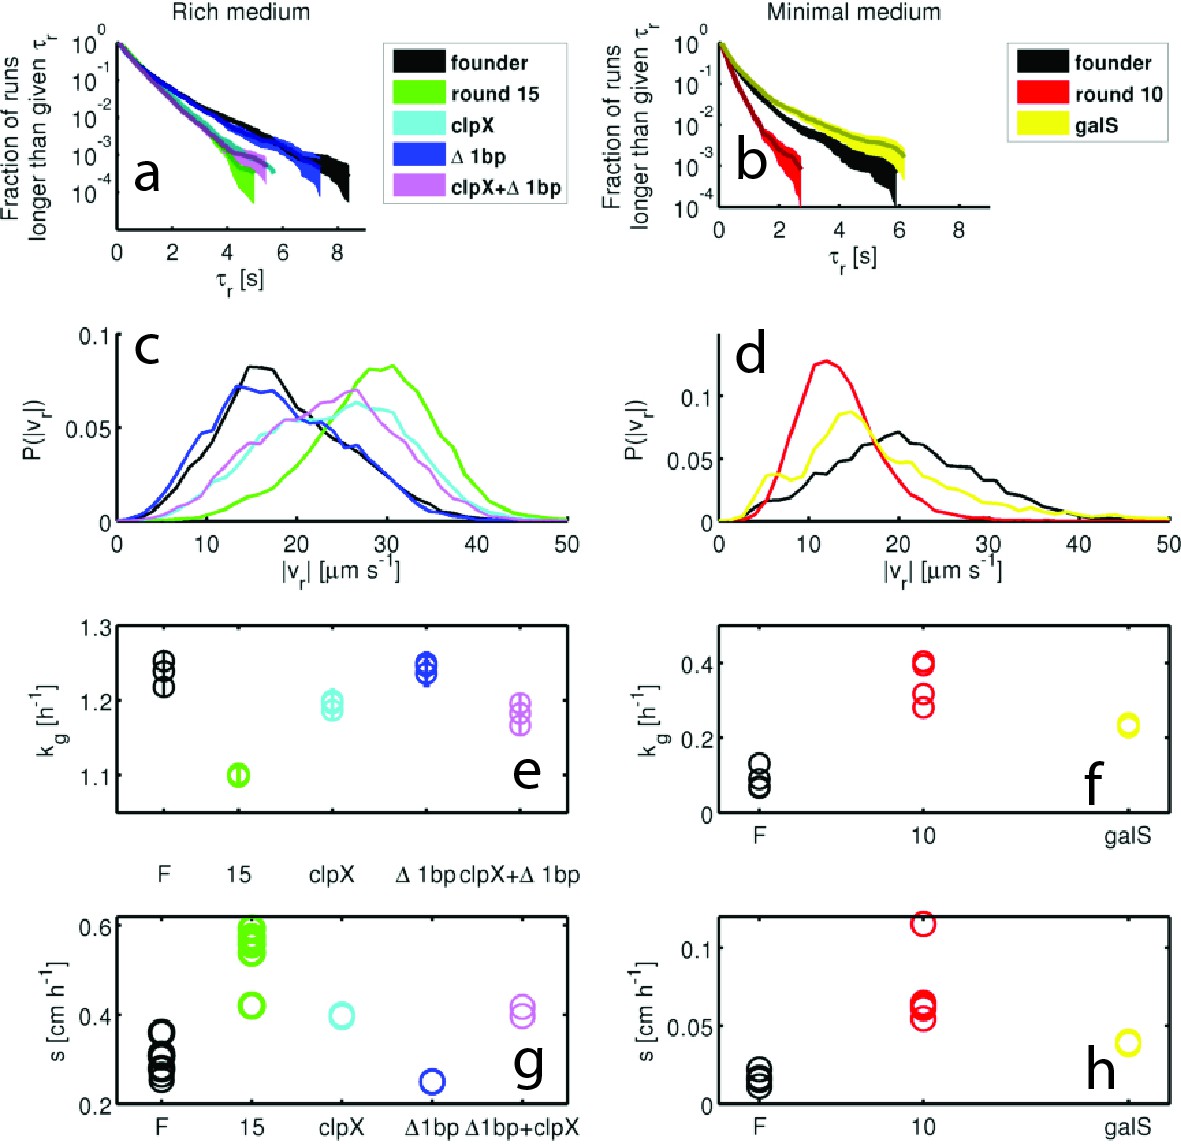
Dynamics of phenotypic evolution in rich and minimal media.
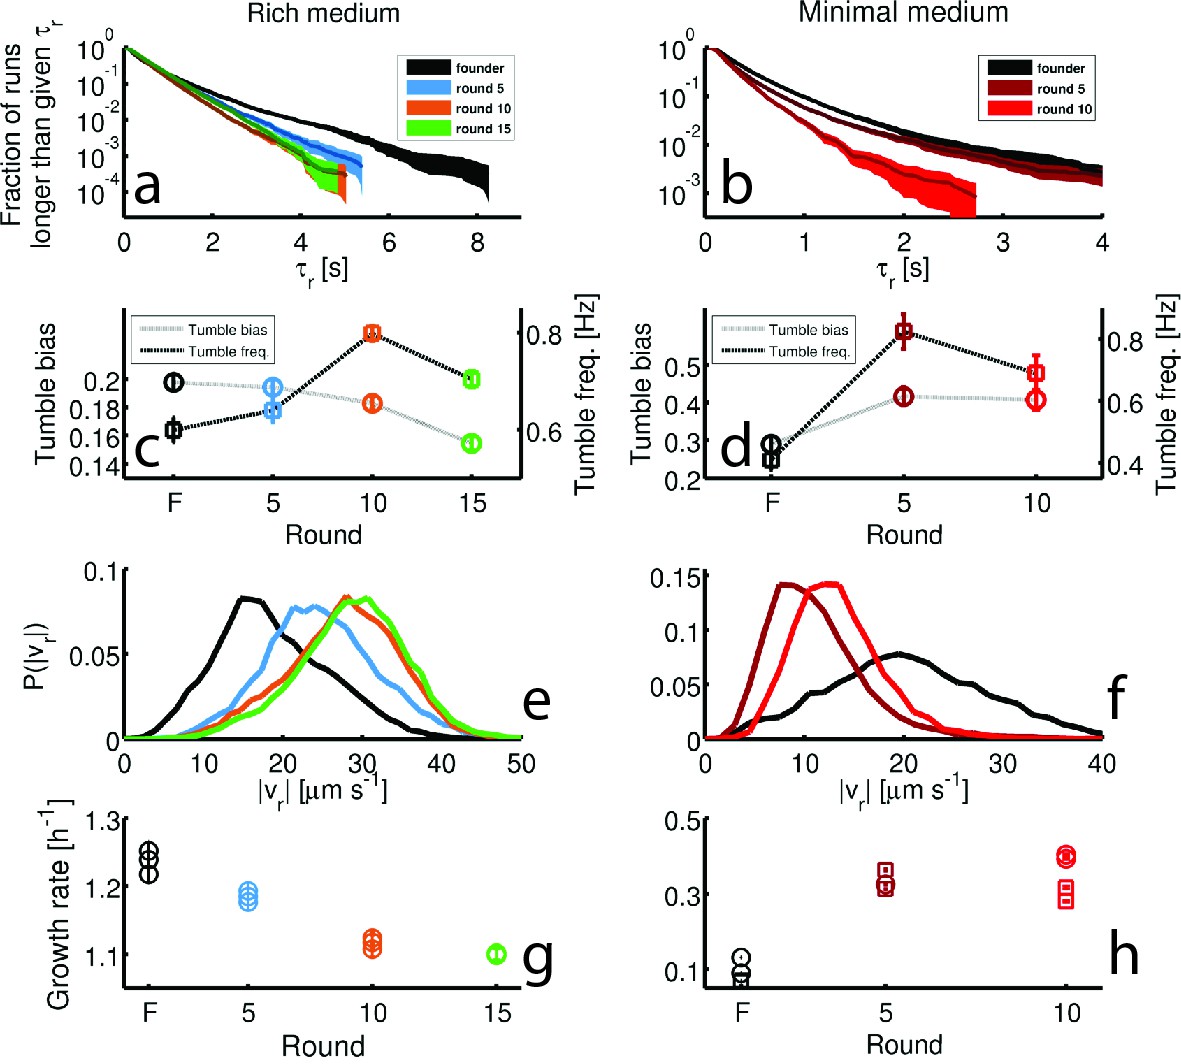
(a–f) Show single-cell swimming phenotypes (run duration (), run speed (), tumble bias and tumble frequency, see Materials and methods). Tracking was performed for founding strain (140 cells, 19,597 run events), strains isolated after 5 (79 cells, 12,217 run events), 10 (97 cells, 18,505 run events) and 15 (96 cells, 15,928 run events) rounds in rich media and in minimal media for the founding strain (72 cells, 7556 run events), round 5 (45 cells, 9724 run events) and round 10 (25 cells, 4892 run events). (a) Shows the fraction of runs longer than a given for strains evolved in rich media (95% confidence intervals from bootstrapping). The mean and standard deviation in run duration for founder is 0.66 0.78 s, for round 5: 0.63 0.61 s, for round 10: 0.58 0.50 s and for round 15: 0.65 0.57 s. Round 5, 10 and 15 strains exhibit shorter average run durations than founder (p<0.05). (b) Shows the same distribution for strains in minimal medium with founder exhibiting average run duration 0.49 0.52 s, round 5: 0.44 0.48 s and round 10: 0.33 0.28 s. Rounds 5 and 10 exhibit shorter average run durations than founder (). (c–d) Show average fraction of time spent tumbling (tumble bias) and tumble frequency (tumbles per second) for rich medium and minimal medium respectively. Note the two vertical axes. In rich medium only the round 15 tumble bias is significantly different from founder (p<0.001), but the tumble frequency is higher than founder for both rounds 10 and 15 (p<0.001). In minimal medium all tumble biases and frequencies are significantly different from founder for all strains (p<0.001). (e) Shows run speed distributions for strains evolved in rich medium, legend in (a) applies. The average standard deviation run speeds are, for founder: 18.7 7.1 μm s−1, round 5: 24.9 7.1 μm s−1, round 10: 27.6 7.0 μm s−1, and for round 15: 28.7 6.8 μm s−1. Average run speeds for rounds 5, 10 and 15 are greater than founder (f) Shows the same distributions for strains evolved in minimal medium, average run speed for founder: 20.7 10.8 μm s−1, for round 5: 11.2 4.8 μm s−1 and for round 10: 13.3 4.4 μm s−1. Both rounds 5 and 10 exhibit slower average run speeds than founder, the legend in (b) applies. (g–h) Show growth rates in well mixed liquid culture for all strains studied in panels (a–f) in the medium in which the strains were selected. (g) Shows triplicate measurements from each of the four strains isolated in rich medium. Rounds 5, 10 and 15 exhibit slower growth than founder (p<0.01). (h) Shows growth rates for strains isolated from minimal medium selection experiment. Four replicate measurements were made for founder and round 10 and three replicate measurements for round 5. Squares and circles demarcate measurements made on separate days. Rounds 5 and 10 have higher growth rates than founder (p<10-5).
Figure 3—figure supplement 1
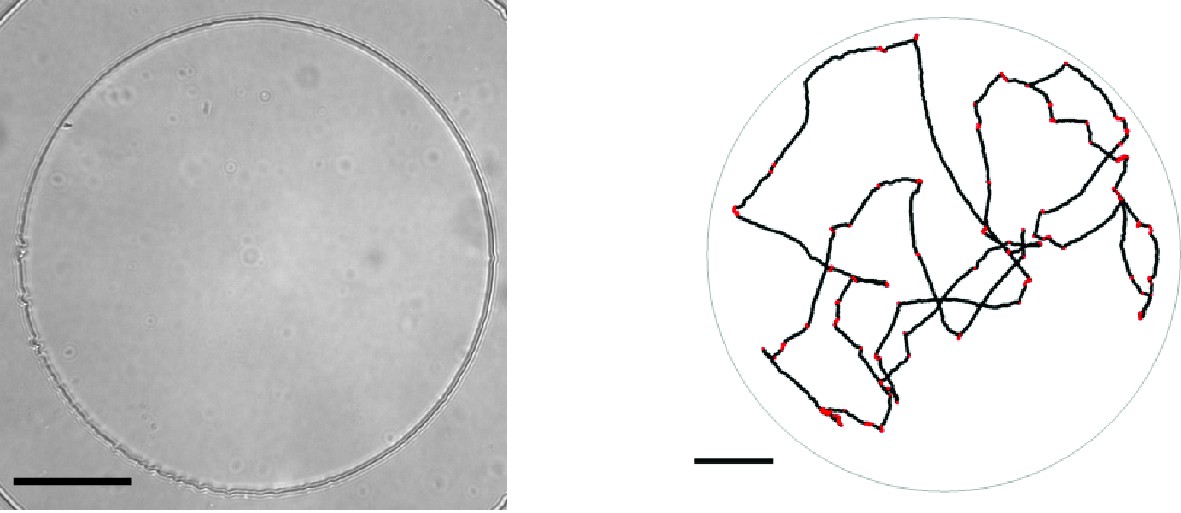
Microfluidic device and single-cell swimming trajectory.
(left) Bright-field image at 20 magnification of the PDMS microfluidic chamber used to trap single bacteria.The boundary of the chamber can be seen as the high contrast circle. Scale bar is 50 μm. (right) A segmented trajectory of a single cell in a chamber like the one shown on the left. Dots indicate locations of the centroid. Black portions indicate running events and red portions tumbles. Image processing and run-tumble detection are described in the Materials and methods section of the main text.
Figure 3—figure supplement 2
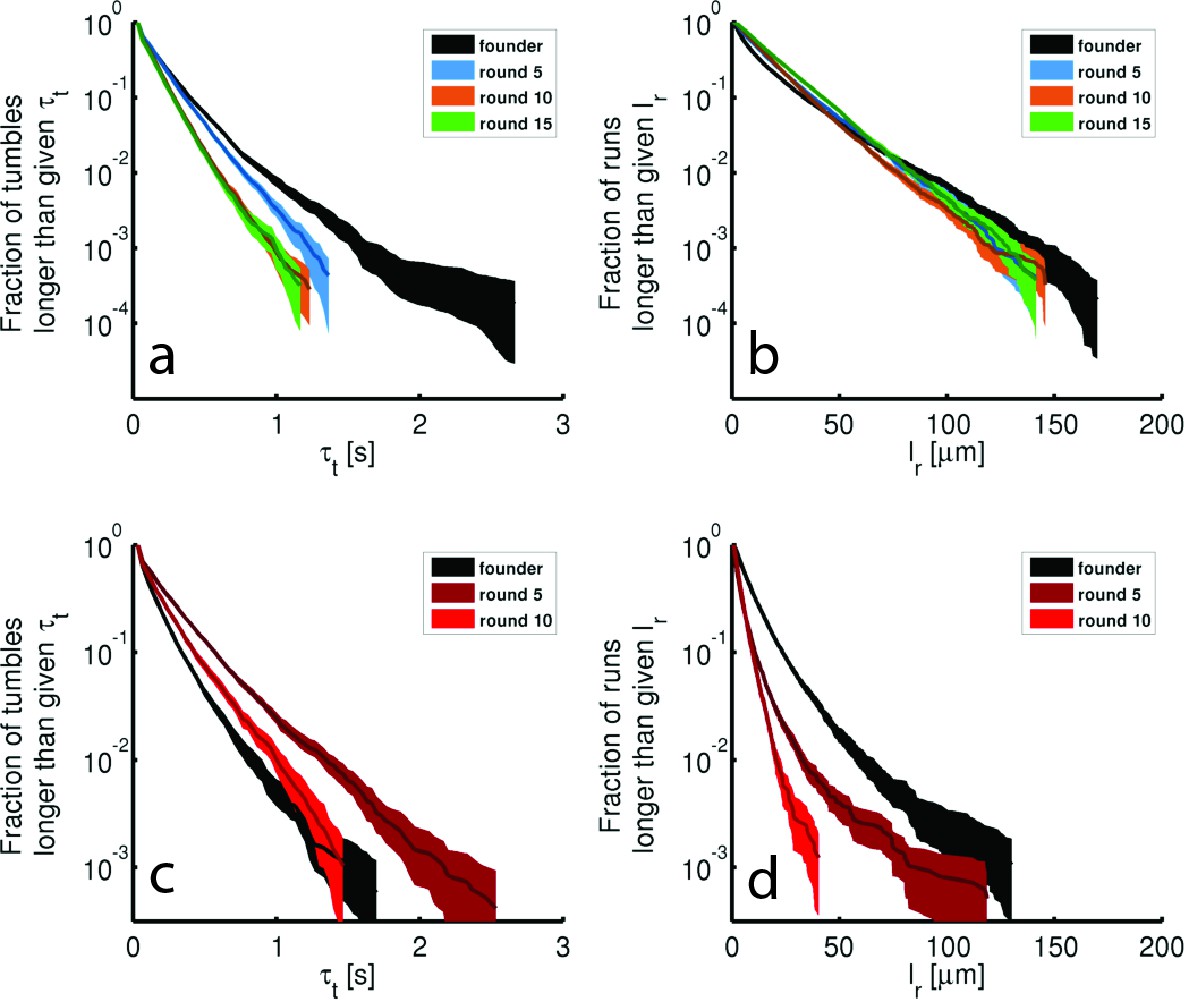
Tumble durations and run lengths for evolved strains.
Tumble durations () and run lengths () for single-cell tracking shown in Figure 3 of the main text. (a) Shows the complementary cumulative distribution of tumble durations for rich media evolved strains. Shaded regions are 95% confidence intervals from bootstrapping. Averages and standard deviations are: 0.18 0.20 s, 0.17 0.16 s, 0.14 0.13 s, 0.14 0.12 s for founder, round 5, 10 and 15 respectively. (b) Identical to (a) except constructed for run lengths. The run length is found by computing the arc-length between tumble events for each run. The averages and standard deviations are 13.5 17.7 μm, 16.5 17.4 μm, 16.5 16.0 μm, 19 17.8 μm respectively. (c) and (d) are identical to (a) and (b) for minimal medium evolved strains (replicate 1, Figure 1e). The tumble durations are 0.17 0.17 s, 0.25 0.28 s, 0.20 0.21 s for founder, round 5 and 10. The respective run lengths are 10.0 13.0 μm, 5.0 7.5 μm and 4.6 4.6 μm.
Figure 3—figure supplement 3
Reproducibility of the evolved phenotype.
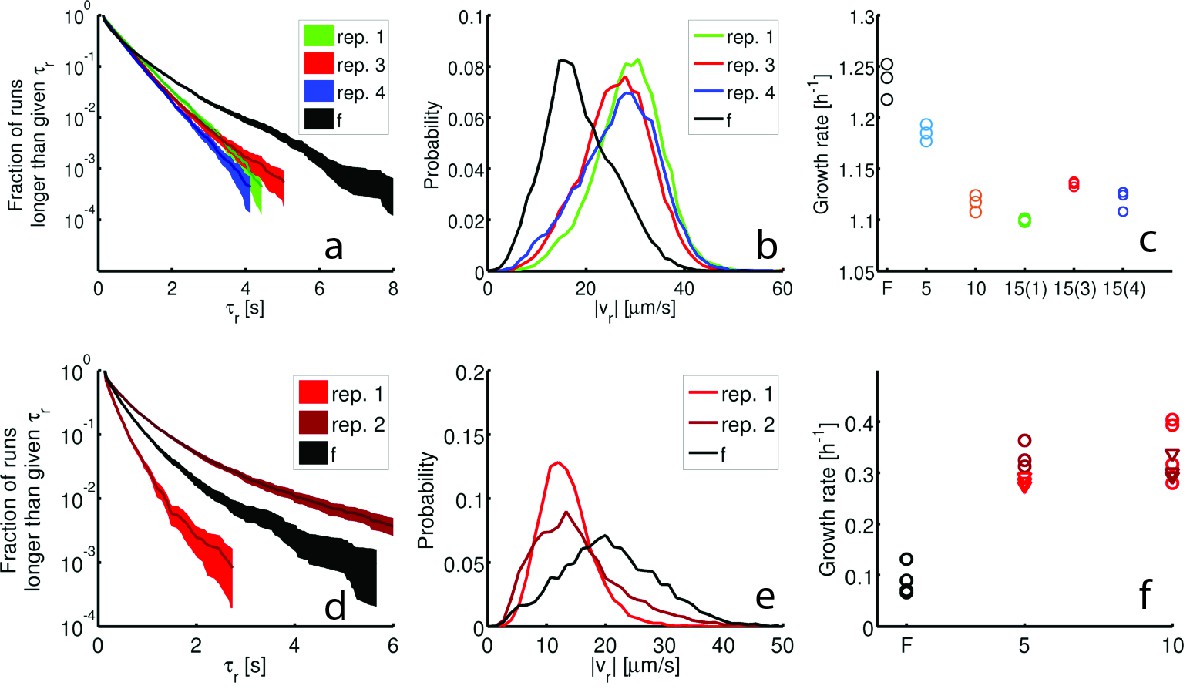
Single-cell tracking and growth rate measurements were performed on independently selected strains in rich medium (15 rounds, (a–c)) and minimal medium (10 rounds, (d–f)). Panels show run durations (a,d), run speeds (b,e) and growth rates (c,f). The founder population is shown in black in all panels. Single-cell tracking experiments were performed on two additional round 15 strains from the rich medium experiment (replicates 3 and 4, Figure 1c main text). For replicates 1, 3 and 4– 96, 85 and 98 individuals were tracked for a total of 15,928, 16,639 and 18,171 run events respectively. (a) shows the run duration distributions for these three strains with mean standard deviations: 0.65 0.57 s, 0.60 0.53 s, 0.57 0.49 s respectively. (b) Run speed () distributions for the same three strains with means 28.7 μm s−1, 26.2 μm s−1 and 26.7 μm s−1 respectively. (c) maximum growth rates () for the same two independently evolved strains (with 15(3) denoting replicate 3 and 15(4) denoting replicate 4). The decline in growth rate relative to founder is significant for both replicate 3 () and replicate 4 (). (d–f) show swimming statistics and growth rates for independently evolved strains in minimal medium, replicate 1 and 2 correspond to Figure 1e in the main text. (d) Run duration distributions for constructed for 25 individuals from replicate 1 and 80 individuals from replicate 2 corresponding to 4892 and 9357 run events respectively. The mean standard deviations are: 0.33 0.26 s and 0.65 0.87 s. (e) Run speed distributions for independently evolved minimal medium strains. Means for replicates 1 and 2 are 13.3 μm s−1 and 15.25 μm s−1 respectively. (f) Growth rates for founder, rounds 5 and 10 reproduced from Figure 1e, main text (circles) along with growth rate measurements for strain isolated from round 5 of replicate 2 (dark red triangles) and round 10 of replicate 2 (light red triangles). Means are 0.3h-1and 0.24h-1 Round 5 growth rates do not differ significantly () while round 10 growth rates do (). Both replicate 2 strains from rounds 5 and 10 exhibit growth rates larger than founder ().
Figure 3—figure supplement 4

Swimming statistics as a function of culture density.
(a–d) Show swimming statistics (, , and ) as a function of culture optical density for rich medium founding (black) and evolved (green, round 15, replicate 1). Each point corresponds to a single individual tracked for up to 5 min. 141 individuals were tracked from founder and 96 individuals were tracked from round 15. Trend lines are from non-parametric kernel regressions and shaded regions represent 95% confidence intervals from bootstrapping. The shorter run duration in round 15 is apparent in the reduced relative to founder. (e–h) Show identical plots for minimal medium founding (black) strain (38 cells) and evolved (green, 64 cells, round 10 replicate 1).
Figure 4 with 2 supplements
Trade-off between growth rate and run speed constrains evolution of faster migration.
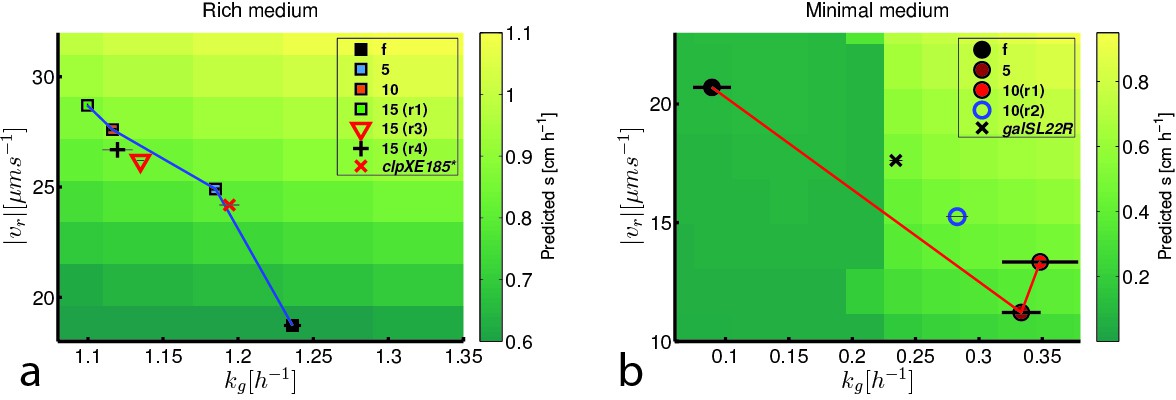
(a) Shows run speeds and growth rates for strains evolving faster migration in rich medium overlaid on a heatmap of the prediction for front migration rate from the reaction-diffusion model (Figure 2). Phenotypes for strains from Figure 3 are shown along with two independently evolved strains (replicates 3 (15(r3)) and 4 (15(r4)), Figure 1c). In addition, the red ‘x’ marks the phenotype for the mutation clpXE185* in the founding strain background (Figure 5). (b) Shows run speeds and growth rates for strains evolved in minimal medium overlaid on the predicted from migration rate from the reaction-diffusion model. Growth rate and run speed for an independently evolved round 10 strain is shown (10(r2), Figure 1e) as well as the phenotype for the galSL22R mutation in the founder background (black ‘x’). Predicted front migration rates assume no change in run duration.
Figure 4—figure supplement 1
Predicted migration rates for evolved strains.
Using the reaction-diffusion model (Main text), we simulated colony expansion using the parameters shown in Table 1 of the main text.
Figure 4—figure supplement 2
Swimming statistics, growth rates and migration rates for mutants.
Run durations () and speeds (), growth rates () and migration rates () for four mutations reconstructed in the founder background (see Main Text). Three mutants were studied in rich medium (a,c,e,g) - clpXE185, a single base pair deletion at position 523,086 (1bp) and the double mutant (clpX 1 bp). One mutant was studied in minimal medium: galSL22R. In all panels, phenotypes of mutants are compared to founder and the population isolated after the final round of selection in the appropriate environment. (a) shows in rich medium, means and standard deviations are: 0.63 0.60 s, 0.66 0.91 s and 0.59 0.55 s for clpX, 1 bp and clpX1bp respectively. clpX and clpX1bp have shorter average run durations than founder (). (b) in minimal medium, where galSL22R exhibits longer runs than founder with 0.55 0.75 s (). (c) gives in rich medium. Means standard deviations are 24.2 7.8 μm s−1, 18.2 7.3 μm s−1 and 23.4 7.6 μm s−1 for clpX, 1 bp and clpX1bp respectively. All mutants except 1 bp exhibit faster runs on average (). (d) gives in minimal medium. galSL22R has a mean of 17.6 8.7 μm s−1, which is lower than founder (). (e) Growth rates for rich medium mutants. clpX and clpX1bp have lower growth rates than founder ( and ). The 1 bp mutation alone does not have a statistically significant difference in growth rate from founder (). (f) shows growth rate for the galS mutant relative to founder and round 10. The mutant growth rate is larger than founder (). (g) shows colony migration rates for mutants in rich medium. clpX and clpX1bp differ significantly from the migration rate of founder ( and ). 1bp does not have a statistically significant change in migration rate. Comparisons are made between duplicate measurements for each genotype and the migration rates of all five replicate experiments in Figure 1 of the main text. (f) Shows migration rate measurements for the galS mutant in minimal medium compared to founder and round 10 in minimal medium. The mutant is faster than the founding strain ().
Figure 5
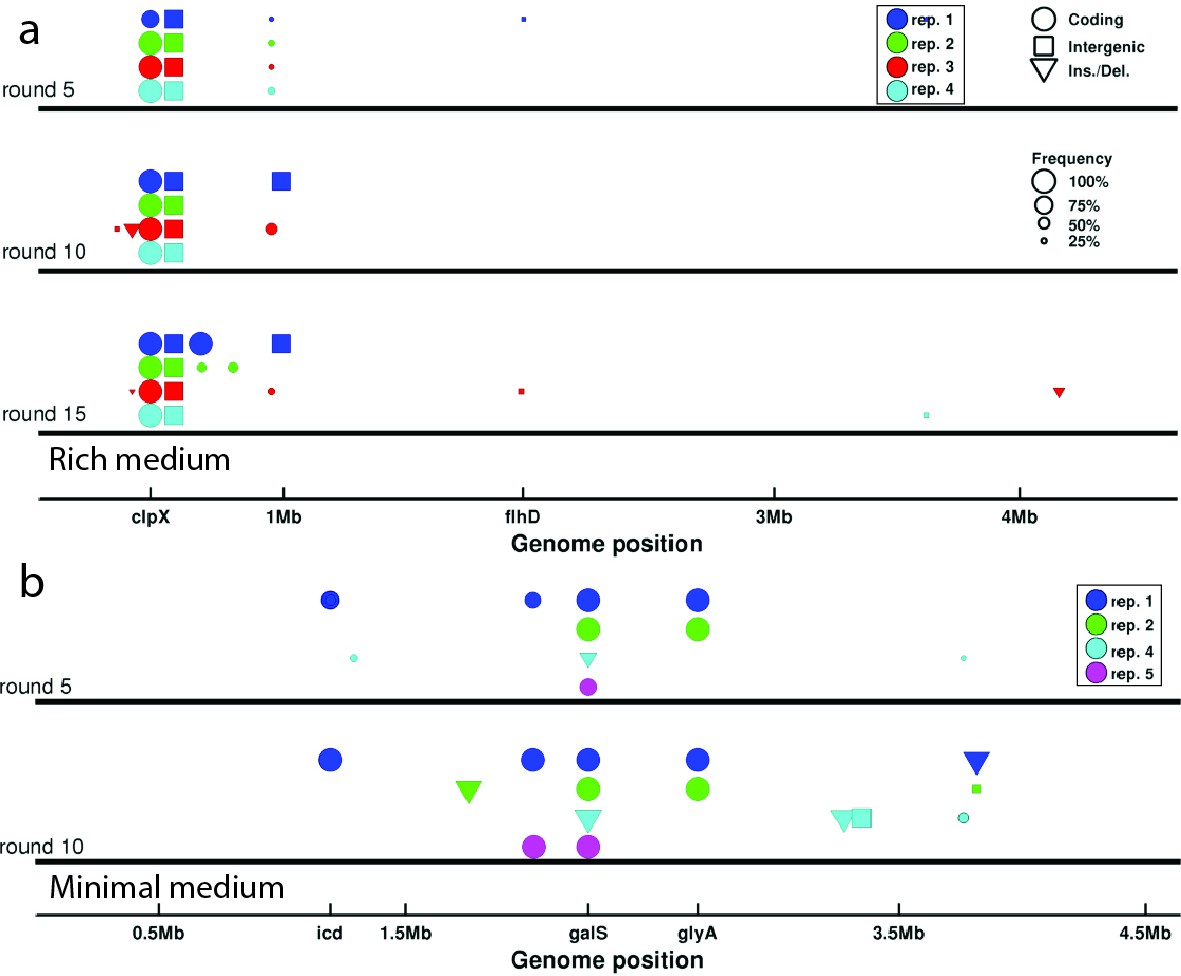
Genomic evolution.
(a) De novo mutations observed in strains isolated after 5, 10 and 15 rounds of selection in rich medium. Abscissa denotes position along the genome. Colors of the markers indicate independently evolved replicates and correspond to traces in Figure 1c. Circles denote single nucleotide polymorphisms (SNP) in coding regions, squares denote intergenic SNPs, and triangles denote larger insertions or deletions. The size of the marker is proportional to the frequency of the mutation in the population. Only mutations with a frequency above 0.2 in the population are shown. Genes of interest are labeled. The operons coding for motility and chemotaxis are near flhD. (b) Identical to (a) but shows de novo mutations for strains evolved in minimal medium. The marker near icd corresponds to multiple SNPs in close proximity to each other. See Tables 5–12 for a list of all mutations observed and details of the sequencing.
Figure 6 with 3 supplements
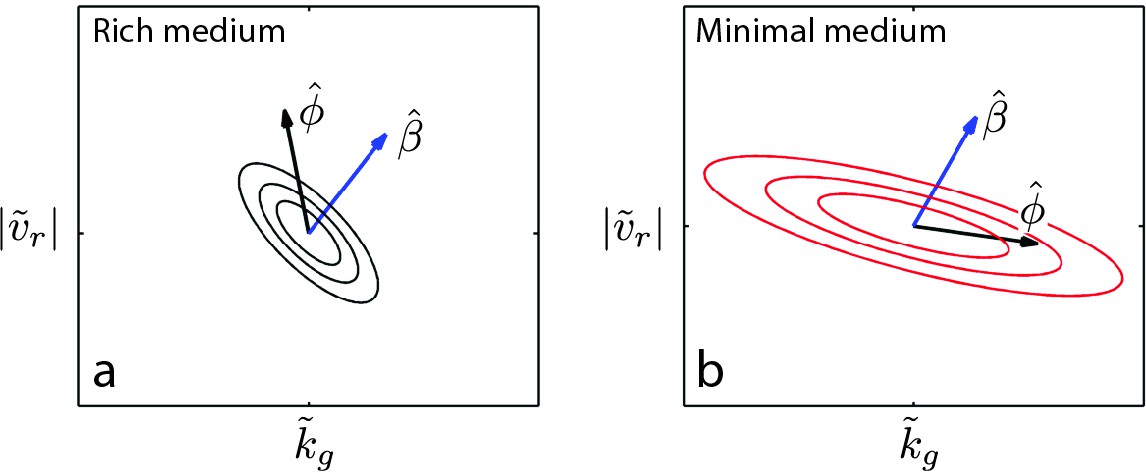
Evolution of correlated traits.
The evolutionary model describes the change in phenotype relative to the founder () under selection described by . Panels show unit vectors in the direction of observed phenotypic evolution () and the direction of selection inferred from the reaction-diffusion model (). Ellipses show quartiles for a normal distribution of phenotypes with covariance matrix that is consistent with and . In both panels, we set the correlation coefficient between and is but our conclusions hold for . In rich medium (a) and in minimal medium . In rich medium and in minimal medium .
Figure 6—figure supplement 1
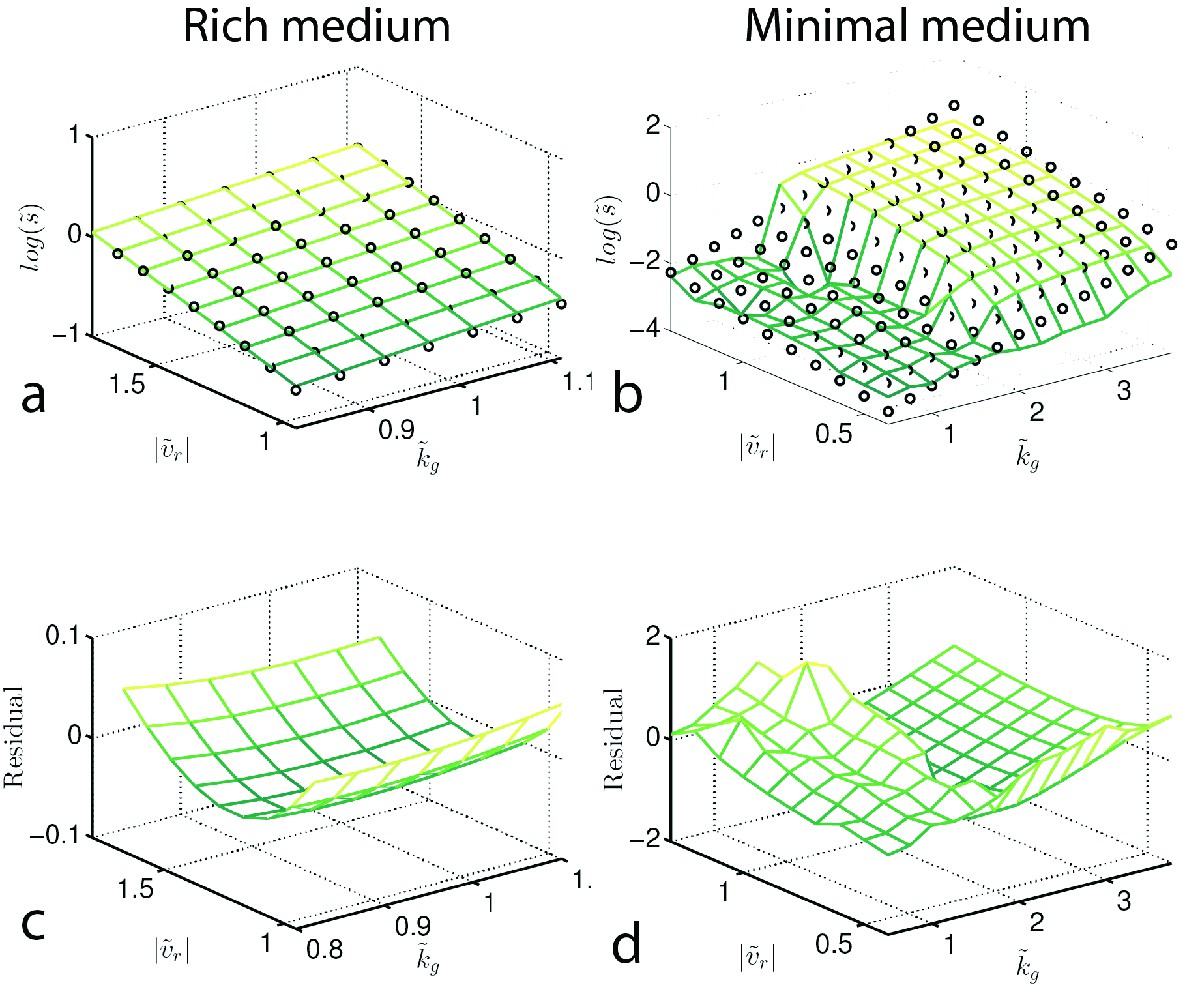
Determining from reaction-diffusion model.
Reaction-diffusion model (main text) was used to simulate migration rates. Panels (a) and (b) plot the normalized (to the founder) predicted migration rate () for both rich medium (a) and minimal medium (b). (a–b) are surface plots of the heatmaps shown in Figures 2,4 of the main text. To infer the selection pressure we fit a plane (black circles) to the surfaces shown in (a) and (b). The residuals of this fit are shown in (c) and (d) respectively. The fit for rich medium is good, while the residual is large in minimal medium.
Figure 6—figure supplement 2
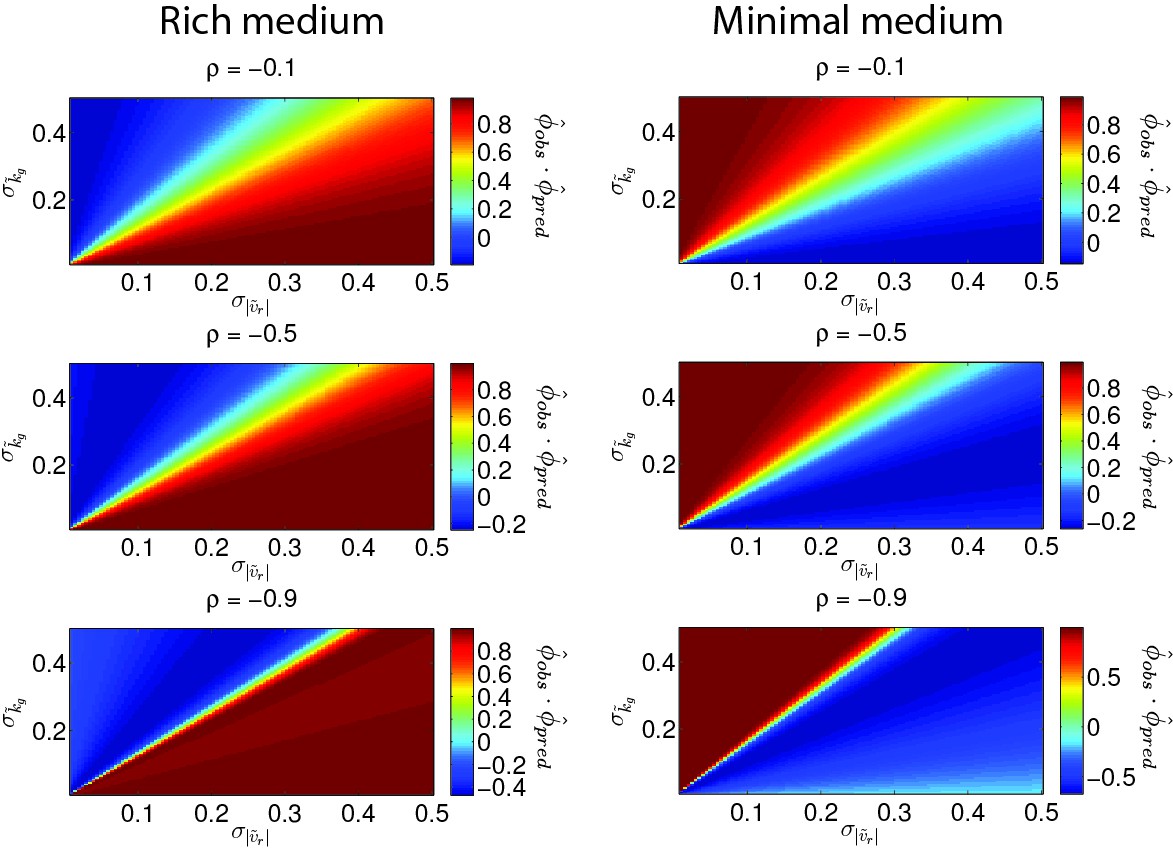
Direction of phenotypic evolution with and .
The dot product is plotted as a heatmap as a function of genetic variances in growth rate and run speed. Each row corresponds to a different value of the correlation coefficient () between run speed and growth rate as labeled. The left column is for rich medium and the right column for minimal medium. When (dark red) this indicates regions where the predicted direction of evolution () coincides with the observed direction of evolution (). Note our qualitative conclusions are robust to large variation in .
Figure 6—figure supplement 3
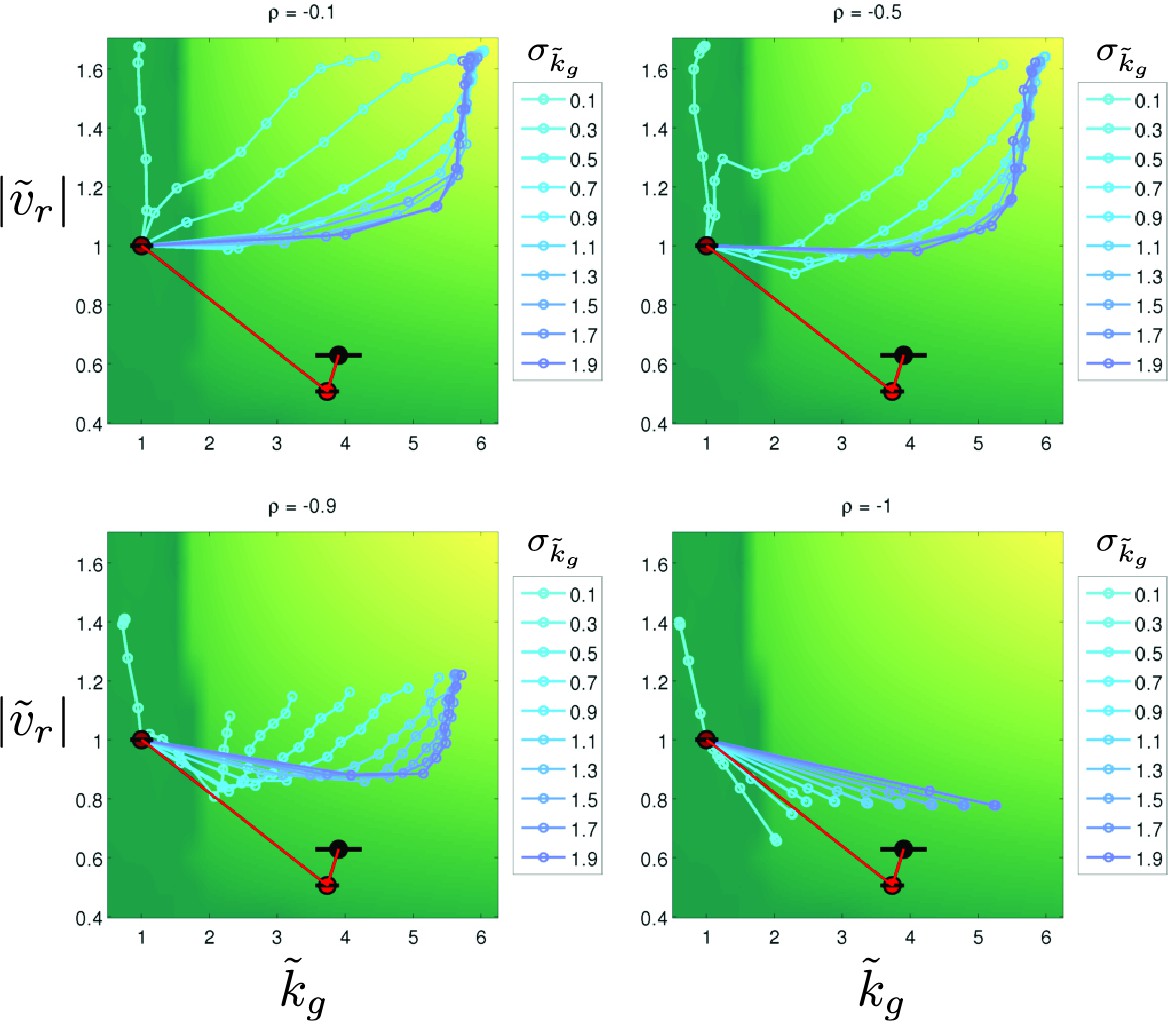
Stochastic simulations of selection in minimal medium.
Stochastic simulations of phenotypic evolution in minimal medium. Simulations were carried out as described above. For all simulations . Each colored line represents a single simulation which initiates at . Each point is the mean phenotype for a round of selection. Colors represent different values of as shown in the legends. The green-yellow heatmap is the ‘fitness landscape’ interpolated from the heatmap shown in Figure 2b of the main text. Each panel shows a simulation for different, fixed, values of the trait correlation coefficient . The red line and circles show the observed phenotypic evolution in minimal medium (Figure 4b, main text).
Author response image 1
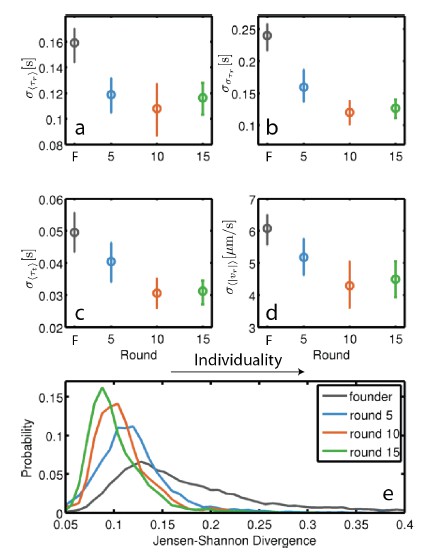
Evolution of individuality in rich medium: Individuality for founding strain as well as strains isolated after 5, 10 and 15 rounds of selection was computed as the standard deviation across individuals for four behavioral parameters: τr, στr, τt and |vr |.
Standard deviations in these parameters were computed for the 140 (founder), 79 (round 5), 97 (round 10) and 96 (round 15) individuals. Error bars are 95% confidence intervals from bootstrapping. The decline in standard deviation with selection is statistically significant for all four parameters (p < 0.005 (a-d), permutation test). (e) Measures individuality by a method that does not require the classification of runs and tumbles (Jordan et al. 2013). Jensen-Shannon divergence is computed between histograms of swimming speed and angular velocity for all pairs on individuals from a given strain. Increasing Jensen- Shannon divergence denotes higher levels of individuality. The decline in individuality between founder and round 5 is significant as well as between round 5 and round 10 and round 10 and round 15 (p < 0.001 for all comparisons, rank sum test).
Author response image 2
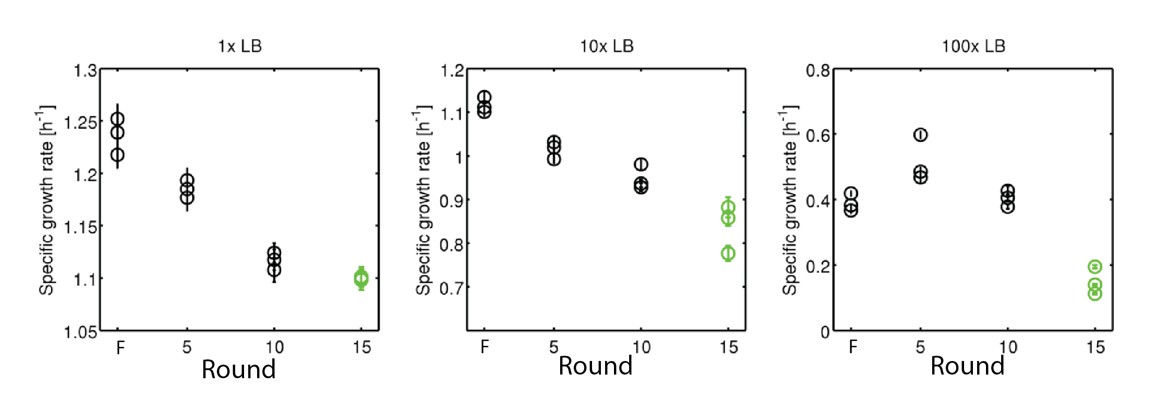
Growth rates of rich medium evolved strains under nutrient limitation.
(left) is data reproduced from Figure 3 of the main text. (center) growth rates for founder (1) strain and strains after 5, 10 and 15 rounds of selection in 10-fold diluted LB medium. (right) identical measurements in 100-fold diluted LB medium. Declines in growth rate due to selection in 10- and 100-fold dilutions are statistically significant by linear regression (coefficient (confidence interval)):−0.019 [1/h* round] (−0.022, −0.015); −0.019 [1/h*round] (−0.031, −0.0005).
Tables
Table 1
Reaction-diffusion model parameters: Columns indicate parameter, explanation of parameter, units, value used in simulation of founder strain in rich medium, and the value used in simulation of founder strain in minimal medium. Parameters marked with an were measured in this study. , and in rich medium were estimated as described in Appendix 1 using the methods of Croze et al (2011). is assumed to be the same in minimal medium as rich medium. Identical and were used in rich and minimal media since Ford and Lauffenburger (1992) find nearly identical values for galactose as Ahmed and Stocker (2008) do for serine. for both nutrient conditions was taken from Hazelbauer Adler et al., 1973. For minimal medium and were taken from Lendenmann et al., 1999. The values cited for were measured from numerical simulation of the reaction-diffusion model as outlined in Materials and methods.
| Parameter | Explanation | Units | Founder value RM | Founder value MM |
|---|---|---|---|---|
| Single-cell swimming (this study) | ||||
| run duration | s | 0.67 | 0.47 | |
| tumble duration | s | – | – | |
| run speed | μm s−1 | 18.7 | 22.2 | |
| Reaction-diffusion model | ||||
| cell density | m−3 | – | – | |
| nutrient density | mM | – | – | |
| nutrient concentration in medium | mM | 1 | 0.18 | |
| bacterial diffusion constant | cm2h−1 | 0.0576 | 0.0576 | |
| nutrient diffusion constant | cm2h−1 | 0.036 | 0.036 | |
| chemotactic coefficient in liquid | cm2h−1 | 6.12 | 6.12 | |
| receptor-nutrient binding constant | mM | 2 | 0.1 | |
| maximum growth rate | h−1 | 1.23 | 0.125 | |
| concentration for half-maximum growth rate | mM | 0.1 | 3P <10-4 | |
| yield biomass per unit nutrients | cells mLmM | 5×10⁷ | 3×10⁸ | |
| agar concentration | % (w/v) | 0.3 | 0.3 | |
| front migration rate | cm h−1 | 0.61 | 0.09 | |
Table 2
Tumble bias and frequency for additional strains.
| Tumble bias and frequencies | ||
|---|---|---|
| strain | Tumble bias | Tumble frequency [Hz] |
| Rich medium | ||
| founder | 0.197 0.006 | 0.59 0.02 |
| 15(r3) | 0.174 0.006 | 0.78 0.02 |
| 15(r4) | 0.2 0.01 | 0.79 0.01 |
| clpXE185 | 0.19 0.01 | 0.66 0.02 |
| Minimal medium | ||
| founder | 0.29 0.01 | 0.41 0.03 |
| 10(r2) | 0.25 0.02 | 0.44 0.03 |
| galSL22R | 0.3 0.02 | 0.44 0.05 |
Table 3
Reaction-diffusion model parameters estimated from measurements of tumble frequency () and run speed () for rich medium evolved strains in 0.3% agar.
| Evolution of population level migration parameters | ||||
|---|---|---|---|---|
| strain | [s−1] | [ μm s−1] | [ cm2h−1] | [ cm2h−1] |
| founder | 1.45 | 18.7 | 0.02 | 0.65 |
| round 5 | 1.56 | 24.9 | 0.027 | 0.90 |
| round 10 | 1.72 | 27.6 | 0.029 | 1.04 |
| round 15 | 1.54 | 28.7 | 0.031 | 1.04 |
Table 4
Reaction-diffusion model parameters estimated from measurements of tumble frequency () and run speed () for minimal medium evolved strains in 0.3% agar.
| Evolution of population level migration parameters | ||||
|---|---|---|---|---|
| strain | [s−1] | [ μm s−1] | [ cm2h−1] | [ cm2h−1] |
| founder | 2 | 20.7 | 0.021 | 0.66 |
| round 5 | 2.5 | 11.2 | 0.011 | 0.39 |
| round 10 | 3 | 13.3 | 0.011 | 0.5 |
Table 5
Minimal medium replicate 1: All mutations detected in rounds 5 and 10 of minimal medium replicate 1. The galSL22R mutation in rounds 5 and 10 was confirmed by Sanger sequencing. See Table 9 caption.
| Minimal medium replicate 1 | ||
|---|---|---|
| round, (coverage) | 5, () | 10, () |
| Mutation (loc., mut., frac., cov.) | 1196220, icd H366H,78.4%, 46 | 1196220, icd H366H, 100%, 141 |
| 1196232, icd T370T, 71.1%, 34 | 1196232, icd T370T, 100%, 101 | |
| 1196247, icd L375L, 72.0%, 25 | 1196247, icd L375L, 100%, 75 | |
| 1196277, icd N385N, 47.1%, 17 | 2015871, fliG V331D, 100%, 111 | |
| 1196280, icd A386A, 47.1%, 17 | 2241604, galS L22R, 100%, 184 | |
| 1196283, icd K387K, 47.2%, 17 | 2685013, glyA H165H, 100%, 197 | |
| 1196292, icd T390T, 46.2%, 13 | 3815859, rph 82 bp, 100%, 260 | |
| 1196304, icd E394E, 46.2%, 13 | ||
| 2015871, fliG V331D, 70.0%, 60 | ||
| 2241604, galS L22R, 100%, 45 | ||
| 2685013, glyA H165H, 100%, 62 | ||
Table 6
Minimal medium replicate 2: All mutations detected in rounds 5 and 10 of minimal medium replicate 2. The galSL22R mutation in rounds 5 and 10 was confirmed by Sanger sequencing. See Table 9 caption.
| Minimal medium replicate 2 | ||
|---|---|---|
| round, (coverage) | 5, () | 10, () |
| Mutation (loc., mut., frac., cov.) | 2241604, galS L22R, 100%, 70 | 1757419, IG 17 bp insertion, 94.9%, 37 |
| 2685013, glyA H165H, 100%, 65 | 2241604, galS L22R, 100%, 47 | |
| 2685013, glyA H165H, 100%, 79 | ||
| 3815828, IG TG, 43.5%, 62 | ||
Table 7
Minimal medium replicate 3: All mutations detected in rounds 5 and 10 of minimal medium replicate 3. See Table 9 caption.
| Minimal medium replicate 3 | ||
|---|---|---|
| round, (coverage) | 5, (208) | 10, (229) |
| Mutation (loc., mut., frac., cov.) | 1291079, rssB A280T, 29.7%, 54 | 2241595, galS 1bp, 100%, 218 |
| 2241595, galS 1bp, 64.7%, 102 | 3277264, prlF +CATTCAA insertion, 93.6%, 109 | |
| 3762200, rhsA A6A, 23.5%, 181 | 3350529, IG TC, 100%, 117 | |
| 3762212, rhsA G10G, 23.1%, 164 | 3762200, rhsA A6A, 45.8%, 320 | |
| 3762212, rhsA G10G, 42.0%, 292 | ||
Table 8
Minimal medium replicate 4: All mutations detected in rounds 5 and 10 of minimal medium replicate 4. See Table 9 caption.
| Minimal medium replicate 4 | ||
|---|---|---|
| round, (coverage) | 5, (256) | 10, (230) |
| Mutation (loc., mut., frac., cov.) | 2241232, galS R146L, 72.4%, 274 | 2020519, fliM E145K, 100%, 205 |
| 2241665, galS I2L, 100%, 304 | ||
Table 9
Rich medium replicate 1: All mutations detected above a frequency of 0.2 in rounds 5, 10 and 15 of rich medium selection replicate 1. The first number in each cell denotes the distance in base pairs from ori (location). The second entry (mutation) identifies the mutations with ‘IG’ denoting an intergenic mutation. The third entry (fraction) is the fraction of the population carrying this mutation (as inferred by breseq in polymorphism mode). The fourth entry (coverage) is the number of reads that aligned to this location. In the round 15 strain, the clpX SNP and 1 bp deletion at position 523,086 were confirmed by Sanger sequencing.
| Rich medium replicate 1 | |||
|---|---|---|---|
| Round, (coverage) | 5, () | 10, () | 15, () |
| Mutation (loc., mut., frac., cov.) | 457978, clpX E185, 75.2%, 179 | 457978, clpX E185, 100%, 199 | 457978, clpX E185, 100%, 164 |
| 523086, IG 1 bp, 100%, 194 | 523086, IG 1 bp, 100%, 266 | 523086, IG 1 bp, 100%, 168 | |
| 950518, pflA T188I, 22.2%, 144 | 990379, IG AC, 100%, 201 | 663115, dacA 1 bp, 100%, 150 | |
| 1978458, IG GT, 21.2%, 156 | 990379, IG AC, 100%, 156 | ||
| 3618863, nikR H92H, 20.7%, 189 | |||
Table 10
Rich medium replicate 2: All mutations detected in rounds 5, 10 and 15 of rich medium replicate 2. See Table 9 caption. Note low coverage on 1 bp mutation at 523086 noted in bold.
| Rich medium replicate 2 | |||
|---|---|---|---|
| Round, (coverage) | 5, () | 10, () | 15, () |
| Mutation (loc., mut., frac., cov.) | 457978, clpX E185, 100%, 220 | 457978, clpX E185, 100%, 109 | 457978, clpX E185, 100%, 184 |
| 950518, pflA T188I, 27.2%, 210 | 523086, IG 1 bp, 100%, 16 | 523086, IG 1 bp, 100%, 24 | |
| 523086, IG 1 bp, 100%, 10/18 | 667259, mrdA R320H, 39.5%, 159 | ||
| 794472, modE L58*, 42.4%, 136 | |||
Table 11
Rich medium replicate 3: All mutations detected in rounds 5, 10 and 15 of rich medium replicate 3. See Table 9 caption. Note low coverage on 1 bp mutation at 523086 noted in bold.
| Rich medium replicate 3 | |||
|---|---|---|---|
| Round, (coverage) | 5, () | 10, () | 15, () |
| Mutation (loc., mut., frac., cov.) | 457978, clpX E185, 100%, 300 | 457978, clpX E185, 100%, 43 | 457978, clpX E185, 100%, 185 |
| 523086, IG 1 bp, 50%, 38 | 523086, IG 1 bp, 100%, 8 | 523086, IG 1 bp, 100%, 16 | |
| 950518, pflA T188I, 26.3%, 332 | 950518, pflA T188I, 53.3%, 53 | 950518, pflA T188I, 30.6%, 190 | |
| 321263, IG TC, 25%, 16 | 1968653, cheR Q238K, 29.6%, 190 | ||
| 382794, yaiX bp insertion, 64%, NA | 382794, yaiX bp insertion, 25.8%, NA | ||
| 4161562, fabR bp, 46.2%, 67 | |||
Table 12
Rich medium replicate 4: All mutations detected in rounds 5, 10 and 15 of rich medium replicate 4. See Table 9 caption. Note low coverage on 1 bp mutation at 523086 noted in bold.
| Rich medium replicate 4 | |||
|---|---|---|---|
| Round, (coverage) | 5, () | 10, () | 15, () |
| Mutation (loc., mut., frac., cov.) | 457978, clpX E185, 100%, 370 | 457978, clpX E185, 100%, 559 | 457978, clpX E185, 100%, 339 |
| 523086, IG 1 bp, 50%, 72 | 523086, IG 1 bp, 100%, 34/83 | 523086, IG 1 bp, 100%, 19/33 | |
| 950518, pflA T188I, 31.7%, 446 | 3619915, rhsB W242G, 24.9%, 20 | ||
Appendix 1—table 1
Mutations present after 40 generations of liquid culture growth for rich medium replicate 1 round 15 strain.
| Rich medium, round 15 rep. 1, after 40 generations in liquid culture. | |
|---|---|
| # gen. (coverage) | 40, () |
| Mutation (loc., mut., frac., cov.) | 457978, clpX E185, 100%, 254 |
| 523086, IG 1 bp, 100%, 256 | |
| 990379, IG AC, 100%, 165 | |
| 663115, 1 bp dacA FS, 100%, 161 | |
Download links
A two-part list of links to download the article, or parts of the article, in various formats.
Downloads (link to download the article as PDF)
Open citations (links to open the citations from this article in various online reference manager services)
Cite this article (links to download the citations from this article in formats compatible with various reference manager tools)
Environment determines evolutionary trajectory in a constrained phenotypic space
eLife 6:e24669.
https://doi.org/10.7554/eLife.24669


