Functional dissociation of stimulus intensity encoding and predictive coding of pain in the insula
- University Medical Center Hamburg Eppendorf, Germany
- University of Colorado Boulder, United States
- University Hospital Heidelberg, Germany
- University of Oxford, United Kingdom
Figures
Figure 1
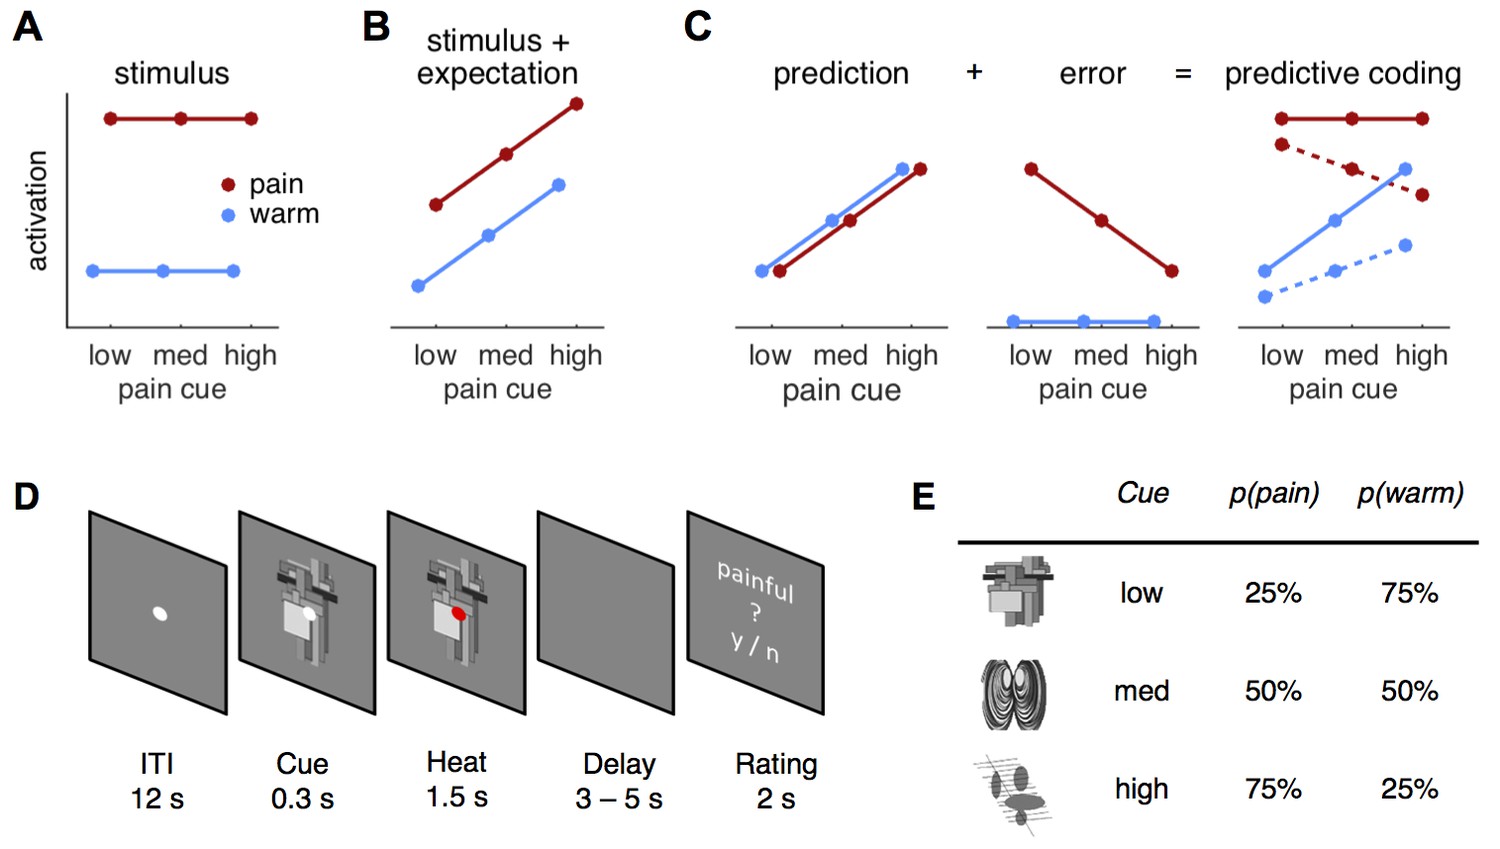
Hypotheses and design.
(A) The stimulus intensity coding model is insensitive to predictive cues and postulates only a main effect of temperature. (B) Expectation may have an additive effect on brain responses in that a higher expectation of receiving pain results increased pain and increased physiological responses. (C) The predictive coding model has two components; prediction and prediction error (PE). Pain processing regions increase activity with increasing predictions of pain (from low to high pain probability). If the stimulus is painful, a PE signaling the difference between sensory input and the prediction occurs. In accordance with previous studies, we modeled the error for warm stimuli as zero (see Materials and methods, Results). The hypothesized predictive coding response is a weighted sum of the two components. The model has two free weight parameters; both are required to be positive. Solid lines represent equal weighting, while dashed lines represent a higher weighting for the PE. (D) Subjects saw a central fixation dot during a 12 s inter-trial-interval (ITI). A cue indicating the probability of a painful stimulus in the current trial appeared 300 ms before the heat stimulus started. Duration of heat stimulation was 1.5 s during which the cue was still visible. After a variable delay of 3–5 s, a rating screen appeared for 2 s and subjects reported whether the last stimulus had been painful or not. The fixation dot changed its color in 12.5% of the trials and participants responded to this change with a button press. (E) Cues predicted pain with 25, 50, or 75% probability and were counterbalanced across subjects.
Figure 2
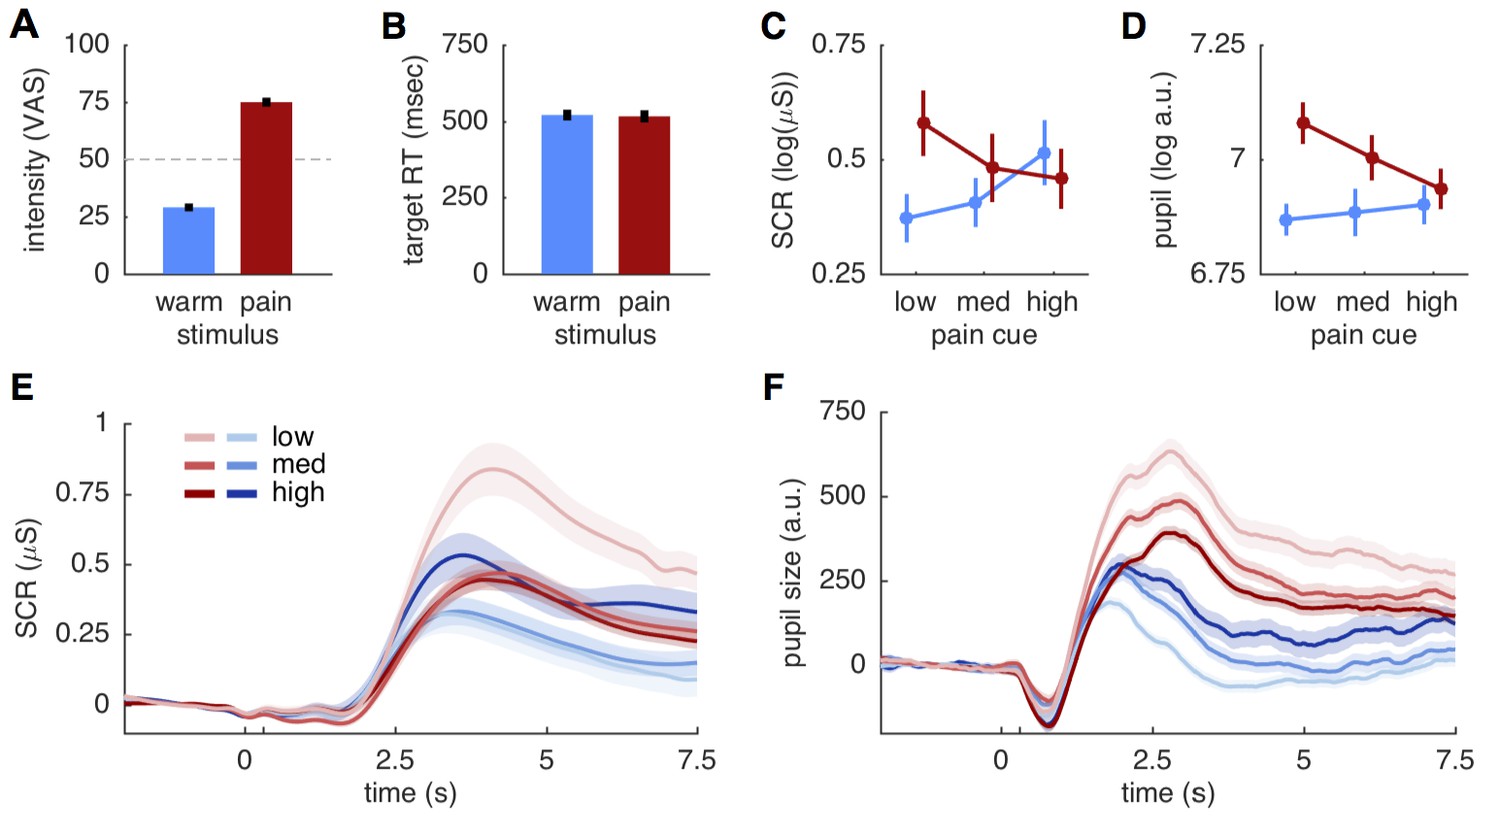
Behavioral and physiological results.
(A) Intensity ratings reported at the end of each block for warm and painful stimuli, respectively. Intensity ratings were significantly higher for pain stimuli (t(27) = 20.9; p<0.001) and correspond well to the stimulation levels chosen during calibration (30 and 75). ‘Pain threshold’ was marked at the center (50) of the visual analogue scale (VAS) used for these ratings. Error bars in all plots show the standard error of the mean. (B) Target reaction time did not differ between stimulation intensities (t(27)=0.51; p=0.61). (C) Skin conductance responses (SCR) for pain (red) and warm (blue) stimuli. SCR responses reflect the pattern hypothesized by the predictive coding model. (D) Pupil dilation amplitudes shows the same response pattern as SCR, also supporting the predictive coding model. (E) Evoked skin conductance responses (SCR) for warm (blue) and painful (red) stimuli are plotted for each condition and followed the rank order hypothesized by the predictive coding model. (F) Pupil diameter responses plotted using the same groupings as in (D). SCR and pupil traces are aligned to cue onset at 0 s, stimulus onset is at 300 ms (unlabeled tick mark), and shaded areas indicate standard errors.
Figure 3
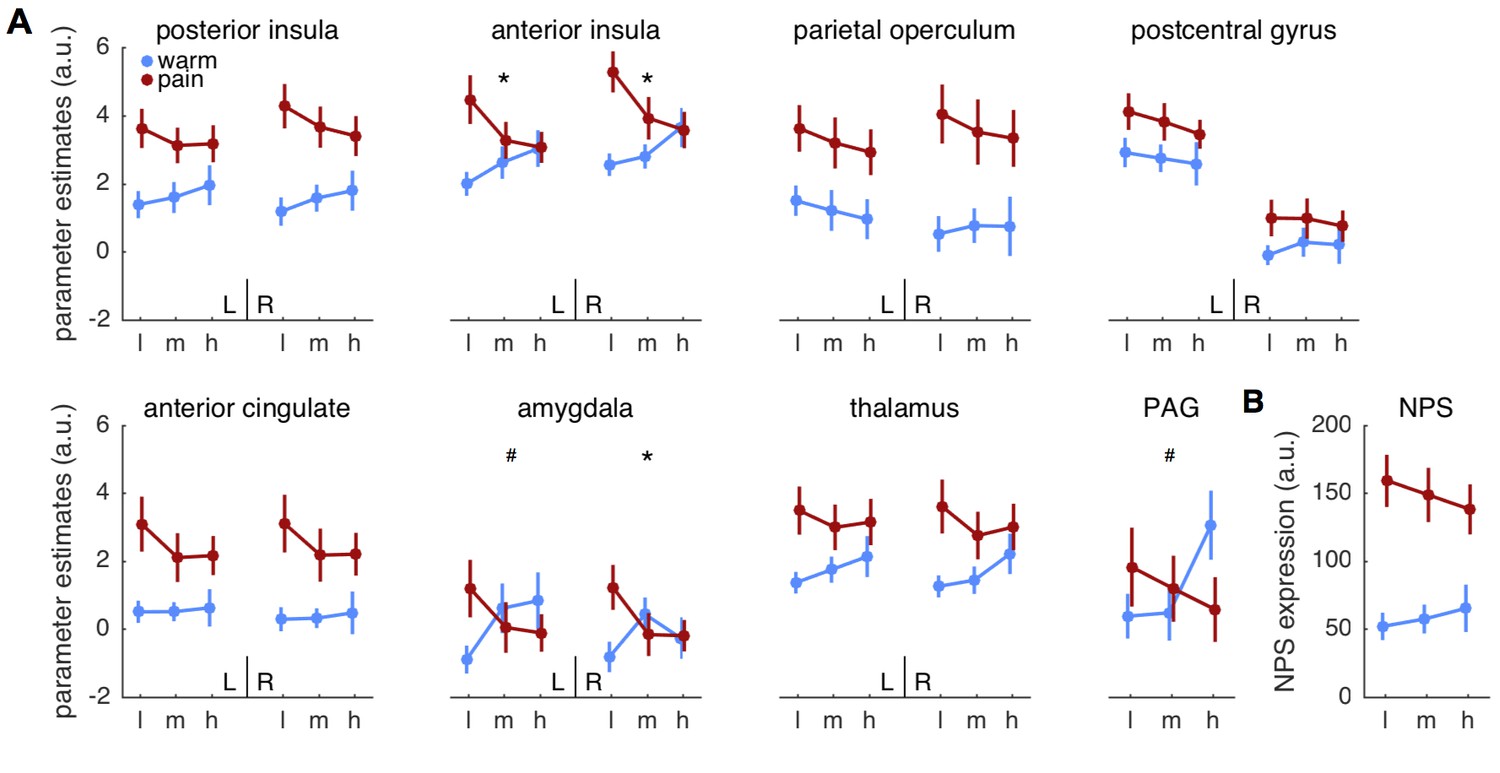
Parameter estimates for regions of interest.
(A) Mean parameter estimates (± standard error) are plotted for left (L) and right (R) hemispheres in each panel, except for the midline structure PAG. Blue indicates warm stimuli, red indicates painful stimuli. Cues are on the x-axis, with ‘l’ designating low, ‘m’ designating medium, and ‘h’ designating high probability of pain. PAG = periaqueductal gray. (B) Pattern expression for the neurological pain signature (NPS; Wager et al., 2013). *interaction effect significant FDR corrected q < 0.05. #interaction: p<0.05, uncorrected.
Figure 4

Whole brain results.
(A) A main effect of stimulus was observed in pain processing regions including insula, parietal operculum, and midcingulate cortex. (B) Anterior insula showed a significant interaction between cue and stimulus. Maps are displayed at p<0.05, whole brain FWE corrected using nonparametric permutation testing resulting in pseudo-t maps.
Figure 5

Formal model comparison.
(A) log-BF comparing the predictive coding model against the stimulus intensity model for SCR, pupil, NPS, and ROIs. SCR, pupil and right anterior insula show strong evidence for predictive coding (log-BF >3), while NPS and posterior insula favor the stimulus intensity model (log-BF < −3). (B) log-BF comparing the predictive coding model against the stimulus plus expectation model. Results are similar to (A), but evidence for the stimulus plus expectation model is weaker. (C) Voxel-wise log-BF comparing the predictive coding model against the stimulus intensity model and in (D) against the stimulus plus expectation model. Maps are thresholded at |log-BF|>3. Warm colors indicate support for the predictive coding model, cold colors indicate support for the alternative model. Surface projections of unthresholded log-BF insula maps reveal an anterior-posterior gradient. AI, anterior insula; PI, posterior insula; PO, parietal operculum; PCG, post-central gyrus; ACC, anterior cingulate cortex; amy, amygdala; thal, thalamus; PAG, periaqueductal gray.
Figure 6
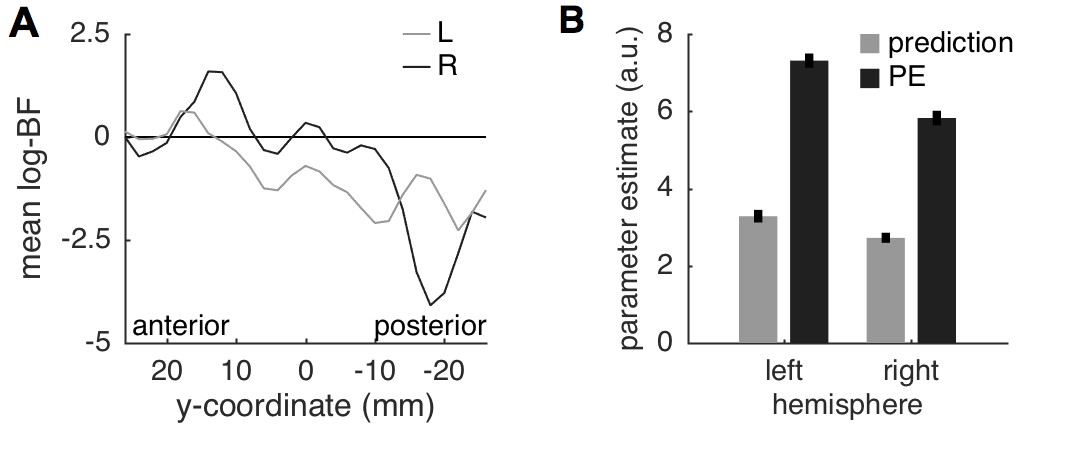
Insula results.
(A) Plotting the average log-BF for left and right insula against y-coordinates shows the anterior-posterior gradient from predictive coding to stimulus intensity coding. (B) Weight parameters are positive for prediction and PE terms, as postulated. The PE contributes approximately two times as much to the anterior insula signal as the prediction does.
Figure 7
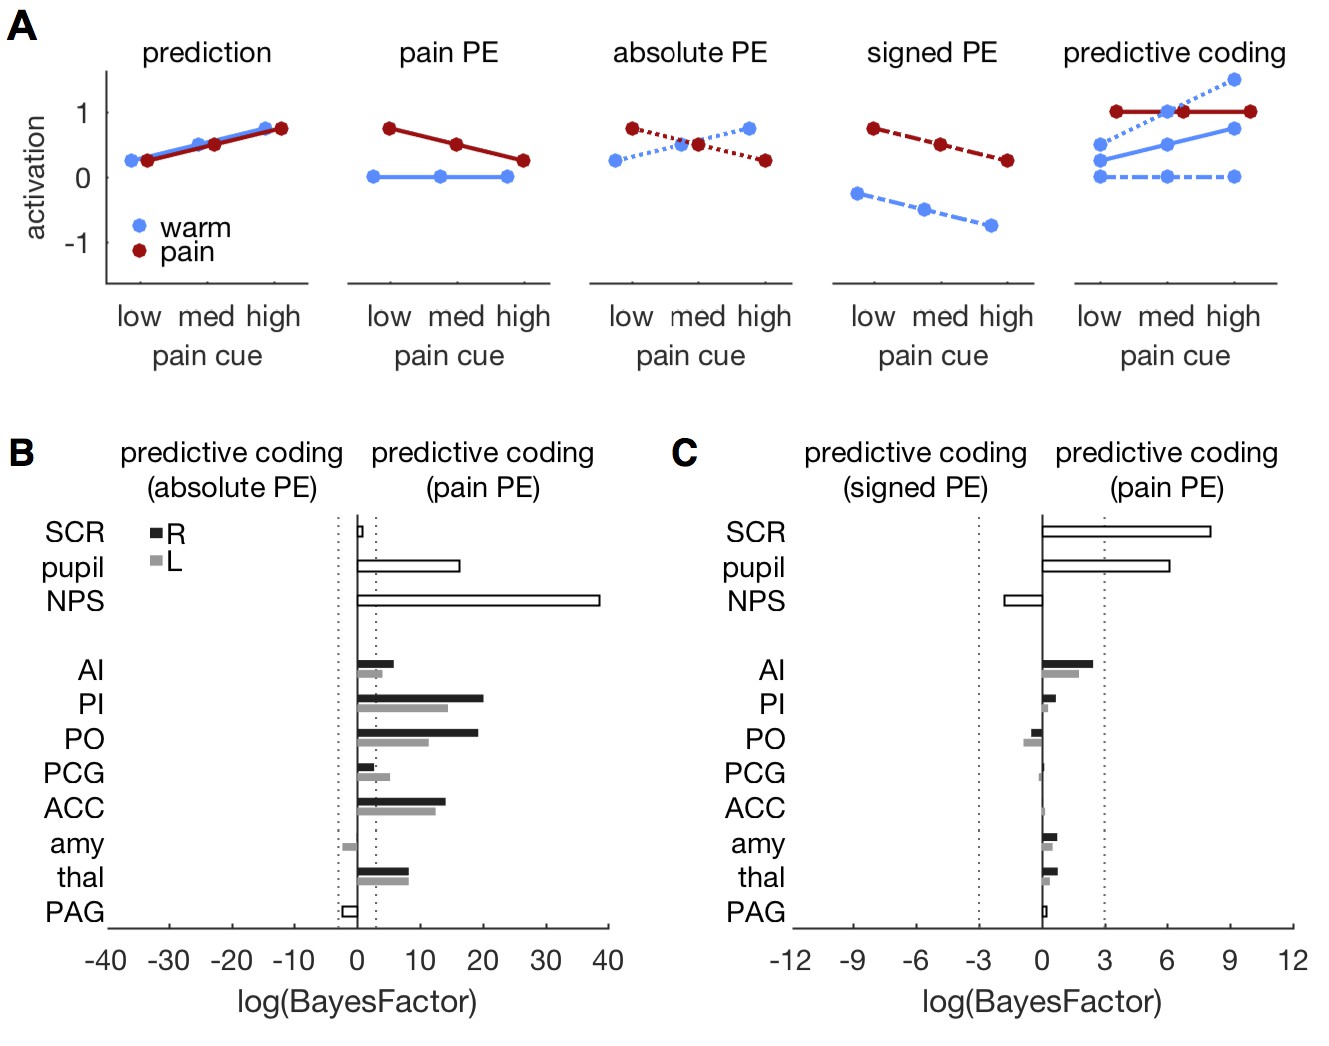
Comparing different PE types.
(A) Different variants of the predictive coding model. All variants share the same prediction term (as in Figure 1A), but differ in the computation of the PE. The original model used here, specifies a pain PE, which equals zero for warm stimuli (second panel, solid lines). An alternative model specifies an absolute PE (third panel, dotted lines). The third alternative model uses a signed PE (fourth panel, dash-dot lines). Please note that all three alternatives result in the same PE for painful stimuli. They only differ in the PE for warm stimuli. The right-most panel shows the expected response profile for each of the three PE definitions when prediction and PE are equally weighted, i.e. simple sum of both terms. Please note that the signed PE (dash-dot line) model does not capture any factorial interactions between cues and stimuli. (B) log-BF comparing the absolute PE model against the original, pain PE model for ROIs and autonomic measures. No evidence stronger than log-BF < −3 is available for the absolute PE model. (C) log-BF comparing the signed PE model against the pain PE model shows no decisive evidence for the signed PE model.
Author response image 1

Intensity ratings after each fMRI block.
https://doi.org/10.7554/eLife.24770.011
Author response image 2
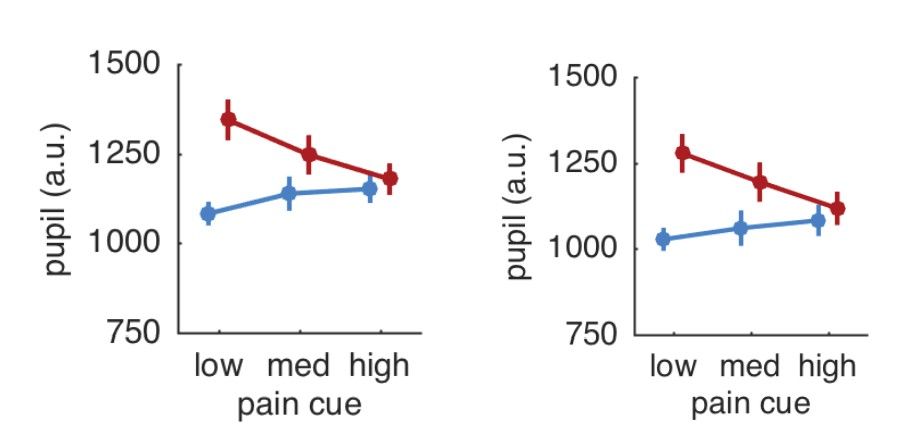
Pupil responses based on all trials (left panel) and after exclusion of trials with artifacts (right panel).
https://doi.org/10.7554/eLife.24770.012
Author response image 3

PAG mask overlaid on the group-mean structural image.
https://doi.org/10.7554/eLife.24770.013
Author response image 4
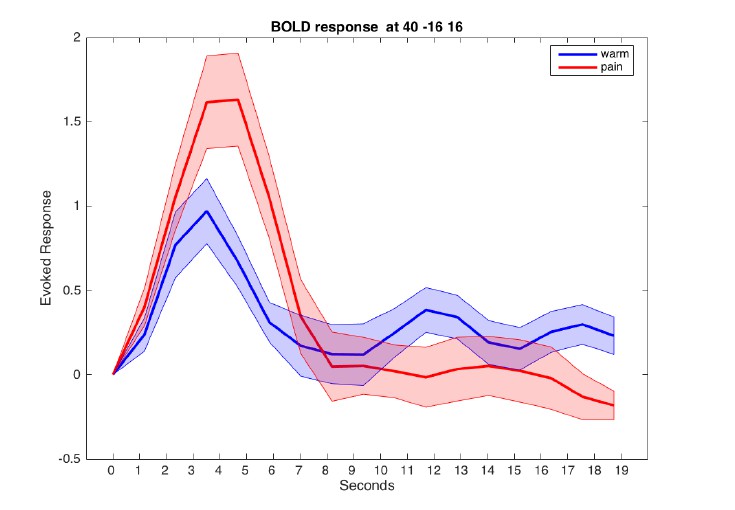
Evoked BOLD response in posterior insula for warm and painful stimuli.
Responses from a sphere centered at MNI coordinates [40/-16/16] are aligned to cue onset at t=0.
Tables
Table 1
ANOVA results for brain ROI and NPS.
| Stimulus | Cue | Cue X stimulus | |||||
|---|---|---|---|---|---|---|---|
| Region | F(1,27) | P | F(2,54) | P | F(2,54) | P | |
| ACC | L | 13.93 | 0.0009* | 1.21 | 0.3053 | 1.23 | 0.3017 |
| R | 15.99 | 0.0004* | 0.95 | 0.3923 | 1.11 | 0.3372 | |
| anterior insula | L | 8.3 | 0.0077* | 0.41 | 0.6651 | 5.46 | 0.0069* |
| R | 9.69 | 0.0043* | 1.58 | 0.2155 | 7.48 | 0.0014* | |
| posterior insula | L | 15.73 | 0.0005* | 0.28 | 0.7538 | 1.58 | 0.2145 |
| R | 12.12 | 0.0017* | 0.15 | 0.8637 | 0.09 | 0.9111 | |
| parietal operculum | L | 18.3 | 0.0002* | 1.2 | 0.3089 | 0.02 | 0.9779 |
| R | 23.35 | <0.0001* | 0.17 | 0.8408 | 0.72 | 0.4918 | |
| post central gyrus | L | 6.14 | 0.0198 | 1.1 | 0.3409 | 0.18 | 0.839 |
| R | 2.57 | 0.1206 | 0.18 | 0.8387 | 0.41 | 0.6675 | |
| amygdala | L | 0.1 | 0.7506 | 0.1 | 0.9046 | 4.94 | 0.0107 |
| R | 0.83 | 0.369 | 0.51 | 0.6033 | 5.39 | 0.0074* | |
| thalamus | L | 8 | 0.0087* | 0.39 | 0.6761 | 1.4 | 0.2545 |
| R | 7.6 | 0.0104* | 1.32 | 0.275 | 2.62 | 0.0823 | |
| PAG | 0.02 | 0.9027 | 1.02 | 0.3675 | 4.34 | 0.0178 | |
| NPS | 47.73 | <0.0001* | 0.14 | 0.8708 | 2.18 | 0.1228 | |
-
ACC: anterior cingulate cortex, PAG: periaqueductal gray, NPS: neurological pain signature.
-
*FDR q<0.05.
Download links
A two-part list of links to download the article, or parts of the article, in various formats.
Downloads (link to download the article as PDF)
Open citations (links to open the citations from this article in various online reference manager services)
Cite this article (links to download the citations from this article in formats compatible with various reference manager tools)
Functional dissociation of stimulus intensity encoding and predictive coding of pain in the insula
eLife 6:e24770.
https://doi.org/10.7554/eLife.24770


