Contact-dependent killing by Caulobacter crescentus via cell surface-associated, glycine zipper proteins
- Massachusetts Institute of Technology, United States
- Howard Hughes Medical Institute, Massachusetts Institute of Technology, United States
Figures
Figure 1 with 1 supplement

The cdz gene cluster is very highly expressed in stationary phase.
(A) Genome-wide RNA-seq profiles of C. crescentus CB15N grown in rich medium to exponential (top) or stationary (bottom) phase. Expression levels (RPM) for both strands combined are plotted as a function of genomic position. A schematic of the cdz cluster is shown beneath the RNA-seq profiles. (B) RNA-seq profile of the cdz gene cluster in stationary phase. Each strand is shown separately. (C) Activity of a cdzC transcriptional reporter (YFP) as a function of culture density (for the corresponding growth curve, see Figure 1—figure supplement 1). Induction is reported relative to the level when OD600 = 0.025. Data points are mean of three independent cultures; error bars indicate standard deviation (S.D.). (D) Western blot analysis of epitope-tagged CdzC, CdzD, and CdzI in the cell pellets of supernatant taken from cultures at the OD600 values indicated. RpoA is a loading control.
Figure 1—figure supplement 1
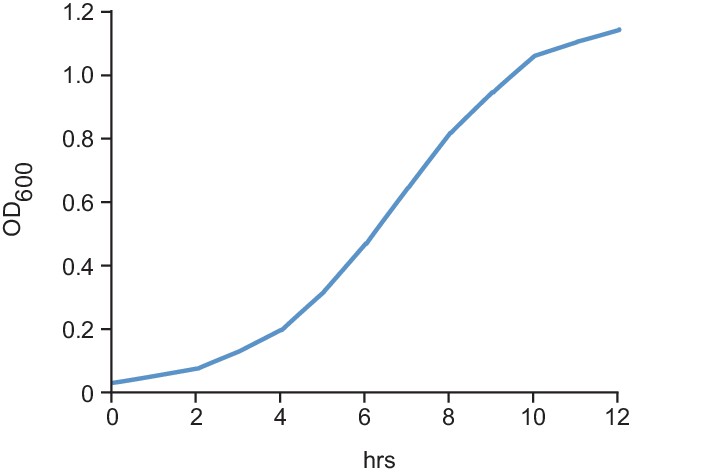
Growth curve for cells expressing a PcdzC-YFP reporter; see Fig.
https://doi.org/10.7554/eLife.24869.003
Figure 2 with 1 supplement
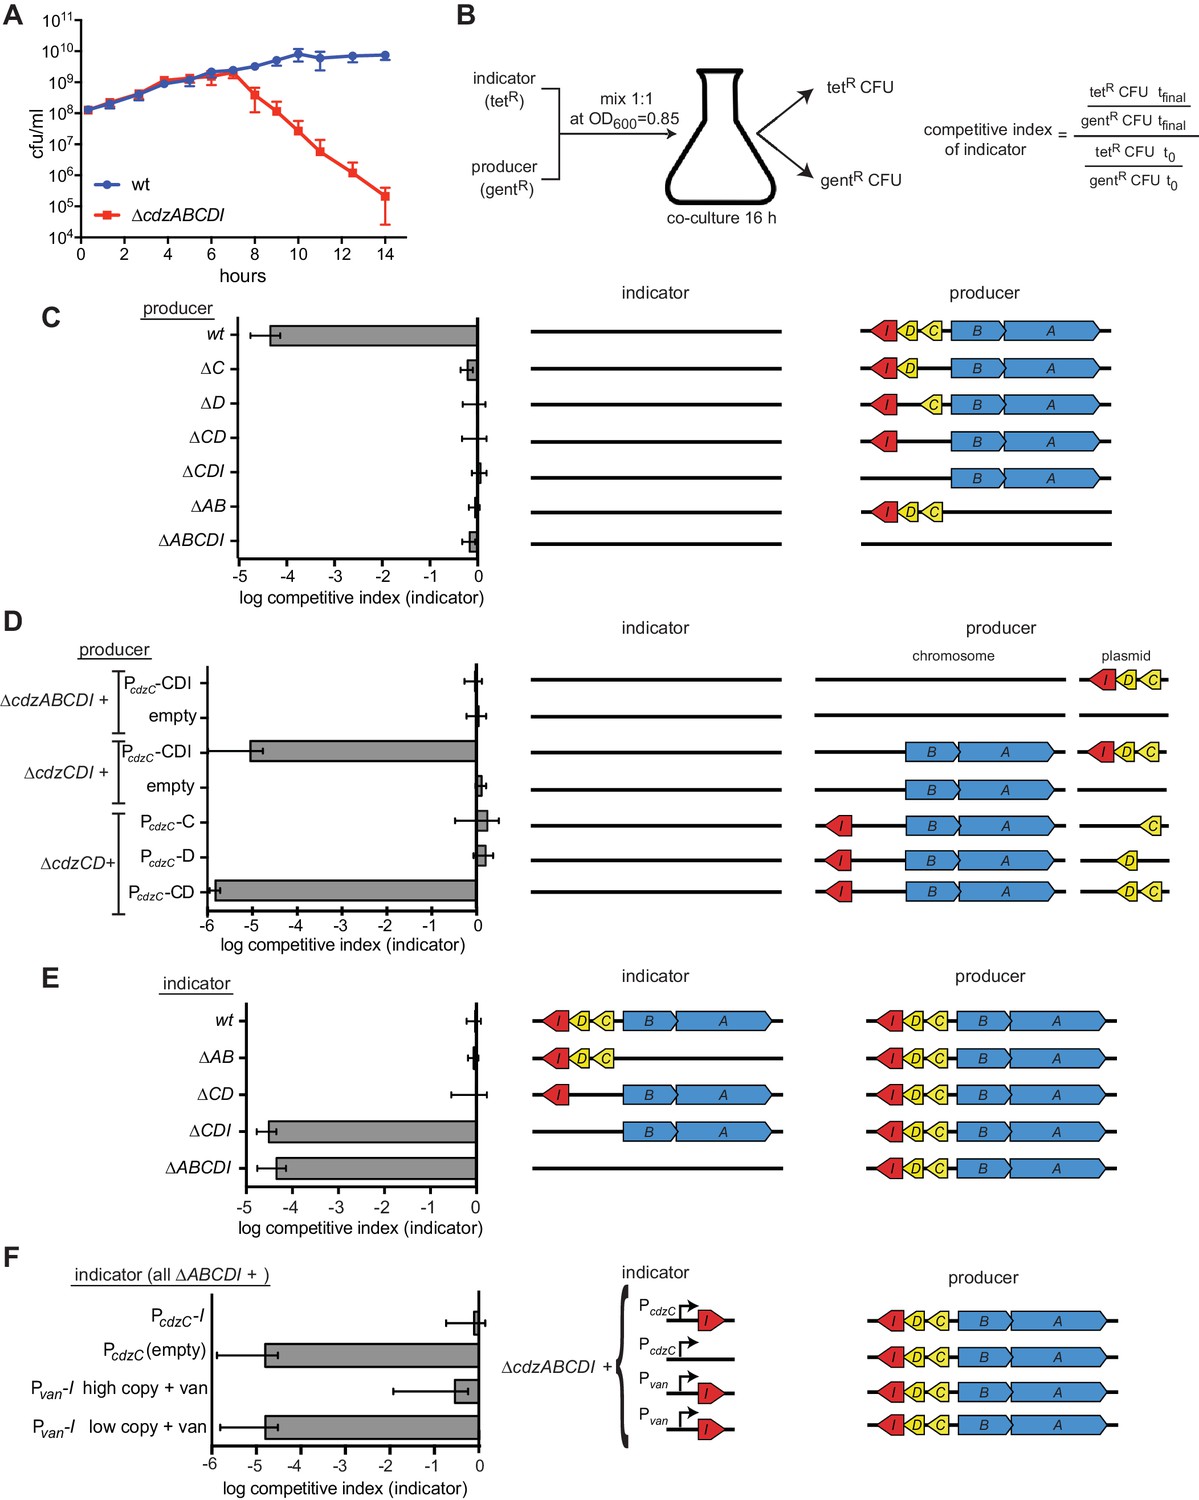
The cdz gene cluster encodes a two-peptide bacteriocin, secreted via a type I secretion system, and a small transmembrane immunity protein.
(A) Co-culture competition of wild-type C. crescentus and ∆cdzABCDI in rich medium. Strains were mixed 1:1 in exponential phase and co-cultured, with CFUs of each strain measured up to 14 hr. (B) Experimental set-up for co-culture competitions in stationary phase and overview of competitive index calculation. (C–F) Competitions between the indicator and producer strains with the genotypes indicated schematically. Graphs show the competitive index of the indicator strain in each experiment. In each panel, data points represent the mean of at least three independent experiments; error bars indicate S.D. Induction of the Pvan promoter by vanillate is indicated by '+ van'.
Figure 2—figure supplement 1
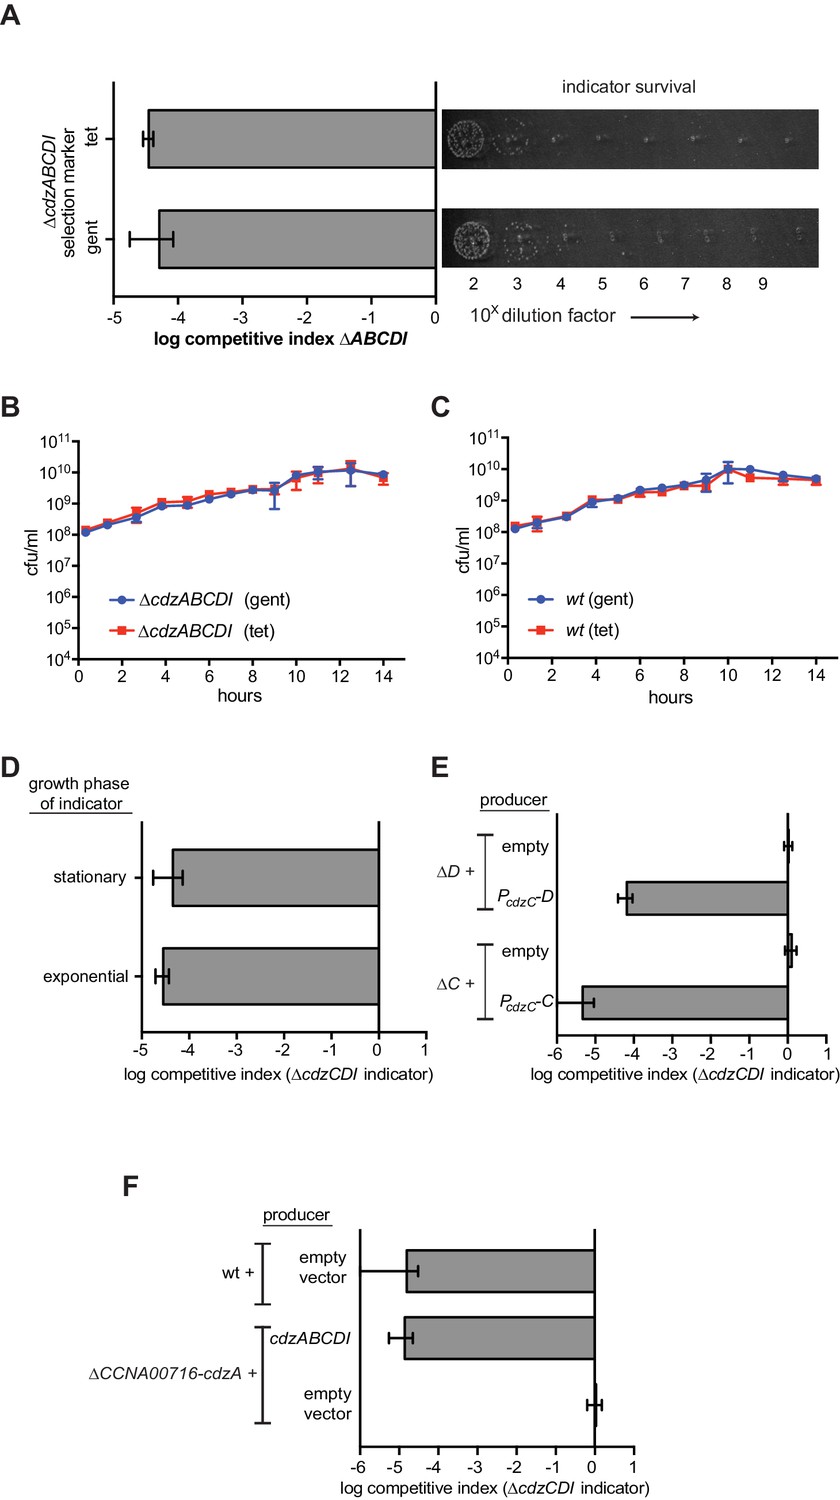
Control experiments for the genetic dissection of the Cdzc system.
(A) Co-culture competition of a wild-type producer and ∆cdzABCDI indicator showing that the antibiotic selection marker does not affect the outcome of the competition. (B) Co-culture competition of two ∆cdzABCDI strains with different antibiotic markers during growth in rich medium. (C) Co-culture competition of two wild-type strains with different antibiotic markers during growth in rich medium. (D) Competition of wild-type producer cells grown to stationary phase, mixed 1:1 with a ∆cdzCDI indicator strain grown to either exponential or stationary phase prior to mixing. (E) Complementation of ∆cdzC and ∆cdzD starins with the corresponding gene in a low copy number plasmid. The producer strains indicated were co-cultured with a ∆cdzCDI indicator. (F) Killing activity of a strain harboring a deletion spanning CCNA_0716 to cdzA was complemented with a low copy number plasmid containing only cdzABCDI. In each panel, data points represent the mean of at least three independent experiments; error bars indicate S.D.
Figure 3 with 1 supplement
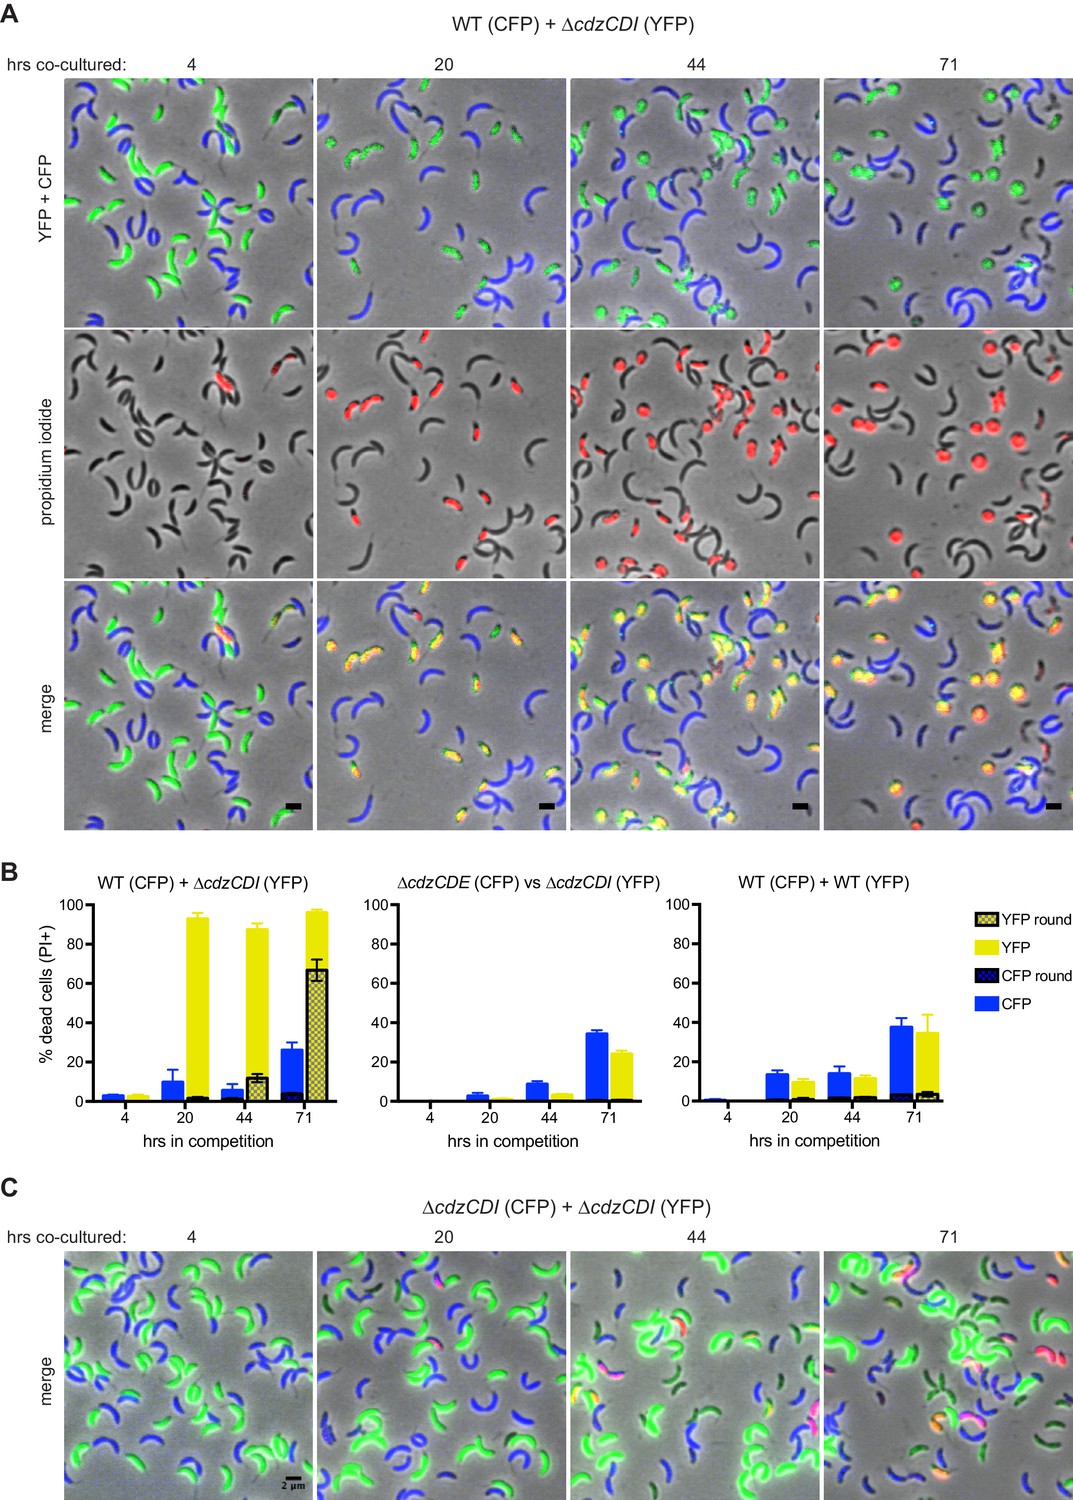
CdzC and CdzD kill an indicator strain in co-culture.
(A) Microscopy analysis of aliquots taken from co-culture competitions of a wild-type producer synthesizing CFP (false colored blue) and a ∆cdzCDI indicator synthesizing YFP (false colored green), and stained with propidium iodide (red) to assess cell permeability. Fields of cells at the time points indicated were imaged by phase and epi-fluorescence microscopy. Phase images were overlaid with the corresponding YFP+CFP images (top), the propidium iodide image (middle), or both (bottom). Cells staining red and green are shown in yellow in the merged image (bottom). (B) Quantification of dead, propidium iodide-stained cells. At least 250 cells in three separate fields of view were counted for each time point of each competition; results were averaged, with error bars indicating S.D. (C) Same as panel A but for a co-culture competition of two indicator strains, synthesizing CFP or YFP.
Figure 3—figure supplement 1
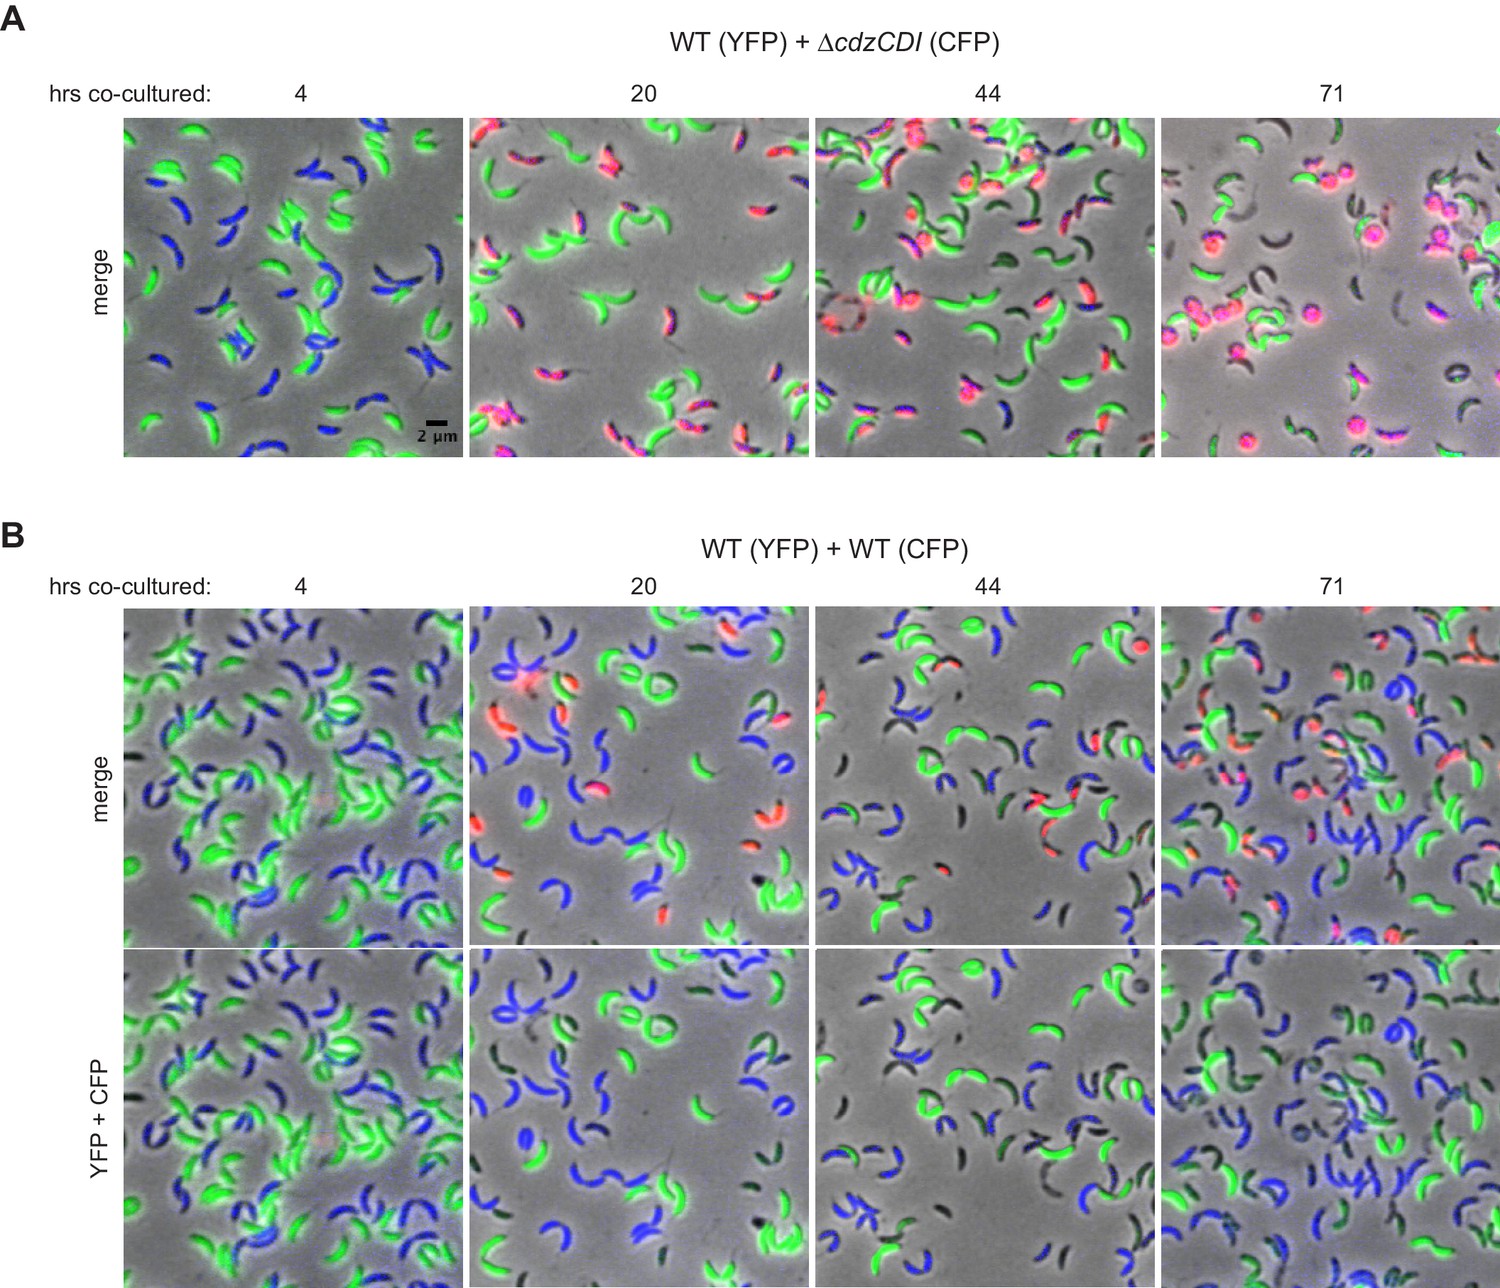
Control experiments for the microscopy-based analysis of Cdz-dependent killing.
(A) Phase and epifluorescence microscopy of aliquots taken from a co-culture competition of a wild-type producer synthesizing YFP (green) and a ∆cdzCDI indicator synthesizing CFP (blue), with the viability stain propidium iodide (red). A merge of phase and all three fluorescence channels is shown at each time point. Cells staining blue and red are shown in magenta. (B) Same as panel A, but for a competition between two wild-type producers synthesizing CFP or YFP.
Figure 4 with 1 supplement
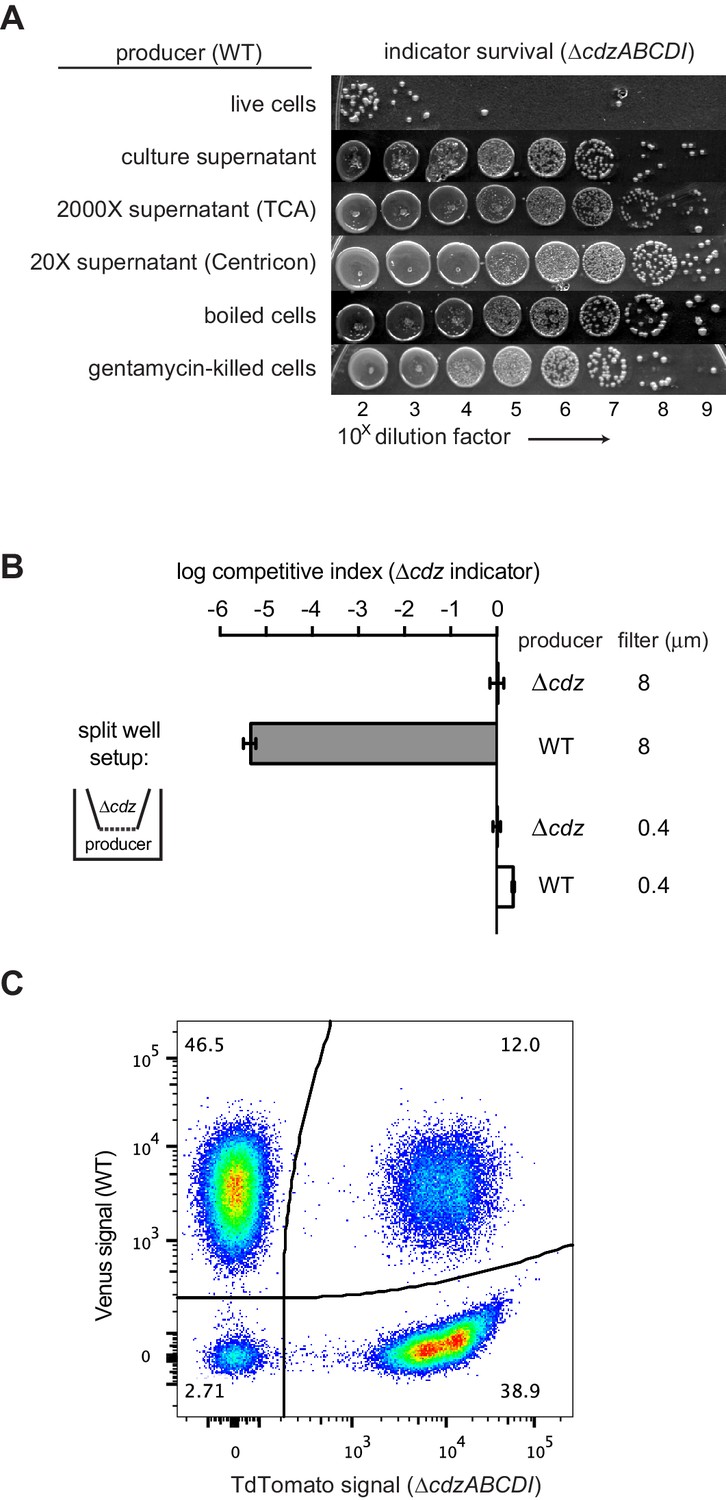
Cdz-mediated killing requires cell-cell contact between a producer and an indicator.
(A) Survival of a ∆cdzABCDI indicator when treated for 16 hr with live producer cells, producer culture supernatant, producer culture supernatant concentrated 2000X by trichloroacetic acid precipitation, producer culture supernatant concentrated 20X by centrifugation, producer cells that were boiled for 5 min, or producer cells treated with gentamicin. (B) Competitive index of ∆cdzABCDI indicator grown in co-culture with a wild-type producer or ∆cdzABCDI mock-producer using the split-well set-up shown (left). The membrane separating the two compartments had a pore size of 8 or 0.4 µm, as indicated. (C) Flow cytometry analysis of a 1:1 mixture in stationary phase of wt producer cells expressing Venus and ∆cdzABCDI indicator cells expressing TdTomato.
Figure 4—figure supplement 1
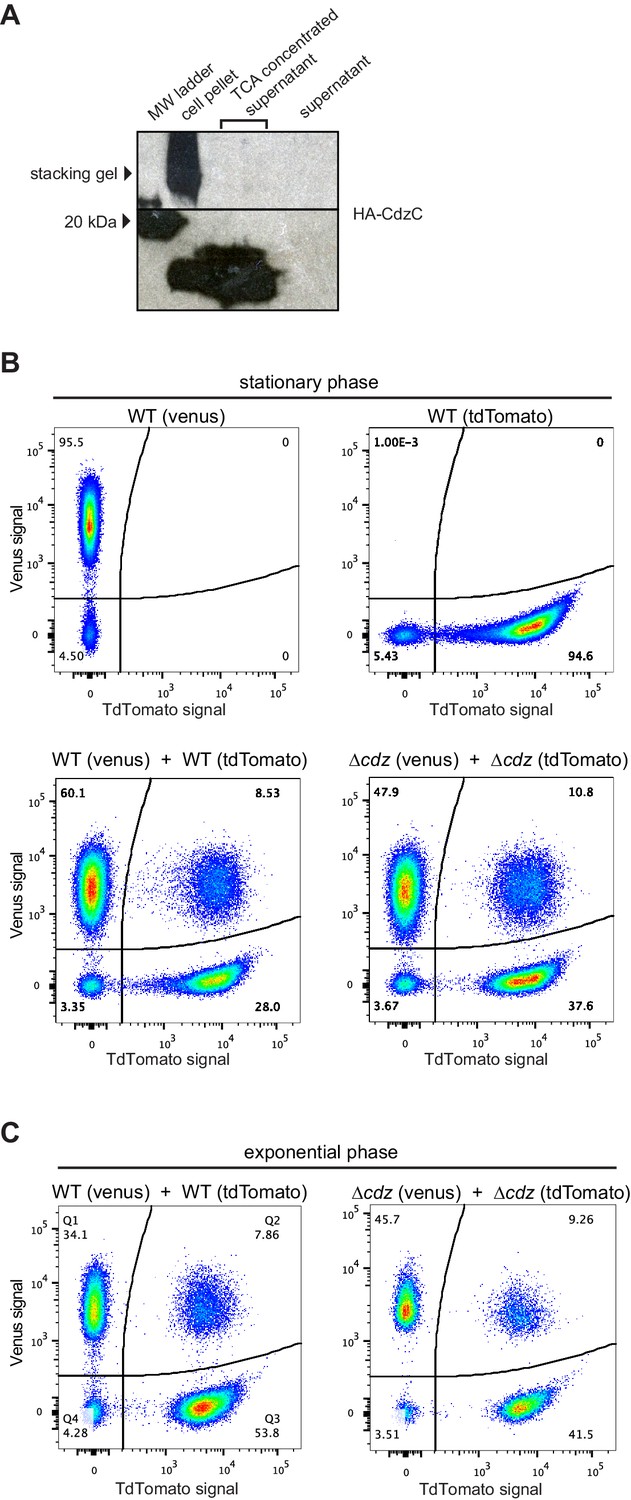
Control experiments for the analysis of contact-dependent inhibition.
(A) Western blot of HA-EdtC in concentrated (TCA-precipitated) culture supernatant. (B) Flow cytometry analysis of stationary phase cells expressing Venus or TdTomato, as indicated, either in pure culture or mixed at 1:1 ratio and incubated for 2 hr. (C) Same as panel B but for exponential phase cultures.
Figure 5 with 1 supplement
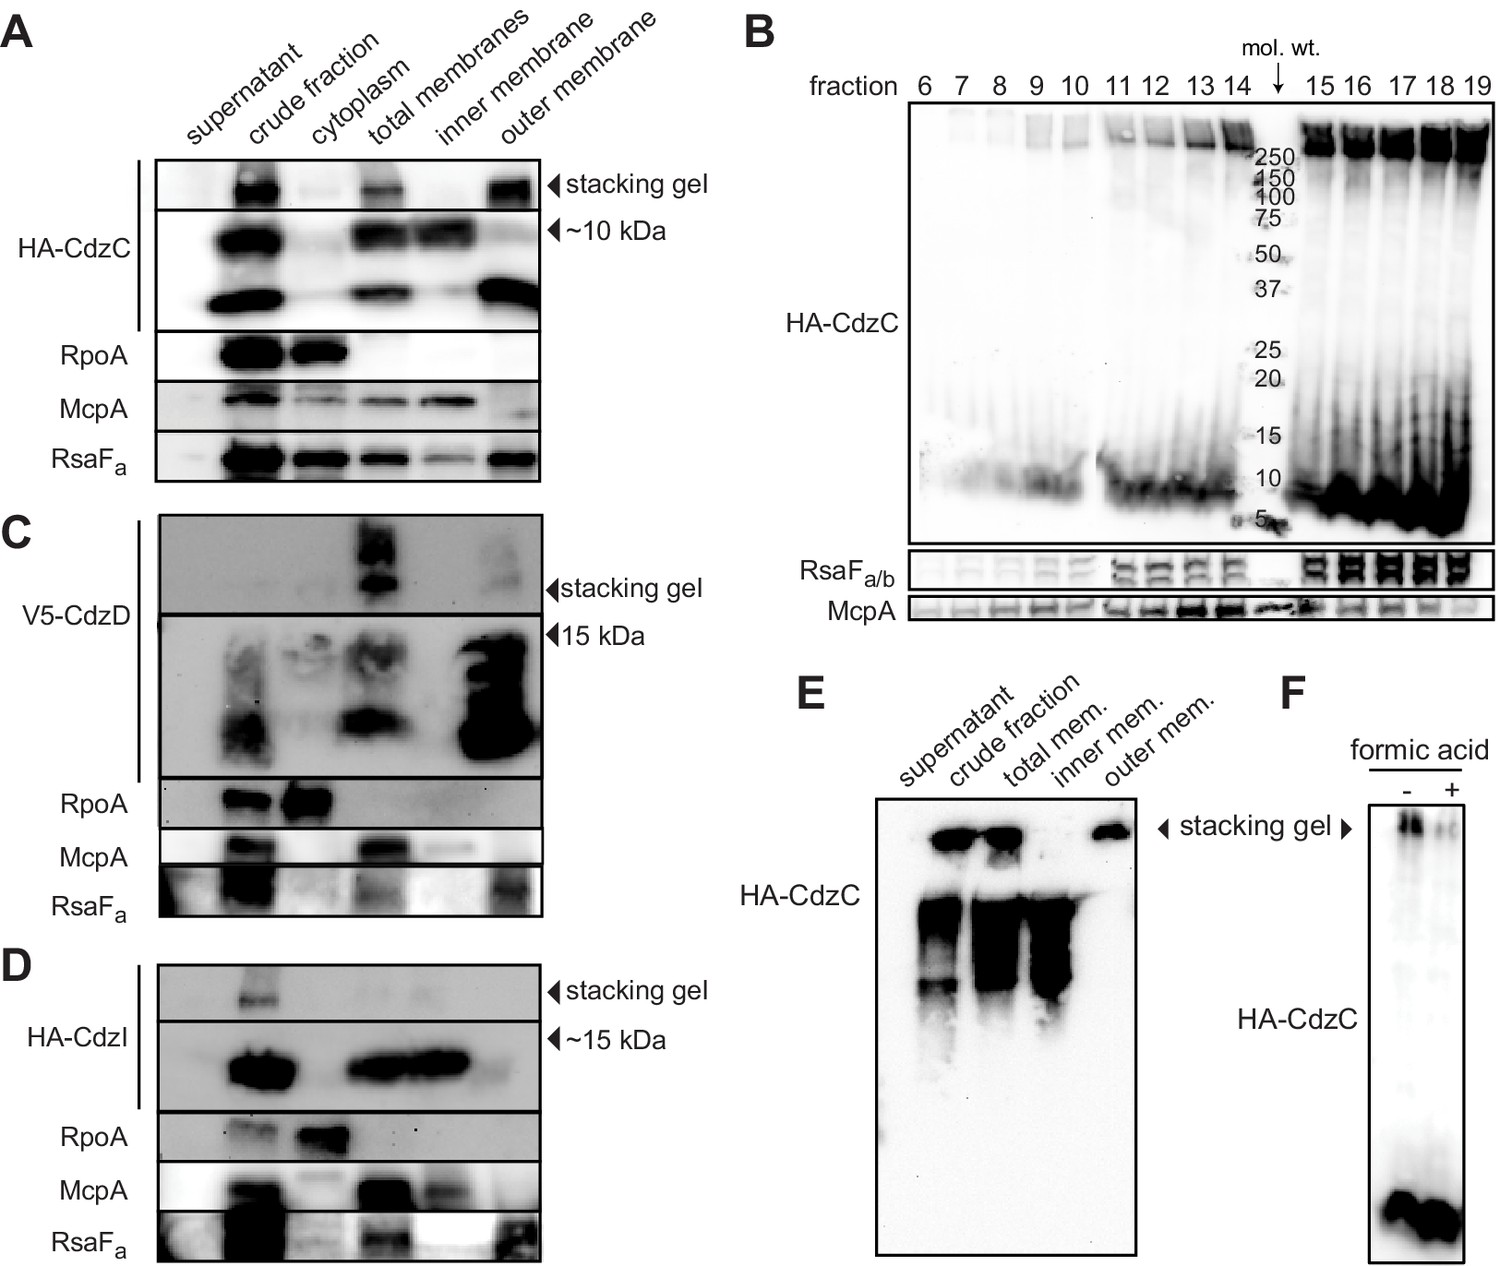
CdzC and CdzD localize to the outer membranes of cells, while CdzI is an inner membrane protein.
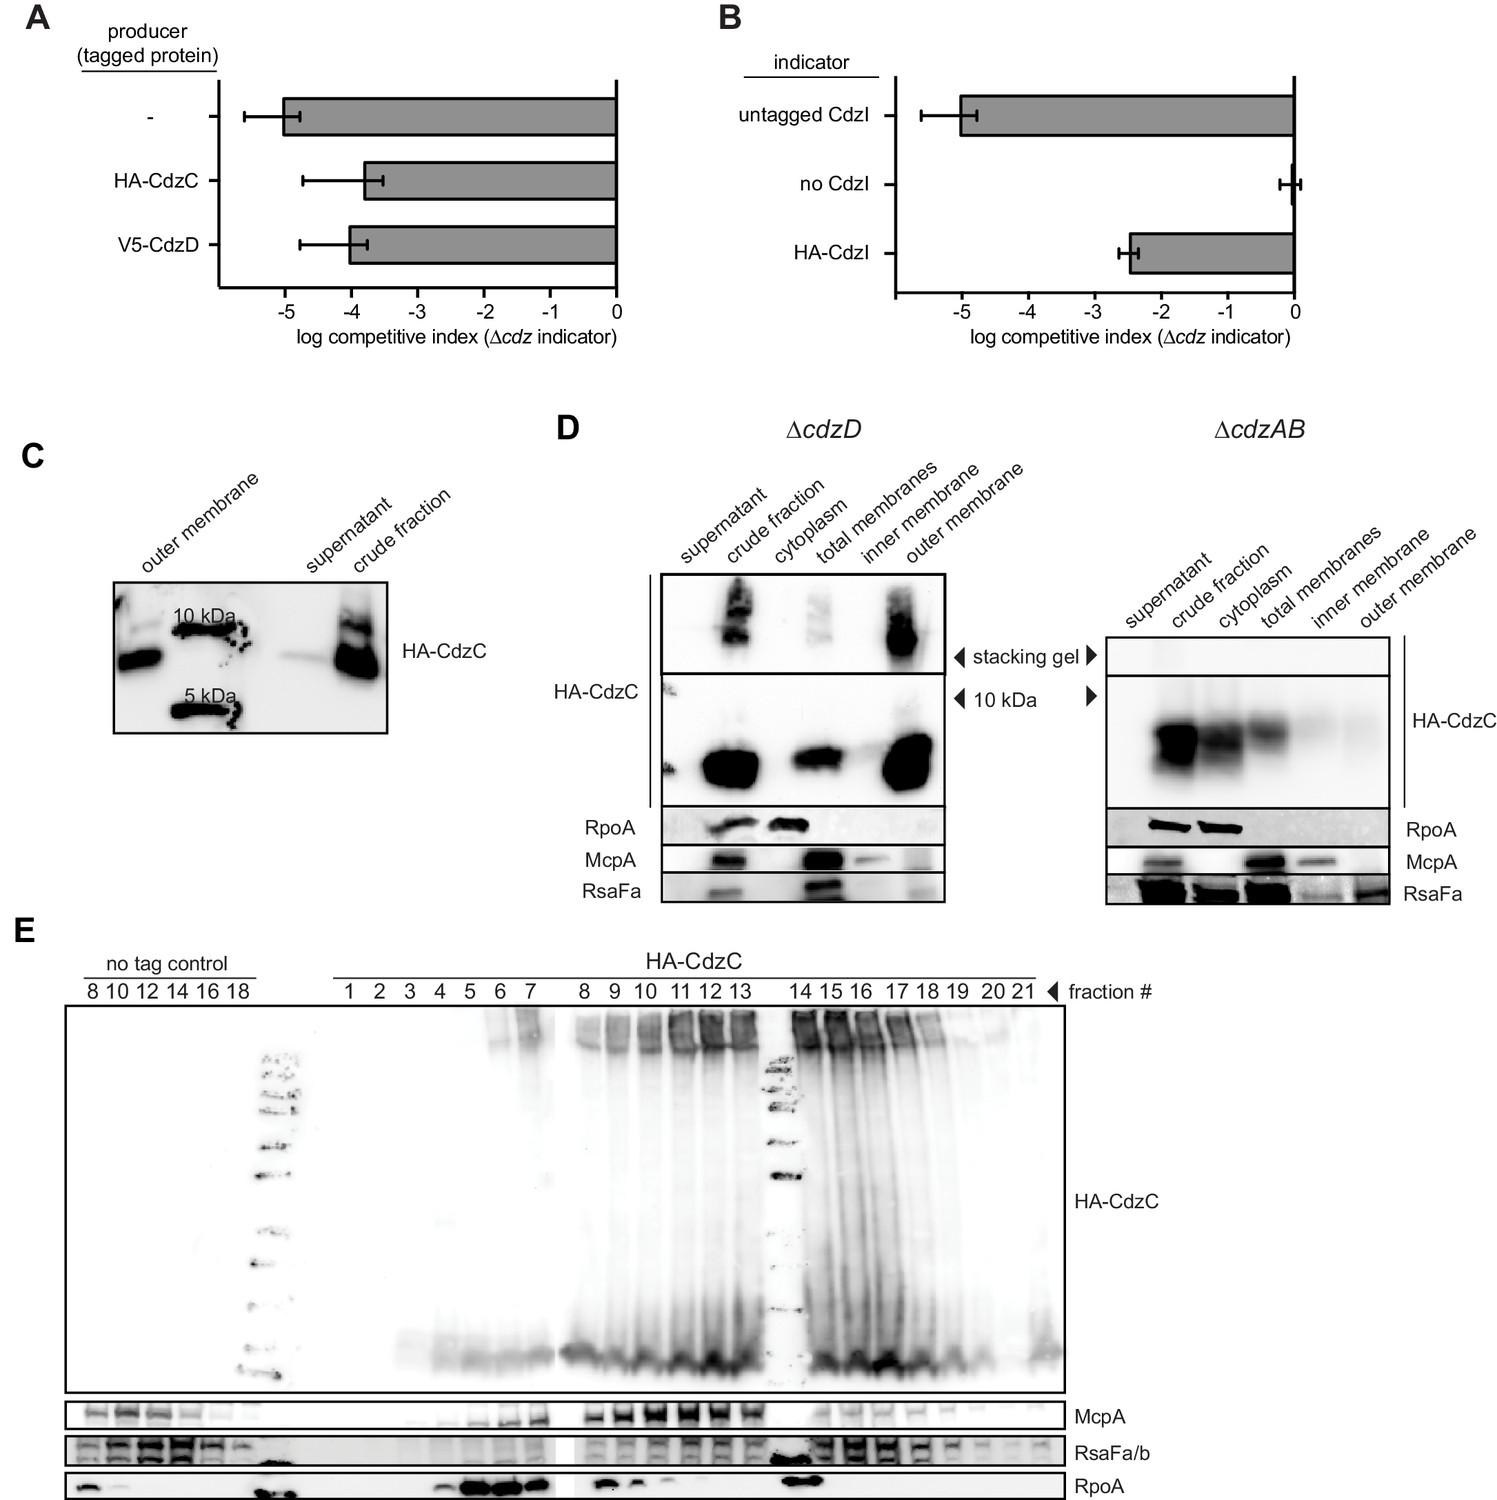
(A) Western blots of the indicated cell fractions from a culture of cells producing HA-tagged CdzC and grown to stationary phase. RpoA, McpA, and RsaFa serve as controls for cytoplasmic, inner membrane, and outer membrane fractions, respectively. For HA-CdzC, the stacking gel and relevant portion of the running gel are shown. The approximate size of CdzC bands were estimated from a molecular weight ladder run in a non-adjacent lane on the same gel, and confirmed on 16.5% Tris-tricine gels (Figure 5—figure supplement 1C). (B) Western blot of the indicated fractions from a sucrose gradient (25–60% w/v) based separation of the membrane fractions from a stationary phase culture expressing HA-tagged CdzC. An approximate molecular weight ladder is shown. RsaFa/b and McpA serve as controls for the outer and inner membranes, respectively. (C–D) Same as panel A but for a strain producing (C) V5-CdzD or (D) HA-CdzI. (E) Western blot for HA-CdzC in Triton X-100 based cell fractionation as in panel A, but using native gels instead of SDS-PAGE. (F) Same as panel B, but with outer membrane fractions pooled and either treated or not with formic acid.
Figure 5—figure supplement 1
Epitope-tagging of CdzC and CdzD does not affect their toxicity.
(A) Competitions in which the producer strain was ∆cdzCDI harboring a low copy number plasmid expressing epitope-tagged CdzC or CdzD, as indicated, with the rest of the operon untagged. The indicator strain in each case was ∆cdzABCDI. (B) Competition using wild-type as the producer, and a ∆cdzCDI inidicator strain harboring a low copy number plasmid with no CdzD, untagged CdzI, or epitope-tagged CdzI, and with the rest of the operon untagged. In panels A-B, data points represent the mean of at least three independent experiments; error bars indicate S.D. (C) Western blot showing sizes of CdzC bands on a 16.5% tris-trisine gel. (D) Western blot showing Triton X-100 cell fractionation and SDS-PAGE analysis of ∆cdzD (left) or ∆cdzAB (right) stationary phase producers expressing epitope-tagged CdzC. (E) Sucrose gradient (35–70% w/v) separation of membrane fractions from stationary phase producer cells expressing epitope-tagged CdzC. Inclusion bodies and cytosolic insoluble protein aggregates would be recovered in the heaviest fractions. RpoA (cytosolic), McpA (inner membrane), and RsaFa (outer membrane) immunoblots are controls for various cell fractions.
Figure 6 with 2 supplements
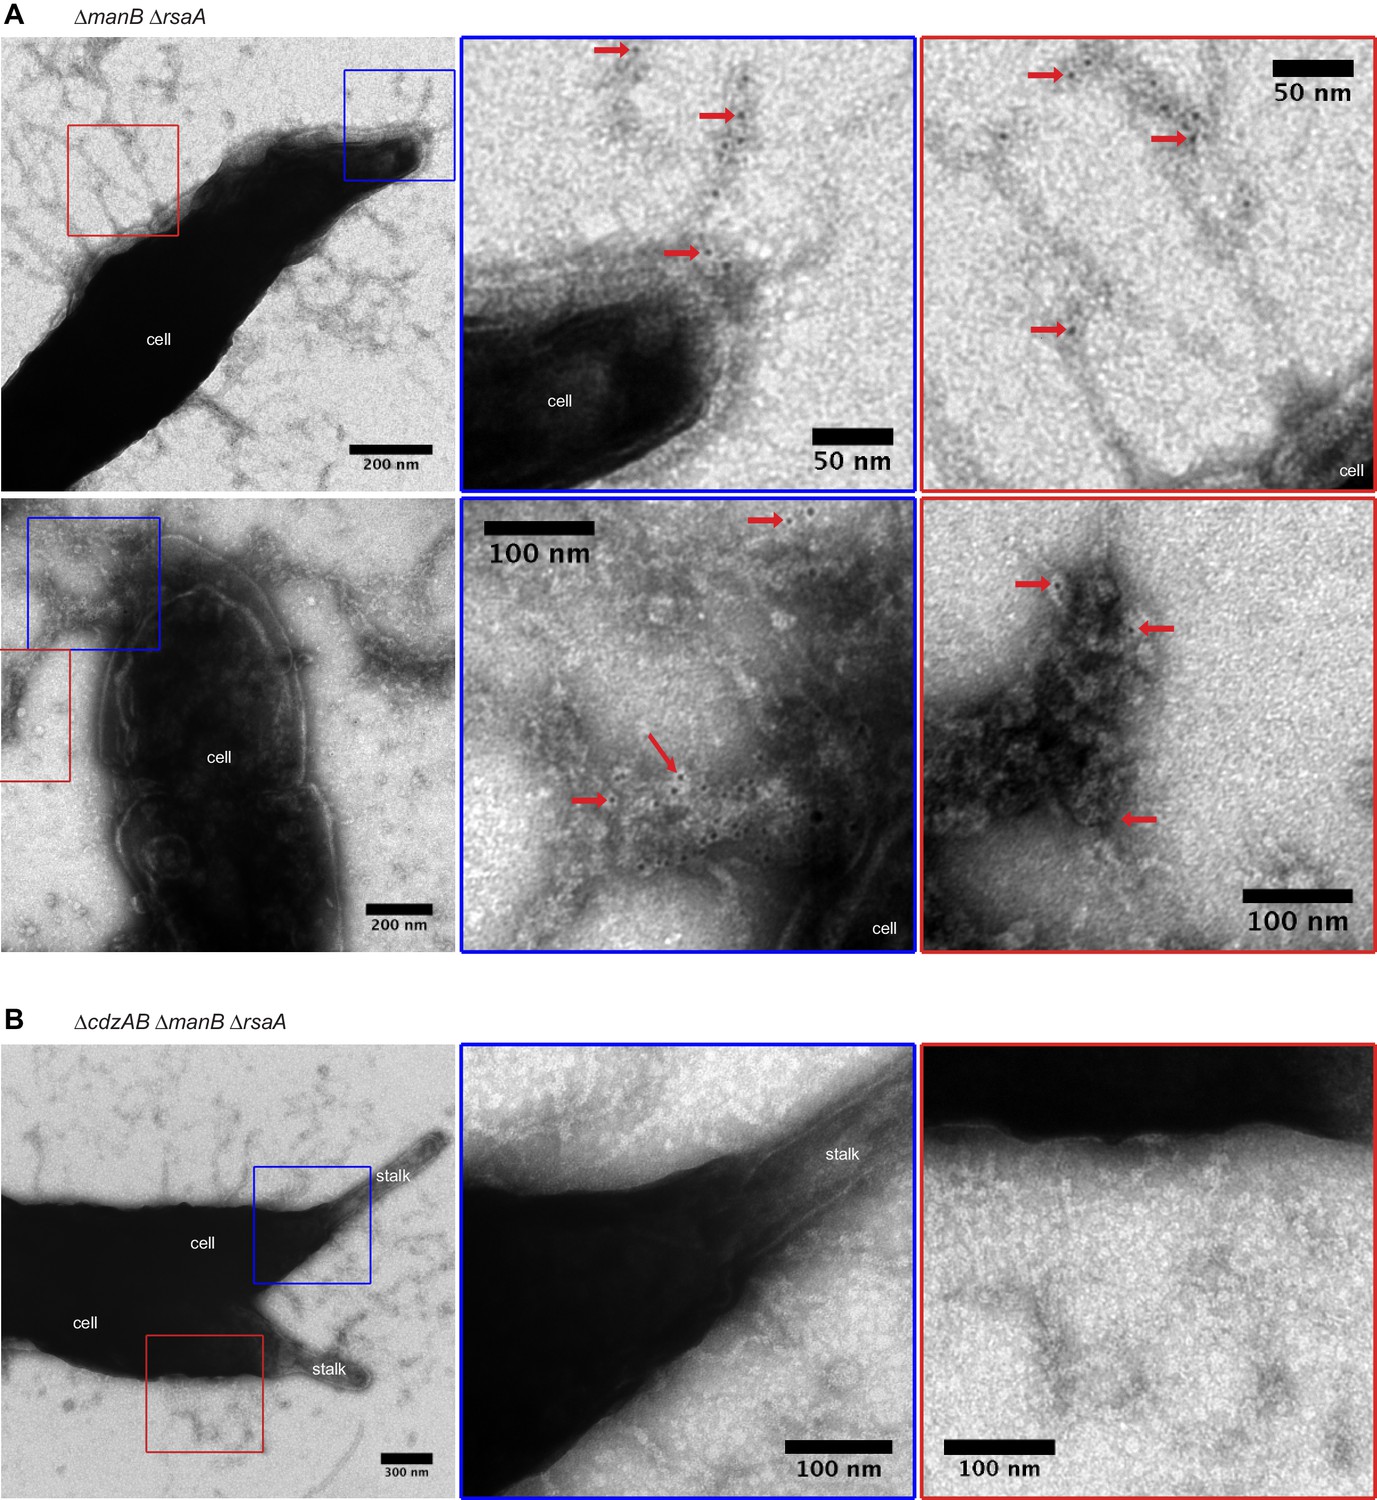
CdzC aggregates on the surface of producer cells.
Immunogold labelling and transmission electron microscopy of the stationary phase producer cells indicated, each expressing an epitope-tagged CdzC. Middle and right images on each row are zoomed in regions noted on the lower magnification images on the left. Red arrows point at examples of gold particle label. Stationary phase cells of (A) a ∆manB ∆rsaA producer strain and (B) a ∆cdzAB ∆manB ∆rsaA strain.
Figure 6—figure supplement 1
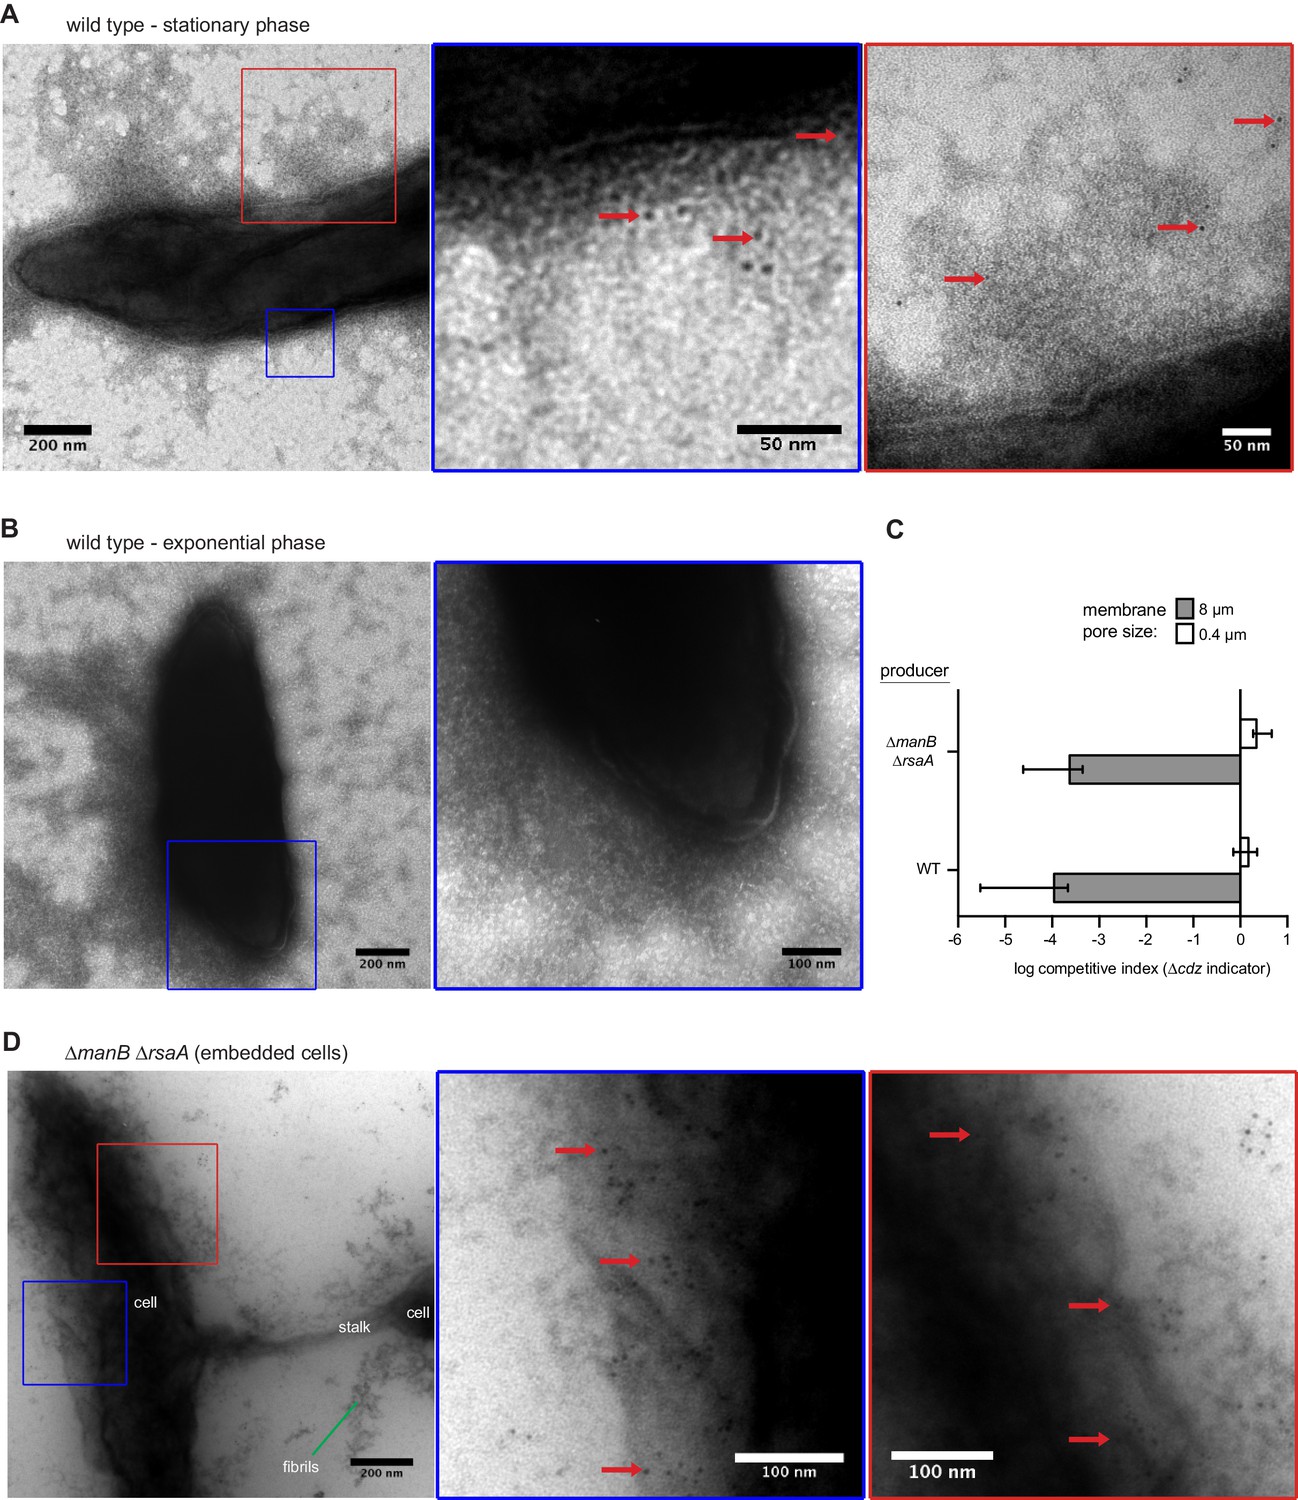
CdzC aggregates on the surface of wild-type producer cells.
(A) Immunogold labelling and transmission electron microscopy of stationary phase wild-type producer cells expressing an epitope-tagged CdzC. Middle and right images are zoomed in regions noted on the lower magnification images on the left. Red arrows point at examples of gold particle label. (B) Same as panel A but for exponential phase cells. (C) Split-well competition, like in Figure 4B, between an exopolysaccharide, S-layer deficient producer (∆manB ∆rsaA) and a ∆cdzCDI indicator. (D) Same as panels A-B, but for stationary phase ∆manB ∆rsaA producer cells, embedded in methylcellulose.
Figure 6—figure supplement 2
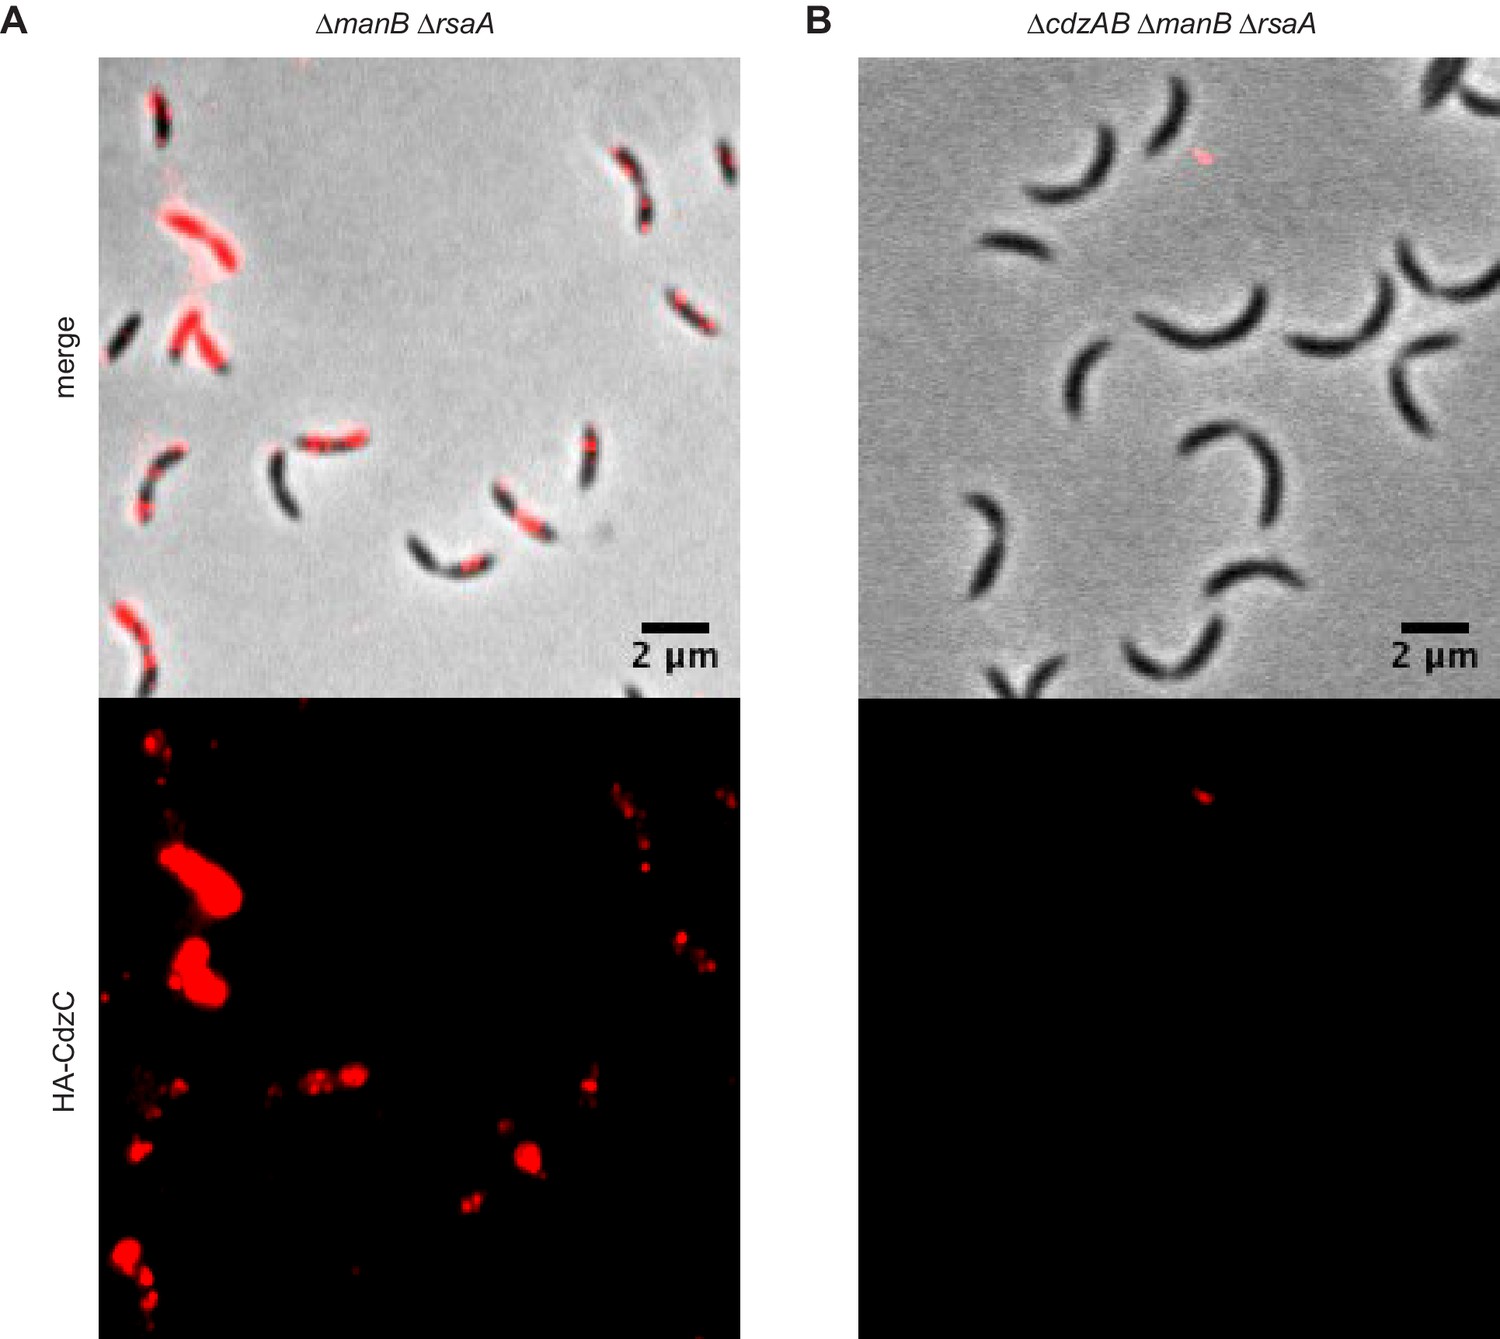
Immunofluorescence of the producer cells indicated, each expressing an epitope-tagged CdzC.
Stationary phase cells of (A) a ∆manB ∆rsaA producer strain and (B) a ∆cdzAB ∆manB ∆rsaA strain.
Figure 7 with 1 supplement

Phylogenetic distribution of putative Cdz-like systems in bacteria.
(A) Multiple sequence alignment used as the seed in an iterative computational search for Cdz-like systems (see Materials and methods). The presumed leader peptide of each sequence is indicated. Amino acid composition is represented with colors as follows: grey, hydrophobic; glycine, green; positively charged, red; negatively charged, blue. The location of the conserved glycine zipper region is indicated below the alignment. The Aβ peptide, which also contains a glycine zipper, is shown for comparison. The sequence logo generated from all 239 Cdz-like proteins identified is shown at the bottom. (B) Phylogenetic distribution of Cdz-like systems identified in UniProtKB. Each branch corresponds to a unique sequence. Numbers at the tips of collapsed branches indicate the number of strains for a given species harboring a Cdz-like system. Orange branches correspond to the Enterobacteriaceae. Predicted number of Cdz-like proteins is indicated based on the legend at the bottom left.
Figure 7—figure supplement 1
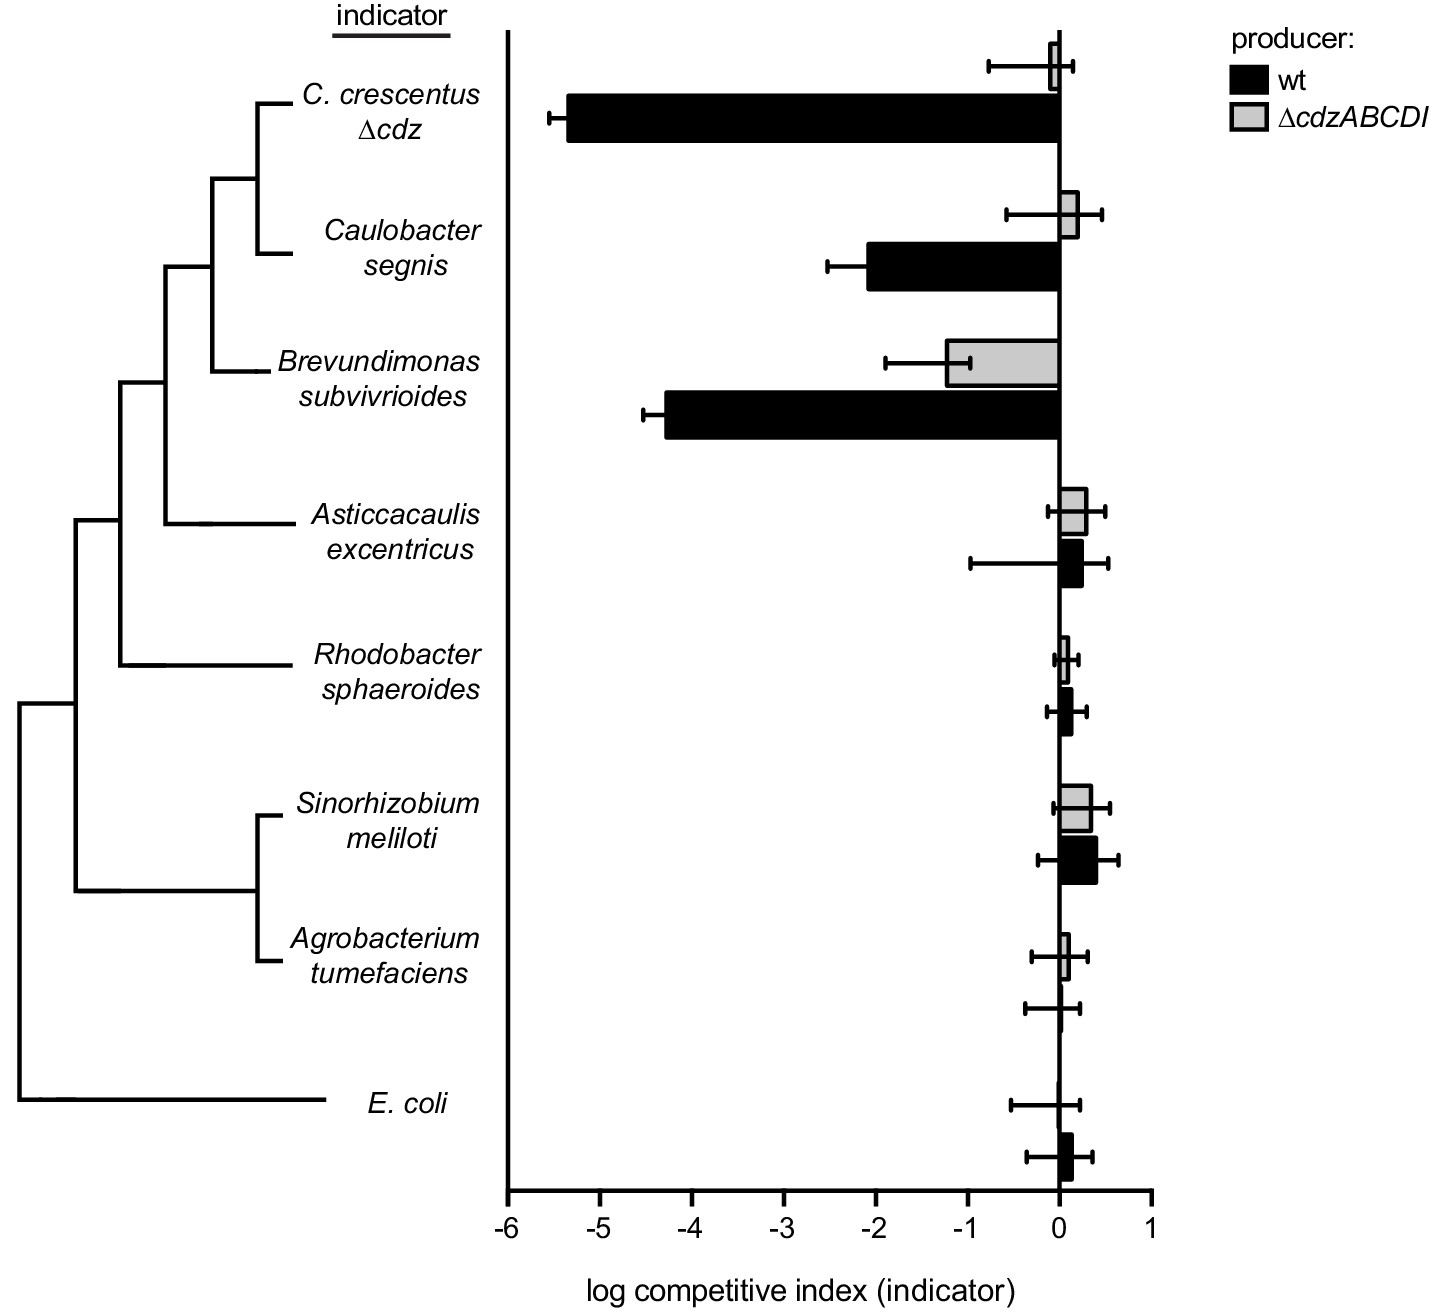
Competitions between a wild-type or ∆cdzABCDI Caulobacter crescentus producer and the indicator species shown: ∆cdz Caulobacter crescentus, Caulobacter segnis, Brevundimonas subvibrioides, Asticcacaulis excentricus, Rhodobacter sphaeroides, Sinorhizobium meliloti, Agrobacterium tumefaciens, or E. coli.
In each panel, data points represent the mean of at least three independent experiments; error bars indicate S.D. Tree on the left illustrates phylogenetic relationship between groups, branch lengths are not representative of phylogenetic distance.
Additional files
-
Supplementary file 1
Cdz-like peptides identified in UniprotKB.
- https://doi.org/10.7554/eLife.24869.017
-
Supplementary file 2
Oligonucleotides.
- https://doi.org/10.7554/eLife.24869.018
-
Supplementary file 3
Strains.
- https://doi.org/10.7554/eLife.24869.019
-
Supplementary file 4
Plasmids.
- https://doi.org/10.7554/eLife.24869.020
Download links
A two-part list of links to download the article, or parts of the article, in various formats.
Downloads (link to download the article as PDF)
Open citations (links to open the citations from this article in various online reference manager services)
Cite this article (links to download the citations from this article in formats compatible with various reference manager tools)
Contact-dependent killing by Caulobacter crescentus via cell surface-associated, glycine zipper proteins
eLife 6:e24869.
https://doi.org/10.7554/eLife.24869


