Continuous transport of a small fraction of plasma membrane cholesterol to endoplasmic reticulum regulates total cellular cholesterol
- University of Texas Southwestern Medical Center, United States
Figures
Figure 1
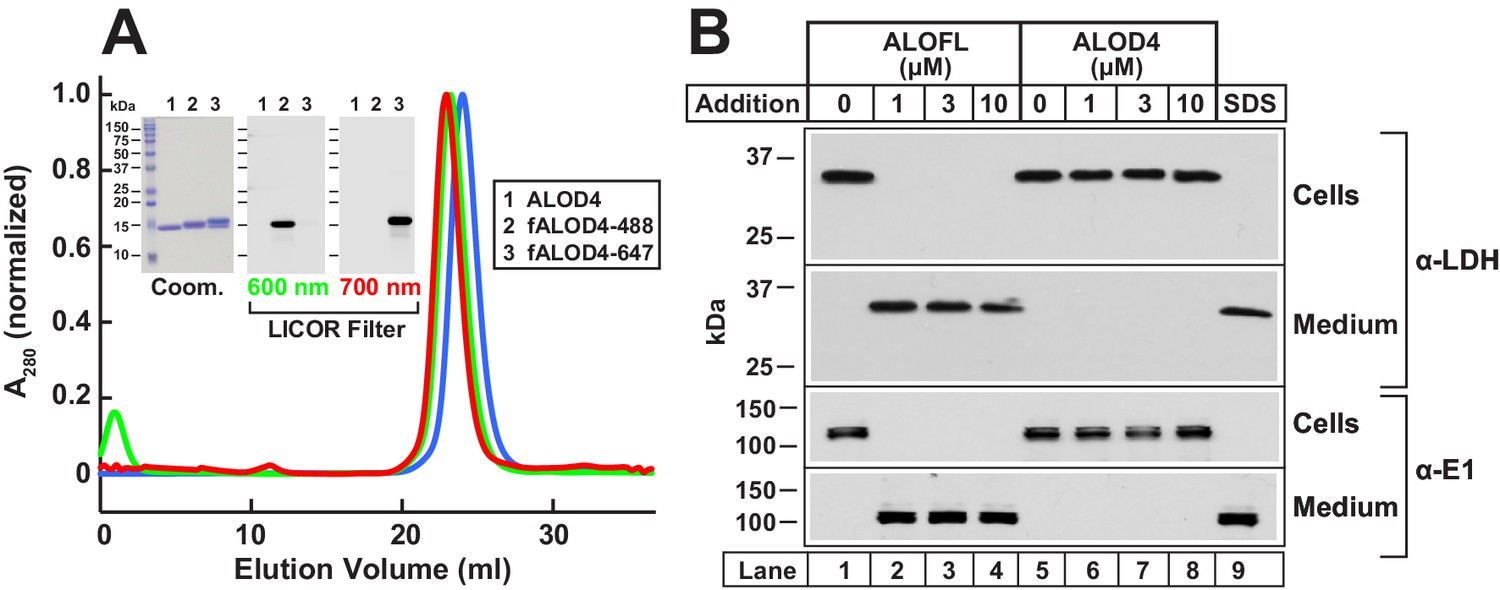
Biochemical characterization and non-lytic properties of ALOD4.
(A) Gel filtration chromatography of purified proteins. Recombinant ALOD4 was purified and labeled with Alexa Fluor 488 (fALOD4-488) or Alexa Fluor 647 (fALOD4-647) fluorescent dyes as described in Materials and methods. Buffer B (1 ml) containing 0.8 mg of ALOD4, fALOD4-488, or fALOD4-647 was loaded onto a Tricorn 10/300 Superdex 200 column and chromatographed at a flow rate of 0.5 ml/min. Absorbance at 280 nm (A280) was monitored continuously to identify ALOD4(blue), fALOD4-488(green), or fALOD4-647(red) proteins. Maximum A280 values for each protein (ALOD4: 390 mAU, fALOD4-488: 231 mAU, and fALOD4-647: 279 mAU) are normalized to one. (Inset) 3 µg of each protein was subjected to 15% SDS/PAGE and stained with Coomassie (left) or imaged with the 600 nm filter (middle) or the 700 nm filter (right) on a LICOR instrument. (B) Release of cytosolic proteins from CHO-K1 cells into media after incubation with ALOFL, but not ALOD4. On day 0, CHO-K1 cells were set up in medium B at a density of 6 × 10⁴ cells/well of 48-well plates. On day 1, media was removed, and cells were washed with 500 µl of PBS followed by addition of either 200 µl of medium C with the indicated concentration of ALOFL or ALOD4, or with 200 µl of buffer C containing 1% SDS detergent. After incubation for 1 hr at 37°C, media was collected and cells were harvested as described in Materials and methods. Equal aliquots of cells and media (10% of total) were subjected to immunoblot analysis as described in Materials and methods. Coom, Coomassie.
Figure 2
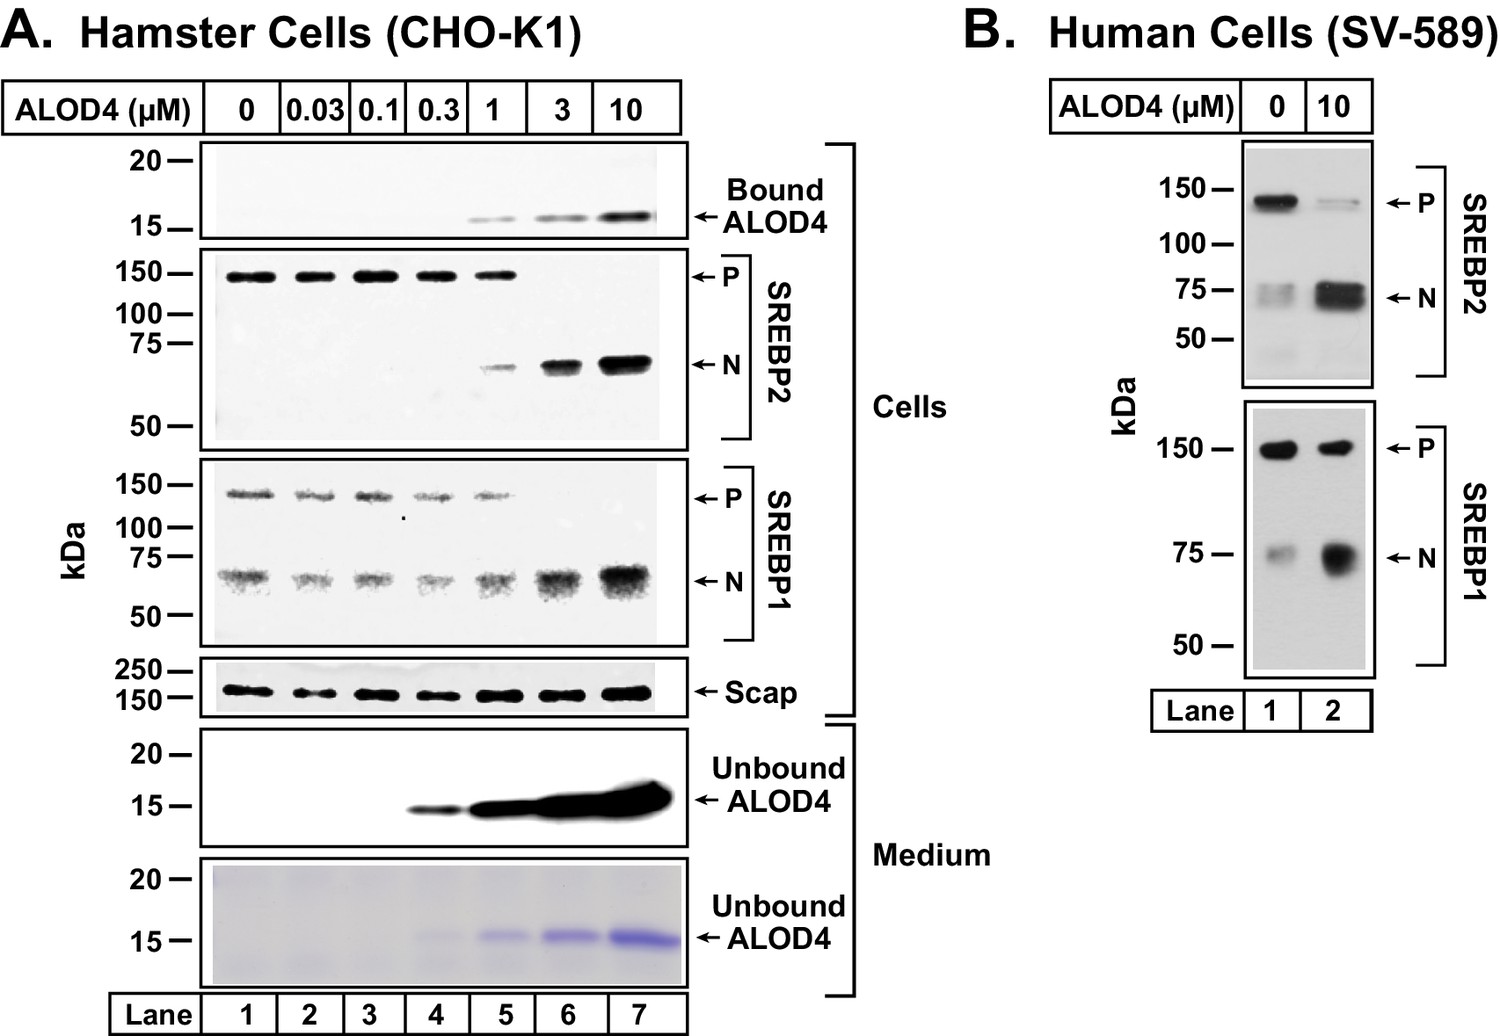
ALOD4 triggers activation of SREBP transcription factors in hamster and human cells.
(A–B) On day 0, CHO-K1 cells were set up in medium B at a density of 6 × 10⁴ cells/well of 48-well plates (A) and SV-589 cells were set up in medium H at a density of 4 × 10⁴ cells/well of 48-well plates (B). On day 1 (A) or day 2 (B), media was removed, cells were washed with 500 µl of PBS followed by addition of 200 µl of medium C (A) or medium G (B) with the indicated concentrations of ALOD4. After incubation for 1 hr at 37°C, media was collected, and cells were harvested as described in Materials and methods. Equal aliquots of cells and media (10% of total) were subjected to immunoblot analysis or Coomassie staining as described in Materials and methods. P = precursor form of SREBP1 or SREBP2; N = cleaved nuclear form of SREBP1 or SREBP2.
Figure 3

ALOD4 binding to cells activates SREBP2 transcription factors without changing cellular cholesterol levels.
(A–B) Immunoblot analysis of CHO-K1 cells after incubation with ALOD4 or ALOD4(Mut) proteins in lipoprotein-rich or lipoprotein-poor serum. On day 0, CHO-K1 cells were set up in medium B at a density of either 3 × 10⁴ cells/well of 48-well plates (A) or 6 × 10⁴ cells/well of 48-well plates (B). On day 1 (B) or day 2 (A), media was removed, cells were washed with 500 µl of PBS and then the following additions were made: 200 µl of medium C with indicated concentrations of ALOD4 or ALOD4(Mut) (A) or 200 µl of lipoprotein-rich medium C or lipoprotein-poor medium F with indicated concentrations of ALOD4 (B). After incubation for 1 hr at 37°C, media was collected, and cells were harvested as described in Materials and methods. Equal aliquots of cells and media (10% of total) were subjected to immunoblot analysis or Coomassie staining as described in Materials and methods. (C) Cellular cholesterol levels decline after treatment with HPCD, but not after treatment with ALOD4. On day 0, CHO-K1 cells were set up in medium B at a density of 2.5 × 10⁵ cells/60 mm dish. On day 3, media was removed, followed by addition of 200 µl of medium C with the indicated concentration of HPCD or ALOD4. After incubation for 1 hr at 37°C, media was removed and cells were harvested as described in Materials and methods. An aliquot of cells (5% of total) was used for immunoblot analysis (25 µg/lane), and the remainder was used for quantification of cholesterol as described in Materials and methods. Each column represents the mean of cholesterol measurements from three independent experiments, and error bars show the standard error (top panel). Asterisks denote level of statistical significance (Student t test) between cells treated without and with HPCD: *p<0.05. Immunoblot analysis of the cells from one of the three experiments is shown in the bottom panel. (D) ALOD4 treatment causes increases in mRNA levels of HMG CoA Reductase and LDL receptor genes. On day 0, CHO-K1 cells were set up in medium B at a density of 5 × 10⁵ cells/100 mm dish. On day 2, media was removed, followed by addition of 2 ml of medium C in the absence or presence of ALOD4 (5 µM) or HPCD (1% w/v). After incubation for 4 hr at 37°C, media was removed, and cells were harvested for measurement of the indicated mRNA by quantitative RT-PCR as described in Materials and methods. For each gene, the amount of mRNA from untreated cells is set to 1, and mRNA amounts from cells treated with ALOD4 or HPCD are expressed relative to this reference value. Each column represents the mean of relative mRNA values measured in three independent experiments, and error bars show the standard error. Asterisks denote level of statistical significance (Student t test) between cells treated without and with ALOD4 or HPCD: *p<0.05; **p<0.01; ***p<0.001. The average Ct values for actin (invariant control) were 15.38, 15.31, and 15.18 for the untreated, ALOD4-treated, and HPCD-treated conditions, respectively. The average Ct values for HMG CoA Reductase and LDL receptor were 21.3 and 22.3, respectively, for the untreated condition. P = precursor form of SREBP2; N = cleaved nuclear form of SREBP2.
Figure 4
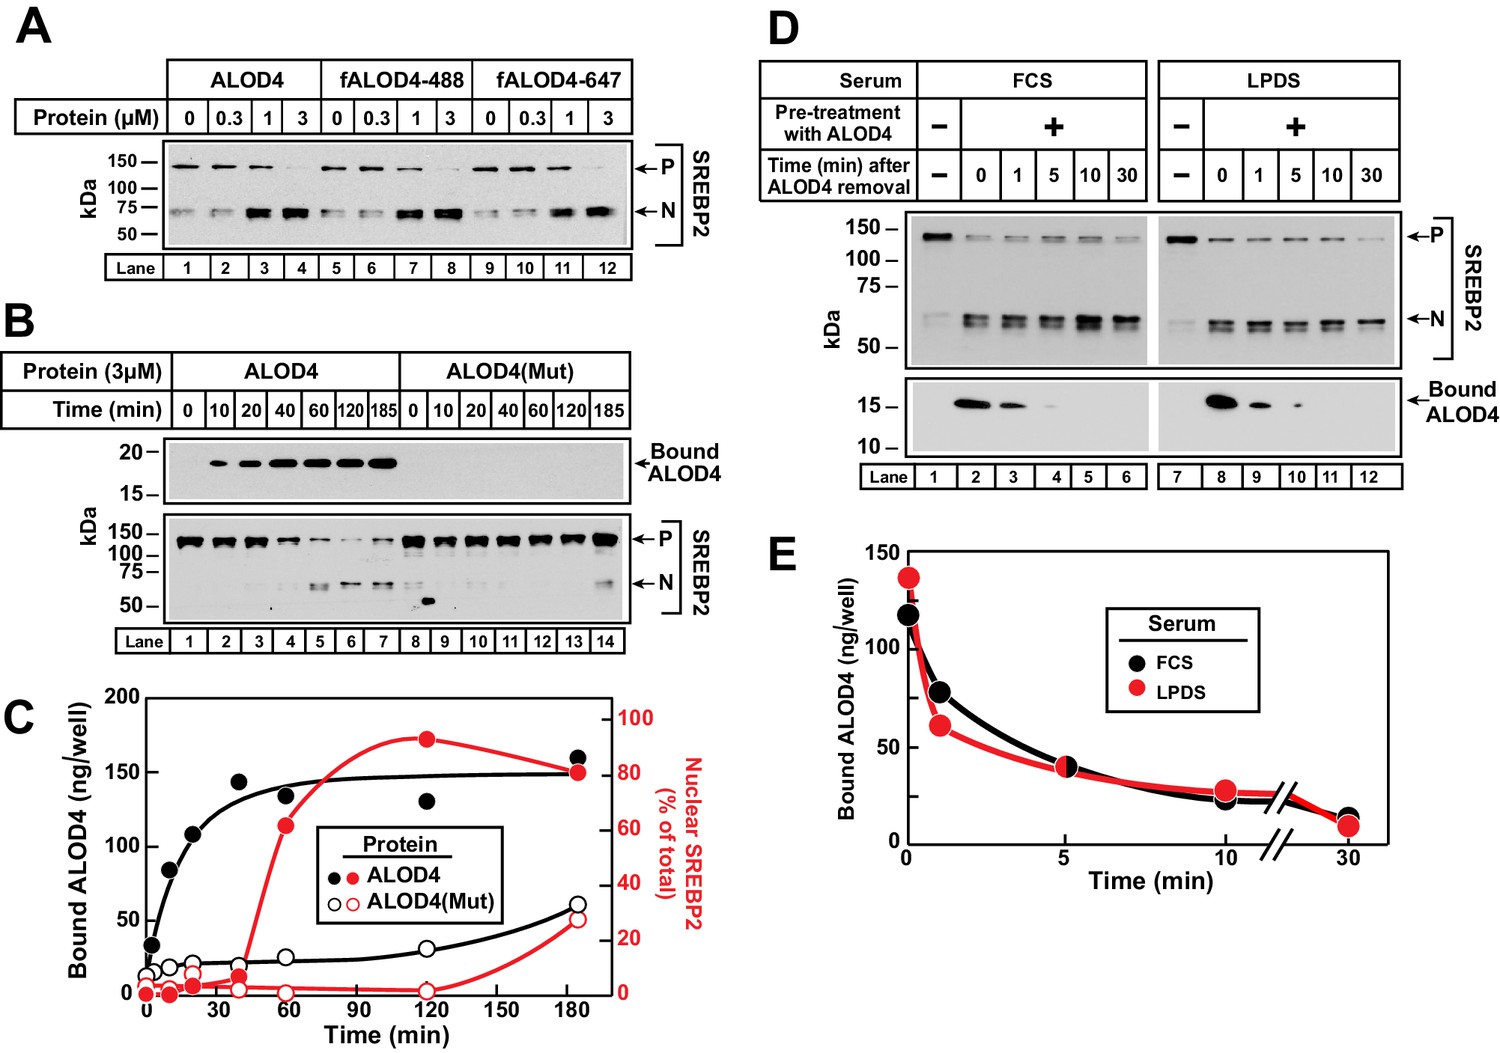
Kinetics of ALOD4 binding to CHO-K1 cells.
(A) Fluorescence labeling of ALOD4 does not affect its ability to trigger SREBP2 activation. Recombinant ALOD4 was purified and labeled with Alexa Fluor 488 (fALOD4-488) or Alexa Fluor 647 (fALOD4-647) fluorescent dyes as described in Materials and methods. On day 0, CHO-K1 cells were set up in medium B at a density of 3 × 10⁴ cells/well of 48-well plates. On day 2, media was removed, and cells were washed with 500 µl of PBS followed by addition of 200 µl of medium C with the indicated concentrations of ALOD4, fALOD4-488, or fALOD4-647. After incubation for 1 hr at 37°C, media was removed, and cells were harvested and subjected to immunoblot analysis as described in Materials and methods. (B, C) Association rate. On day 0, CHO-K1 cells were set up in medium B at a density of 6 × 10⁴ cells/well of 48-well plates. On day 1, media was removed, and cells were washed with 500 µl of PBS followed by addition of 200 µl of medium C containing 3 µM of either ALOD4 or ALOD4(Mut). For quantification purposes, ~5% of ALOD4 or ALOD4(Mut) proteins were labeled with Alexa Fluor 488 dyes. After incubation for the indicated times at 37°C, the cells were harvested and subjected to either immunoblot analysis for detection of SREBP2 processing and bound ALOD4 (B) or fluorescence analysis of bound ALOD4 (C) as described in Materials and methods. LICOR quantification of SREBP2 from (B) is expressed as the amount of nuclear form relative to the total (precursor plus nuclear) (C, red). (D, E) Dissociation rate. On day 0, CHO-K1 cells were set up in medium B at a density of 6 × 10⁴ cells/well of 48-well plates. On day 1, media was removed, and cells were washed with 500 µl of PBS followed by addition of 200 µl of lipoprotein-rich medium C or lipoprotein-poor medium F with 3 µM of ALOD4. For quantification purposes, ~5% of ALOD4 or ALOD4(Mut) proteins were labeled with Alexa Fluor 647 dyes. After incubation for 1 hr at 37°C, media was removed, and cells were washed twice with 500 µl of PBS followed by addition of 200 µl of medium C or medium F without ALOD4. After incubation for the indicated times at 37°C, the cells were harvested and subjected to either immunoblot analysis for detection of SREBP2 processing and bound ALOD4 (D) or fluorescence analysis of bound ALOD4 (E) as described in Materials and methods. Curves are drawn merely to guide the eye and do not represent a fit. P = precursor form of SREBP2; N = cleaved nuclear form of SREBP2.
Figure 5

ALOD4 triggers activation of SREBP2 by lowering ER cholesterol levels while leaving PM cholesterol levels unchanged.
(A–B) On day 0, CHO-K1 cells were set up in medium B at a density of 5 × 10⁵ cells/100 mm dish (20 dishes/replicate/condition). On day 1, media was removed and fresh medium B was added. On day 2, media was removed, cells were washed with 5 mL PBS, followed by addition of 2 ml of medium B without or with ALOD4 (5 µM) or HPCD (1% w/v). After incubation for 1 hr at 37°C, media was removed, and cells were washed twice with 5 ml of PBS. After the washes, 5 ml of PBS was added to each dish and cells were harvested. An aliquot of cells (one dish/replicate/condition) was used for immunoblot analysis and quantification of whole cell cholesterol as described in Materials and methods. Another aliquot of cells (two dishes/replicate/condition) was used for PM purification and quantification of PM cholesterol, as described in Materials and methods. The remainder of cells (17 dishes/replicate/condition) was used for ER purification and quantification of ER cholesterol, as described in Materials and methods. Immunoblot of the cells from one of the three replicates for each treatment condition is shown in (A), and whole cell, PM, and ER cholesterol levels are shown in (B). Each column represents the mean of cholesterol measurements from triplicate assays, and error bars show the standard error. Asterisks denote level of statistical significance (Student t test) between cells treated without and with ALOD4 or HPCD: *p<0.05; **p<0.01. P = precursor form of SREBP2; N = cleaved nuclear form of SREBP2.
Figure 6
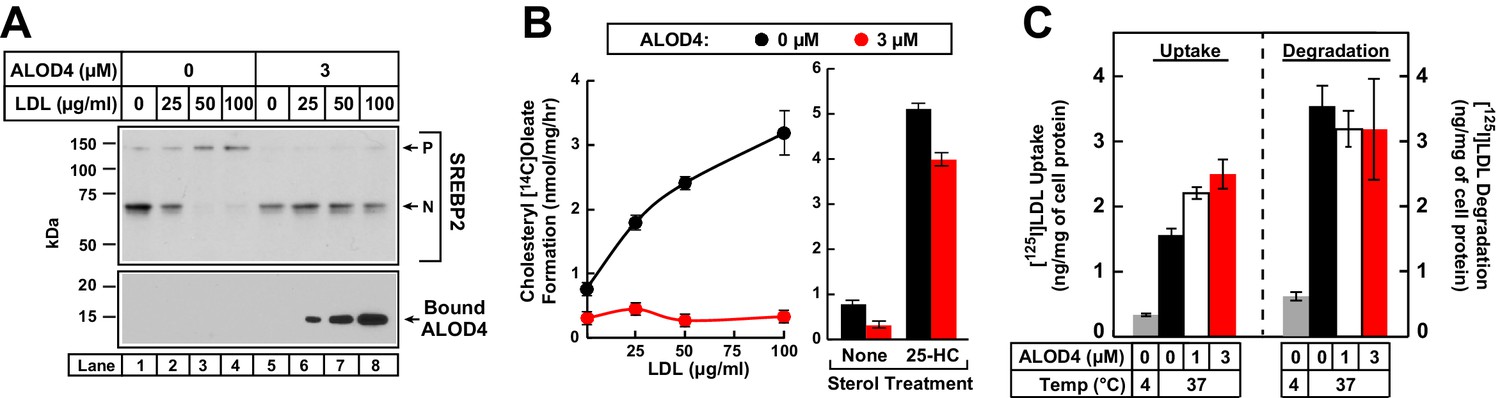
ALOD4 blocks PM-to-ER transport of LDL-derived cholesterol in CHO-K1 cells.
(A) Immunoblot analysis of sterol-depleted CHO-K1 cells incubated with LDL in the absence or presence of ALOD4 proteins. On day 0, CHO-K1 cells were set up in medium B at a density of 3 × 10⁴ cells/well of 48-well plates. On day 2, media was removed, and cells were washed twice with 500 µl PBS followed by the addition of 200 µl of medium E with 2% HPCD (sterol-depleting). After incubation for 1 hr at 37°C, media was removed, and sterol-depleted cells were washed twice with 500 µl of PBS followed by addition of 200 µl of medium E with the indicated concentration of human LDL in the absence or presence of 3 µM ALOD4. After incubation for 3 hr at 37°C, the cells were harvested and subjected to immunoblot analysis for SREBP2 and cell surface-bound ALOD4, as described in Materials and methods. (B) Cholesterol esterification in the presence of ALOD4. On day 0, CHO-K1 cells were set up in medium B at a density of 2.5 × 10⁵ cells/60 mm dish. On day 2, media was removed, and cells were washed twice with 2 ml of PBS followed by addition of 2 ml of medium D. On day 3, media was removed, and cells were washed with 2 ml of PBS followed by addition of 1 ml of medium E with the indicated concentration of human LDL or 5 µg/ml of 25-HC (in ethanol), all in the absence or presence of 3 µM ALOD4. After incubation for 1 hr at 37°C, each monolayer was supplemented with 0.2 mM of sodium [14C]oleate (7759 dpm/nmol), and incubated for an additional 2 hr at 37°C. The cells were then harvested, and their levels of [14C]cholesteryl oleate and [14C]triglycerides were measured as described in Materials and methods. The levels of [14C]triglycerides formed at 0 and 100 µg/ml LDL treatment conditions were 38.6 and 39.3 nmol/mg/h, respectively, in the absence of ALOD4, and 31.2 and 30.7 nmol/mg/h, respectively, in the presence of 3 µM ALOD4. Each data point or column represents the mean of cholesterol esterification measurements from three independent experiments, and error bars show the standard error. (C) LDL uptake and degradation in the presence of ALOD4. CHO-K1 cells were set up on day 0 and treated on day 2 exactly as described in (B). On day 3, media was removed, and cells were washed with 2 ml of PBS followed by addition of 1 ml of medium E containing 50 µg/ml of [125I]LDL (35.3 cpm/ng) in the absence or presence of 1 or 3 µM of ALOD4. The cells were incubated for 3 hr at either 4°C or 37°C, after which LDL uptake and degradation was determined as described in Materials and methods. Each column represents the mean of measurements from three independent experiments, and error bars show the standard error. P = precursor form of SREBP2; N = cleaved nuclear form of SREBP2.
Figure 7
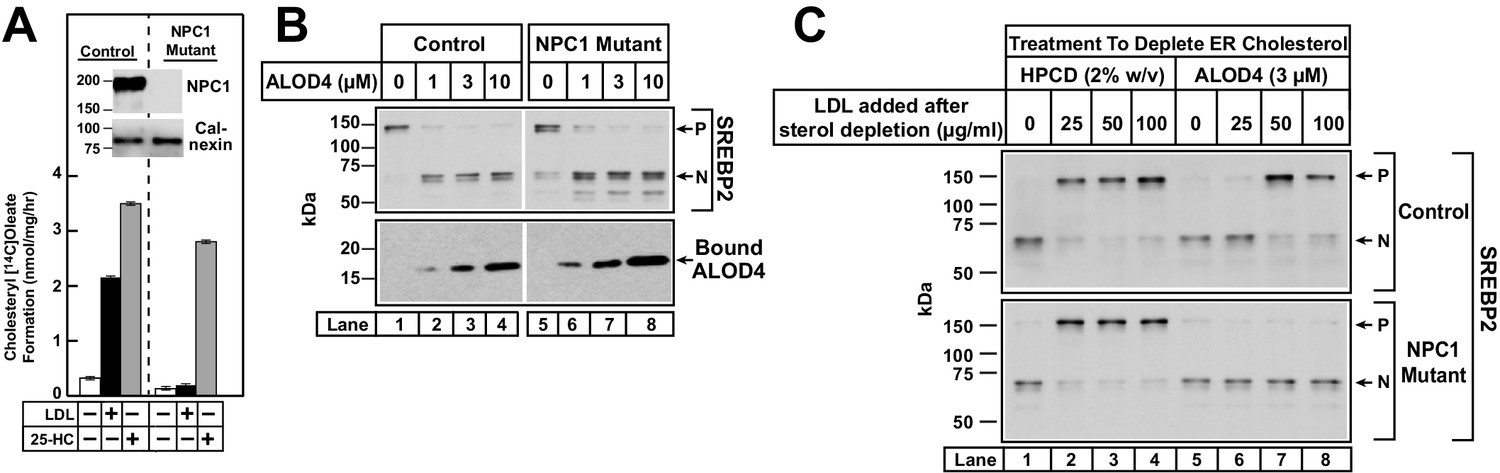
ALOD4 blocks PM-to-ER transport of cholesterol in NPC1-deficient CHO-K1 cells.
(A) Cholesterol esterification in control and NPC1-deficient CHO-K1 cells. On day 0, cells were set up in medium B at a density of 2.5 × 10⁵ cells/60 mm dish. On day 2, media was removed, and cells were washed twice with 2 ml of PBS followed by addition of 2 ml of medium D. On day 3, media was removed, and cells were washed with 2 ml of PBS followed by addition of 1 ml of medium E in the absence or presence of 50 µg/ml of human LDL or 4 µg/ml of 25-HC (in ethanol). After incubation for 2 hr at 37°C, each monolayer was supplemented with 0.2 mM of sodium [14C]oleate (3913 dpm/nmol), and incubated for an additional 2 hr. The cells were then harvested, and their levels of [14C]cholesteryl oleate and [14C]triglycerides were measured as described in Materials and methods. The levels of [14C]triglycerides formed at 0, 50 µg/ml LDL, and 4 µg/ml 25-HC treatment conditions were 21.8, 22.1 and 18.7 nmol/mg/h, respectively, for control CHO-K1 cells, and 24.7, 22.3, and 19.7 nmol/mg/h, respectively, for NPC1-deficient CHO-K1 cells. Each column represents the mean of cholesterol esterification measurements from three independent experiments, and error bars show the standard error. (Inset) On day 0, control and NPC1-deficient CHO-K1 cells were set up in medium B at a density of 3 × 10⁴ cells/well of 48-well plates and 6 × 10⁴ cells/well of 48-well plates, respectively. On day 2, media was removed, and cells were harvested and subjected to immunoblot analysis of the indicated proteins as described in the Materials and methods. (B) Immunoblot analysis of control and NPC1-deficient CHO-K1 cells after incubation with ALOD4. Cells were set up on day 0 in lipoprotein-rich FCS as described in A (inset). On day 2, media was removed, and cells were washed twice with 500 µl of PBS followed by addition of 200 µl of lipoprotein-rich medium C with the indicated concentrations of ALOD4. After incubation for 1 hr at 37°C, the cells were harvested and subjected to immunoblot analysis as described in the Materials and methods. (C) Suppression of SREBP2 activation in control and NPC1-deficient CHO-K1 cells after induction with HPCD or ALOD4. Cells were set up on day 0 as described in A (inset). On day 2, media was removed, and cells were washed twice with 500 µl of PBS followed by addition of 200 µl of medium E with 2% HPCD or 3 µM ALOD4. After incubation for 1 hr at 37°C, media was removed, and cells were washed twice with 500 µl of PBS, followed by addition of 200 µl of medium C with the indicated amount of LDL, in the absence or presence of 3 µM ALOD4. After incubation for 3 hr at 37°C, the cells were harvested and subjected to immunoblot analysis as described in the Materials and methods. P = precursor form of SREBP2; N = cleaved nuclear form of SREBP2.
Figure 8
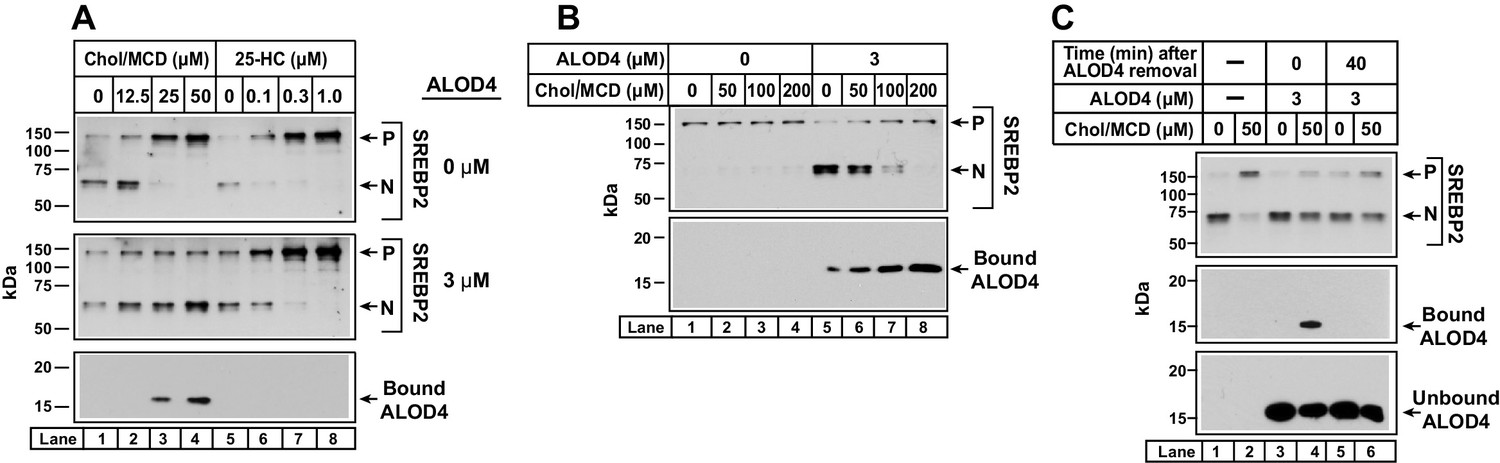
ALOD4 blocks PM-to-ER transport of cholesterol delivered directly to PM.
(A) Immunoblot analysis of sterol-depleted CHO-K1 cells incubated with cholesterol/MCD complexes in the absence or presence of ALOD4. On day 0, CHO-K1 cells were set up in medium B at a density of 6 × 10⁴ cells/well of 48-well plates in medium B. On day 1, media was removed, and cells were washed twice with 500 µl of PBS followed by addition of 200 µl of medium E with 2% HPCD (sterol-depleting). After incubation for 1 hr at 37°C, media was removed, and cells were washed twice with 500 µl of PBS followed by addition of 200 µl of medium E with the indicated amounts of cholesterol/MCD or 25-HC/ethanol, in the absence or presence of 3 µM ALOD4. (B) Triggering of SREBP2 activation by ALOD4 is overcome by addition of excess cholesterol/MCD. On day 0, CHO-K1 cells were set up in medium B at a density of 6 × 10⁴ cells/well of 48-well plates. On day 1, media was removed, and cells were washed with 500 µl of PBS followed by addition of 200 µl of medium C with the indicated concentration of cholesterol/MCD in the absence or presence of 3 µM ALOD4. (A–B) After incubation for 4 hr at 37°C (A) or 1 hr at 37°C (B), the cells were harvested and subjected to immunoblot analysis of SREBP2 and cell surface-bound ALOD4 as described in Materials and methods. (C) ALOD4 is not internalized by sterol-depleted cells. CHO-K1 cells were set up on day 0 and depleted of sterols on day 1 exactly as described in (A). After sterol depletion, media was removed, and cells were washed twice with 500 µl of PBS followed by addition of 200 µl of medium E without or with 50 µM cholesterol/MCD, in the absence or presence of 3 µM ALOD4. After incubation for 4 hr at 37°C, media was collected, cells were washed twice with 500 µl of PBS, and either harvested immediately or incubated with 200 µl of medium C without ALOD4 for 40 min at 37°C, and then harvested. Equal aliquots of cells and media (10% of total) were subjected to immunoblot analysis as described in Materials and methods. P = precursor form of SREBP2; N = cleaved nuclear form of SREBP2.
Figure 9

Model for the intracellular itinerary of LDL-derived cholesterol.
(A) Normal trafficking. LDL particles containing cholesteryl esters are internalized by sterol-depleted cells through receptor-mediated endocytosis. The internalized LDL is degraded in lysosomes, and its cholesteryl esters (chol. esters) are hydrolyzed by acid lipase to generate unesterified cholesterol (yellow circles) and fatty acids. Two lysosomal proteins, NPC1 and NPC2, mediate the exit of LDL-derived cholesterol from lysosomes. Cholesterol is transported first to the sterol-depleted PM to replenish its cholesterol until optimal levels are reached. Excess PM cholesterol then traffics to regions of the ER where the SREBP regulatory network is located and where cholesterol levels are below a threshold concentration. After expanding ER cholesterol past the threshold level, excess cholesterol binds to SCAP, the ER cholesterol sensor, that is in complexes with SREBPs. Binding to cholesterol changes the conformation of Scap promoting its interaction with Insigs, ER retention proteins, and preventing recruitment of the Scap-SREBP complex into CopII vesicles for transport to Golgi. Proteolytic activation of SREBPs in Golgi does not occur, and genes encoding enzymes for cholesterol synthesis and uptake are shut down, thus maintaining cholesterol homeostasis. Excess ER cholesterol can be transported to the PM or can be converted by ACAT, an ER enzyme, to cholesteryl esters and stored in intracellular lipid droplets. (B) Genetic disorders or engineered tools that impair trafficking of LDL-cholesterol at various steps in its itinerary. See Discussion for a description of each of the impairments.
Download links
A two-part list of links to download the article, or parts of the article, in various formats.
Downloads (link to download the article as PDF)
Open citations (links to open the citations from this article in various online reference manager services)
Cite this article (links to download the citations from this article in formats compatible with various reference manager tools)
Continuous transport of a small fraction of plasma membrane cholesterol to endoplasmic reticulum regulates total cellular cholesterol
eLife 6:e25466.
https://doi.org/10.7554/eLife.25466


