Efficacy of β-lactam/β-lactamase inhibitor combination is linked to WhiB4-mediated changes in redox physiology of Mycobacterium tuberculosis
- Indian Institute of Science, India
- International Centre for Genetic Engineering and Biotechnology, India
- National Institute of Immunology, India
- Jawaharlal Nehru Centre for Advanced Scientific Research, India
Figures
Figure 1 with 2 supplements
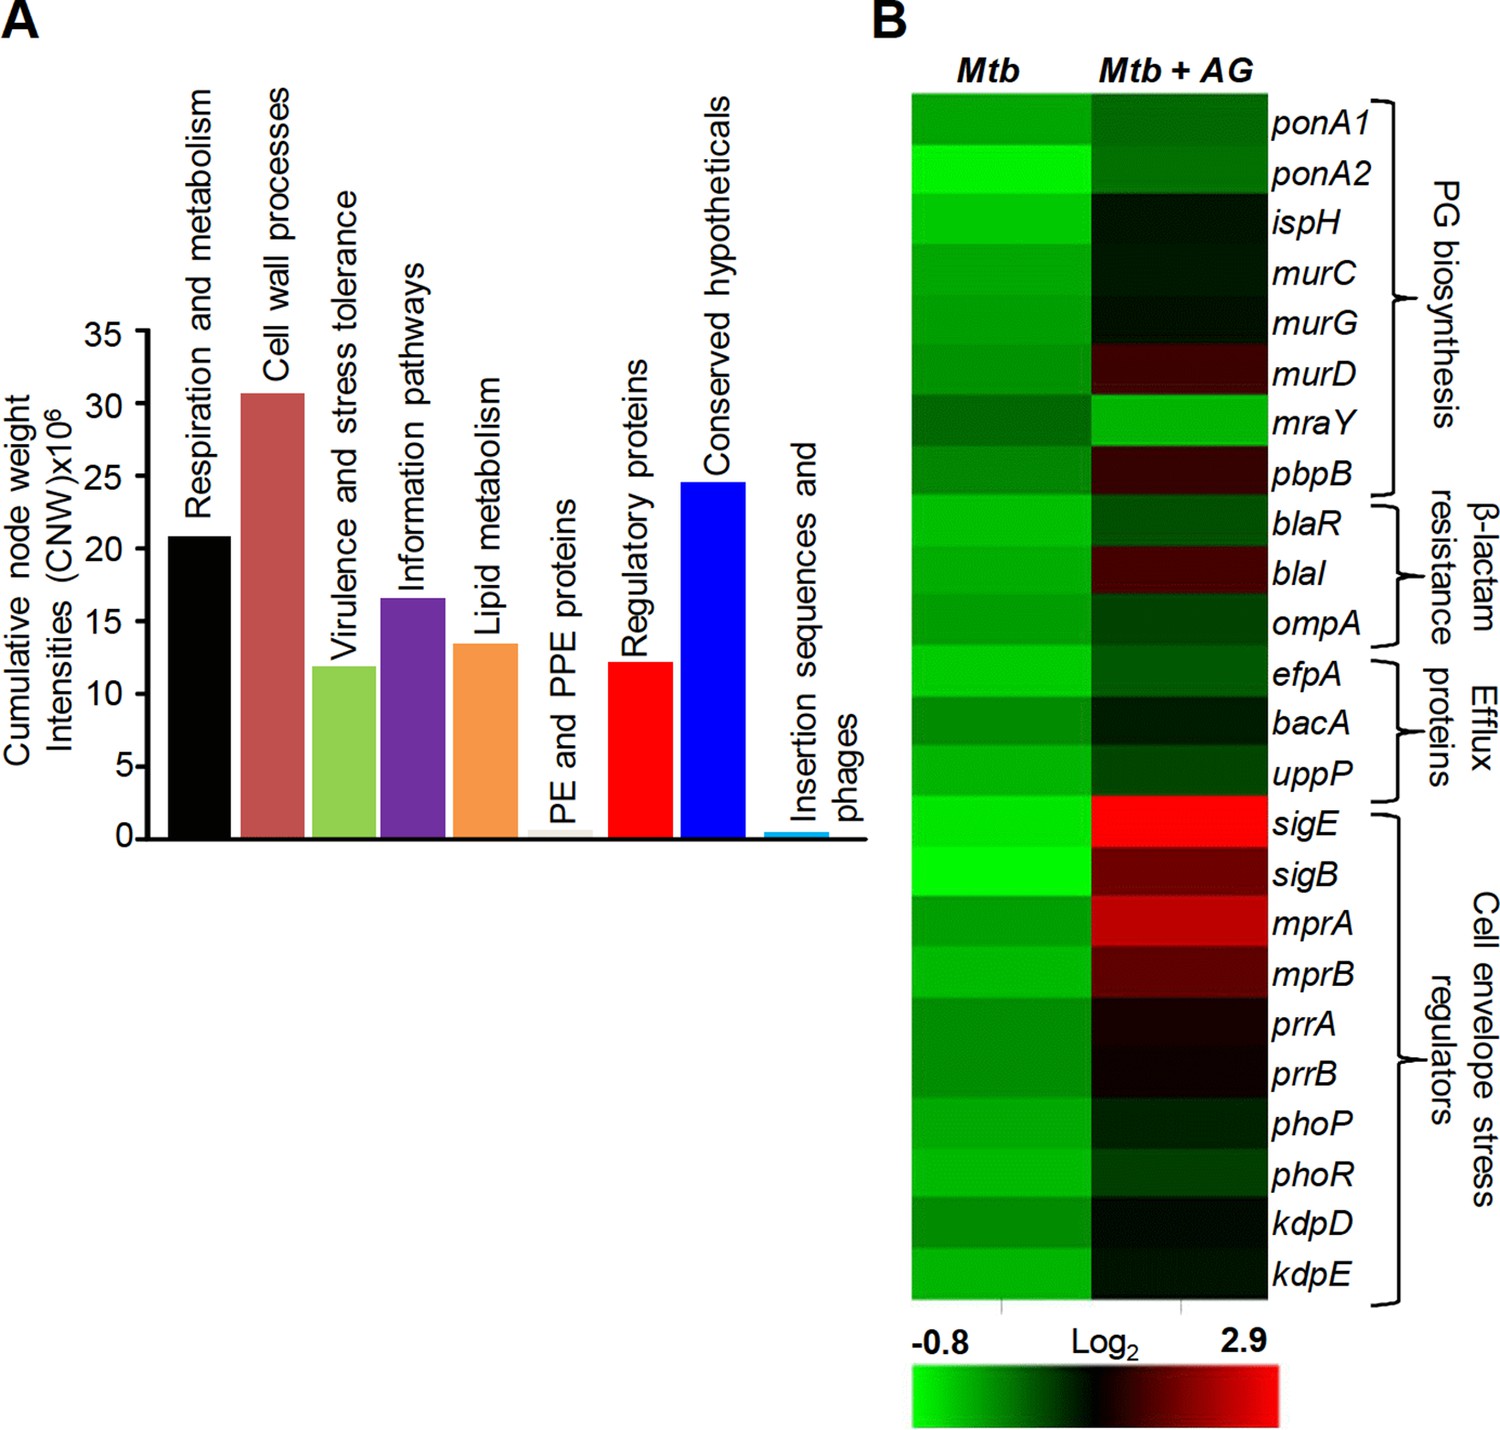
Network analysis identified pathways affected by AG exposure in Mtb.
Wt Mtb was grown to an OD600 of 0.4 and treated with 100 µg/ml of Amox and 8 µg/ml of Clav (10X MIC of AG) for 6 hr at 37°C. Total RNA was isolated and processed for microarray analysis as described in Materials and methods. (A) Cumulative node weight intensities (CNW) were derived by addition of the node weights of genes in a particular functional group upon exposure to AG. Node weight intensity of a gene was derived by multiplying the normalized intensity value with the corresponding fold-change (FC) value. Cumulative node weight intensities for different functional classes are available in Figure 1—source data 1. (B) Heat map showing expression of genes (log2fold-change, p≤0.05) that belong to cell wall processes for untreated and AG-treated Mtb from two biological samples.
-
Figure 1—source data 1
Cumulative node weight intensities for different functional classes as depicted in Figure 1A.
- https://doi.org/10.7554/eLife.25624.004
Figure 1—figure supplement 1
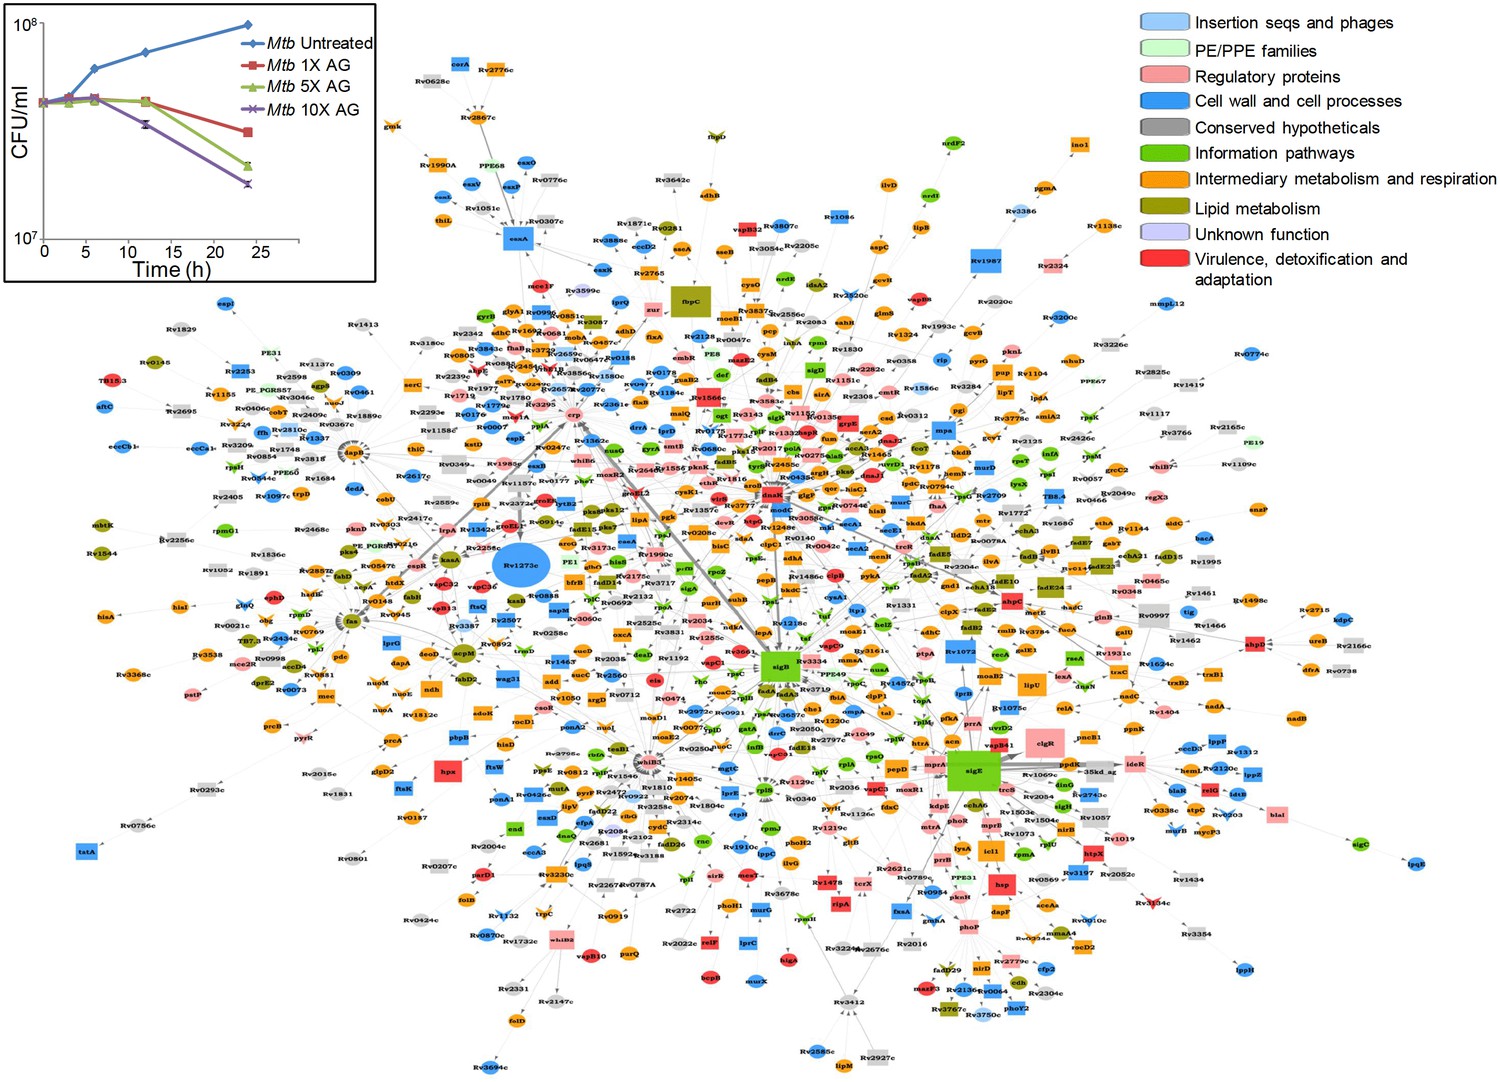
Global network of Mtb under AG stress.
The transcriptome of wt Mtb treated with AG was superimposed on Mtb protein:protein interaction (PPI) network to extract out top 1% network consisting of 806 nodes (genes). The size of the node indicates its node weight. The interactions/edges are depicted by grey arrows; the thickness of the arrows is the measure of the strength of interactions. Shapes of the nodes reflect direction of gene expression (square: induced; arrowhead: repressed; and circle: constitutive). The nodes are colored according to the TubercuList functional categories – red: virulence, detoxification, and adaptation, blue: cell wall and cell processes, green: information pathways, orange: intermediary metabolism and respiration, olive green: lipid metabolism, grey: conserved hypotheticals, pink: regulatory proteins, cyan: insertion sequences and phages, and light green: PE/PPE family. Inset shows the survival curve of Mtb treated with indicated concentrations of AG.
Figure 1—figure supplement 2

Sub-network of major hub nodes showing the top-most activities regulating response of Mtb upon AG treatment.
Sub-network showing close interactions between diverse regulators of cell envelope stress (e.g. sigB, sigE, mprA, and phoP) and redox stress (e.g. whiB2, whiB3, whiB6, ideR, dnaK) during AG treatment. The nodes are colored according to the functional modules they belong to and edge thickness reflects the strength of the interaction. Shapes of the nodes denote regulation of gene expression (square: induced; arrowhead: repressed; and circle: constitutive). It is noteworthy that most of the functionally diverse nodes (e.g. sigma factors, antioxidants, and redox-sensors) converge at a common stress-responsive chaperone, DnaK, making it a major hub node coordinating AG stress response in Mtb. Aligning with our findings, studies have suggested an important role for DnaK and ClpB chaperones in promoting recovery from oxidative stress (Fay and Glickman, 2014; Vaubourgeix et al., 2015). Functional modules based on annotations given in the TubercuList (http://tuberculist.epfl.ch/) include red: virulence, detoxification, and adaptation, blue: cell wall and cell processes, green: information pathways, orange: intermediary metabolism and respiration, olive green: lipid metabolism, grey: conserved hypotheticals, pink: regulatory proteins, cyan: insertion sequences and phages, and light green: PE/PPE family.
Figure 2 with 4 supplements
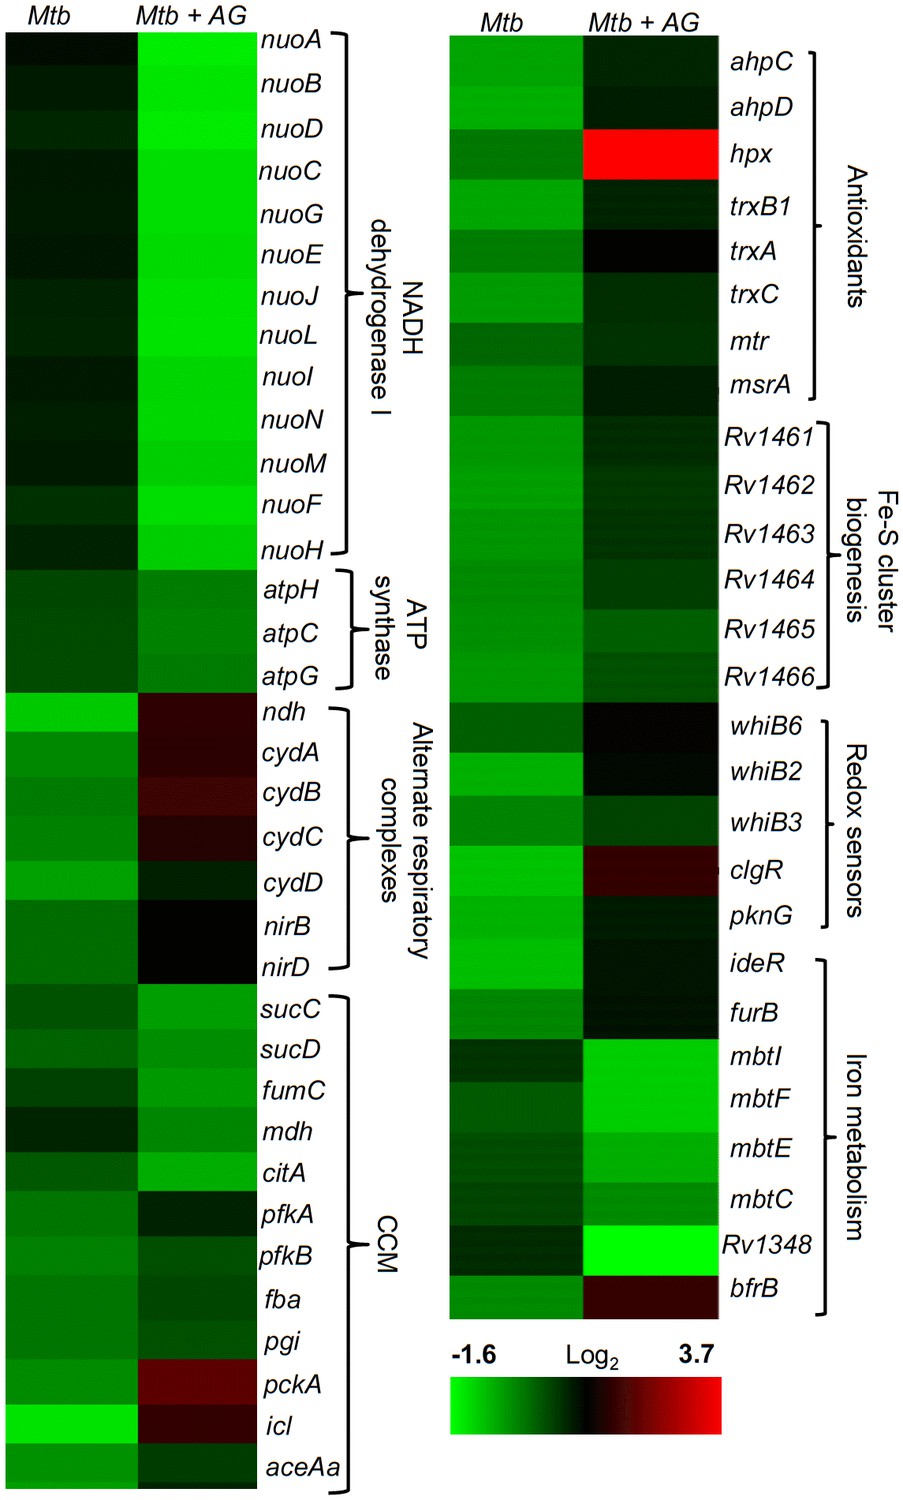
AG influences multiple pathways involved in central metabolism, respiration and redox balance in Mtb.
Heat maps depicting expression of genes (log2fold-change; p≤0.05) coordinating respiration, CCM, iron-metabolism and redox balance for untreated and 6 hr of AG-treated Mtb from two biological samples.
Figure 2—figure supplement 1
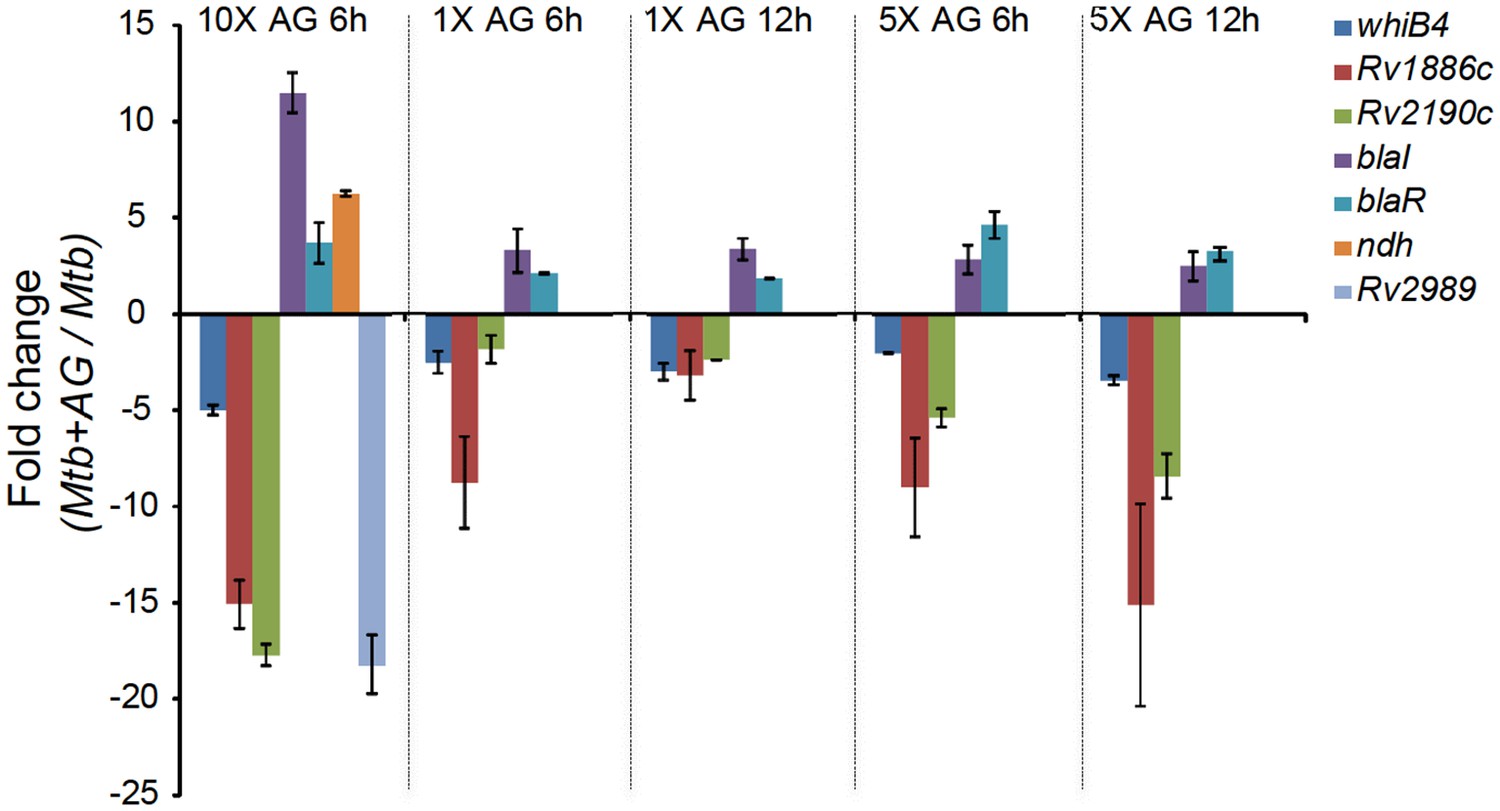
qRT-PCR analysis of Mtb exposed to different concentrations of AG for indicated time points.
Fold change for each transcript was measured with respect to untreated wt Mtb by normalizing expression with the 16srRNA transcript. Error bars represent standard deviations from mean. Data are representative of at least two independent experiments done in duplicate.
Figure 2—figure supplement 2
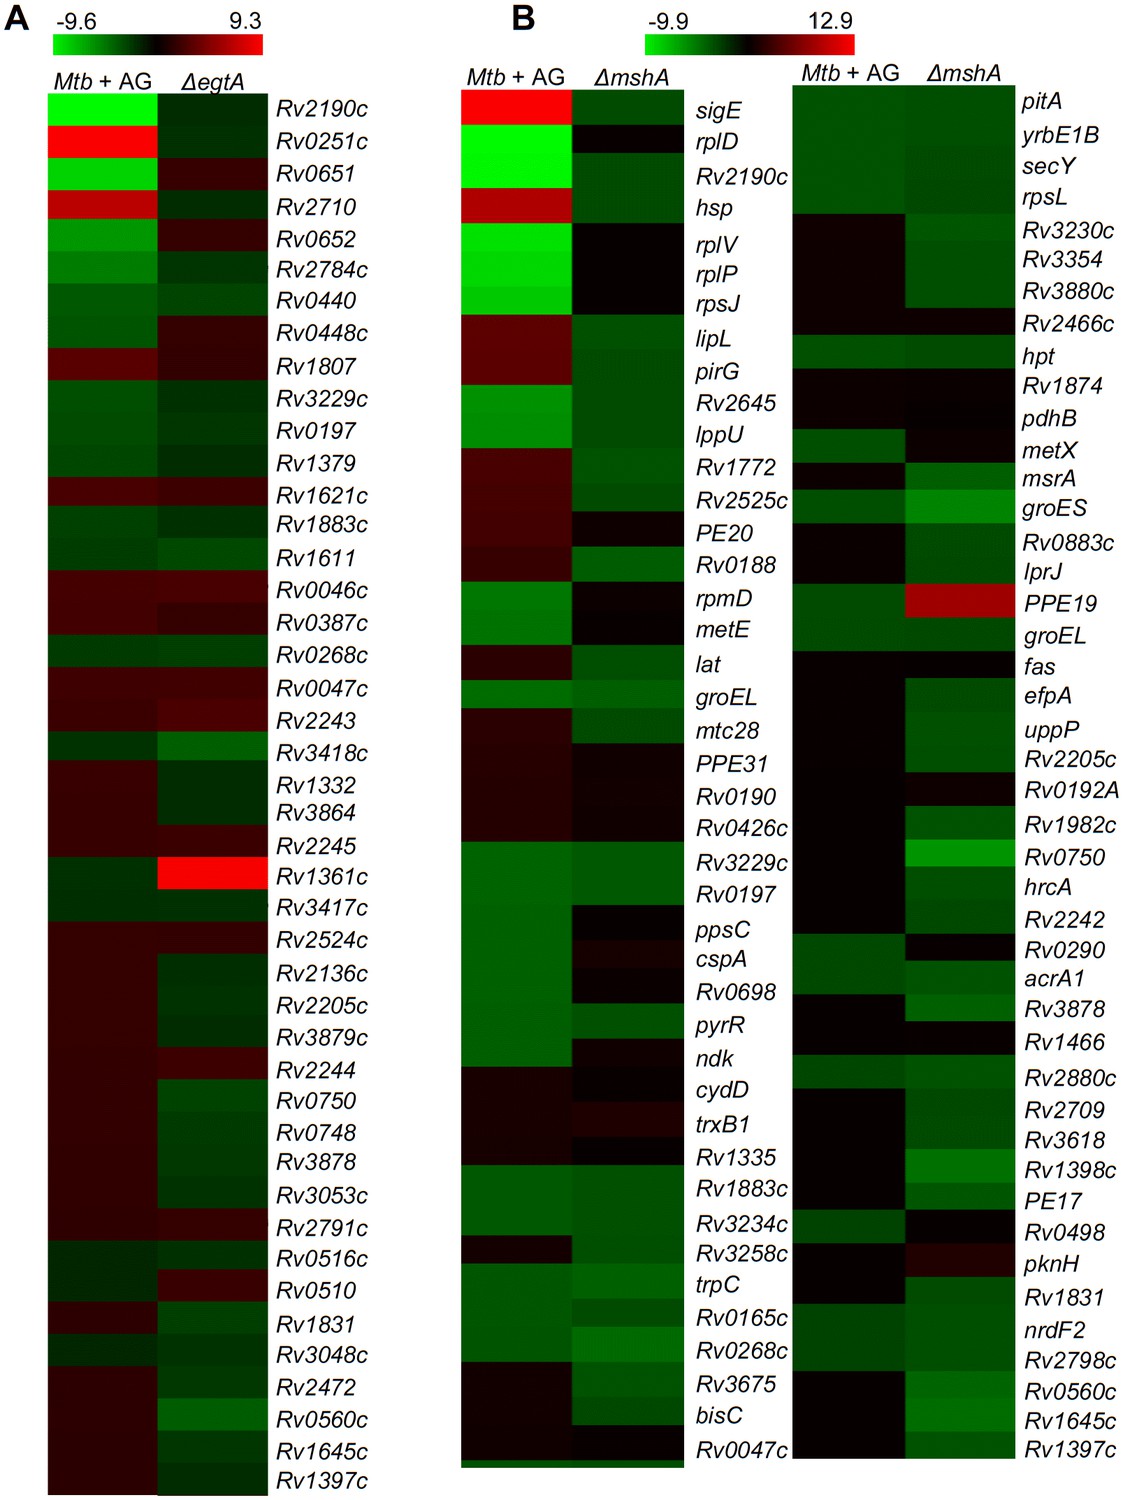
Comparative analysis of genes differentially regulated by AG treatment and upon depletion of mycothiol or ergothioneine buffers.
Heat maps (absolute fold change, p≤0.05) of genes differentially regulated in response to AG treatment and their status in (A) ergothioneine (ΔegtA) and (B) mycothiol (ΔmshA) mutant strains of Mtb. The expression data of MtbΔegtA and MtbΔmshA strains were obtained from a recently published study (Saini et al., 2016).
Figure 2—figure supplement 3
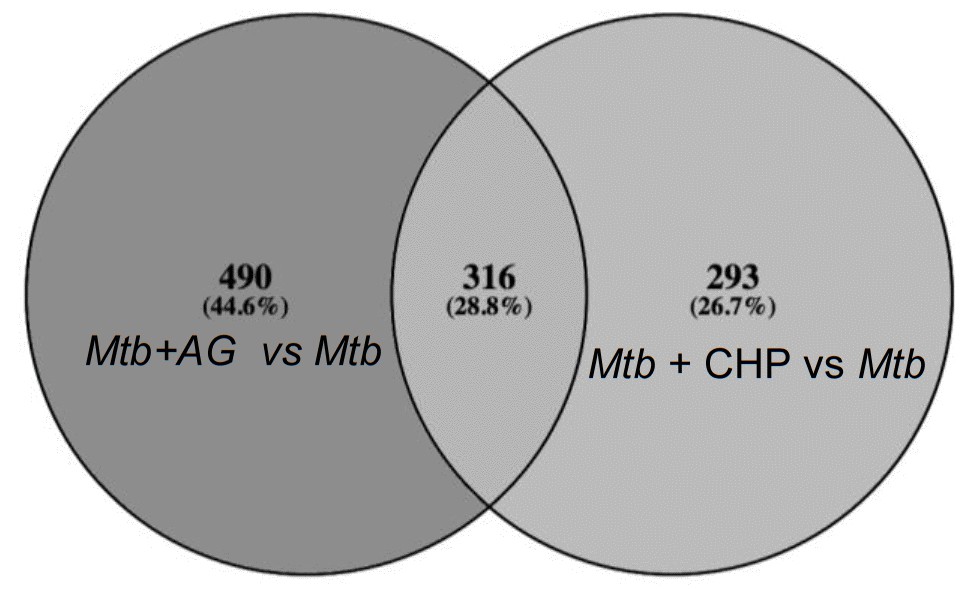
Overlapping regulation of genes in response to AG and oxidative stress.
AG and cumene hydroperoxide (CHP; oxidant) response network was prepared as described in Materials and methods. The vein diagram representing nodes present in top 1% network of Mtb under AG stress and oxidative stress.
Figure 2—figure supplement 4
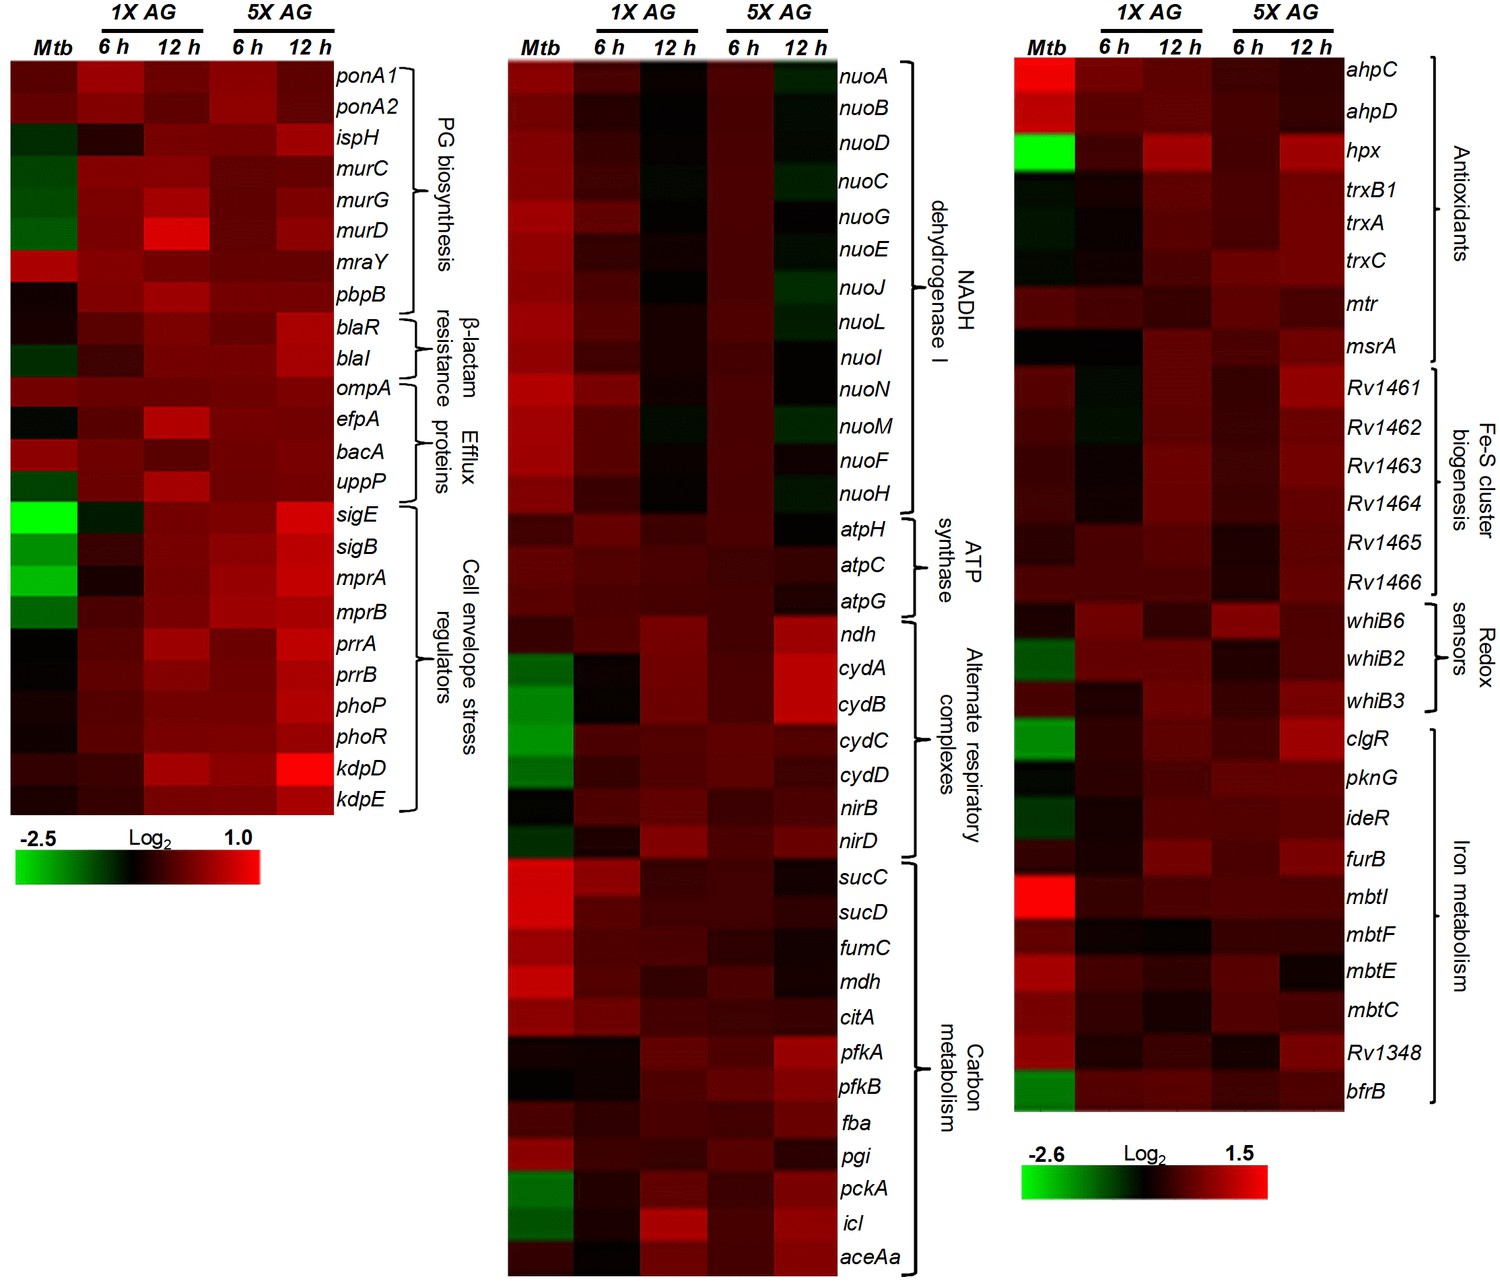
Heat maps depicting gene expression profile (log2fold-change) of Mtb untreated or treated with 1X and 5X MIC of AG for 6 and 12 hr from at least three biological samples.
https://doi.org/10.7554/eLife.25624.011
Figure 3
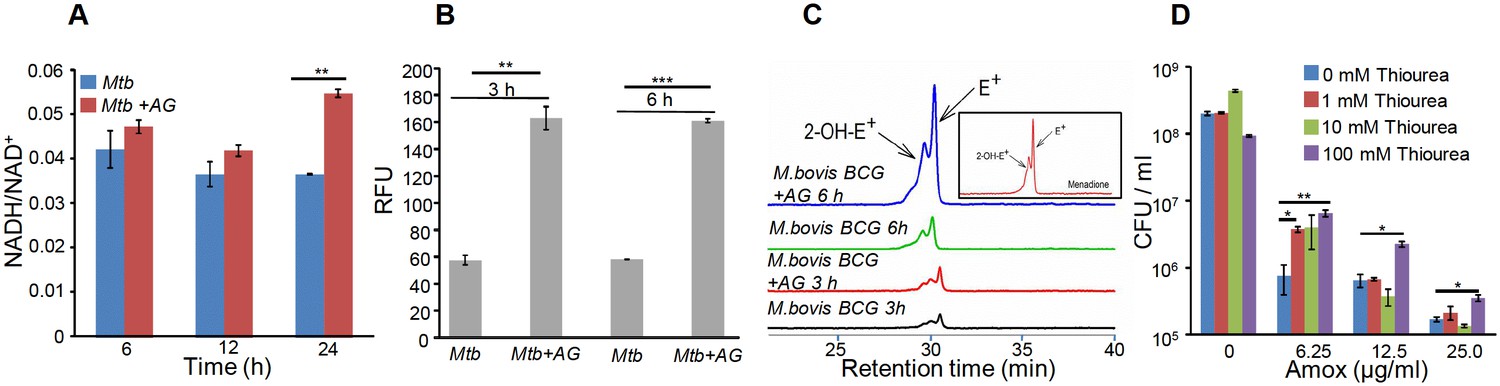
AG influences the internal redox physiology of Mtb.
Wt Mtb or M. bovis BCG was grown to OD600 of 0.4 and treated with 10X MIC of AG). At indicated time points, cells were analyzed for (A) NADH/NAD+ estimation, (B) ROS measurement using oxidant-sensitive fluorescent dye; 2',7'-dichlorofluorescein diacetate (DCFDA), and (C) Superoxide estimation using dihydroethidium (DHE) as described in Materials and methods. (D) Wt Mtb was grown as described earlier and exposed to specified concentrations of Amox in the presence of 8 µg/ml of Clav for 10 days in the presence or absence of thiourea and survival was measured using colony-forming unit (CFU) counts. Error bars represent standard deviations from the mean. *p≤0.05, *p≤0.01 and ***p≤0.001. Data are representative of at least two independent experiments done in duplicate.
Figure 4
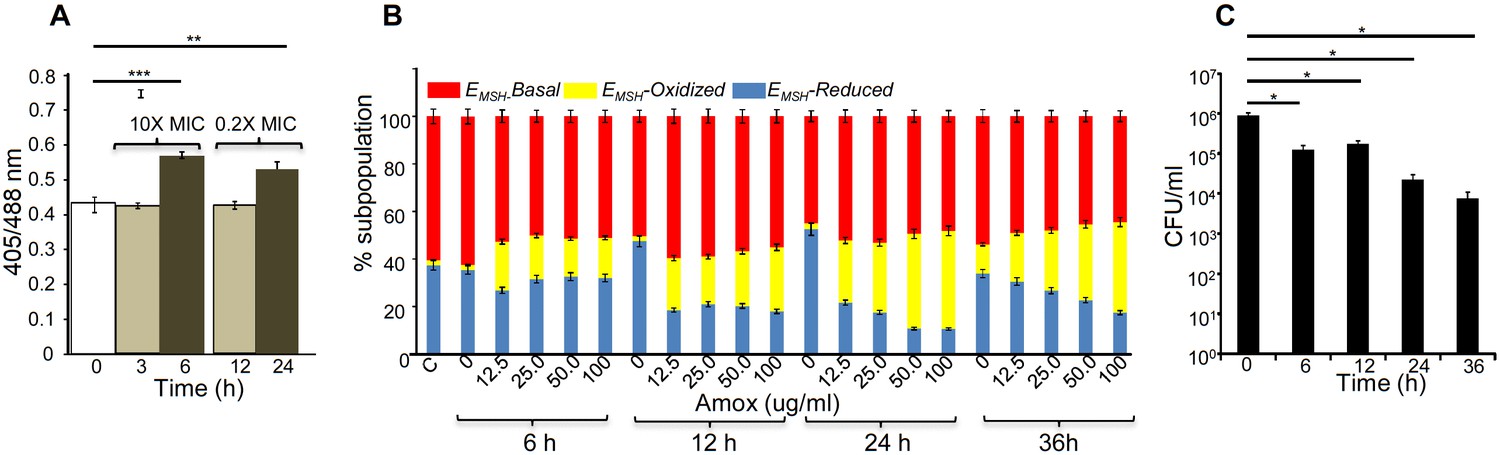
AG induces oxidative shift in EMSH of Mtb in vitro and during infection.
(A) Wt Mtb-expressing Mrx1-roGFP2 was treated with lethal (10X MIC) and sub-lethal (0.2 X MIC) concentrations of AG and ratiometric sensor response was measured at indicated time points by flow cytometry. (B) PMA-differentiated THP-1 cells were infected with Mtb expressing Mrx1-roGFP2 (moi: 10) and treated with indicated concentrations of Amox in the presence of 8 µg/ml of Clav as described in Materials and methods. At the indicated time points, ~30,000 infected macrophages were analyzed by flow cytometry to quantify changes in Mtb subpopulations displaying variable EMSH as described in Materials and methods. (C) In parallel experiments, infected macrophages were lysed and bacillary load was measured by plating for CFU. Error bars represent standard deviations from the mean. *p≤0.05, **p≤0.01 and ***p≤0.001. Data are representative of at least two independent experiments done in duplicate.
Figure 5
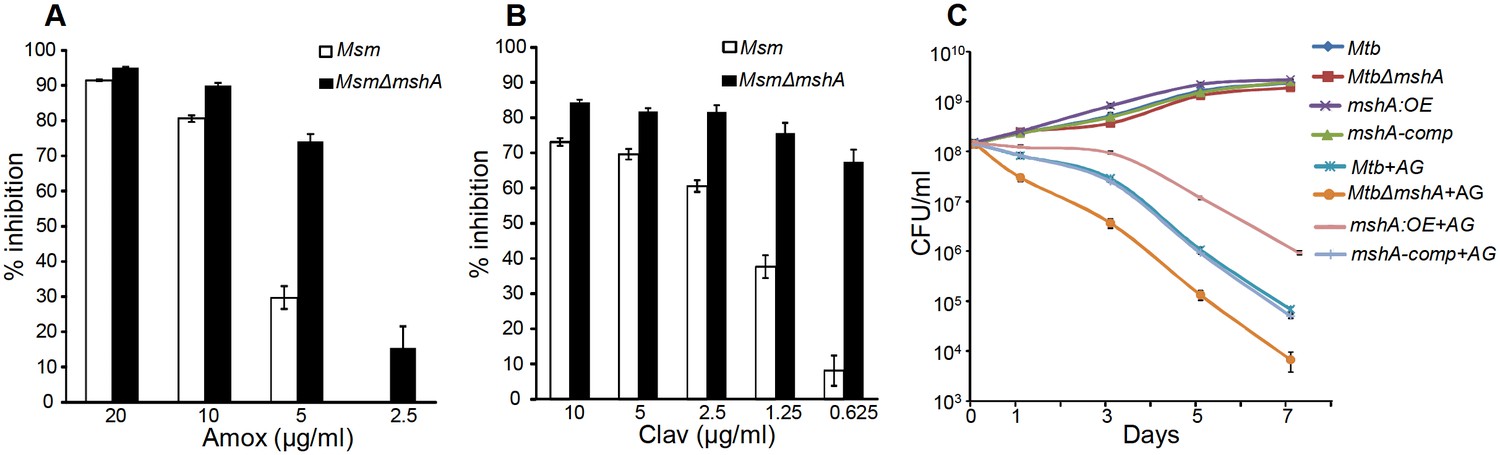
Mycothiol mediates tolerance to AG.
Wt Msm and MsmΔmshA strains were grown to OD600 of 0.4 and either treated with various concentrations of (A) Amox and Clav (8 µg/ml) or (b) Clav and Amox (10 µg/ml) and % inhibition in growth was measured by Alamar blue (AB) assay as described in Materials and methods. (C) Wt Mtb, MtbΔmshA, mshA-comp and mshA:OE strains were exposed to 10X MIC of AG and survival was monitored by measuring CFU over time. Error bars represent standard deviations from mean. Data are representative of at least two independent experiments done in duplicate.
Figure 6 with 3 supplements
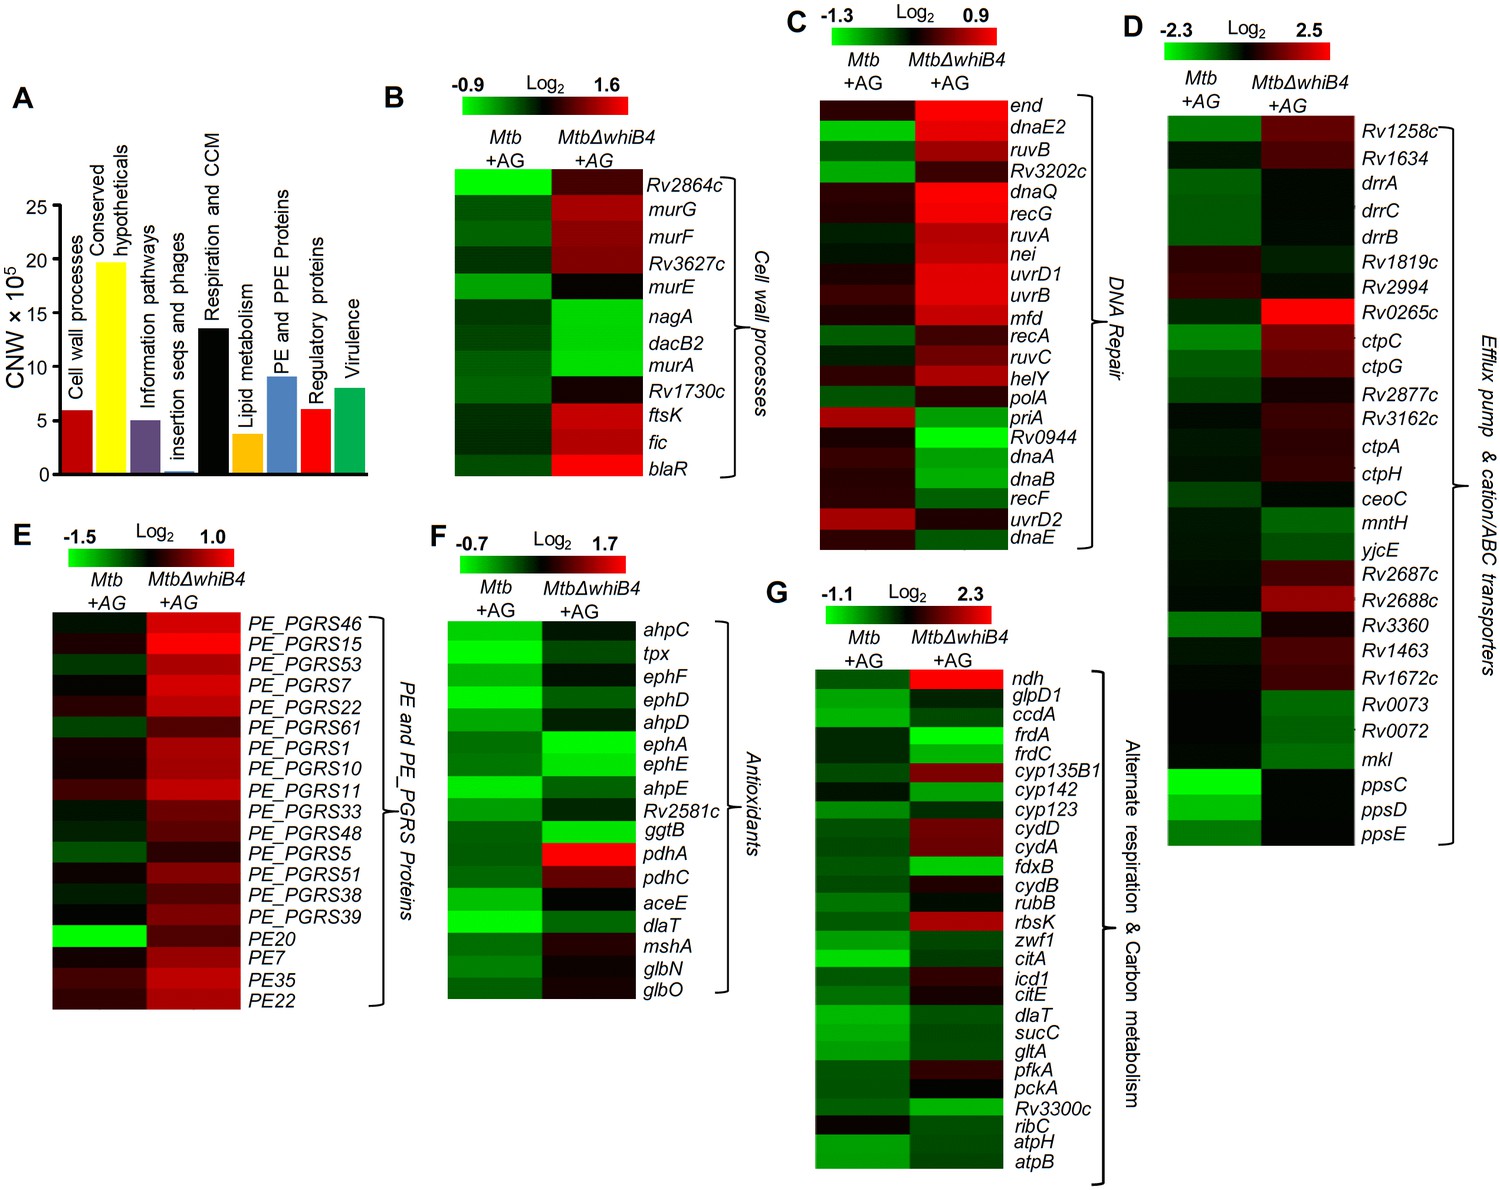
WhiB4 regulates response to AG in Mtb.
(A) Cumulative node weight intensities (CNW) of different functional classes regulated by WhiB4 upon AG treatment. (B–G) Heat maps depicting expression of genes (log2fold-change, p≤0.05) coordinating cell wall processes, alternate respiration and CCM, antioxidants, DNA repair, PE and PE_PGRS and drug efflux pumps in case of Mtb and MtbΔwhiB4 treated with AG for 6 hr as described in Materials and methods. Cumulative node weight intensities for different functional classes are available in Figure 6—source data 1.
-
Figure 6—source data 1
Cumulative node weight intensities for different functional classes as depicted in Figure 6A.
- https://doi.org/10.7554/eLife.25624.018
Figure 6—figure supplement 1
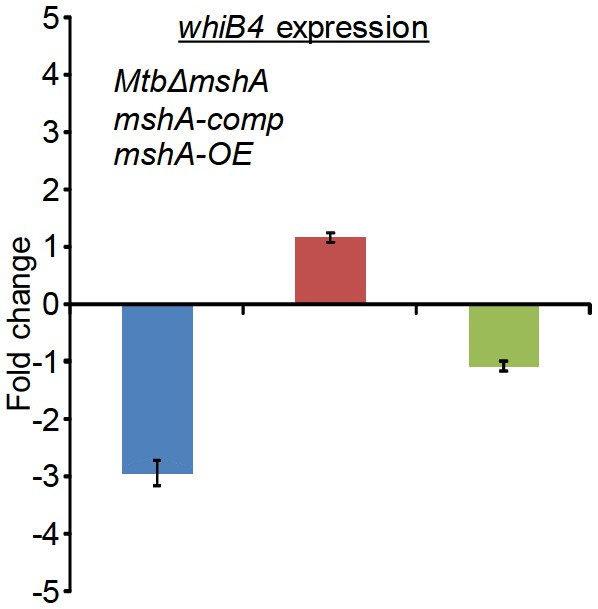
qRT-PCR analysis of whiB4 expression in MtbΔmshA, mshA-comp, and mshA-OE strains.
Fold change was measured with respect to untreated wt Mtb by normalizing expression with the 16srRNA transcript. Error bars represent standard deviations from mean. Data are representative of at least two independent experiments done in duplicate.
Figure 6—figure supplement 2
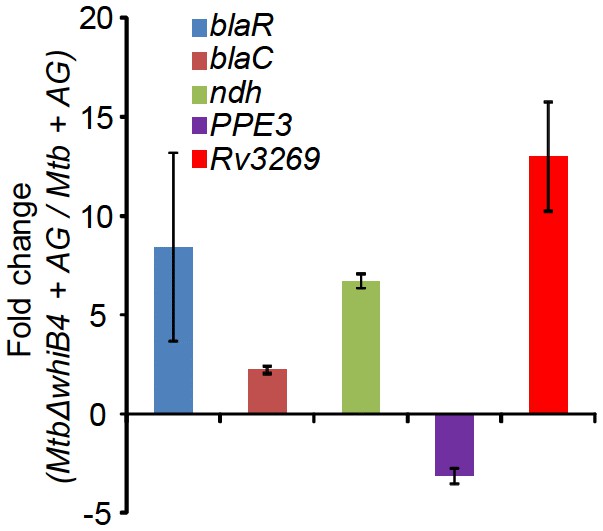
qRT-PCR analysis of MtbΔwhiB4 exposed to 10X AG for 6 hr.
Fold change for each transcript was measured with respect to wt Mtb exposed to 10X AG for 6 hr by normalizing expression with the 16srRNA transcript. Error bars represent standard deviations from mean. Data are representative of at least two independent experiments done in duplicate.
Figure 6—figure supplement 3
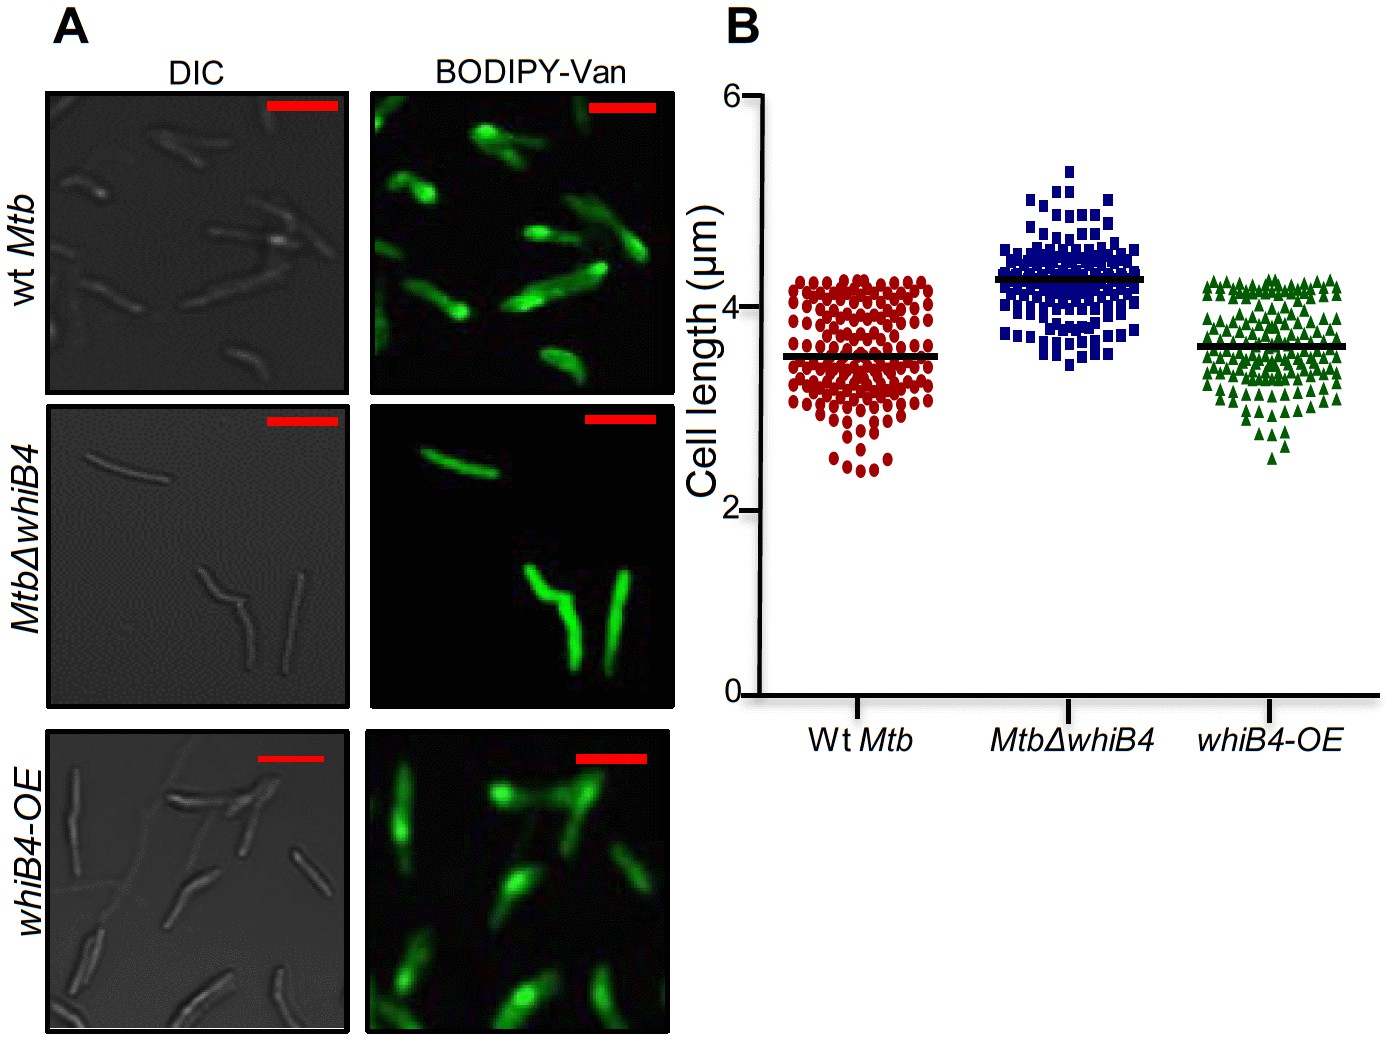
Vancomycin-BODIPY staining of different Mtb strains.
(A) Wt Mtb, MtbΔwhiB4, and whiB4-OE were grown to OD600 nm of 0.6 and incubated with 1 µg/ml of Vancomycin-BODIPY for 16 hr and visualized by confocal microscopy (63X). The scale of images is 3 µm (B) Scatter plot showing the cell measurement for above mentioned strains. Each dot represents one cell (n > 150).
Figure 7
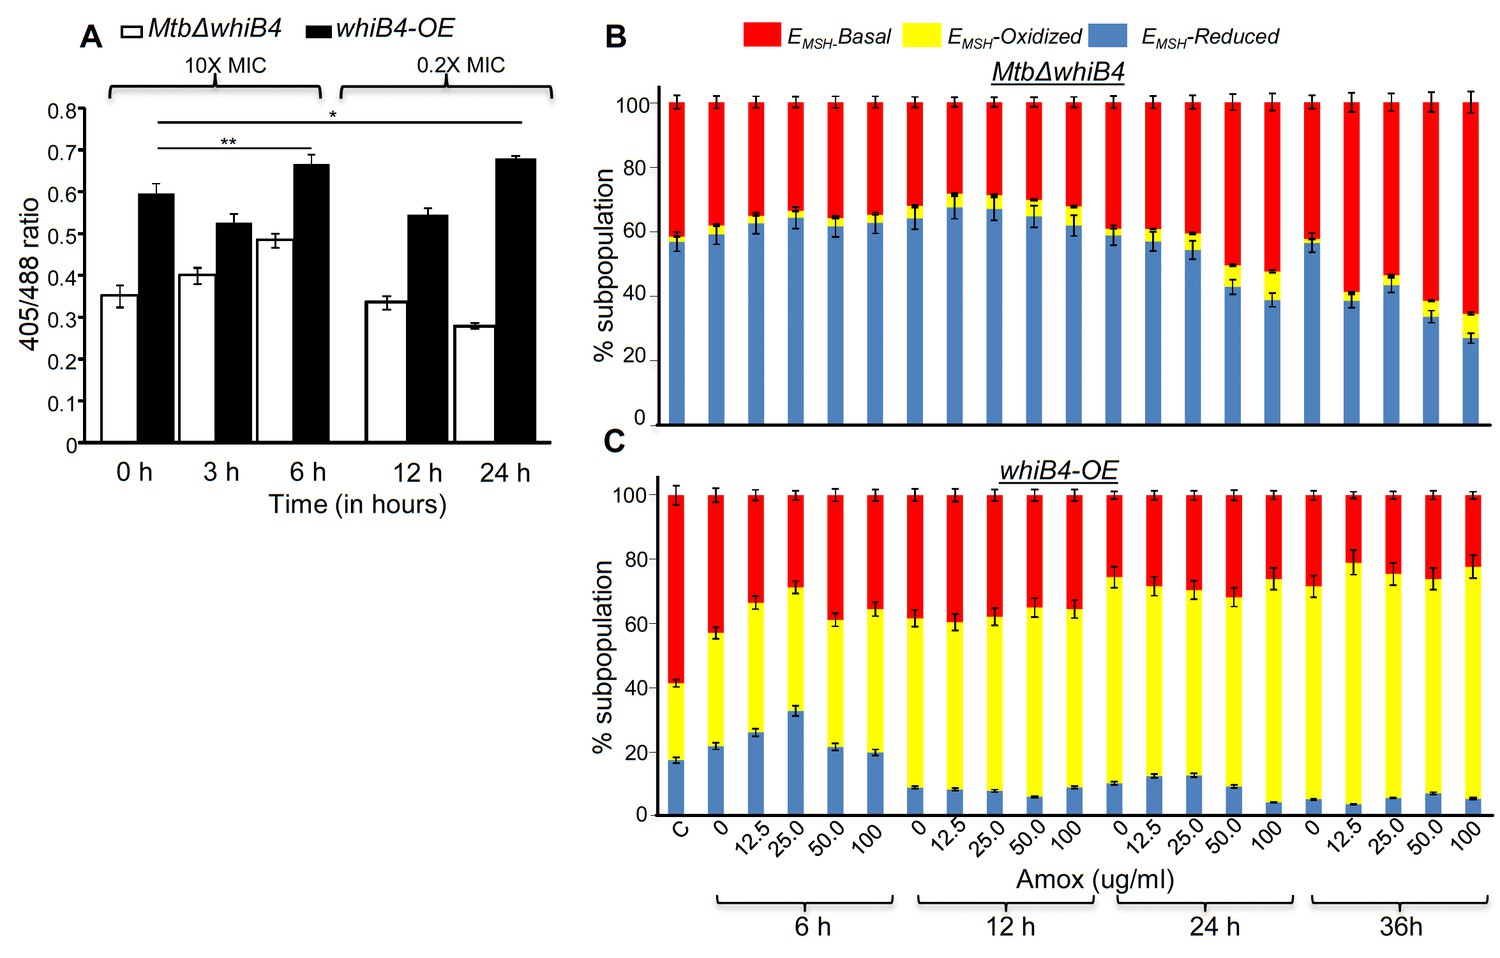
WhiB4 regulates AG-induced oxidative shift in EMSH of Mtb both in vitro and during infection.
(A) MtbΔwhiB4 and whiB4-OE expressing Mrx1-roGFP2 were treated with lethal (10X MIC) and sub-lethal (0.2 X MIC) concentrations of AG and ratiometric response was measured by flow cytometry at indicated time points. (B) PMA differentiated THP-1 cells were infected with MtbΔwhiB4 and whiB4-OE expressing Mrx1-roGFP2 (MOI:10) and treated with indicated concentrations of Amox in the presence of Clav (8 µg/ml) as described in Materials and methods. At indicated time points, ~30,000 infected macrophages were analyzed by flow cytometry to quantify changes in Mtb subpopulations displaying variable EMSH as described in Materials and methods. *p≤0.05, **p≤0.01 and ***p≤0.001.
Figure 8 with 1 supplement
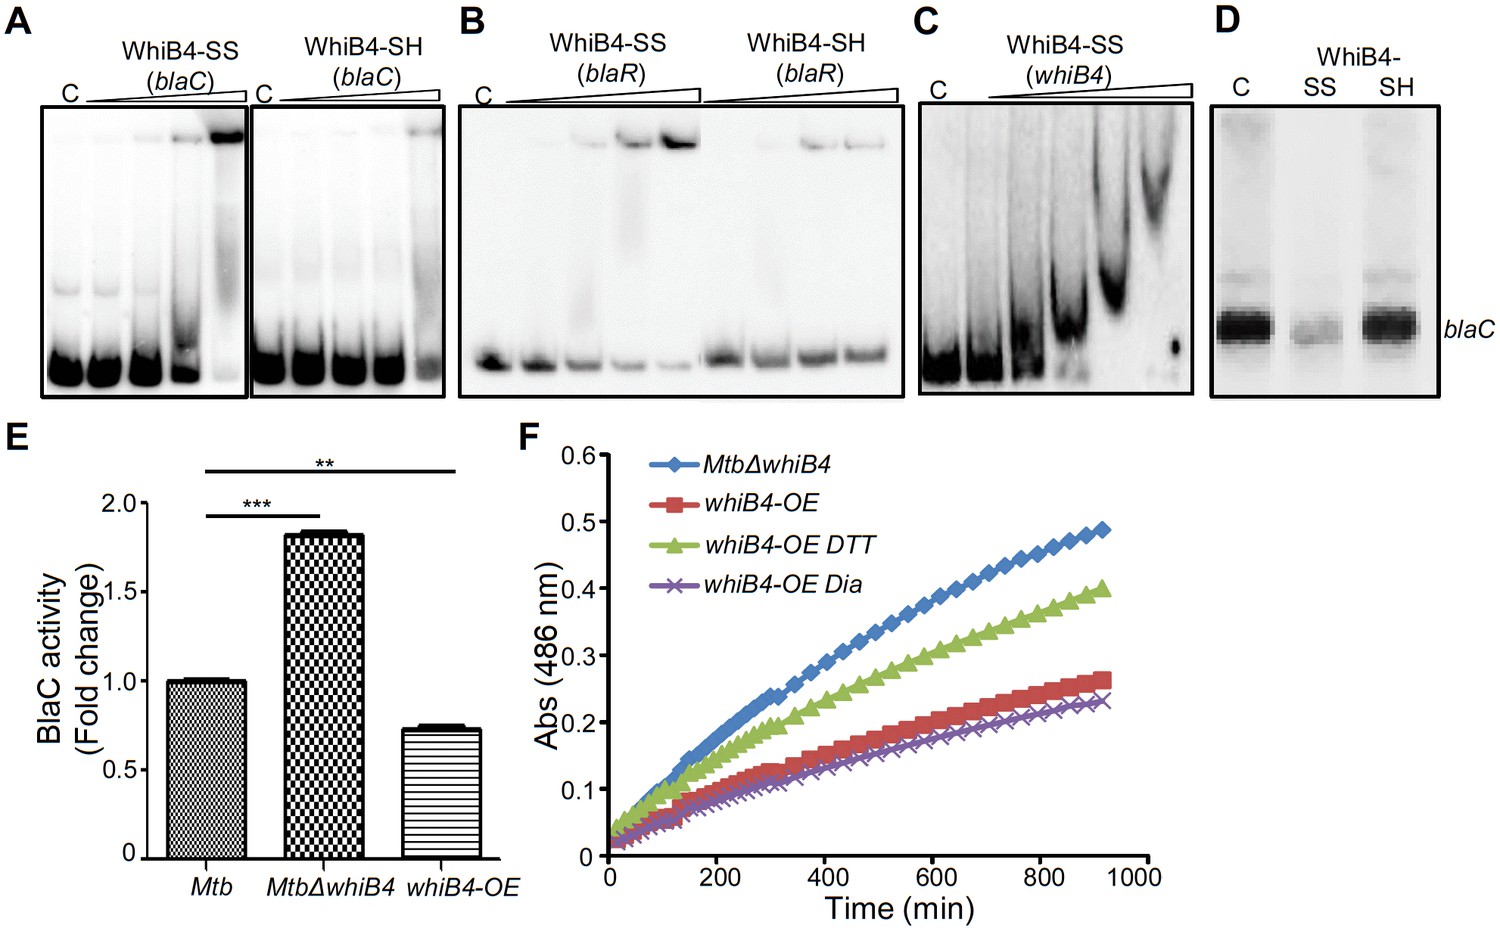
Regulation of β-lactamase by WhiB4 in a redox-dependent manner.
Oxidized (WhiB4-SS) and reduced (WhiB4-SH) forms of apo-WhiB4 were prepared. The concentrations of apo-WhiB4 used for EMSAs were 0.5, 1, 2, and 4 μM. EMSA reactions were performed with 0.5 nM 32P-labelled blaC (A), blaR (B) and whiB4 (C) promoter DNA fragments. C: DNA binding in the absence of WhiB4 in each panel. (D) Effect of WhiB4 on in vitro transcription. Single-round transcription assays show that RNAP-σA efficiently directs transcription from the blaC promoter. 100 nM of blaC promoter DNA fragment was pre-incubated with either 1 μM WhiB4-SS or WhiB4-SH and subjected to transcription by RNAP-σA as described in Materials and methods. C: blaC transcript in the absence of WhiB4. (E) 100 μg of cell-free lysates derived from exponentially grown (OD600 of 0.6) wt Mtb, MtbΔwhiB4 and whiB4-OE were used to hydrolyze nitrocefin. β-lactamase activity was measured by monitoring absorbance of hydrolyzed nitrocefin at 486 nm as described in Materials and methods. The fold change ratios clearly indicate a significantly higher or lower β-lactamase activity in MtbΔwhiB4 or whiB4-OE, respectively, as compared to wt Mtb. p-Values are shown for each comparison. (F) whiB4-OE strain was pre-treated with 5 mM of DTT or Diamide and β-lactamase activity in cell-free lysates was compared to MtbΔwhiB4 over time. *p≤0.05, **p≤0.01 and ***p≤0.001. Data are representative of at least two independent experiments done in duplicate.
Figure 8—figure supplement 1
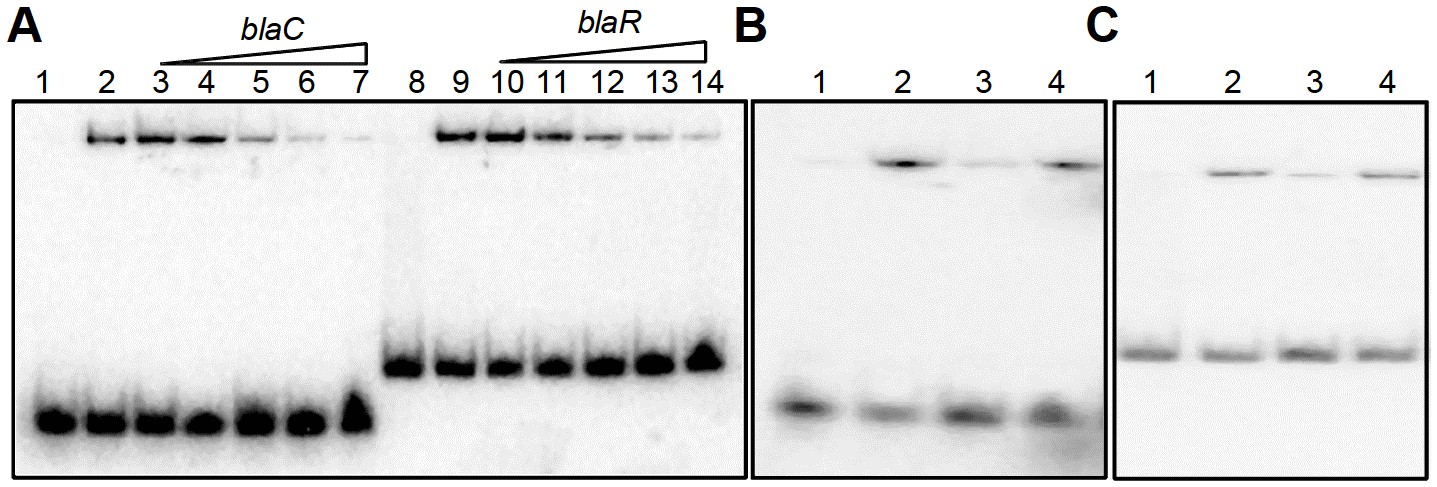
EMSA cold competition assay.
(A) 0.5 μM of oxidized form of apo-WhiB4 (WhiB4-SS) was incubated with 0.5 nM 32P-labeled blaC and blaR promoter DNA fragments. Lanes 1 and 8: free probe; Lanes 2 and 9: WhiB4:blaC/blaR-promoter DNA complex. WhiB4 DNA binding was competed out using 10- (lanes 3 and 10), 25- (lanes 4 and 11), 50- (lanes 5 and 12), 100- (lanes 6 and 13), and 200- (lanes 7 and 14) fold molar excess of unlabeled competitor DNA, blaC and blaR. (B) Competition assay of 0.5 μM of WhiB4-SS binding using specific (blaC) and non-specific (Rv0986) promoter DNA fragments. Lane 1: 32P-labeled blaC DNA (free probe), Lane 2: WhiB4-SS:blaC-promoter DNA complex. WhiB4 DNA binding was competed using 100-fold molar excess of unlabeled blaC DNA (lane 3; specific) or Rv0986 DNA (lane 4; non-specific). (C) Competition assay of 0.5 μM of WhiB4-SS binding using specific (blaR) and non-specific (Rv0986) promoter DNA fragments. Lane 1: 32P-labeled blaR DNA (free probe), Lane 2: WhiB4-SS:blaR-promoter DNA complex. Competing unlabeled DNA fragments were either blaR DNA (lane 3; specific) or Rv0986 DNA (lane 4; non-specific), both used in 100-fold molar excess concentrations.
Figure 9
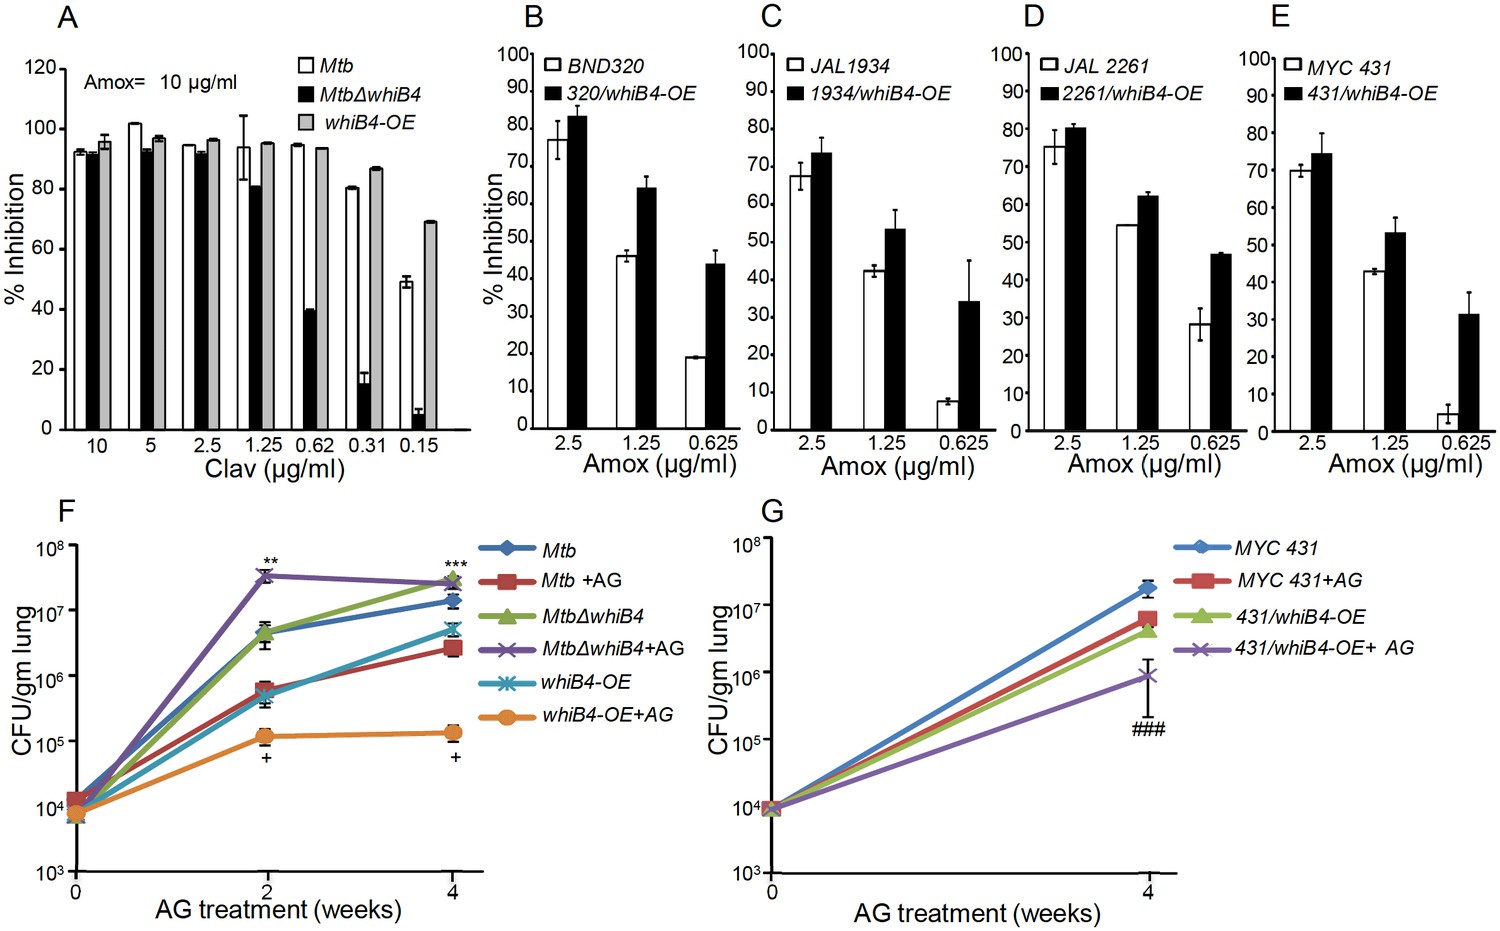
WhiB4 regulates AG tolerance in drug-sensitive and -resistant strains of Mtb.
(A) Wt Mtb, MtbΔwhiB4 and whiB4-OE were incubated with Amox (10 µg/ml) and different concentrations of Clav and % inhibition of growth was measured by AB assay as described in Materials and methods. To determine if WhiB4 modulates the sensitivity of AG in drug-resistant strains, WhiB4 was over-expressed in clinical strains (B) BND 320 (C) JAL 1934, (D) JAL 2261, and (E) MYC 431. Cells were incubated with Clav (8 µg/ml) and different concentrations of Amox. The percent growth inhibition was measured by AB assay as described in Materials and methods. WhiB4 modulates susceptibility to AG during acute infection in mice (F–G). Inbred BALB/c mice (n = 3) were given various strains of Mtb in the form of an aerosol and orally administered with Amox (200 mg/kg of body weight) and Clav (50 mg/kg of body weight) that is AG twice a day starting from day 3 post-infection. Bacterial burden in the lungs was assessed by checking the survival of Mtb strains using CFU analysis. Statistical significance for the pulmonic bacterial load was obtained as follows: by comparing the CFU obtained from AG-treated Wt Mtb and MtbΔwhiB4 strains: **p≤0.01 and ***p≤0.001, by comparing CFU obtained from AG-treated Wt Mtb and whiB4-OE strains: + p≤0.05, by comparing CFU obtained from AG-treated MYC 431 and MYC 431/whiB4-OE strains: ### p≤0.001.
Figure 10
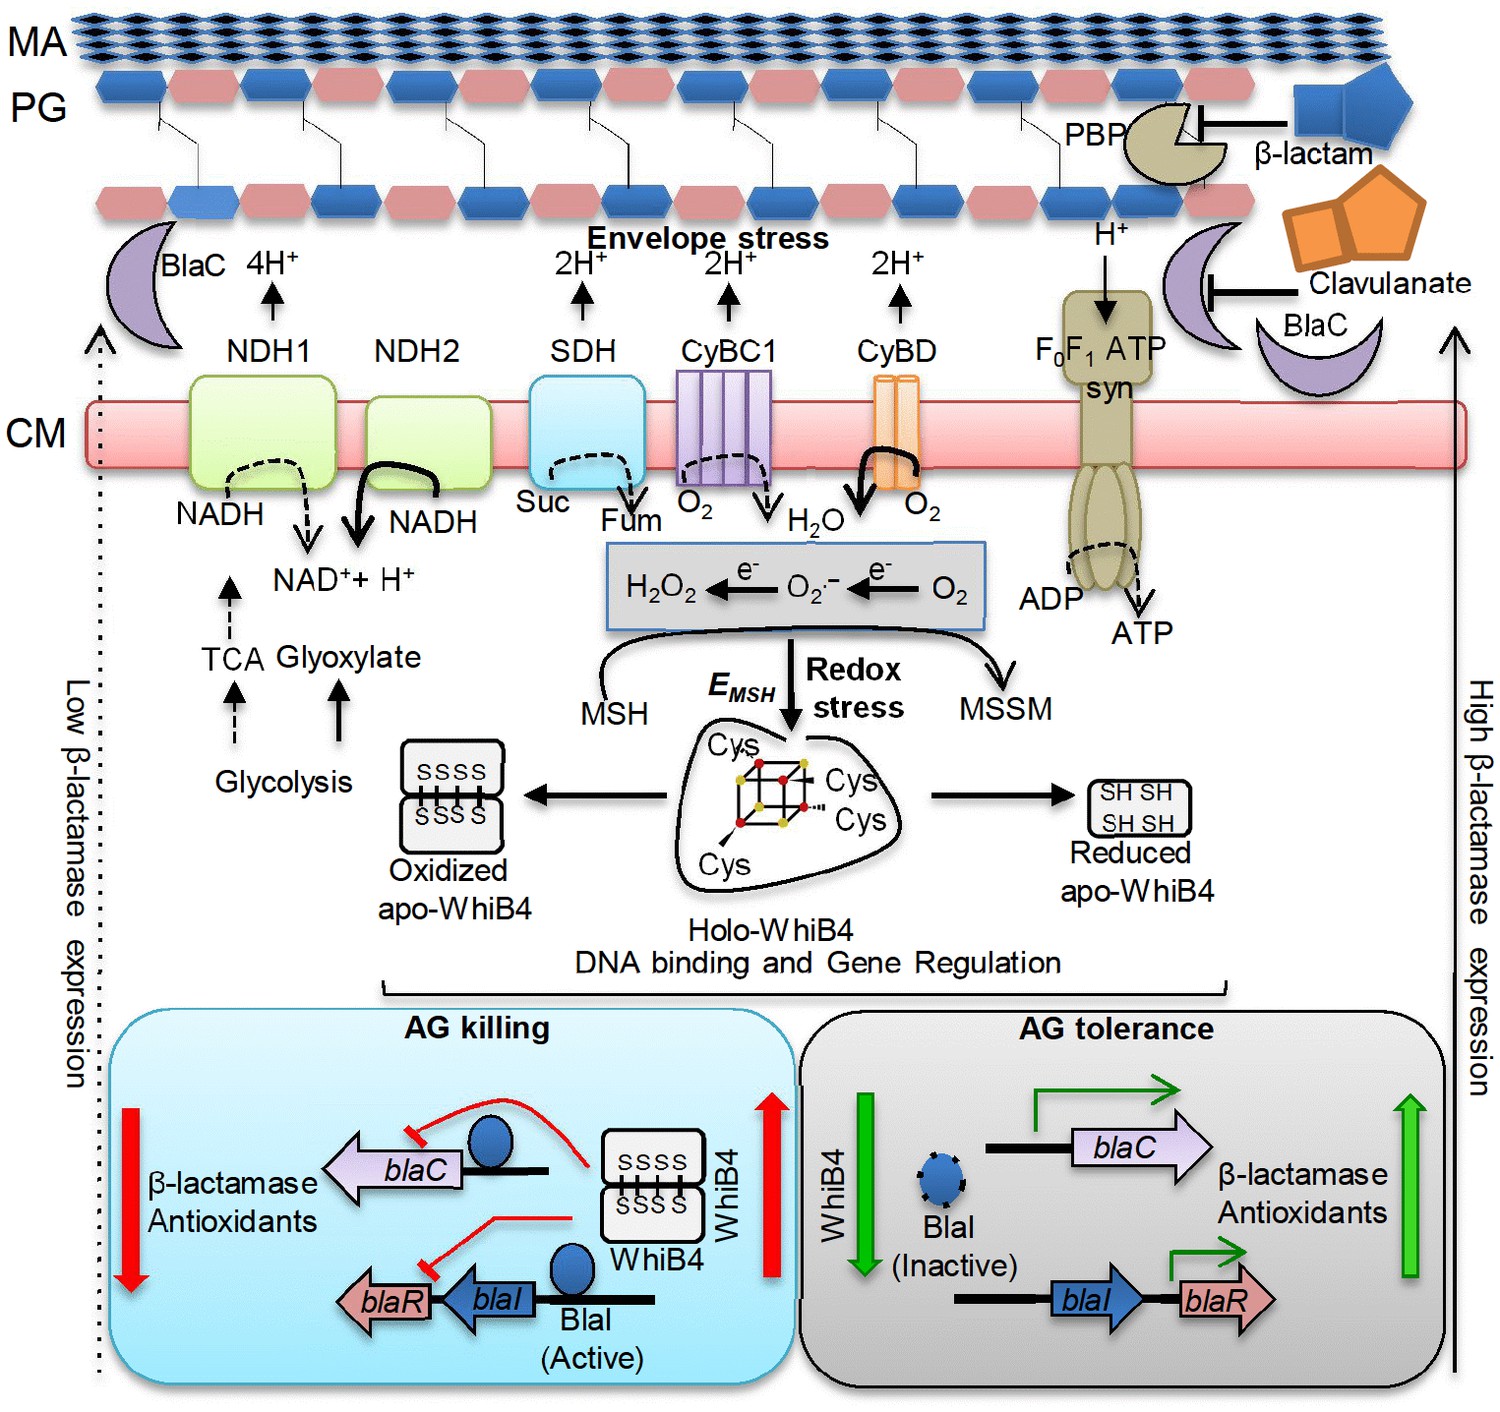
Model showing redox basis of AG tolerance in Mtb.
Cell wall damage caused by AG can perturb the membrane integrity thereby affecting respiratory chain, redox balance, and ATP generation. All of this results in metabolic instability and AG-induced killing. To tolerate AG, Mtb redirects respiration from the energetically efficient route (e.g. NDH1, CyBC1) to the energetically poor one (e.g. NDH2, CyBD), and carbon metabolism from the TCA cycle to glyoxylate, glycolysis and gluconeogenesis. Rerouting of electron flux through CyBD can trigger generation of ROS (O2−• and H2O2) by univalent reduction of O2 via metal-, flavin-, and quinone-containing respiratory enzymes. The intramycobacterial redox buffer, MSH, detoxifies ROS to protect Mtb from AG. The oxidative shift in EMSH of Mtb in response to AG serves as a cue to calibrate the expression of β-lactamase, PG enzymes, carbon metabolism, antioxidants, and alternate respiration via WhiB4. Under native conditions, O2-induced loss of WhiB4 Fe-S cluster generates oxidized apo-WhiB4, which binds and represses the expression of blaR and blaC. Reduction of oxidized apo-WhiB4 disulfides reversed this effect. Down-regulation of whiB4 in response to AG derepresses blaR and stimulates expression of blaC directly and/or indirectly via BlaR-mediated cleavage of the blaC repressor (i.e. BlaI) to induce AG tolerance. Accumulation of oxidized apo-WhiB4 upon overexpression led to hyper-repression of BlaC activity and oxidative shift in EMSH to potentiate mycobactericidal activity of AG. Since genes associated with alternate-respiration (e.g. CyBD) and energy metabolism (e.g. ATP synthase) are also regulated by BlaI, our results suggest cross-talk between WhiB4 and BlaI pathways resulting in AG tolerance of Mtb. Altogether, WhiB4 couples the changes in the redox physiology of Mtb triggered by AG to the expression of genes involved in antibiotic tolerance and redox homeostasis. MA: Mycolic acid, CM: Cytoplasmic membrane, NDH1: NADH-dehydrogenase I (nuo operon), NDH2: NADH dehydrogenase 2 (ndh), CyBD: Cytochrome BD oxidase, CyBC1: Cytochrome BC1-aa3 oxidase, F0F1 ATP syn: ATP Synthase, PBP: Penicillin-binding proteins and SDH: Succinate Dehydrogenase. Bold or dashed arrows indicate increased or decreased electron flow through respiratory complexes, respectively, based on gene expression data.
Tables
Table 1
Minimum inhibitory concentrations (MICs) of Amox and AG for different Mycobacterium smegmatis strains. Source data file containing the images for MIC calculation is available in Table 1–source data 1.
| μg/mL | ||
|---|---|---|
| Strains | Amox | Amox+clav (AG) |
| wt Msm | 160 | 20 + 8 |
| MsmΔmtr | 80 | 10 + 8 |
| MsmΔmshD | 160 | 20 + 8 |
| MsmΔkatG | 80 | 10 + 8 |
| MsmΔsigH | 20 | 10 + 8 |
-
Table 1—source data 1
Images of Alamar blue assay plates for calculation of minimum inhibitory concentration (MIC).
- https://doi.org/10.7554/eLife.25624.016
Table 2
Minimum inhibitory concentrations (MICs) of cell wall targeting drugs for different Mycobacterium tuberculosis strains.
Source data file for the calculation of MIC values is available in Table 2–source data 1.
| Drugs | µg/ml | ||
|---|---|---|---|
| Mtb | MtbΔwhib4B4 | whiB4-OE | |
| Amoxicillin | 80 | >160 | 40 |
| Ampicillin | 500 | 4000 | 250 |
| Cloxacillin | 400 | 800 | 200 |
| Carbenicillin | 1024 | 4096 | 512 |
| Meropenem | 5 | 20 | 2.5 |
| Penicillin | 200 | 800 | 100 |
| Lysozyme | 50 | 200 | 25 |
| Vancomycin | 10 | 80 | 2.5 |
| Isoniazid | 0.0625 | 0.0625 | 0.03125 |
| Rifampicin | 0.0625 | 0.0625 | 0.0625 |
-
Table 2—source data 1
Percentage growth inhibition values for Mtb, MtbΔwhiB4 and whiB4-OE in presence of different drugs for calculation of minimum inhibitory concentration (MIC).
- https://doi.org/10.7554/eLife.25624.027
Additional files
-
Supplementary file 1
Network analysis of Mtb in response to AG and CHP.
(A) Raw microarray data sheet depicting log intensity values and absolute fold change values for Wt Mtb-treated 10XAG vs Wt Mtb-Untreated. (B) List of nodes present in top 1% network of for Wt Mtb-treated 10XAG vs Wt Mtb-Untreated. (C) List of Nodes common in top 1% network of Wt Mtb-treated 10XAG and Wt Mtb CHP treatments. (D) Raw microarray data sheet depicting log intensity values and absolute fold change values for Wt Mtb treated 1XAG and 5XAG vs Wt Mtb Untreated.
- https://doi.org/10.7554/eLife.25624.029
-
Supplementary file 2
Global expression analysis of Mtb and MtbΔwhiB4 in response to AG.
(A) Raw microarray data sheet depicting log intensity values and absolute fold change values for MtbΔwhiB4-treated 10XAG vs Wt Mtb-treated 10XAG. (B) Raw microarray data sheet depicting log intensity values and absolute fold change values for MtbΔwhiB4 treated 10XAG vs MtbΔwhiB4 Untreated.
- https://doi.org/10.7554/eLife.25624.030
-
Supplementary file 3
Description of strains, plasmids, chemicals , primers and details of top 1% network in response to AG.
(A) List of bacterial strains and plasmids used in this study. (B) List of chemicals used in this study. (C) Network statistics for top 1% network. (D) Sequences of primers used in this study.
- https://doi.org/10.7554/eLife.25624.031
Download links
A two-part list of links to download the article, or parts of the article, in various formats.
Downloads (link to download the article as PDF)
Open citations (links to open the citations from this article in various online reference manager services)
Cite this article (links to download the citations from this article in formats compatible with various reference manager tools)
Efficacy of β-lactam/β-lactamase inhibitor combination is linked to WhiB4-mediated changes in redox physiology of Mycobacterium tuberculosis
eLife 6:e25624.
https://doi.org/10.7554/eLife.25624


