Dynamic representation of partially occluded objects in primate prefrontal and visual cortex
- University of Washington, United States
Figures
Figure 1

Behavioral task and monkey performance.
(A) On each trial, monkeys viewed two sequentially presented stimuli: an unoccluded shape (reference) and either an unoccluded or a partially occluded shape (test). Monkeys reported whether the two shapes were the same or different by making a saccade to the right or left choice target, respectively. (B) Monkey performance on example individual sessions (top) and average performance across all sessions (bottom). Performance was near 100% for unoccluded stimuli (100% visible area) and declined gradually for higher occlusion levels (i.e. <100% visible area).
Figure 2
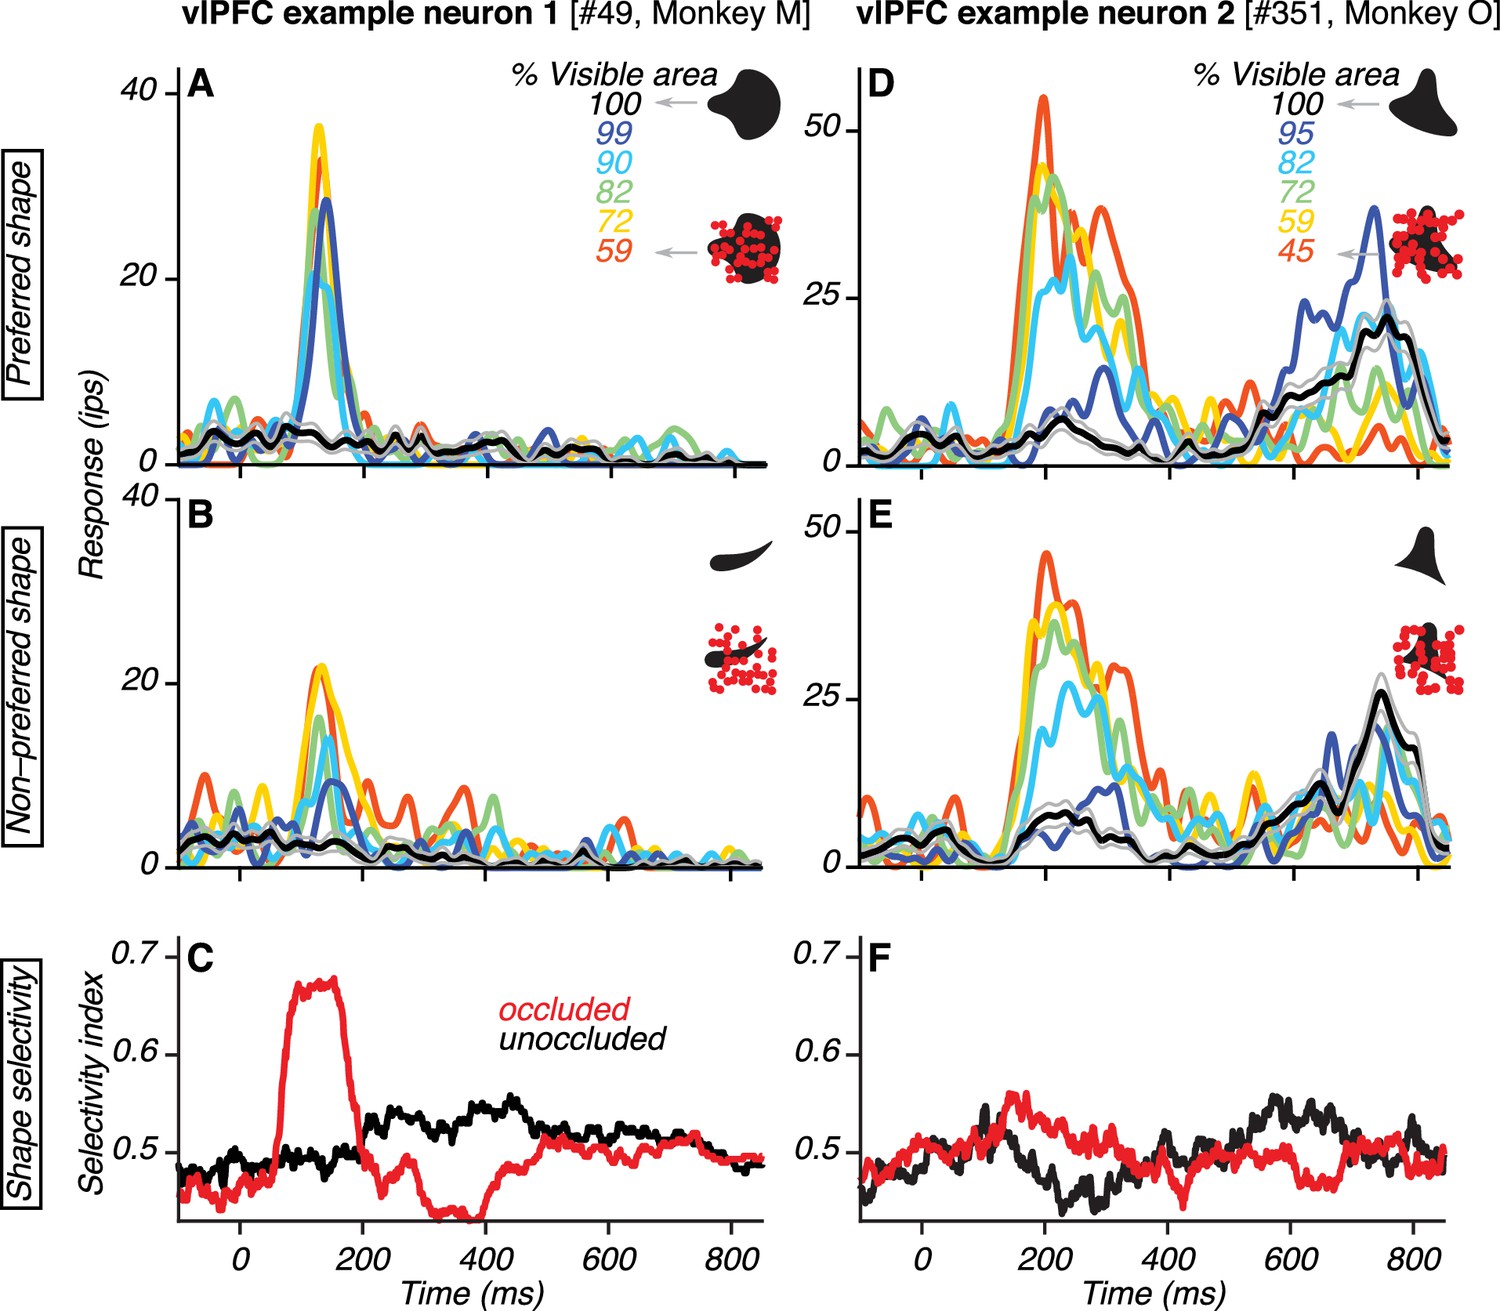
Responses of example vlPFC neurons.
(A–B) Responses of one neuron to its preferred and non-preferred shape (compare A and B) at different occlusion levels (colors). Responses to unoccluded stimuli were weak (black; gray lines show standard error of the mean) whereas responses to occluded stimuli were stronger (colors). For PSTHs, σ was 10 ms. (C) Neuronal shape selectivity across time for unoccluded (black) and occluded (red) stimuli quantified by a sliding window ROC curve analysis (see Materials and methods). (D–E) Responses of a second vlPFC neuron, showing comparable responses to both shapes (compare D and E). Responses to unoccluded stimuli were weak whereas responses to occluded stimuli were stronger. The test stimulus was extinguished at 600 ms and the elevation in response beyond this time point was due to the saccadic response. (F) Neuronal shape selectivity across time (same format as in C).
Figure 3 with 2 supplements
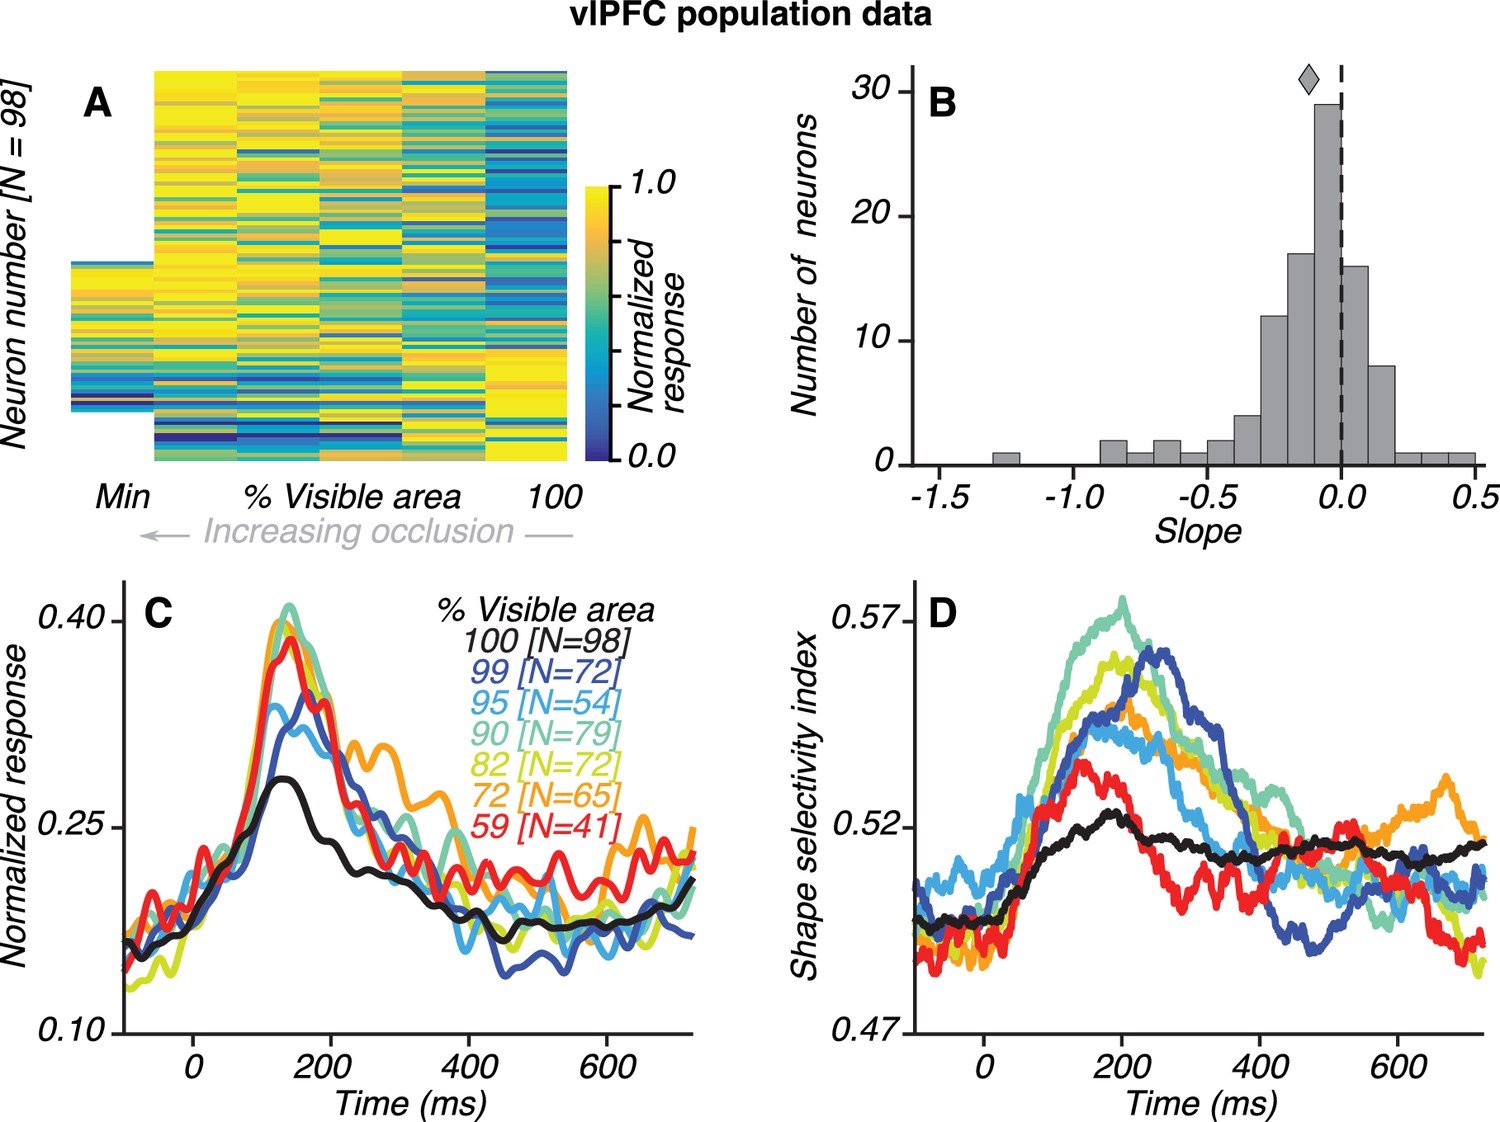
Population results for vlPFC neurons.
(A) Normalized average responses (80–230 ms) to preferred shapes across occlusion level (columns). Along the abscissa, % visible area is rank ordered; so each column could represent a different occlusion level for each neuron. From left to right, occlusion level decreases and % visible area increases, with 100% representing the unoccluded case. Neurons were tested with five or six occlusion levels (62/98 and 36/98 neurons, respectively), including the unoccluded case. Responses were normalized by the maximum response for each neuron, separately. For most neurons, responses were weak (blue) for unoccluded stimuli and stronger (yellow) for higher occlusion levels. Responses to the unoccluded stimuli were strongest for only 17/98 neurons. (B) Distribution of linear regression slopes fit to the responses in A. Most neurons (71/98) had negative slopes, indicating stronger responses to occluded stimuli; the median slope was −0.12. (C) Normalized average responses derived from the responses of occlusion-sensitive neurons to the preferred shapes at different occlusion levels. vlPFC neurons were studied at 5–6 oc clusion levels chosen from a set of 9 possible values (100, 99, 95, 90, 82, 72, 59, 45% and 27% visible area). The occlusion levels presented to each neuron was different, and not all neurons were studied at all the occlusion levels listed. The numbers of neurons contributing to each curve are listed in brackets (see Materials and methods). Data for the highest occlusion levels tested (45% and 27% visible area) are not shown because too few neurons contributed to the population average and the curves for these occlusion levels were highly variable. Across the population, responses were weakest to unoccluded stimuli (black) and stronger for intermediate and high occlusion levels. (D) Average shape selectivity as a function of occlusion level. Shape selectivity was weak for unoccluded stimuli (black) at all time points whereas it gradually increased for occluded shapes (colors), reaching maximal values between ~100–300 ms. Also see Figure 3—figure supplement 1 and Figure 3—figure supplement 2.
Figure 3—figure supplement 1
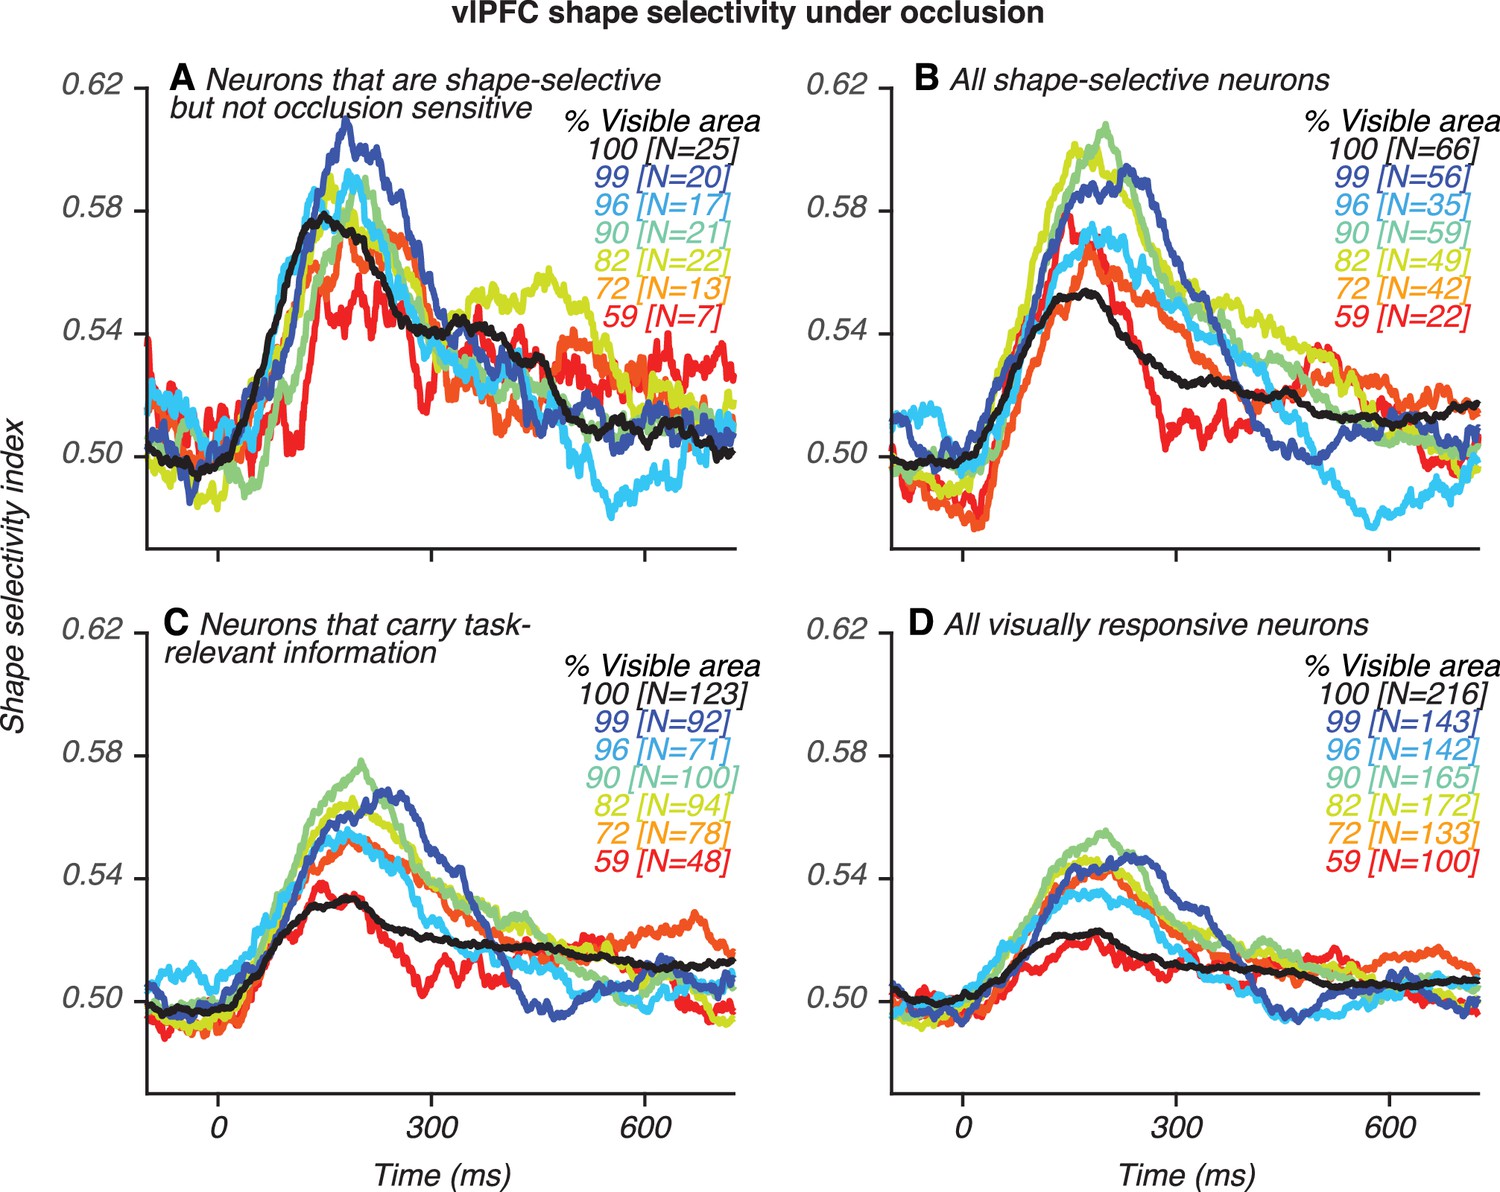
Shape selectivity as a function of occlusion for different groups of vlPFC neurons.
(A) Neurons that are shape-selective but not occlusion-sensitive. (B) All shape-selective neurons. (C) All shape-selective and occlusion-sensitive neurons, that is neurons that carry any task-relevant information. (D) All visually-responsive neurons. Shape and occlusion sensitivity was assessed with a 2-way ANOVA (see Materials and methods for details). Shape selectivity was stronger for shape-selective than occlusion-sensitive neurons (compare panels A–B with Figure 3D) but across all neuronal groups, including neurons not significantly influenced by occlusion (in A), shape selectivity was strongest at intermediate occlusion levels.
Figure 3—figure supplement 2

Shape selectivity for two groups of vlPFC neurons.
(A) Neurons that responded preferentially to stimuli at lower occlusion levels (higher % visible area). (B) Neurons that responded preferentially to stimuli at higher occlusion levels (lower % visible area). Neurons with a positive slope in Figure 3B contributed to the data in (A) whereas neurons with a negative slope contributed to the data in (B). Two patterns are evident. First, even among vlPFC neurons that responded more strongly to unoccluded stimuli, shape selectivity was not stronger for unoccluded stimuli compared to occluded stimuli. Second, vlPFC neurons that preferred higher occlusion levels also carried more information about the occluded shape.
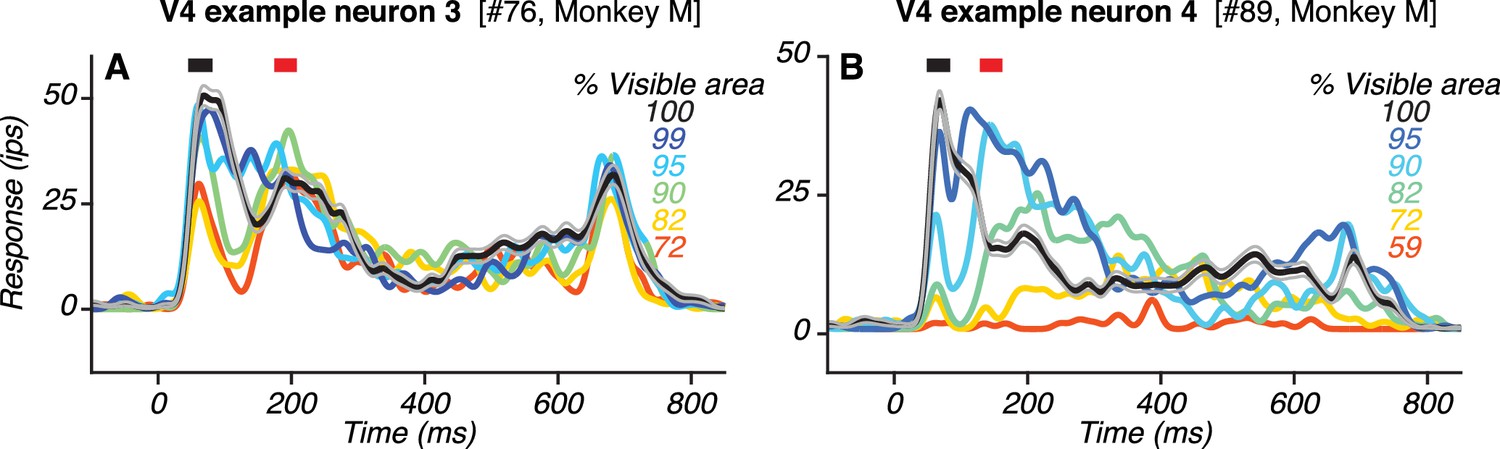
Figure 4
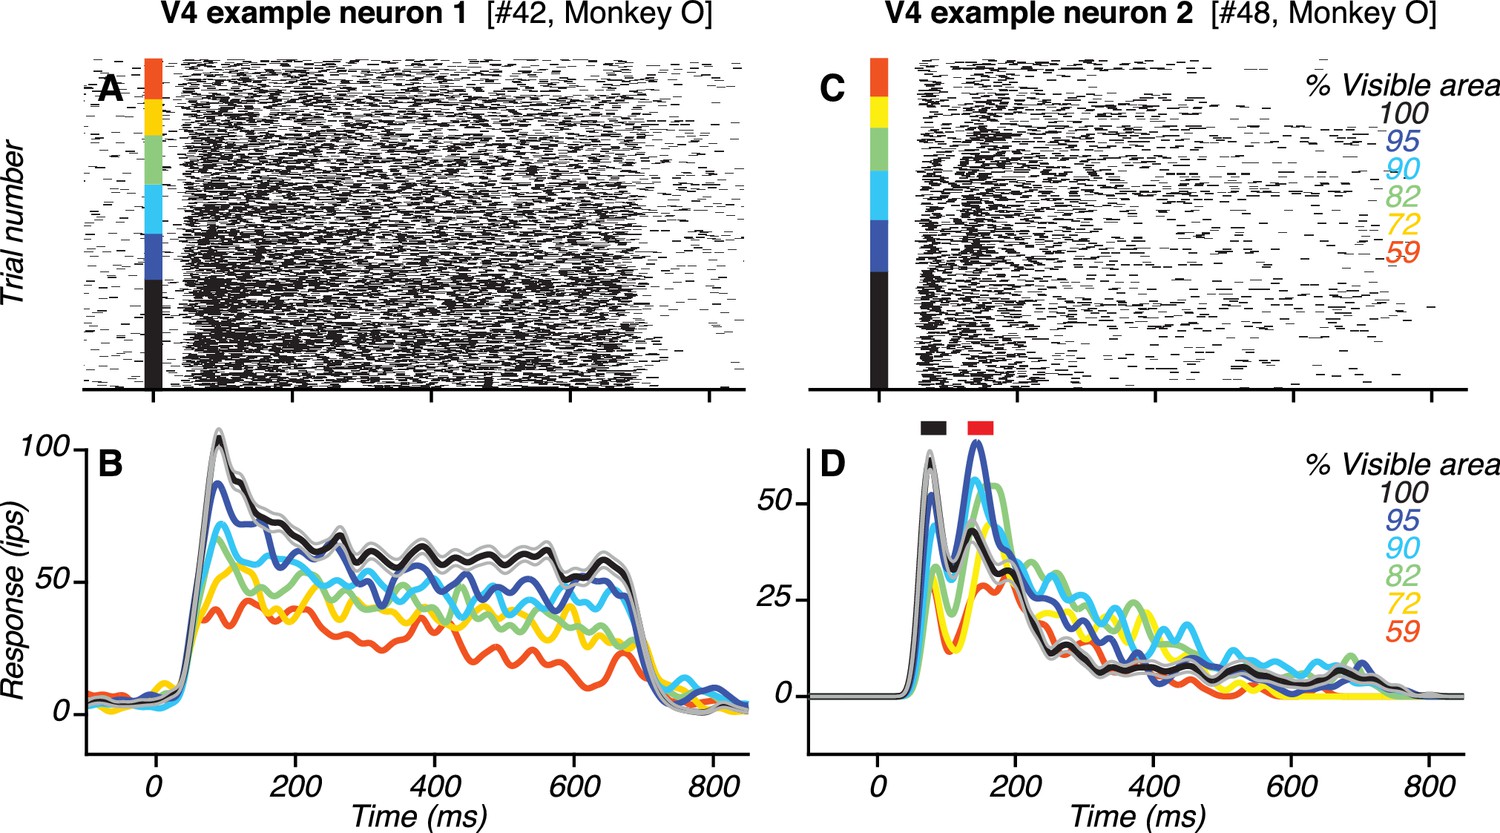
Responses of example V4 neurons.
(A–B) Responses (rasters and PSTHs) of one neuron to the preferred shape at different occlusion levels (colors). This neuron had only one transient response peak. Responses were strongest to the unoccluded stimulus (black; gray lines show standard error of the mean) and declined gradually with increasing occlusion level (i.e. lower % visible area). (C–D) Responses of another V4 neuron. This neuron had two transient response peaks (black and red horizontal bars in (D) with different dependence on occlusion level.
Figure 5 with 1 supplement
Responses of two additional example V4 neurons with two transient response peaks.
(A–B) PSTHs of responses to the preferred shape at different occlusion levels (colors; same format as in Figure 4B, D). Also see Figure 5—figure supplement 1.
Figure 5—figure supplement 1
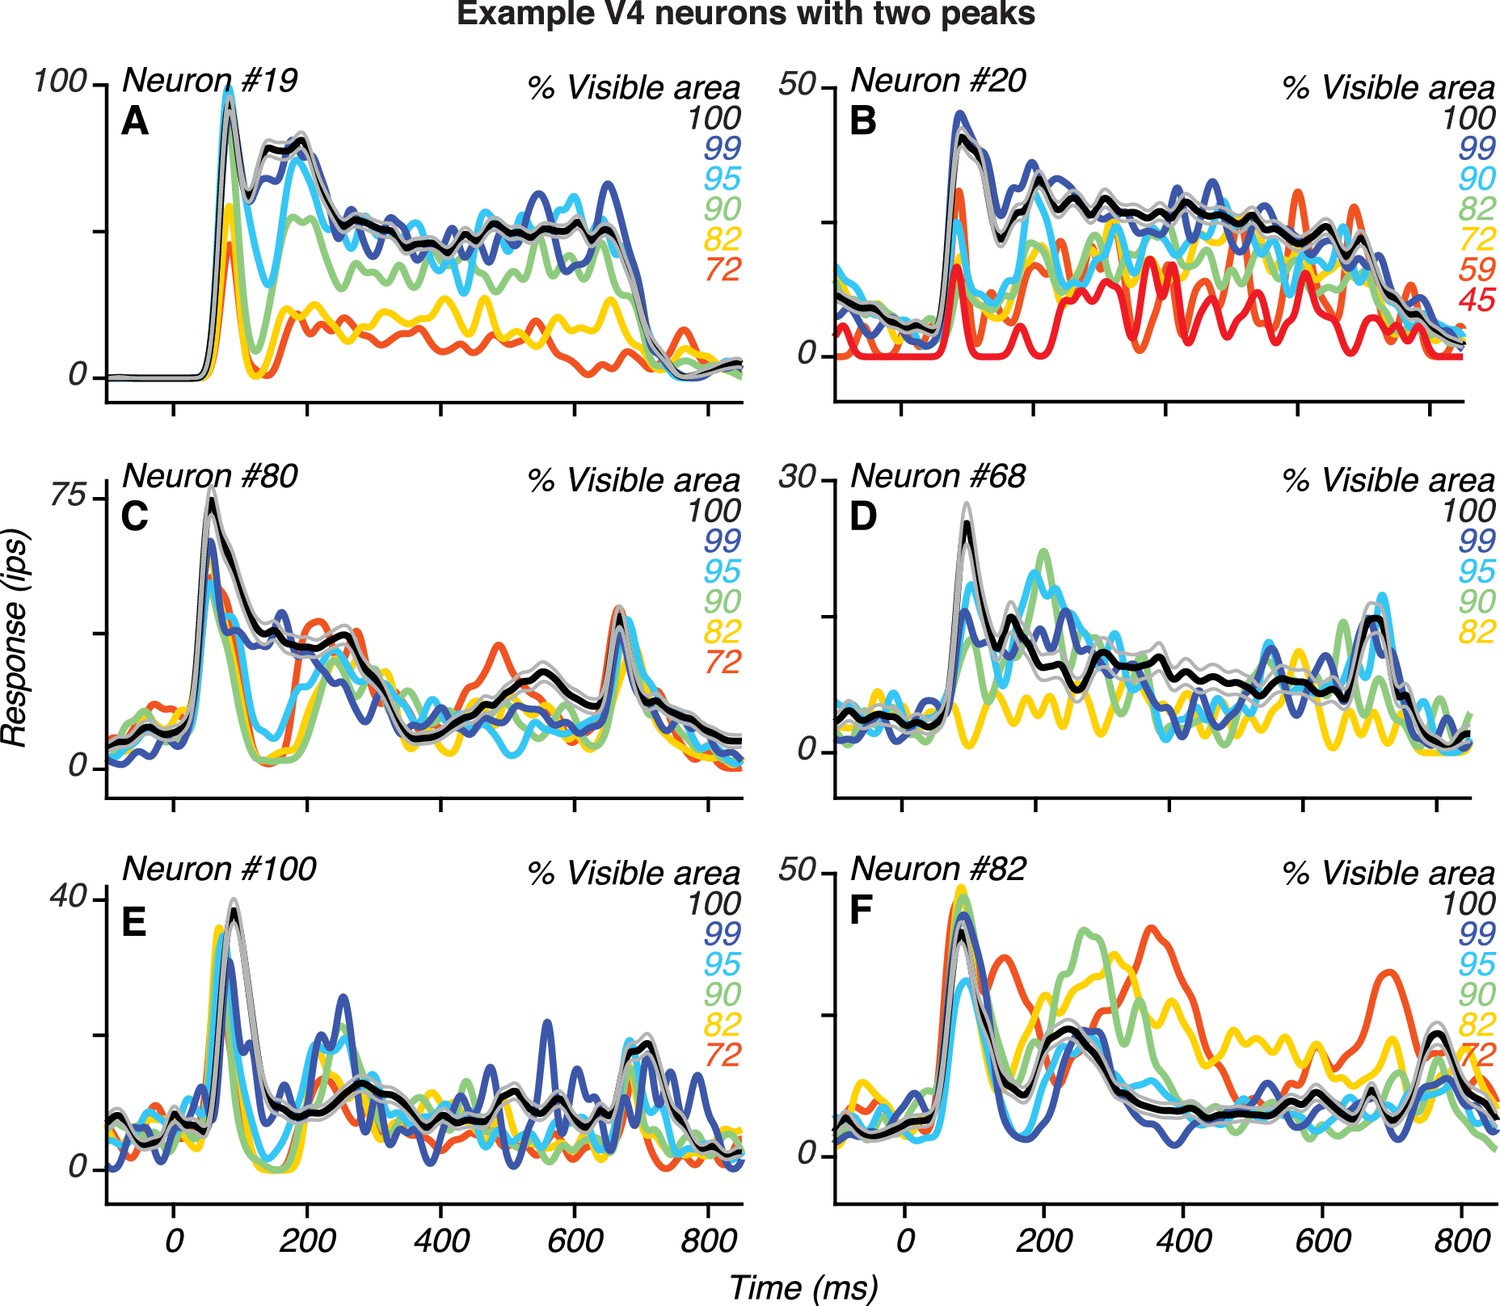
Additional examples of V4 neurons with two peaks.
For each neuron, there was a statistically significant increase in response at the time of the second peak relative to the preceding trough (t Test, p<0.05, Bonferroni corrected).
Figure 6 with 1 supplement
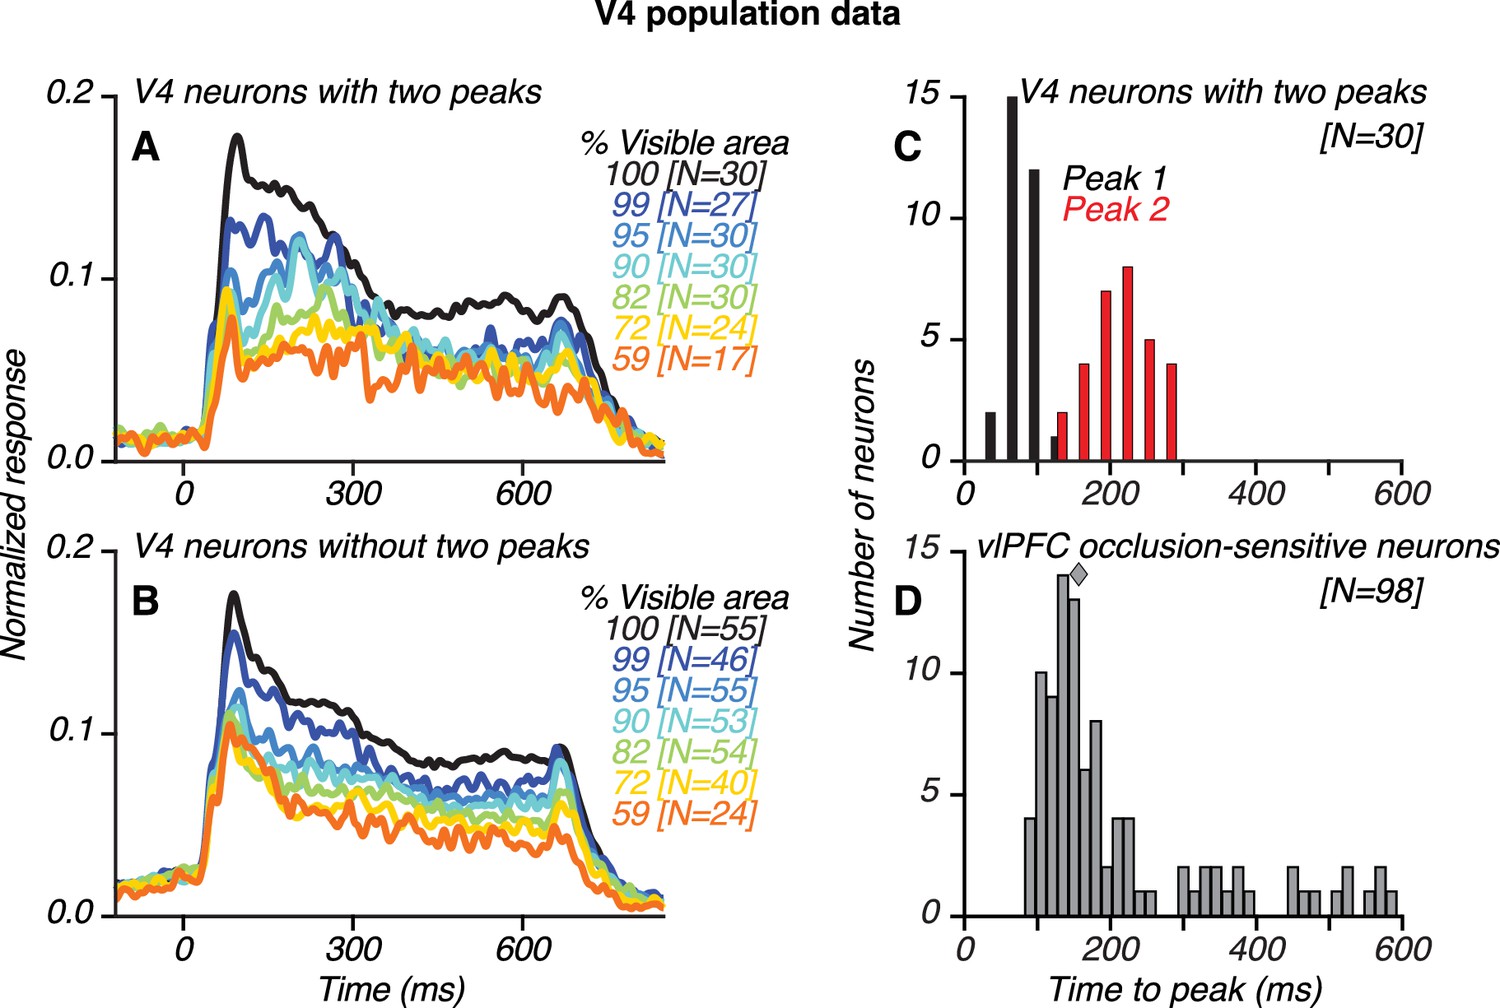
Population results for V4 and vlPFC neurons.
(A–B) Population-level, normalized PSTHs for 30/85 V4 neurons that showed two transient response peaks (A) and for V4 neurons without two peaks (B), identified using an ad hoc algorithm (see Materials and methods). The numbers of neurons contributing to each curve are listed in brackets. (C) Distribution of the first (black) and second (red) response peak times for V4 neurons with two peaks. (D) Distribution of the latency of peak responses for occlusion-sensitive vlPFC neurons; median latency was 157 ms (diamond). The first and second response peaks in V4 typically occurred before and after the peak response of vlPFC neurons, respectively. Also see Figure 6—figure supplement 1.
Figure 6—figure supplement 1
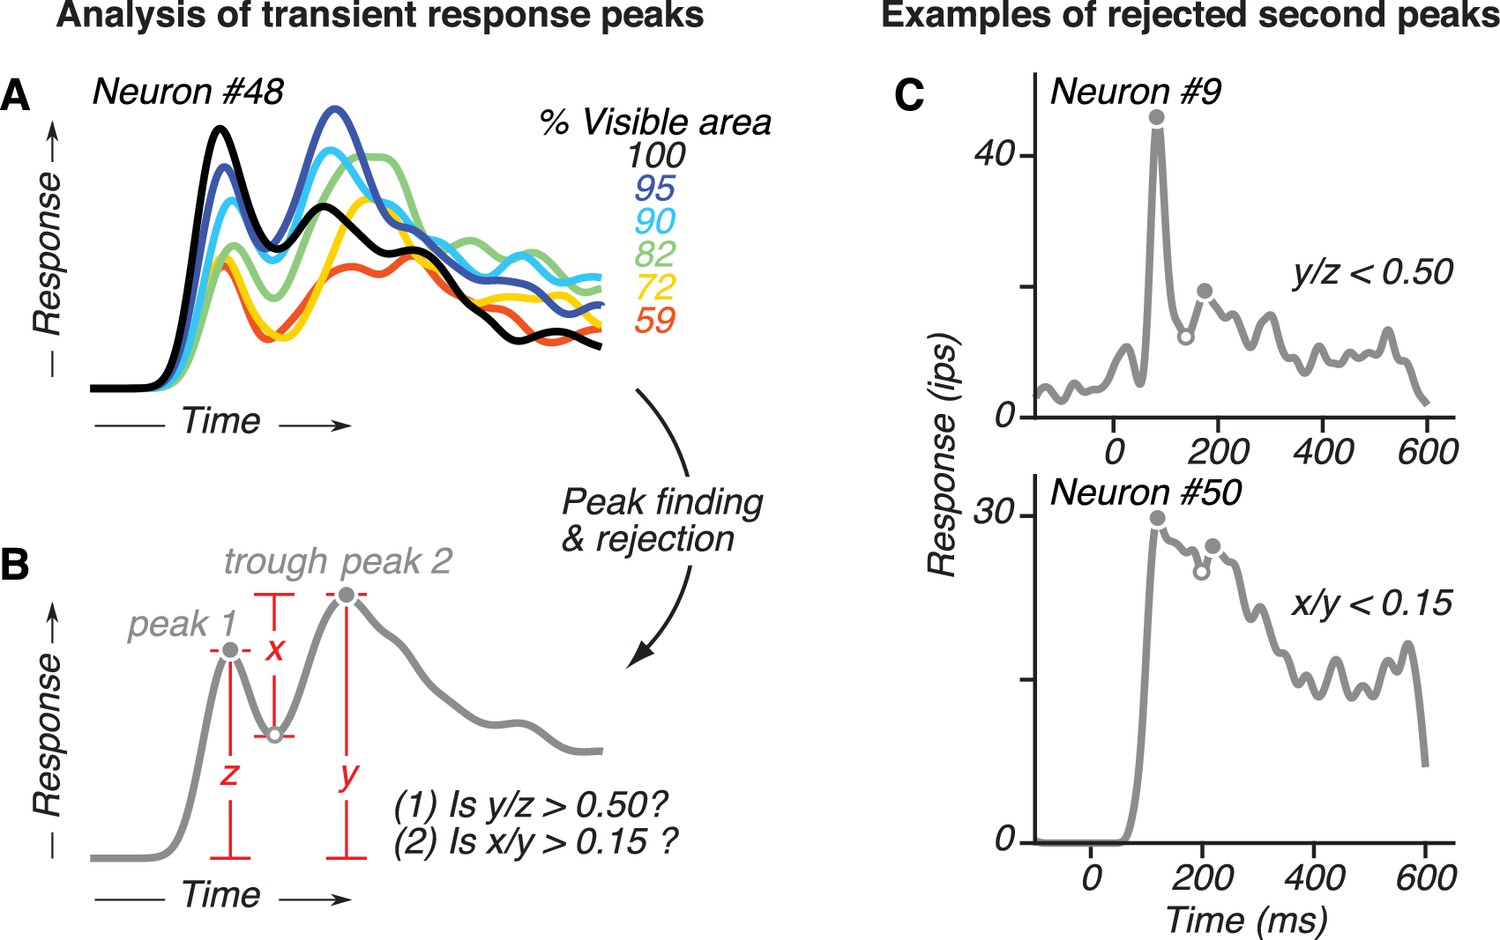
Schematic of the ad hoc peak finding algorithm used.
(A) We demonstrate this procedure for the responses of an example V4 neuron with two peaks (same data as in Figure 4B). (B) We constructed an average PSTH from the individual PSTHs to each occlusion level (% visible area <100) that evoked strong responses. We then used a zero-crossing algorithm to identify local peaks (filled circles) and an intervening trough (open circles) in the average PSTH, and within 300 ms of test stimulus onset. Small peaks (<50% of the initial transient response; that is y/z < 0.5) and small trough-to-peak modulations (<15% of the local peak magnitude, that is x/y < 0.15) were rejected. For each putative second peak that met these criteria, we asked whether there was a statistically significant increase in response relative to the preceding trough. To do this, we conducted a paired t Test between the average activity in a 30 ms window centered on the putative second peak and on the preceding trough (p<0.05, Bonferroni corrected). For this example neuron, there was one peak (labeled peak 2) that passed the criteria and t Test. (D) Example of neuronal responses where the local maxima in the average PSTH were rejected as candidates for second response peak because the candidate peak was too small relative to the first peak (top, y/z < 0.5) or because the trough-to-peak modulation was too small (bottom, x/y < 0.15). See B for schematic representations of x, y, and z.
Figure 7
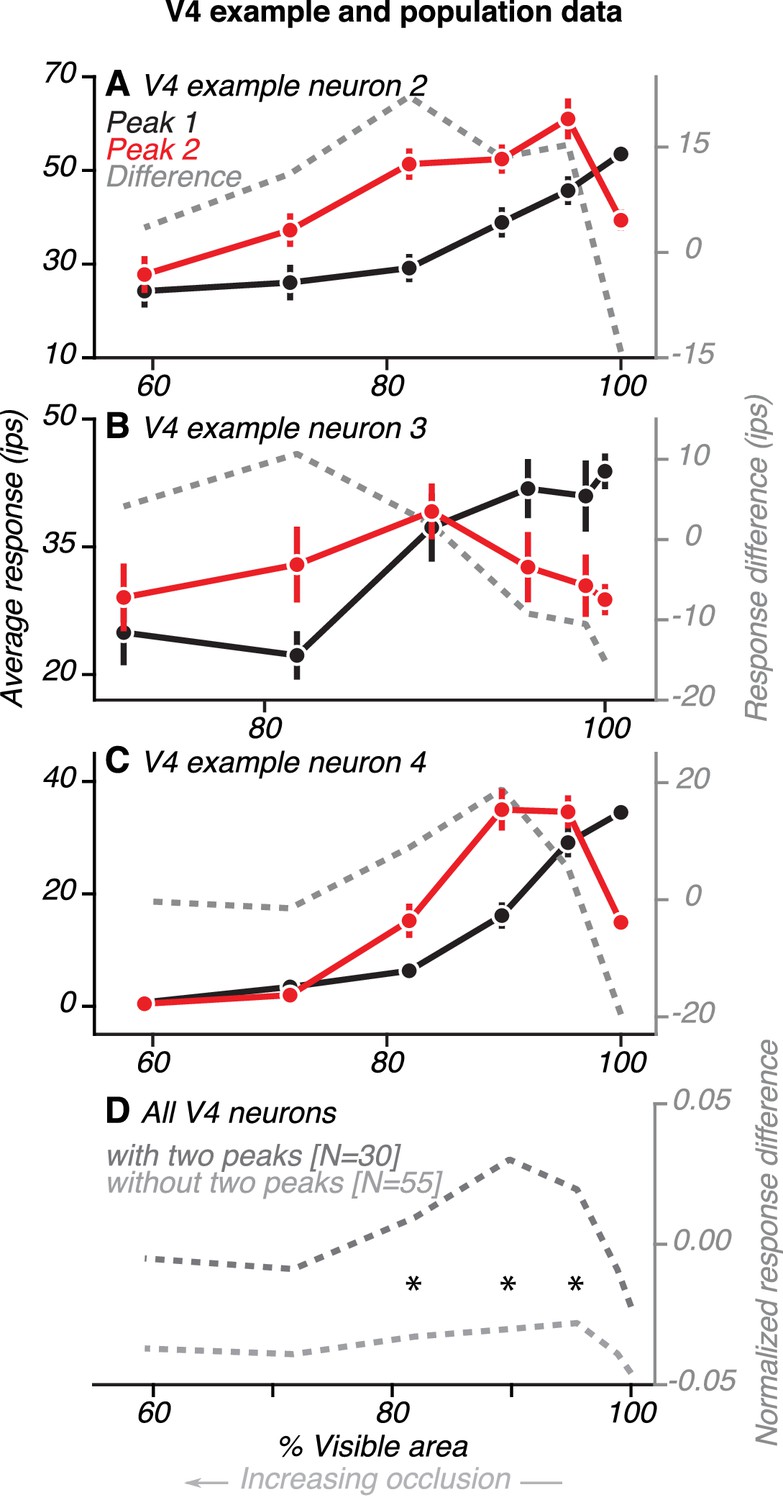
Comparison of V4 responses during the first and second peaks.
(A) Data from one example V4 neuron with two peaks (same neuron as in Figure 4D). Average responses (left ordinate) were measured within a 30 ms window centered on the first and second peaks, relative to the preceding baseline (85–115 ms before test stimulus onset). Difference in responses (right ordinate) between the first and second peaks (gray line) is shown. During the first peak (black), responses were strongest for the unoccluded shape (100% visible area) and declined for higher occlusion levels (<100% visible area). During the second peak (red), responses were strongest for intermediate levels of occlusion. Response difference was an inverted U-shaped curve, with a negative value for the unoccluded stimulus and positive for all levels of occlusion. (B–C) Data for two other V4 neurons (same neurons as in Figure 5A–B, respectively). (D) Population average of the difference in responses between first and second peak for neurons with (dark gray) and without (light gray) two peaks. Responses of each neuron were first normalized by the maximum across time and occlusion levels. Then, for each neuron and at each occlusion level, we measured the difference in response between two time points: during the initial transient (69–99 ms after test stimulus onset) and at a later time in the sustained response phase (199–229 ms after test stimulus onset). These time points are centered around the median peak time of the first and second peaks, respectively. For neurons with two peaks, the average response difference between first and second peaks followed a U-shaped curve, with positive values for intermediate levels of occlusion. For neurons without two peaks, the difference curve was flat and negative for all levels of occlusion. Asterisks mark occlusion levels for which the average response difference curve was significantly greater for neurons with two peaks (t Test, p<0.05).
Figure 8 with 6 supplements
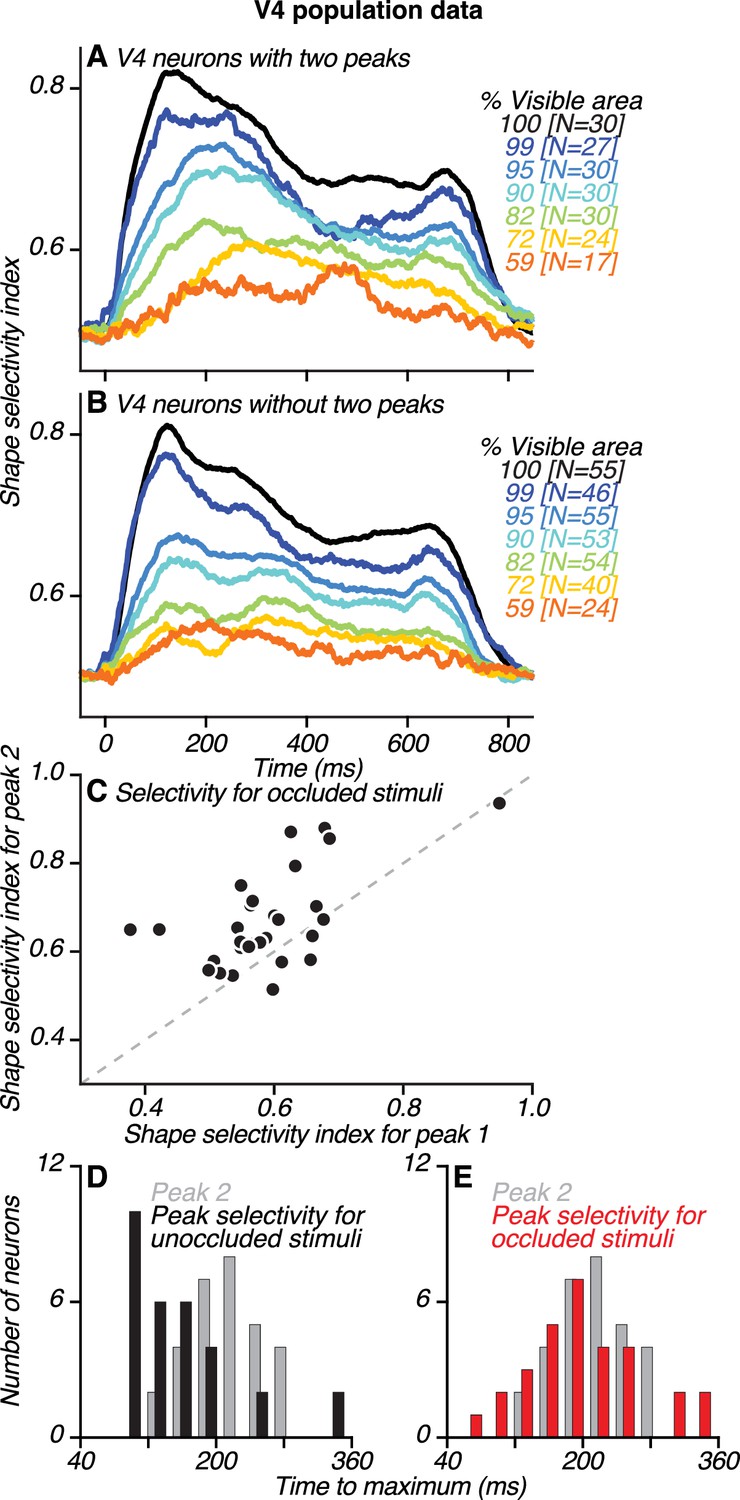
Dynamics of neuronal shape selectivity in V4.
(A–B) Time course of average shape selectivity for unoccluded (black) and occluded (colors) stimuli for V4 neurons with two peaks (A) and V4 neurons without two peaks (B). For unoccluded stimuli (black), the time course and magnitude of shape selectivity were similar for the two neuronal groups. For stimuli at intermediate occlusion levels (72–95% visible area), shape selectivity was stronger and reached a maximal value later for neurons with two peaks (compare corresponding colors in A and B, also see Figure 8—figure supplement 1). (C) For most neurons with two peaks, shape selectivity at the time of the second peak (ordinate) was stronger than during the first peak (abscissa). Shape selectivity for occluded stimuli was significantly higher during the second peak than during the first peak (t Test, p<0.01). We computed shape selectivity using ROC analysis across all occlusion trials (i.e. % visible area <100) based on spike counts in a 30 ms window centered around the times of the first and second peaks, respectively (also see Figure 8—figure supplement 2). (D–E) For neurons with two peaks, the time of the second peak (gray) is compared to the time of maximal shape selectivity (black and red), separately for unoccluded (black, D) and occluded stimuli (red, E). Shape selectivity for unoccluded stimuli reached a maximal value significantly earlier than the second peak (t Test, p<0.01); this was not the case for occluded stimuli (t Test, p=0.98). Also see Figure 8—figure supplements 3–6.
Figure 8—figure supplement 1

Comparison of shape selectivity under occlusion for V4 neurons with and without two peaks.
Each panel shows shape selectivity as a function of time for unoccluded stimuli (black) and for stimuli at different occlusion levels (colors). Data are shown separately for neurons with (solid) and without (dashed) two peaks. At intermediate occlusion levels (blue to yellow), shape selectivity was stronger and reached a maximal value later for V4 neurons with two peaks, close to the median of second peak times (~214 ms). These data are as in Figure 8A–B, and replotted to facilitate direct comparison between neuronal groups.
Figure 8—figure supplement 2
Relative response amplitude versus change in shape selectivity during the second peak for V4 neurons with two peaks.
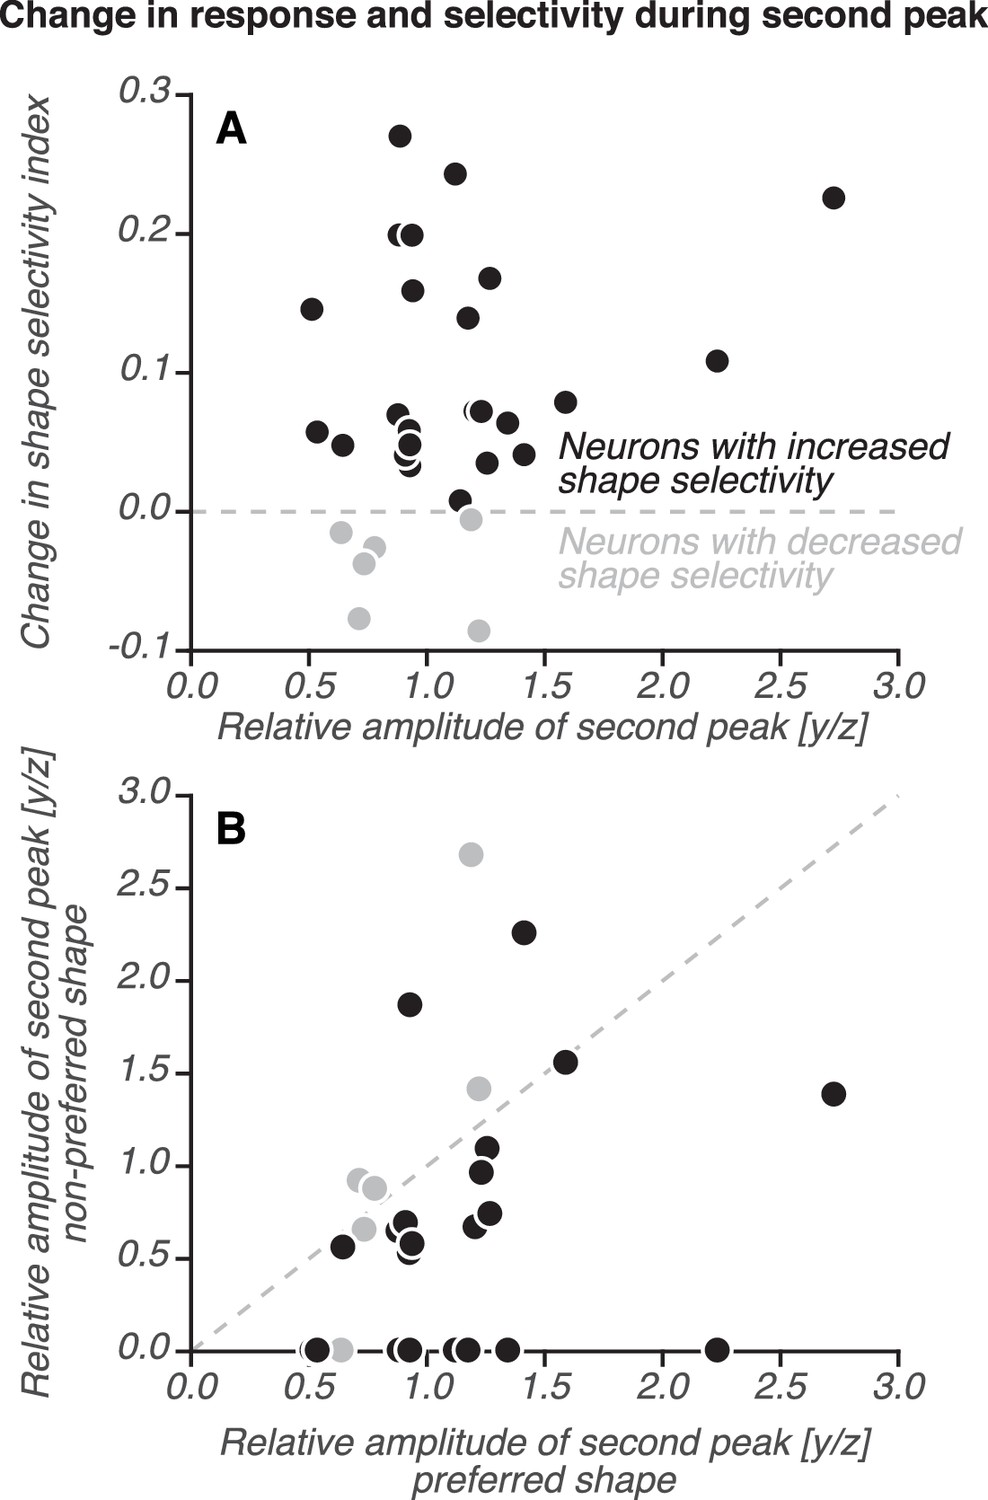
(A) Change in shape selectivity (second peak – first peak, ordinate) is plotted against the relative response amplitude (second peak/first peak, abscissa; same as y/z, see Figure 6—figure supplement 1B). For each peak, shape selectivity and response amplitude were measured during a 30 ms window centered on the second peak. Most neurons (24/30; black) showed an increase in shape selectivity during the second peak; this enhanced selectivity was observed even for neurons that responded more weakly during the second peak than the first, that is the relative amplitude of the second peak, y/z < 1.0. (B) Relative amplitude during the second peak for preferred (abscissa, as in A) and non-preferred stimuli (ordinate). For most neurons with increased shape selectivity during the second peak (black), the relative amplitude of the second peak was larger for the preferred than non-preferred stimuli. Neurons with decreased shape selectivity during the second peak (gray) lie close to, or above the diagonal. Thus, shape selectivity increased during the second peak, in large part because the size of the second peak relative to the first peak was smaller for non-preferred than preferred stimuli.
Figure 8—figure supplement 3
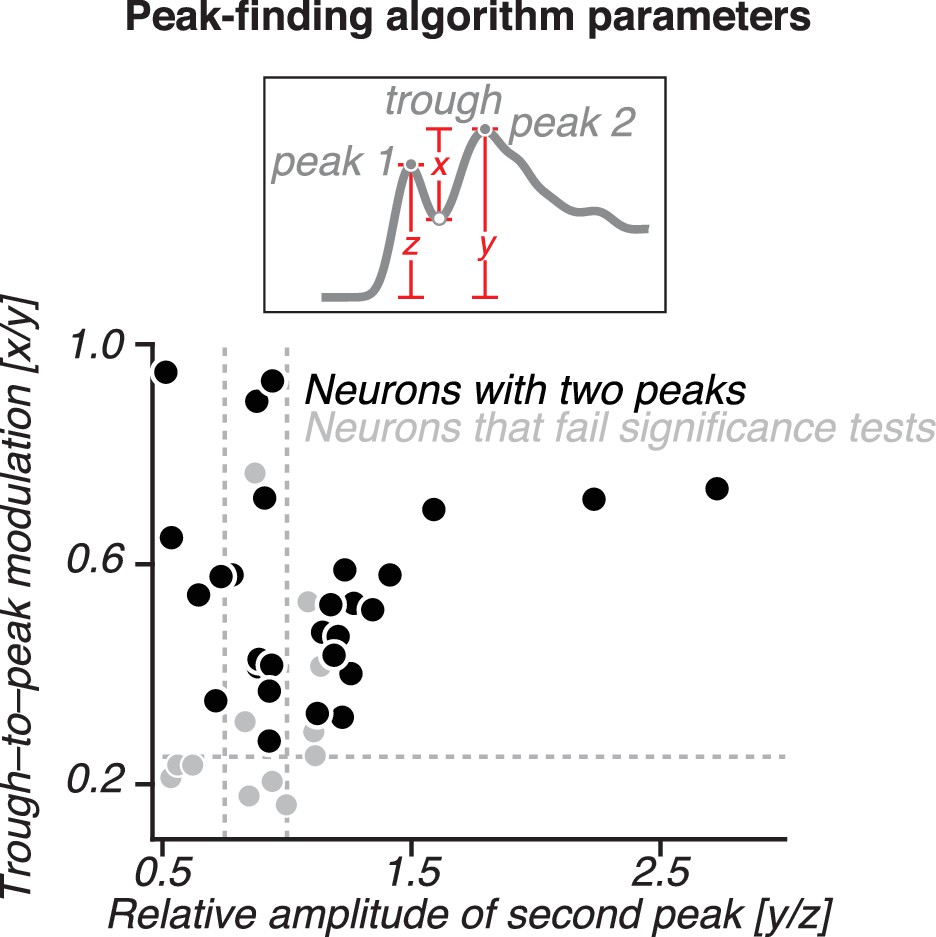
Distribution of parameter values for the peak-finding algorithm.
The amplitude of the putative second peak relative to the initial transient (y/z, see inset) is plotted against the size of the trough-to-peak modulation (x/y) for 42 neurons that had a second peak with a sizable amplitude and trough-to-peak modulation (i.e. for neurons with y/z > 0.5 and x/y > 0.15; see Figure 6—figure supplement 1B for details). Thirty neurons that also passed the statistical test are shown in black. Dotted lines indicate alternative threshold criteria for the peak amplitude and modulation parameters used in Figure 8—figure supplement 4 to classify neurons as having two peaks.
Figure 8—figure supplement 4
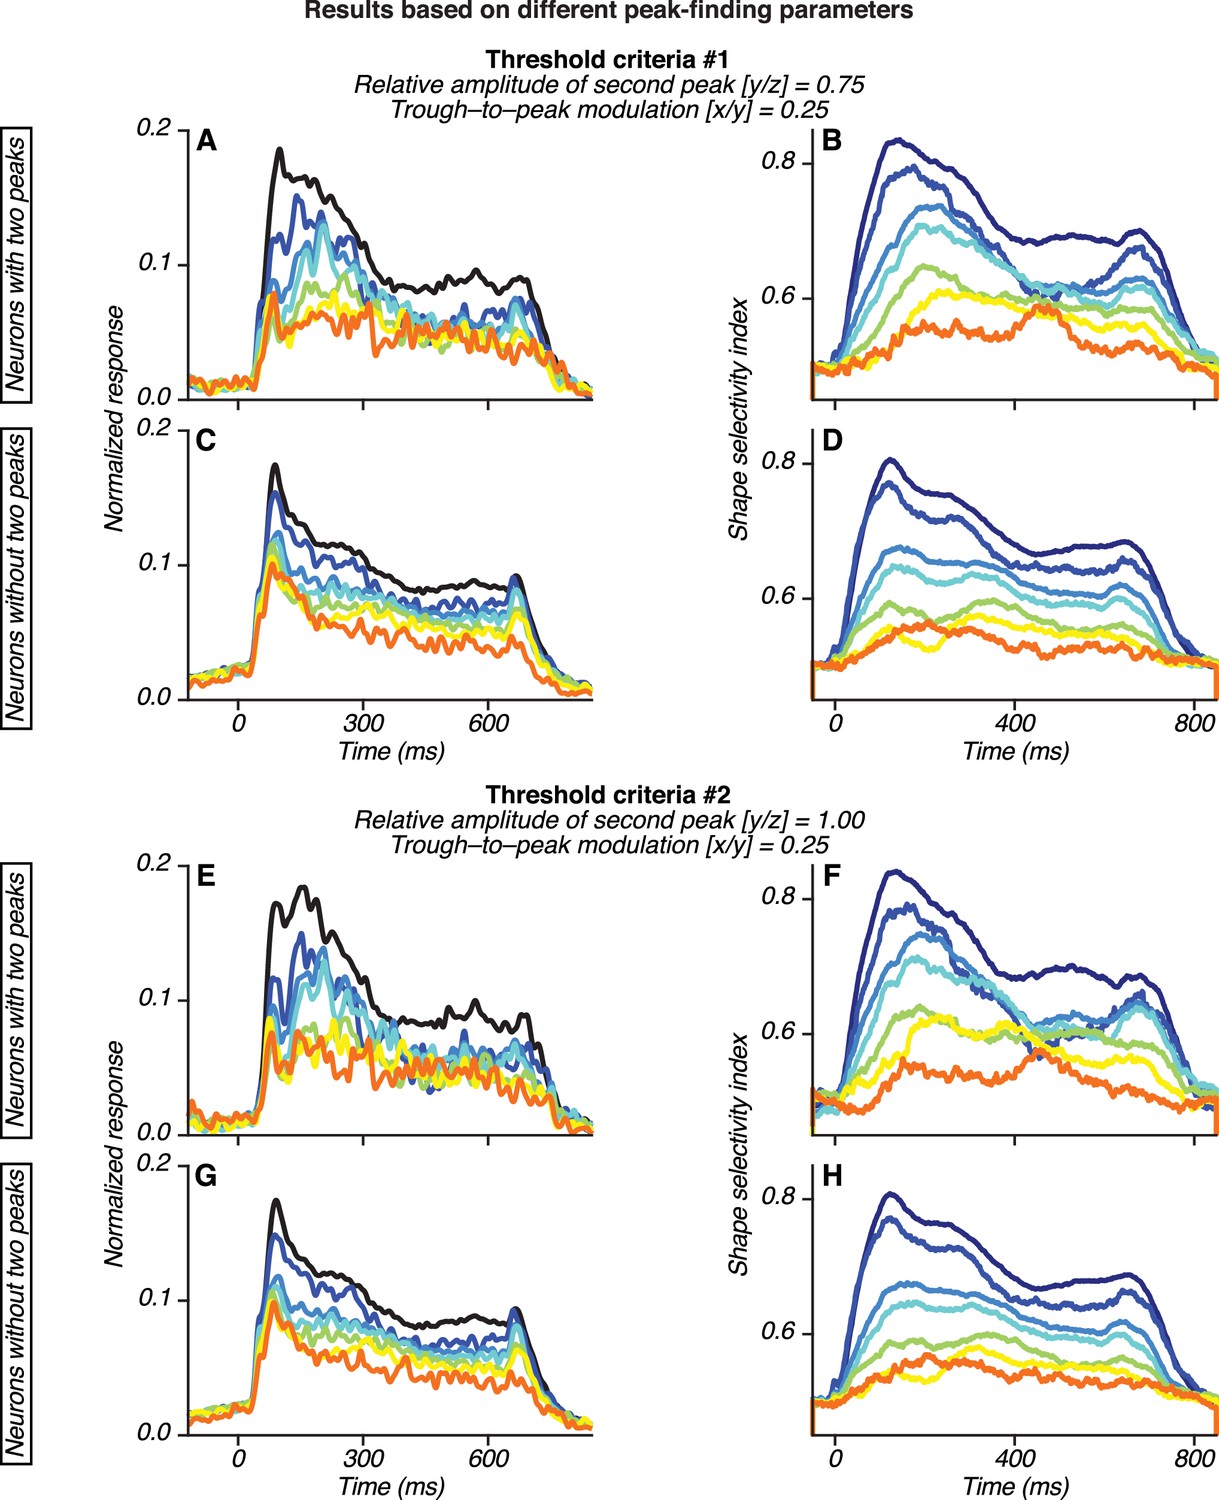
Dependence of observed V4 results on the peak-finding algorithm parameters.
Population PSTHs (A, C, E, G) and average shape selectivity plots (B, D, F, H) for neurons with and without two peaks based on alternative parameter choices. Threshold criteria were: y/z > 0.75 and x/y > 0.25 for (A–D) and y/z > 1.0 and x/y > 0.25 for (E–H) (see Figure 8—figure supplement 3). In both cases, the second peak had to show a statistically significant increase in responses relative to the preceding trough (p<0.05, Bonferroni corrected). In (A–D) and (E–H), 26/85 and 16/85 neurons were classified as having two peaks. In both cases, results were similar to those shown in Figures 6 and 8. The median peak times for the second peak were 201 ms (A) and 196 ms (E). Shape selectivity was stronger and more delayed for neurons with two peaks.
Figure 8—figure supplement 5

Analysis of V4 response dynamics across occlusion level.
(A) Responses of an example neuron with two peaks (same data as in Figure 4B). (B) Responses of an example neuron without two peaks (same data as in Figure 4D). (C–D) Response predictions of a linear model (dotted lines) and the residuals (solid lines), derived from the responses in (A–B), as described below. Responses to stimuli at different occlusion levels were modeled as gain modulations of responses to unoccluded stimuli (black lines) using the following equation. where r is the response as a function of occlusion level u and time t. k is a scalar value that specifies the response gain. For each occlusion level, we estimated k using a linear regression between the responses to occluded and unoccluded stimuli in the interval 65–150 ms. For the V4 neuron whose responses are shown in A, the predicted responses provide a good match to the observed responses and the residuals are low. This implies that the neuron’s temporal response profile is similar across occlusion levels up to a multiplicative scale factor, and that the dynamical response has a stereotypic trajectory with a single input parameter k(u). This result suggests that the dependence of this neuron’s responses on occlusion level is governed by its earliest input signals and that this relationship is stationary during the test stimulus epoch. For the V4 neuron whose responses are shown in (B), the predicted responses do not provide a good match to the observed data. The residuals are large and positive: they reach a maximal value around 150 ms, and are strongest for intermediate occlusion levels. Thus, a good minimal description of the dynamical response trajectories can be obtained by including an additive term that is stronger for occluded than unoccluded stimuli. Specifically. where f(u,t) is given by the residual (in D). This result is consistent with the possibility that the additive input given by f(u,t) is derived from vlPFC inputs because f(u,t) emerges (~150 ms) after response onset in roughly half the PFC neurons, and that f(u,t) is stronger for responses to occluded than unoccluded stimuli as in vlPFC.
Figure 8—figure supplement 6
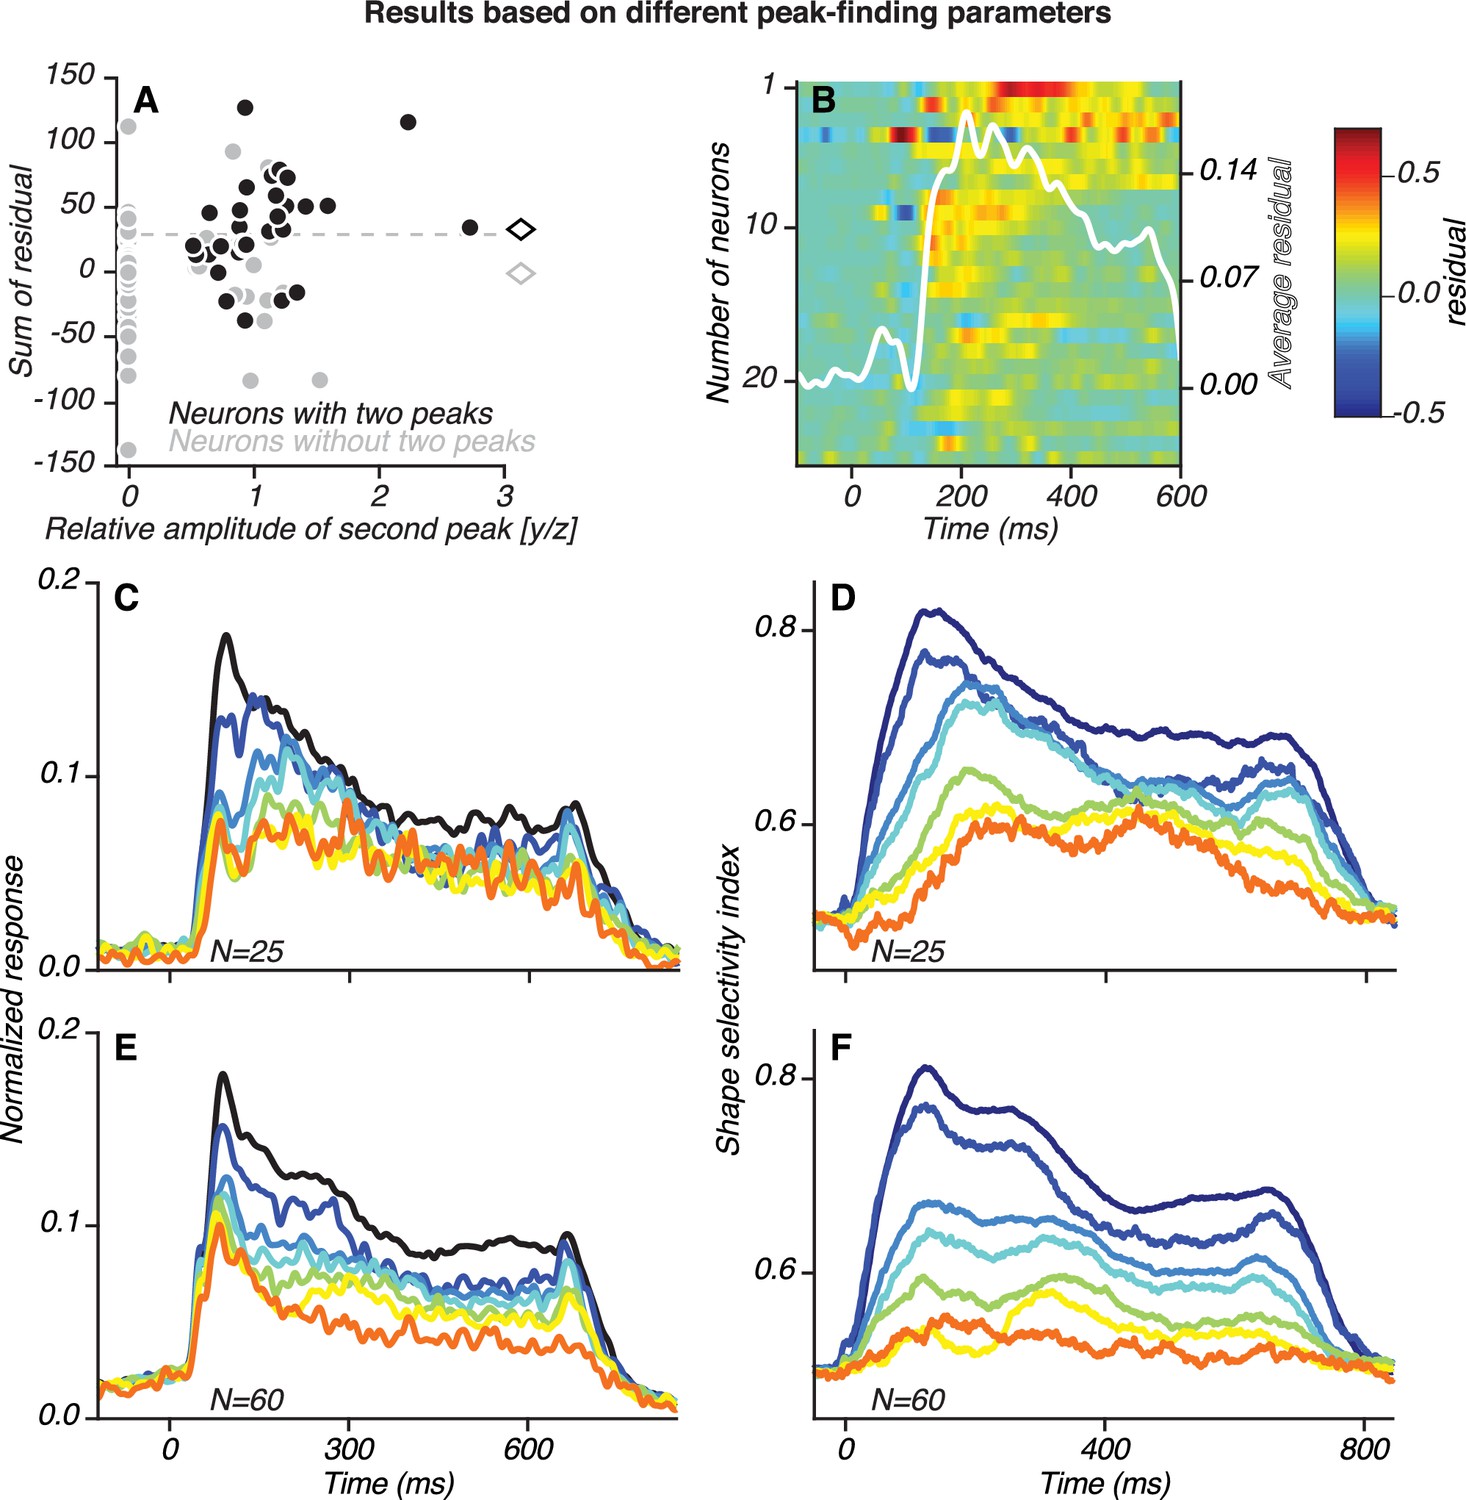
Population results for neurons with stronger responses to occluded stimuli than expected from linear scaling (see Figure 8—figure supplement 5).
(A) Scatter plot of the sum of residuals (ordinate) derived from the predictions of the gain-modulation model versus the relative amplitude of the second peak (y/z, same as abscissa in Figure 8—figure supplement 3) for neurons with (black) and without (gray) two peaks. Neuronal classifications were based on the peak-finding algorithm. Of the neurons classified as having one transient response peak (gray), 43 neurons did not have a candidate second peak with a sizable amplitude and trough-to-peak modulation and are therefore assigned y/z = 0; 12 neurons that did have a candidate second peak with y/z > 0.5, did not pass the statistical criterion. We fit the linear gain-modulation model as described in Figure 8—figure supplement 5 and summed the residuals in the time window 45–600 ms after test stimulus onset, allowing for V4 response latency. For 43 neurons that had no candidate second peak in their responses, y/z = 0. For most neurons with two peaks (black dots), the sum of the residuals was >0. The average sum of residuals (diamonds) was significantly greater (t Test, p<0.05) for neurons with two peaks. (B) We examined the time course of the residuals for 25 neurons with the highest summed residuals, that is those neurons above the dashed line in (A). These are neurons with stronger responses to occluded stimuli than expected based on multiplicative scaling of the initial transient in response to unoccluded shapes. Of these 25 neurons, 17 were classified as having two peaks (by the peak-finding algorithm), a significantly greater proportion than expected by chance (Binomial test, p<0.01). The average residual across these 25 neurons (white line) reached a maximal value at 208 ms, close to the median time of the second peak (Figure 6C). (C–F) Population PSTHs and shape selectivity for the 25 neurons in B, showing similar results to those in Figures 6 and 8.
Figure 9
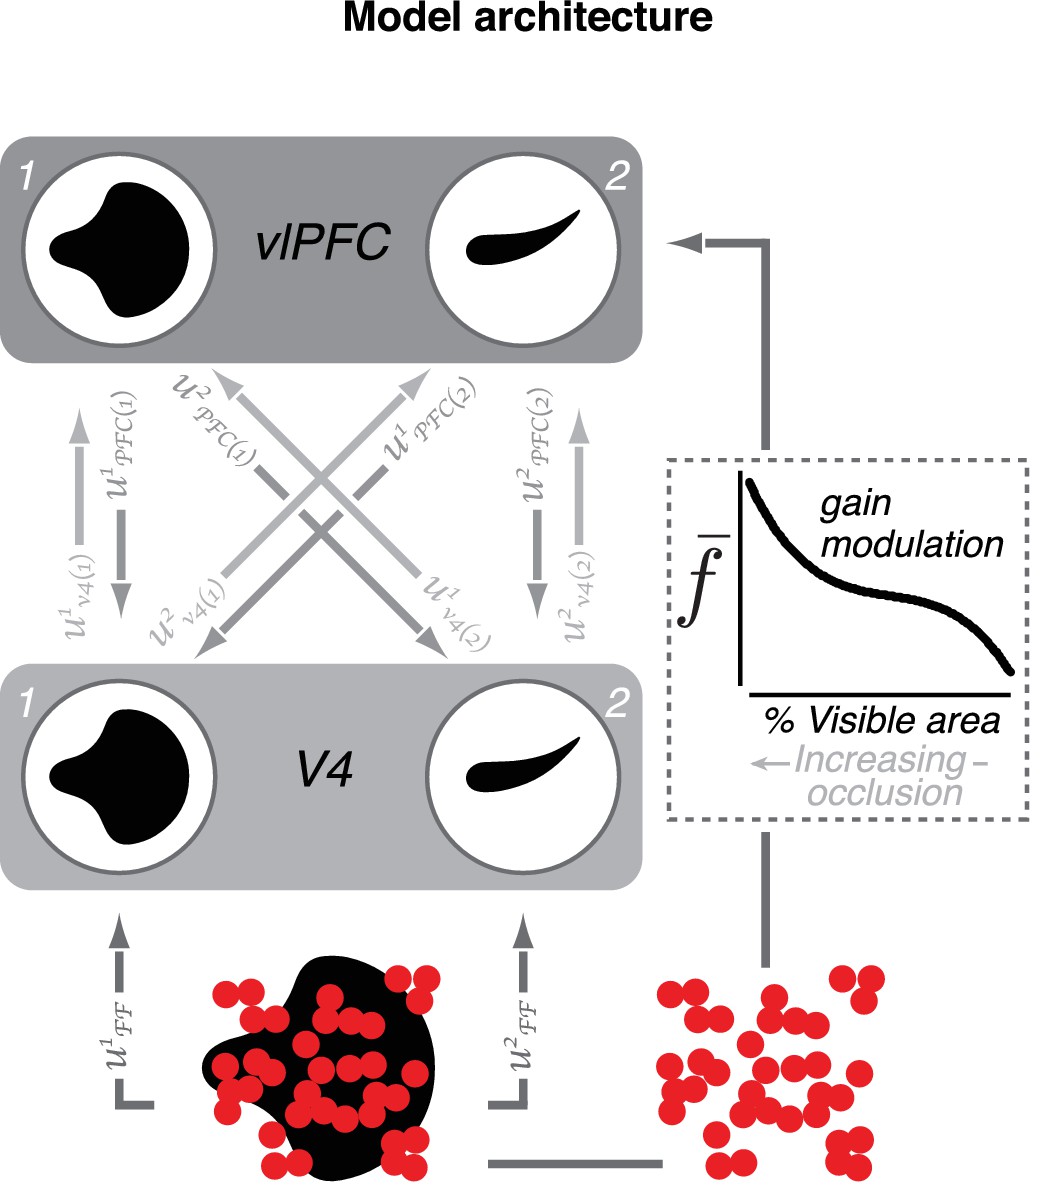
Model of V4–vlPFC interactions.
The two-layer dynamical network model includes two V4 units (1 and 2) and two vlPFC units (1 and 2). The V4 units prefer two different shapes. Each vlPFC unit receives inputs from both V4 units; the shape preference of a vlPFC unit is determined by the preference of the V4 unit that provides the stronger input. V4 units receive feedforward input from upstream visual areas denoted by and feedback from both vlPFC units denoted by In this notation, i indexes the recipient unit and j indexes the sender unit. Feedback inputs are passed through a rectifying nonlinearity prior to arrival in V4. Each vlPFC unit receives feedforward inputs from both V4 units, denoted by (), as well as a modulatory signal,, that depend on occlusion level (for modeling details, see Materials and methods).
Figure 10 with 6 supplements
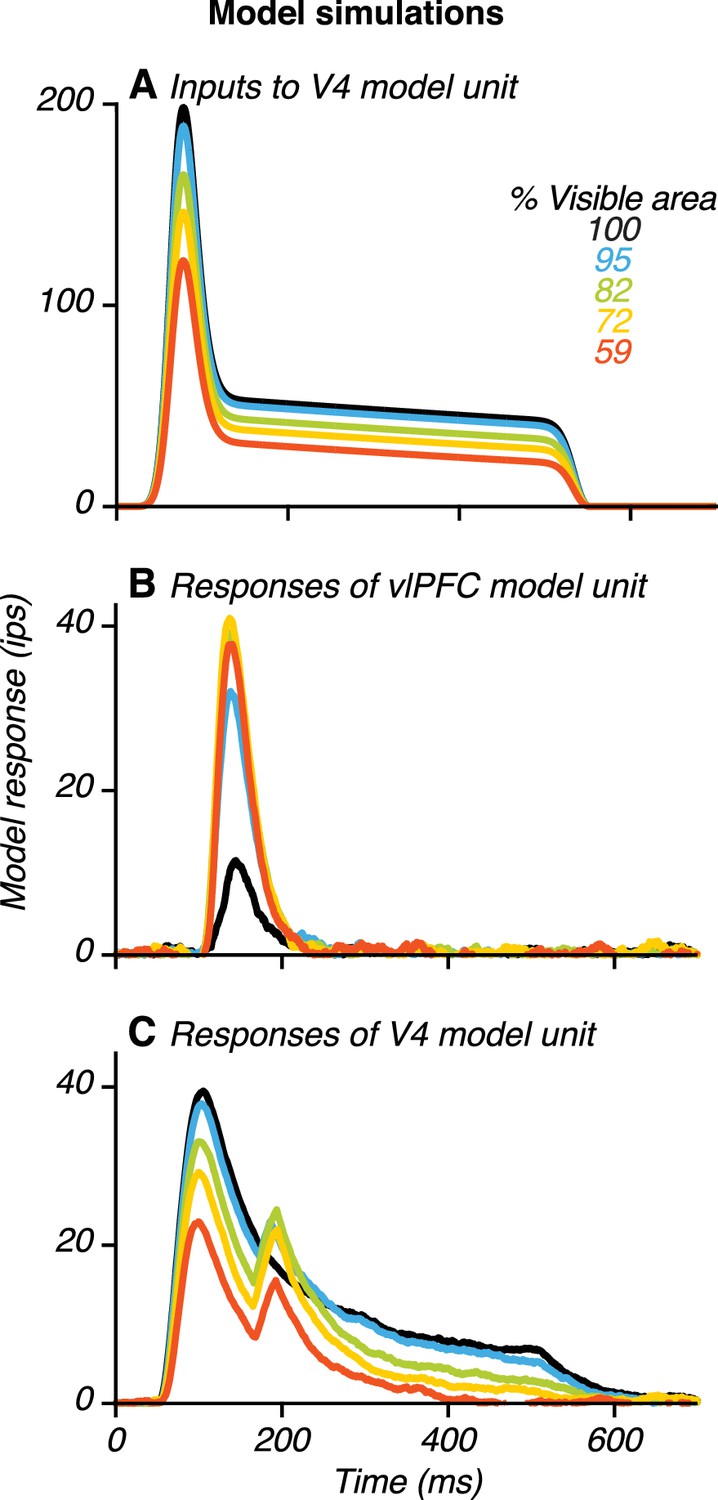
Example model results.
(A) Input to a V4 unit, , when its preferred stimulus was presented at different occlusion levels (colors). The input was strongest for the unoccluded stimulus (black) and declined gradually with increasing occlusion level. (B) Responses of a vlPFC unit. Responses were weak for the unoccluded stimulus and stronger for occluded stimuli. (C) Responses of a V4 unit receiving feedback from the vlPFC unit (in B) showing two transient peaks. Also see Figure 10—figure supplements 1–6.
Figure 10—figure supplement 1
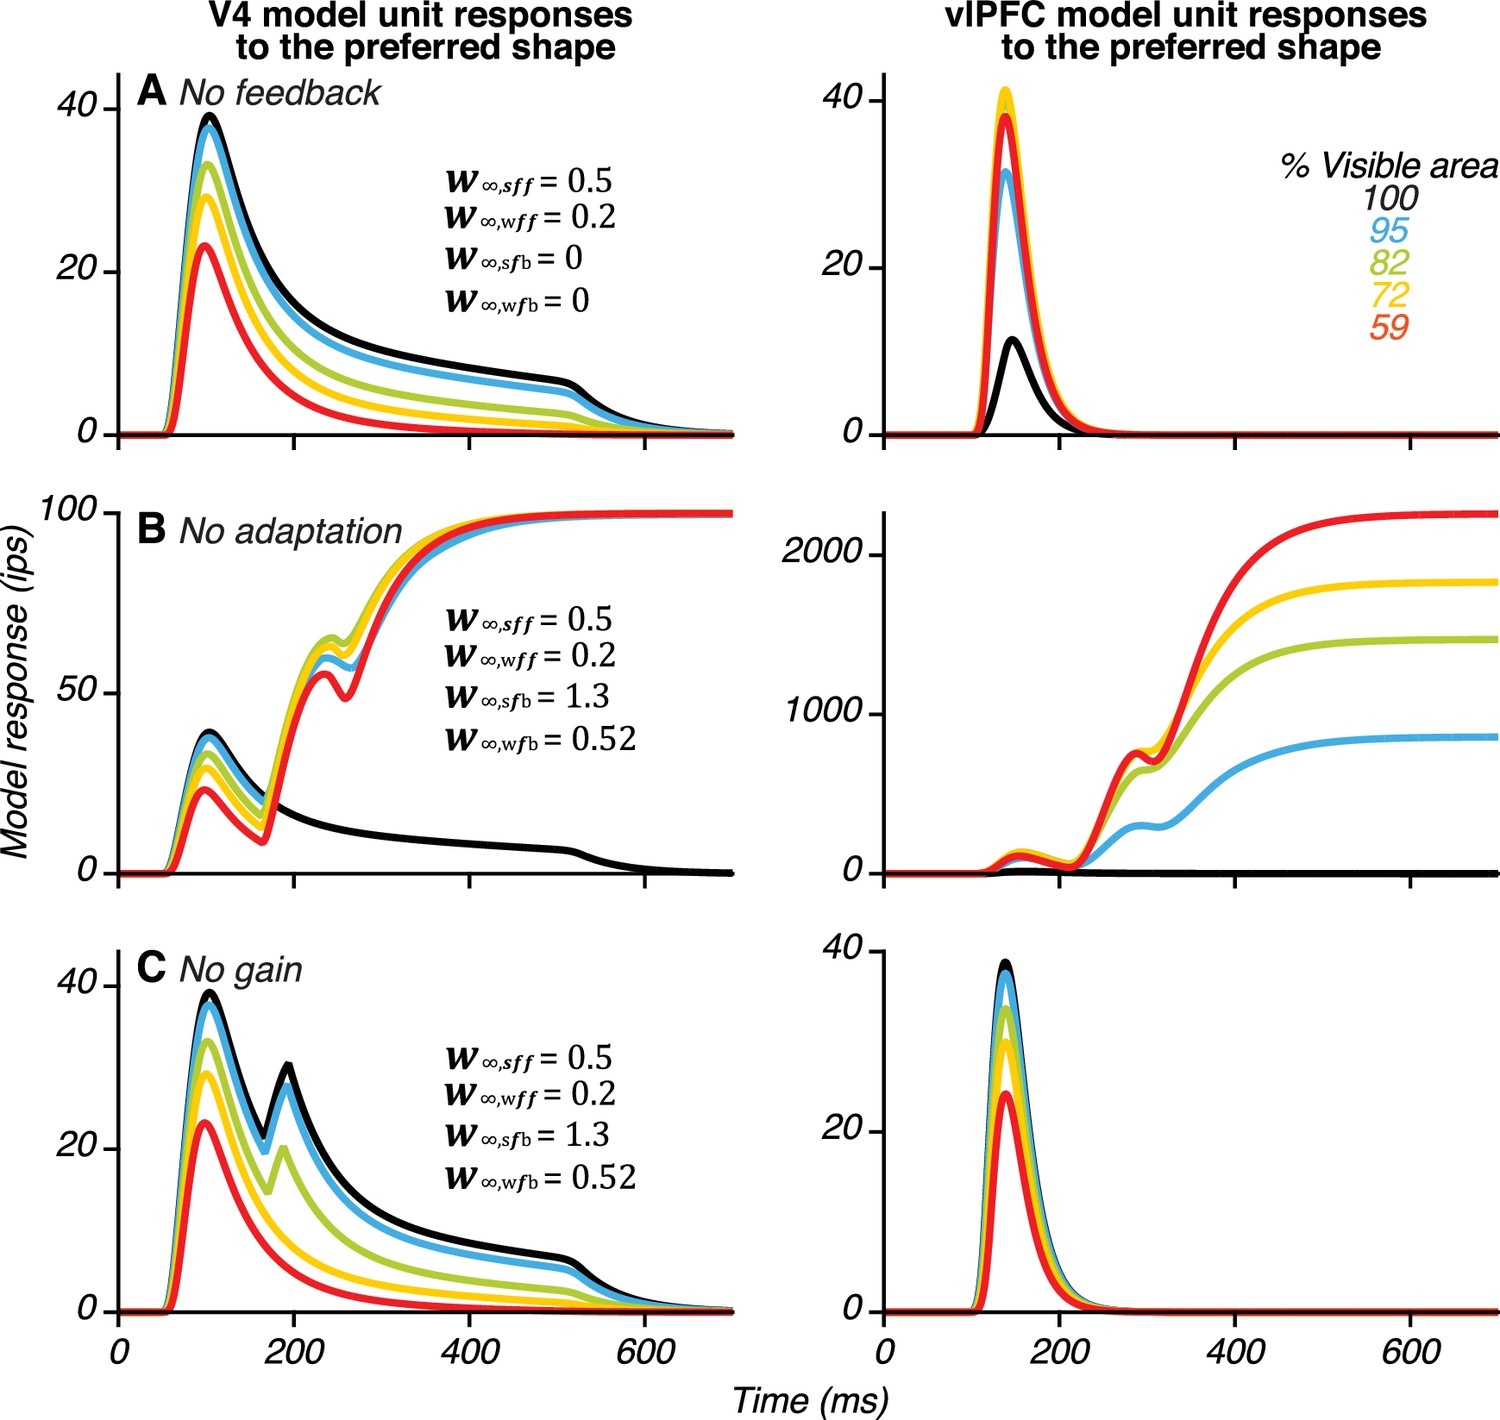
Demonstrating the necessity of feedback, synaptic adaptation and gain mechanisms in the model.
(A) To demonstrate the necessity of feedback from vlPFC to V4, we set for all i and j (see Equation 7 in Methods and materials). With only feedforward connections from V4 to vlPFC, the responses of the V4 unit (left) did not show a second transient peak. (B) To demonstrate the necessity of synaptic adaptation on the feedforward connections from V4 to vlPFC, the feedforward connection weights from V4 to vlPFC (and were set to be constant over time (see Equation 9, Materials and methods). This resulted in ‘ringing’ and ‘blow up’ of V4 (left) and vlPFC (right) responses. (C) To demonstrate the necessity of gain-modulation, we set, (Equation 6, Materials and methods). In this case, vlPFC unit responses and V4 unit responses during the second peak resembled those during the first peak in V4: responses were strongest for unoccluded stimuli and declined with increasing occlusion level.
Figure 10—figure supplement 2
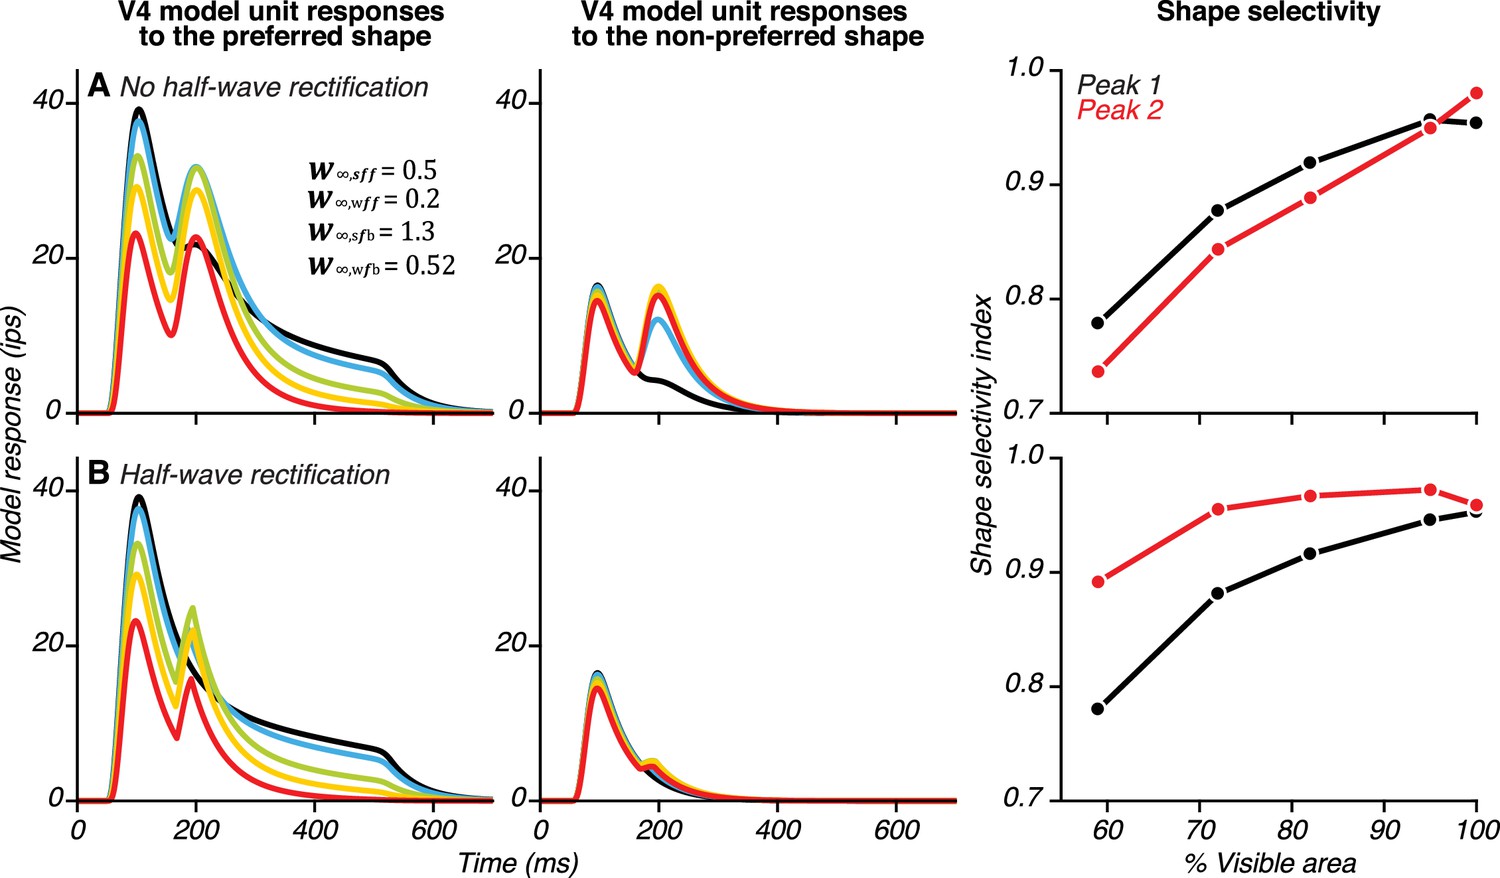
Demonstrating the necessity of half-wave rectification in the model.
(A) When we excluded the thresholding and half-wave rectification on the feedback from vlPFC to V4 (see Equation 7, Materials and methods), our simulations produced a large second peak in V4 unit responses both to preferred (left) and to non-preferred stimuli (middle). Thus, without rectification, the model fails to reproduce the enhanced shape selectivity for occluded stimuli during the second peak (right). (B) When thresholding and half-wave rectification are included, a large second peak is observed only in V4 unit responses to the preferred shape (left), and shape selectivity for the occluded stimuli is enhanced at the time of the second peak (right). To compute shape selectivity, we first generated Poisson spikes on 1000 trials, within a 30 ms window centered on the first and the second peaks for responses to both the preferred and non-preferred shapes. We then constructed spike-count distributions and used the area under the ROC curve to compute shape selectivity, as was done for the neuronal data (see Materials and methods).
Figure 10—figure supplement 3
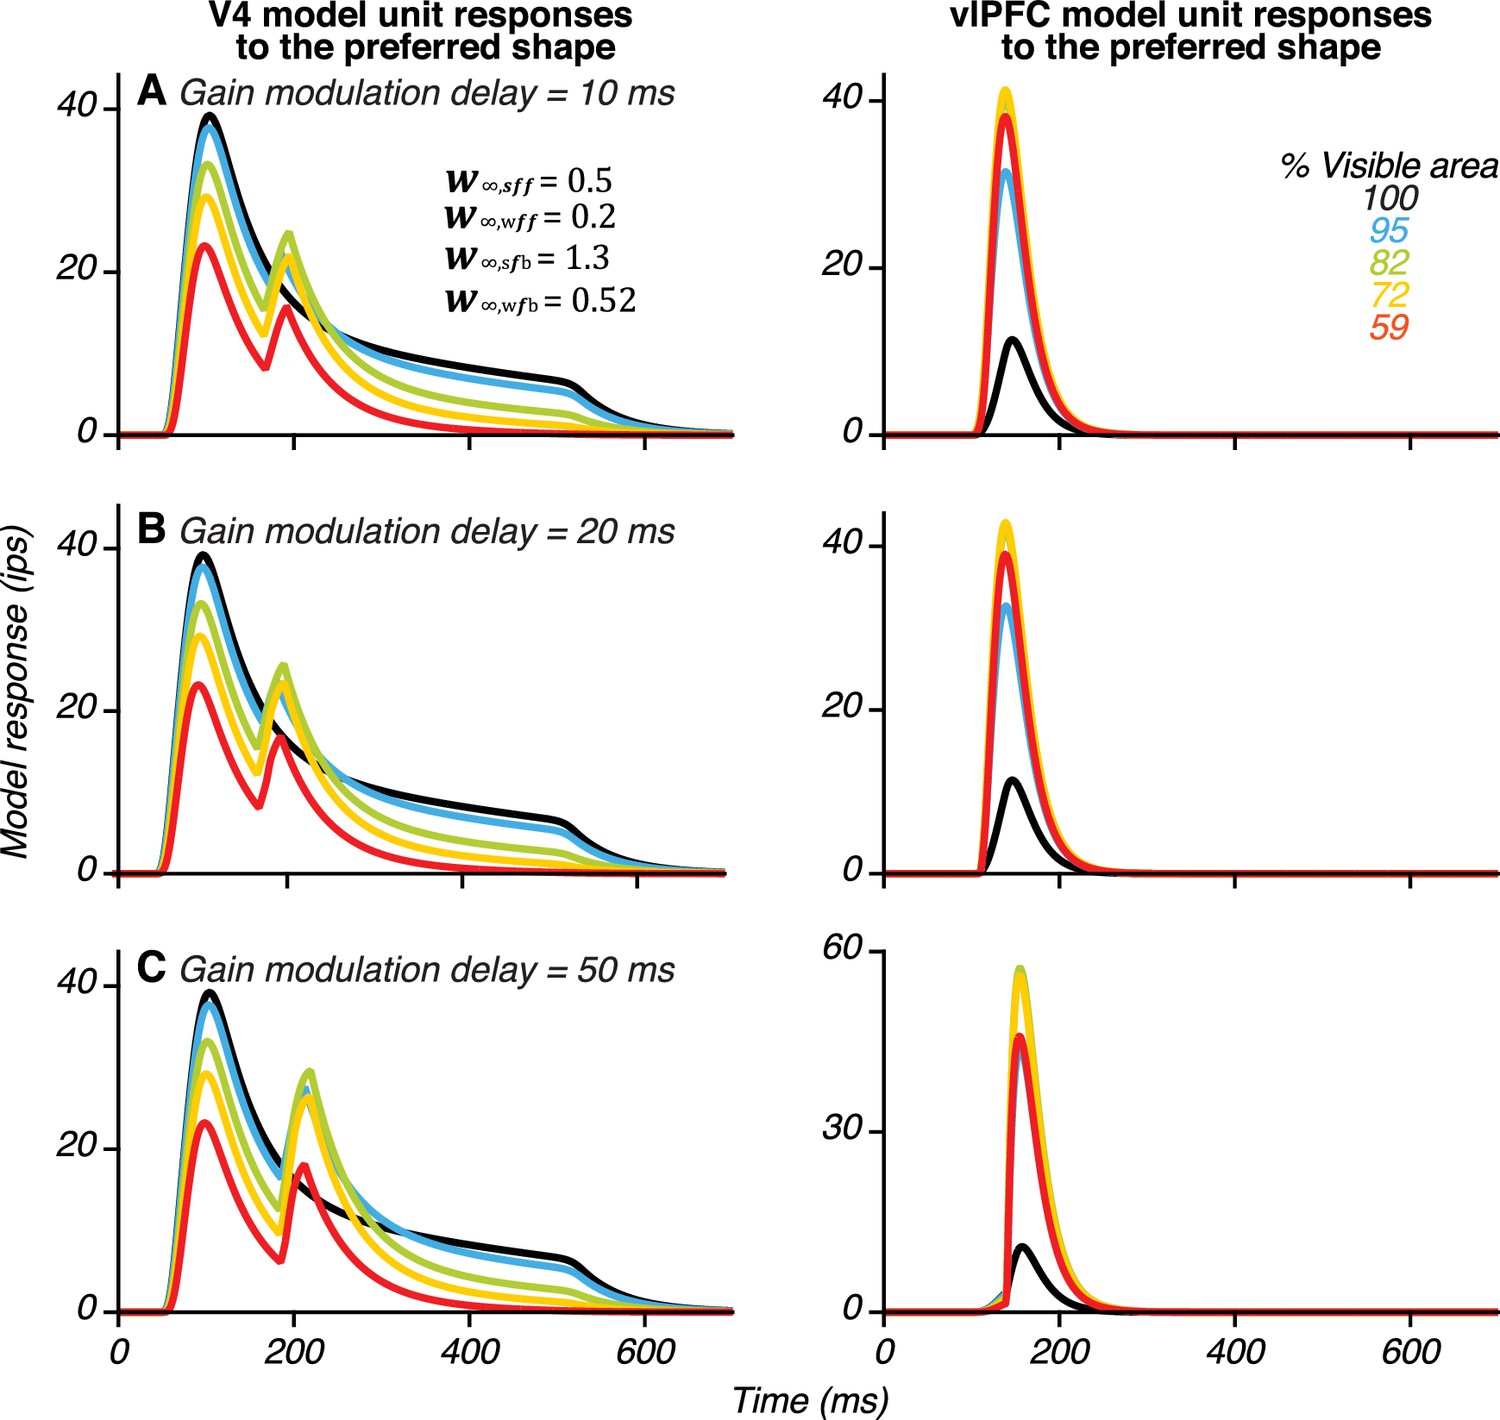
Effect of delaying the arrival of gain modulation signals to vlPFC in the model.
To consider the possibility that gain modulation signals carrying information about occlusion level (, see Figure 9) may be communicated via feedforward signals from IT cortex to vlPFC, we tested the effect of delays of 10 ms (A), 20 ms (B) and 50 ms (C) on the arrival of gain modulation signals relative to the arrival of feedforward shape-selective signals from V4. By increasing this delay, the peak time of vlPFC responses and the second peak in V4 were slightly delayed, but in all three cases, our simulations produced robust second peak in the V4 unit.
Figure 10—figure supplement 4

Relationship between the strength of shape selectivity in vlPFC in the model and the magnitude of V4 second peak responses produced.
We varied the shape selectivity of vlPFC neurons by modifying the relative strengths of feedforward connections from the two V4 units (see parameters listed in A–C). For all three sets of parameters, V4 unit shape selectivity during the first peak (black) was strongest for the unoccluded shape and declined gradually for higher occlusions, as observed in the neuronal data. vlPFC shape selectivity (gray) was strongest for intermediate levels of occlusion, consistent with the neuronal data. vlPFC shape selectivity was weaker overall when the weights for the two V4 units were comparable (in C) and this resulted in a smaller second response peak in the V4 unit. However, in all three cases (A–C), V4 shape selectivity for the occluded shape was enhanced during the second peak. These simulations confirm that the model produces similar results for a range of vlPFC shape selectivity indices. In all cases, feedback connection strengths were proportional to feedforward connection strengths.
Figure 10—figure supplement 5
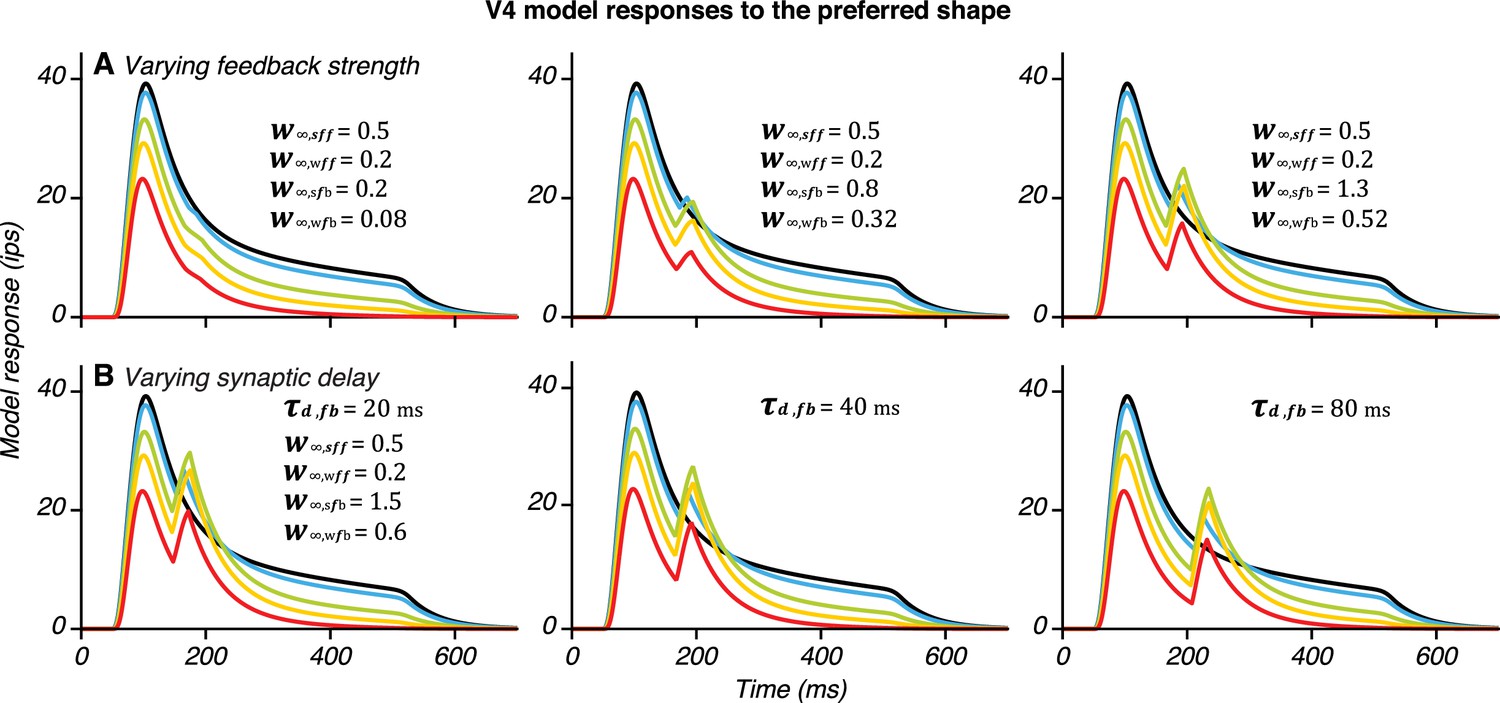
Heterogeneity of V4 second peak response properties reproduced by the model.
(A) Varying feedback connection strength produces second response peaks of different magnitude; stronger feedback produced larger peaks. (B) Varying synaptic delay produces second response peaks at different delays relative to the first peak. These simulations confirm that our model can generate the diversity of responses observed in the neuronal data.
Figure 10—figure supplement 6
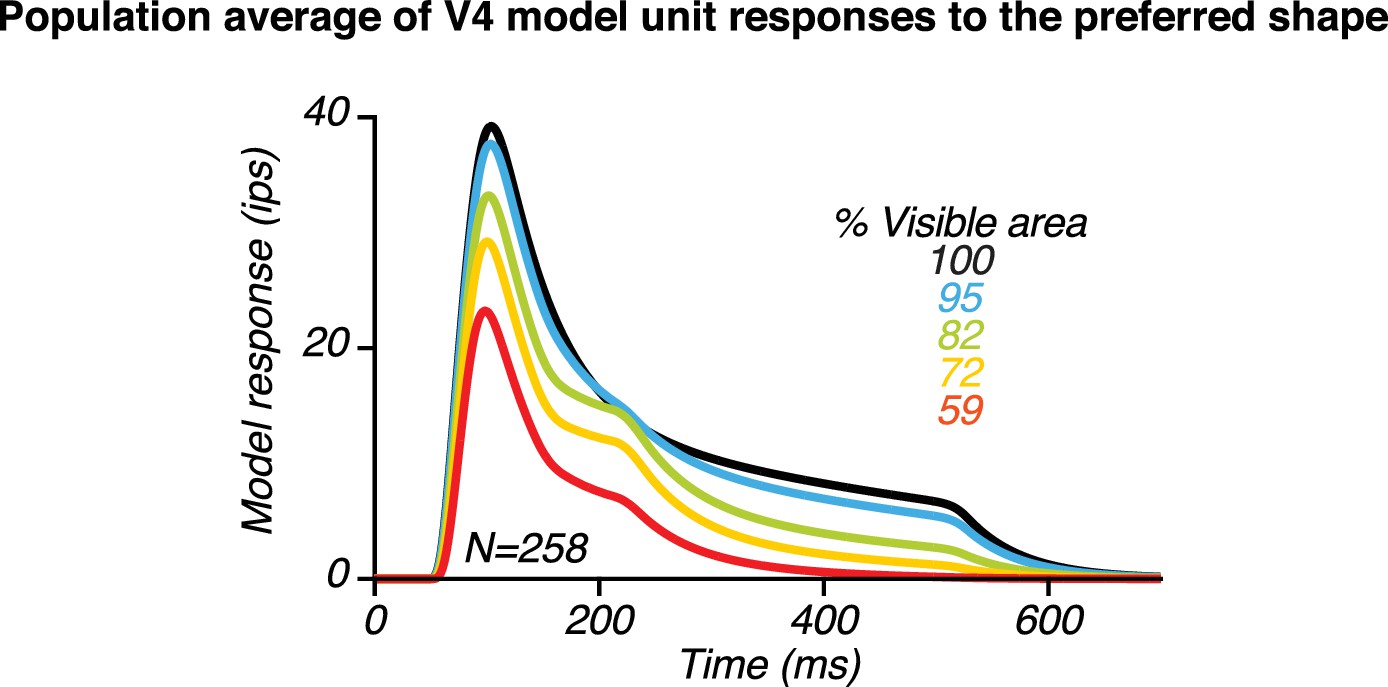
Population average of 258 V4 model units with two peaks.
We generated sets of parameters with varied feedback delays (ms), feedforward synaptic strengths between V4 and PFC units sharing the same shape preferences () and different shape preferences (), and feedback synaptic strengths (;). Varying these parameters produced V4 model unit responses with heterogeneous peak magnitudes and peak times; averaging across these units produced population results that resemble the neuronal population data in Figure 6A. Specifically, the second response peak was less striking than in the responses of individual V4 units (Figure 10—figure supplement 5) due to variability in second peak times for individual neurons consistent with neuronal data.
Tables
Table 1
Parameters used for the model (fixed)
https://doi.org/10.7554/eLife.25784.028| Parameters | Values |
|---|---|
| 50 | |
| 20 | |
| 20 | |
| 0 | |
| 90 | |
| 2 | |
| 100 | |
| 30 | |
| 10 | |
| 30 |
Table 2
Parameters used for the model (varied)
https://doi.org/10.7554/eLife.25784.029| Parameters | Figure 10, Figure 10—figure supplements 1,2 | Figure 10—figure supplement 4 | Figure 10—figure supplement 5 | Figure 10—figure supplement 6 | ||
|---|---|---|---|---|---|---|
| 40 | 40 | 40 | 40 | |||
| 40 | 40 | 20, 40, 80 | 20–80 | |||
| 0.5 | 0.7 | 0.6 | 0.5 | 0.5 | 0.4–0.6 | |
| 0.2 | 0 | 0.1 | 0.2 | 0.2 | 0–0.2 | |
| 1.3 | 1 | 0.2, 0.8, 1.3, 1.5 | 0.1–1.3 | |||
Download links
A two-part list of links to download the article, or parts of the article, in various formats.
Downloads (link to download the article as PDF)
Open citations (links to open the citations from this article in various online reference manager services)
Cite this article (links to download the citations from this article in formats compatible with various reference manager tools)
Dynamic representation of partially occluded objects in primate prefrontal and visual cortex
eLife 6:e25784.
https://doi.org/10.7554/eLife.25784


