Crystal structure of intraflagellar transport protein 80 reveals a homo-dimer required for ciliogenesis
- Aarhus University, Denmark
- Helmholtz Zentrum München, Germany
- University College London, United Kingdom
- Great Ormond Street Institute of Child Health, University College London, United Kingdom
- Max-Planck-Institute of Biochemistry, Germany
Figures
Figure 1
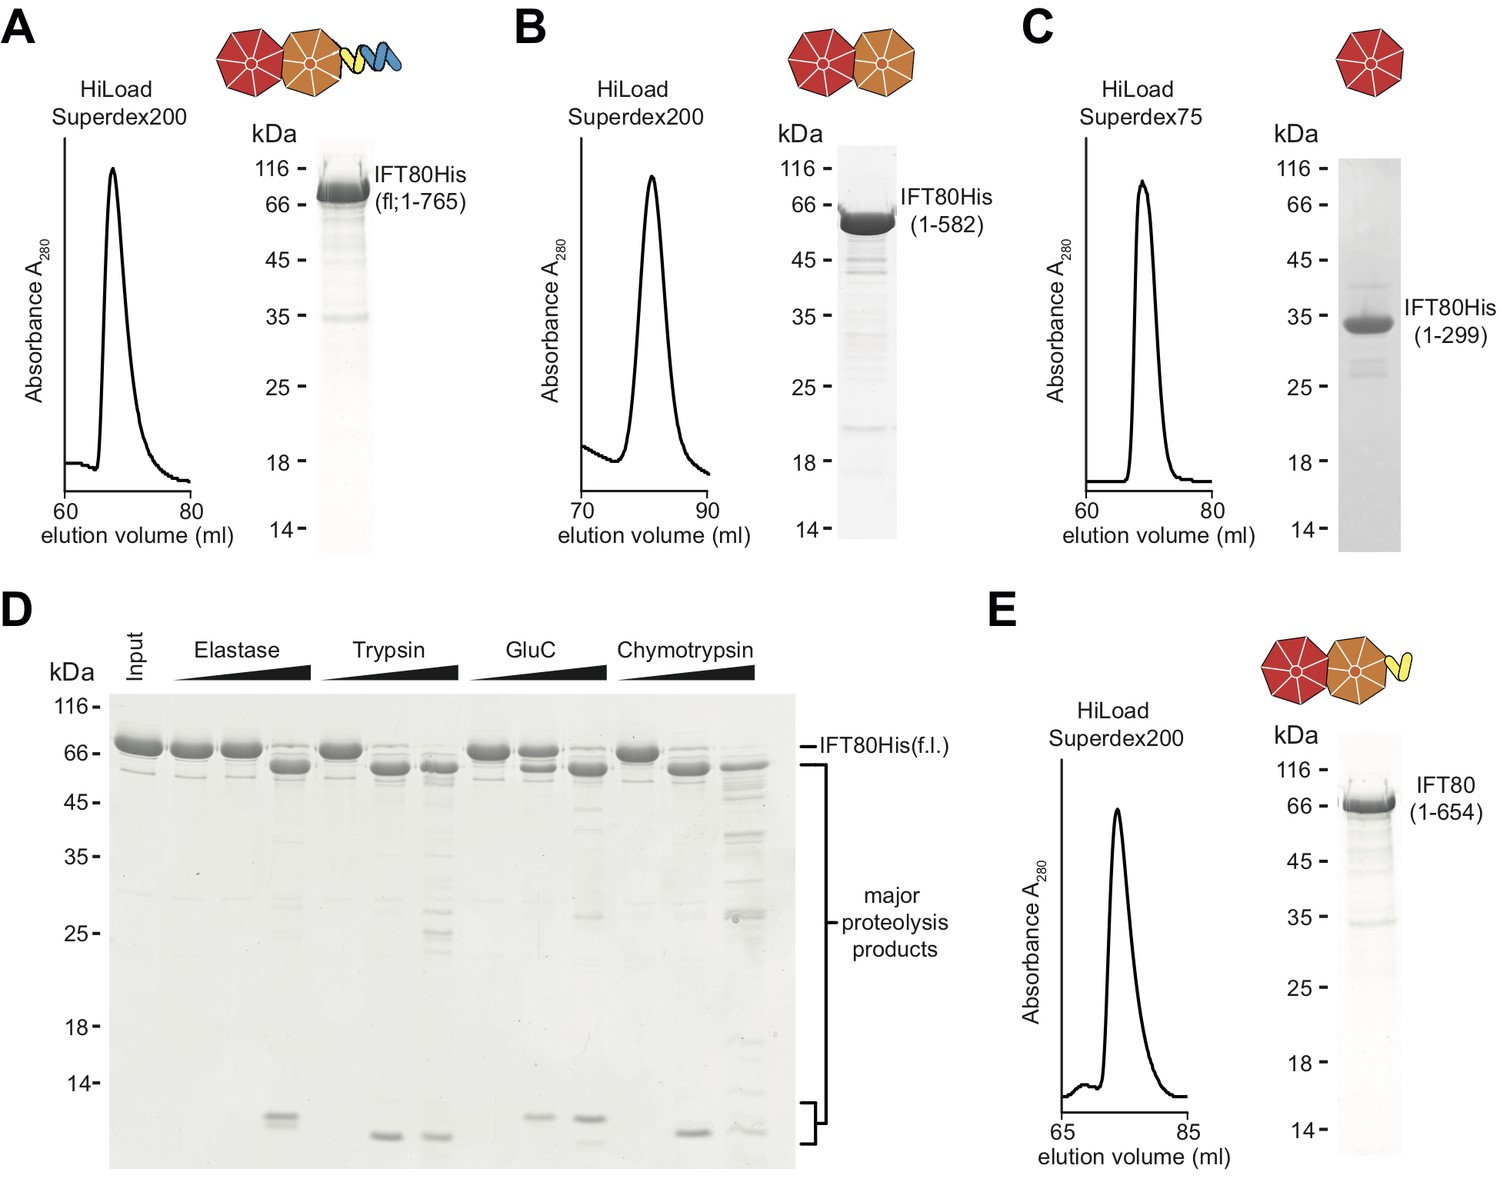
Purification of CrIFT80 constructs.
(A–C) SEC profiles (left) and corresponding Coomassie-stained SDS-PAGE pictures of CrIFT80 fragments designed based on domain prediction. A schematic representation of the proteins is shown above the gel picture for full-length CrIFT80 (residues 1–765) (A), CrIFT80 BP1-BP2 (residues 1–582) (B), and CrIFT80 BP1 (residues 1–299) (C). (D) Coomassie-stained SDS-PAGE gel showing the limited proteolysis results for full-length CrIFT80 treated with the proteases Elastase, Trypsin, GluC, and Chymotrypsin. The positions of the full-length protein as well as for the major proteolysis products are indicated. All proteases lead to the cleavage of the protein into stable fragments of similar sizes. (E) Large-scale proteolysis of CrIFT80 with the protease GluC followed by SEC (profile on the left) led to the identification by mass-spectrometry of a fragment encompassing residues 1–654. The Coomassie-stained SDS-PAGE gel on the right shows the purity of this product, and the schematic representation on top shows that it is composed of BP1 and BP2 followed by a short stretch of alpha-solenoid structure.
Figure 2 with 1 supplement
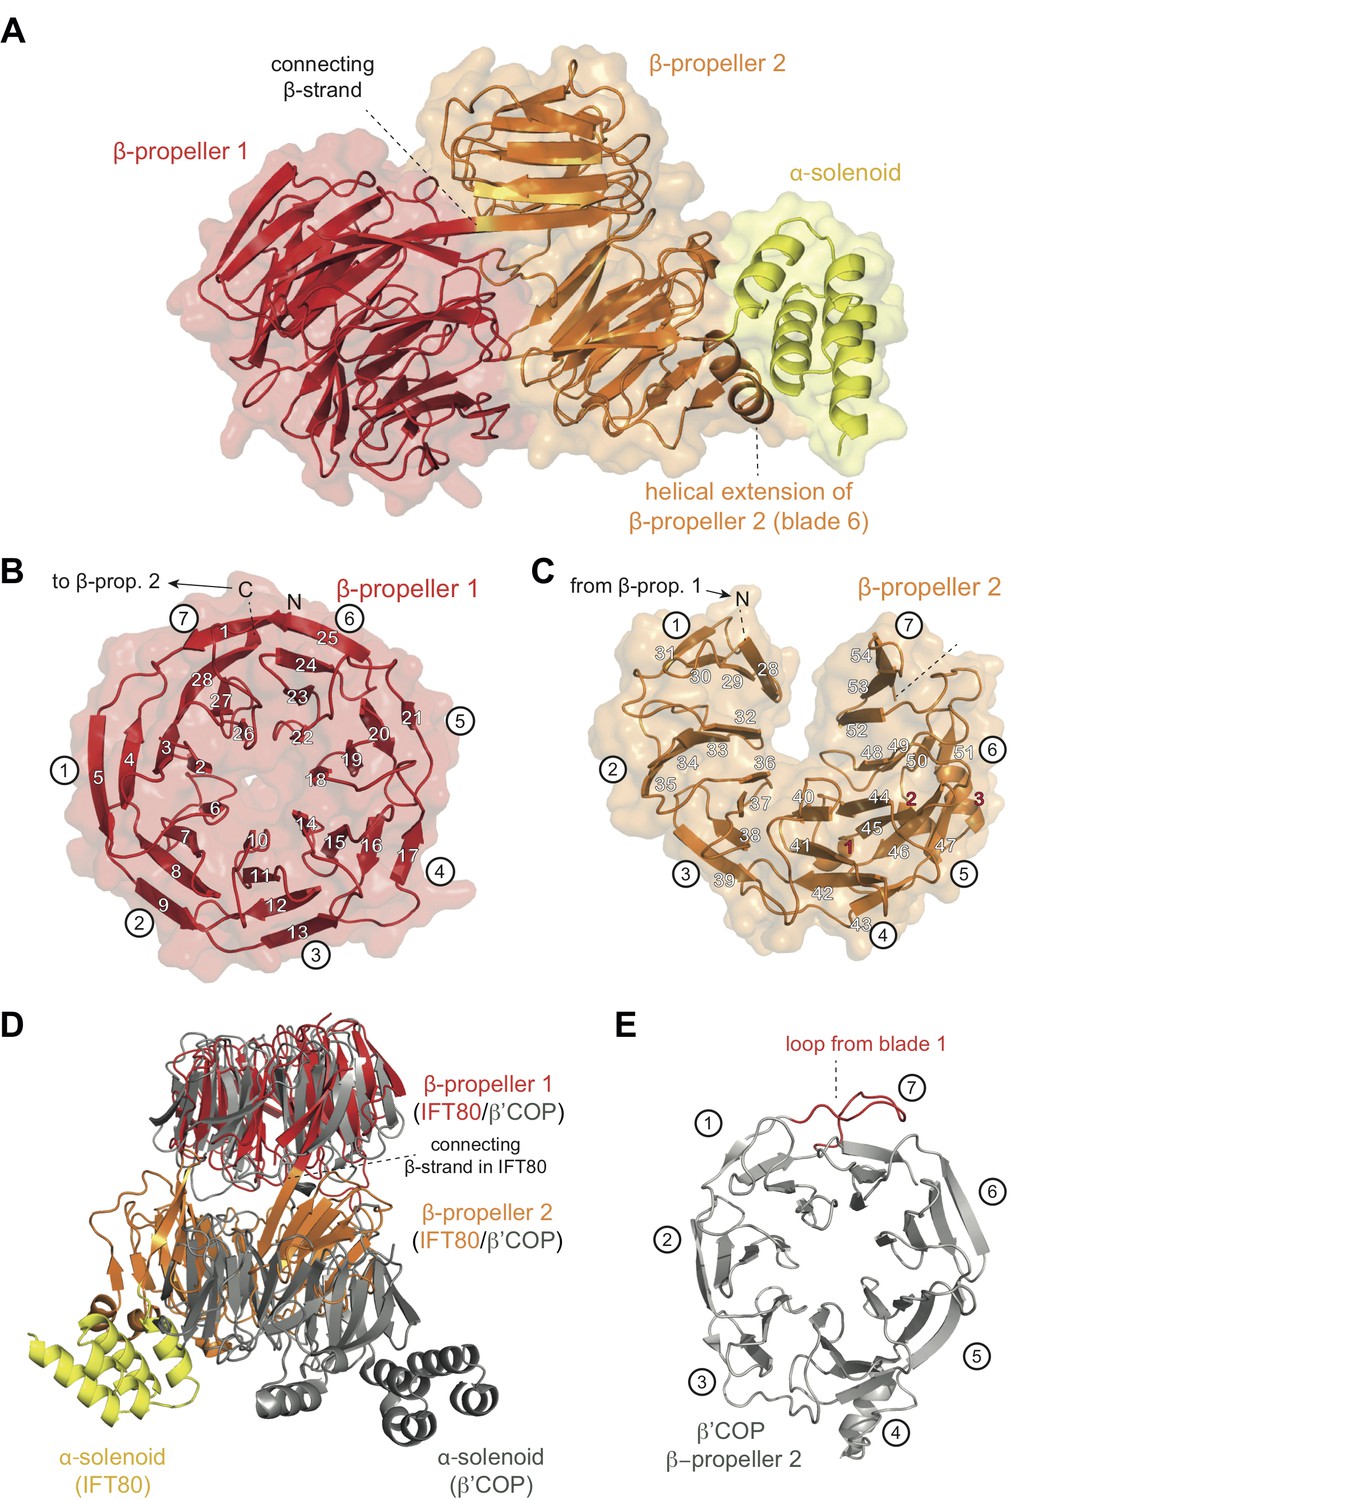
Crystal structure of the IFT80 protein.
(A) Structural overview showing the overall domain organization of CrIFT80. It contains two N-terminal β-propellers (coloured in red and orange) connected by a long strand and interacting with each other via several loops. A helical extension in β-propeller two keeps the C-terminal α-solenoid region (coloured in yellow) in position. (B) β-propeller one displays a canonical fold of a 7-bladed WD40 β-propeller. The most N-terminal β-strand forms the outermost strand of blade 7, effectively closing the ring-shaped structure by linking blade 7 to blade 1. Individual β-strands are numbered and the blade numbers are indicated in white circles. (C) β-propeller two displays an unusual open conformation where the incomplete blade seven lacks the outermost β-strand. Individual β-strands are numbered and the blade numbers are indicated in white circles. (D) Superpositioning of the CrIFT80 structure (coloured as in (A)) with the evolutionarily related β’COP protein (pdb: 3MKQ; coloured in grey). The two structures differ significantly with respect to the positions of β-propeller two as well as the α-solenoid C-terminus. (E) Isolated view on β-propeller 2 of β’COP (pdb:3MKQ, coloured in grey). Although this propeller also lacks the outermost strand in blade 7, it is closed by an extended loop in blade 1 (coloured in red).
Figure 2—figure supplement 1

Sequence alignment between IFT80 proteins from various species.
IFT80 sequences from six organisms were aligned using Clustal Omega (McWilliam et al., 2013), and the resulting aligment was visualized in ESPript (Robert and Gouet, 2014). Secondary structure elements derived form the structure of CrIFT80 presented in this work are shown in black above the alignment. Predicted secondary structure elements for the most C-terminal region for which no electron density was observed in the crystal are shown in grey. Red arrowheads below the alignment show the positions of mutated residues in ciliopathy patients with alterations in IFT80.
Figure 3 with 1 supplement
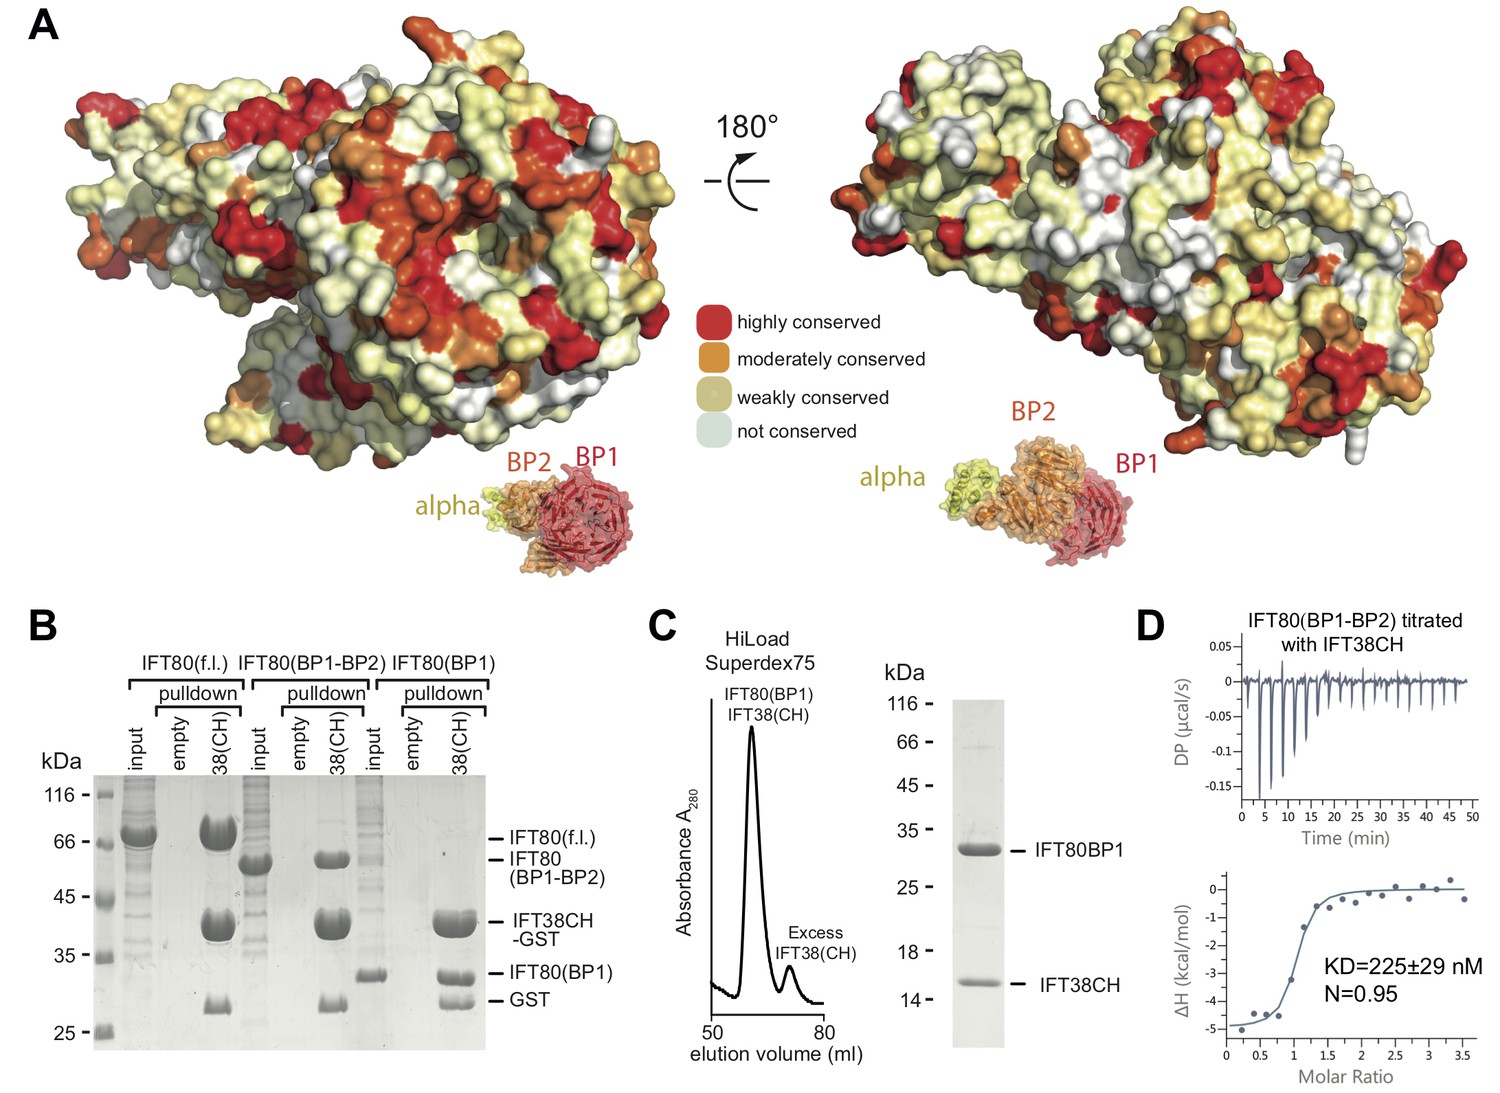
Interaction of the CrIFT38 CH domain with a conserved surface patch on CrIFT80 BP1.
(A) Mapping of evolutionarily conserved surface-residues onto the CrIFT80 crystal structure. Two orientations (related to each other by a 180° rotation) are shown. The schematic drawing below the structure indicates the relative positions of individual domains. In the orientation on the left, several highly conserved residues (forming a pronounced patch) are shown at the top of CrIFT80 BP1. (B) GST-pulldown assays showing that the CrIFT80 BP1 domain is sufficient for interaction with CrIFT38CH. (C) The CrIFT80(BP1)/CrIFT38CH complex can be reconstituted by SEC. After mixing CrIFT80(BP1) with a slight excess of CrIFT38CH, a peak for the stable complex is obtained (left), and SDS-PAGE analysis shows that the complex contains stoichiometric levels of the two proteins (right). (D) Isothermal titration calorimetry (ITC) analysis of the interaction of CrIFT38CH with CrIFT80(BP1-BP2). The two proteins form a complex with a dissociation constant of 225 nM.
Figure 3—figure supplement 1
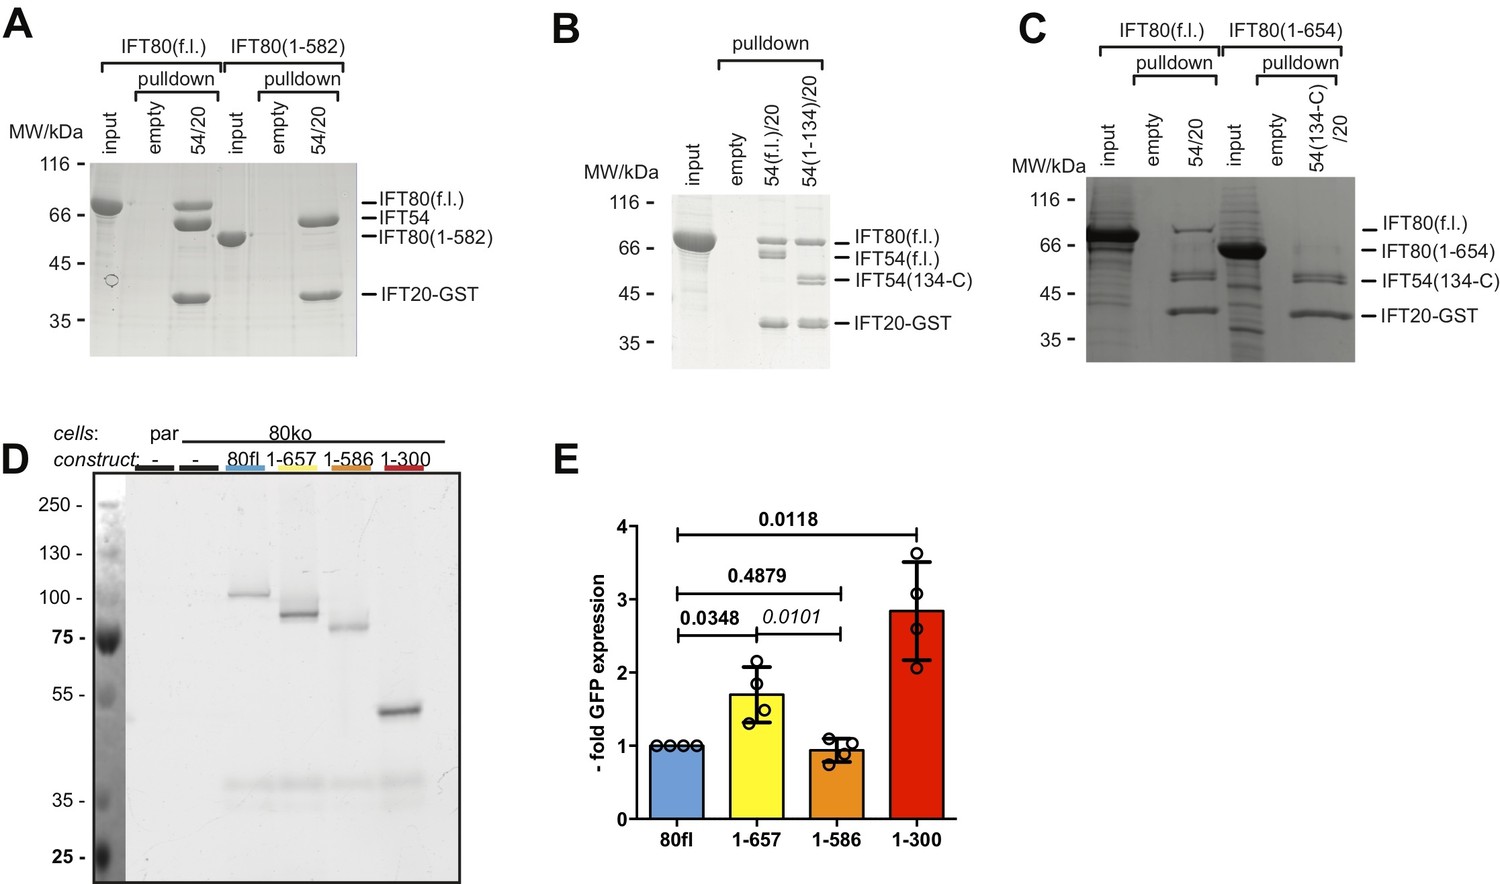
The C-terminus of IFT80 is required for IFT54/20 interaction.
(A) Pull-down of full-length and 1–582 CrIFT80 by CrIFT54-IFT20-GST demonstrating that the C-terminal residues (583 C) of IFT80 are required for the IFT54/20 interaction. (B) Pull-down demonstrating that the N-terminal CH-domain of IFT54 (residues 1–133) is not required for the interaction between IFT80 and IFT54/20. (C) Deletion of the C-terminal 655 C residues of IFT80 significantly reduces the interaction with IFT54/20 in GST pull-downs. (D) In-gel fluorescence measurement of GFP intensity in IMCD3 cells used in the rescue experiments in Ift80 null-mutant IMCD3 cells shown in Figure 9B and C. (E) Quantification of in-gel GFP fluorescence as shown in D), normalized to total protein amount and displayed as -fold intensity compared to IFT80fl. n = 4, mean ±SD, one-sample t-tests compared to 1 (bold) and paired t-test (italic).
Figure 4
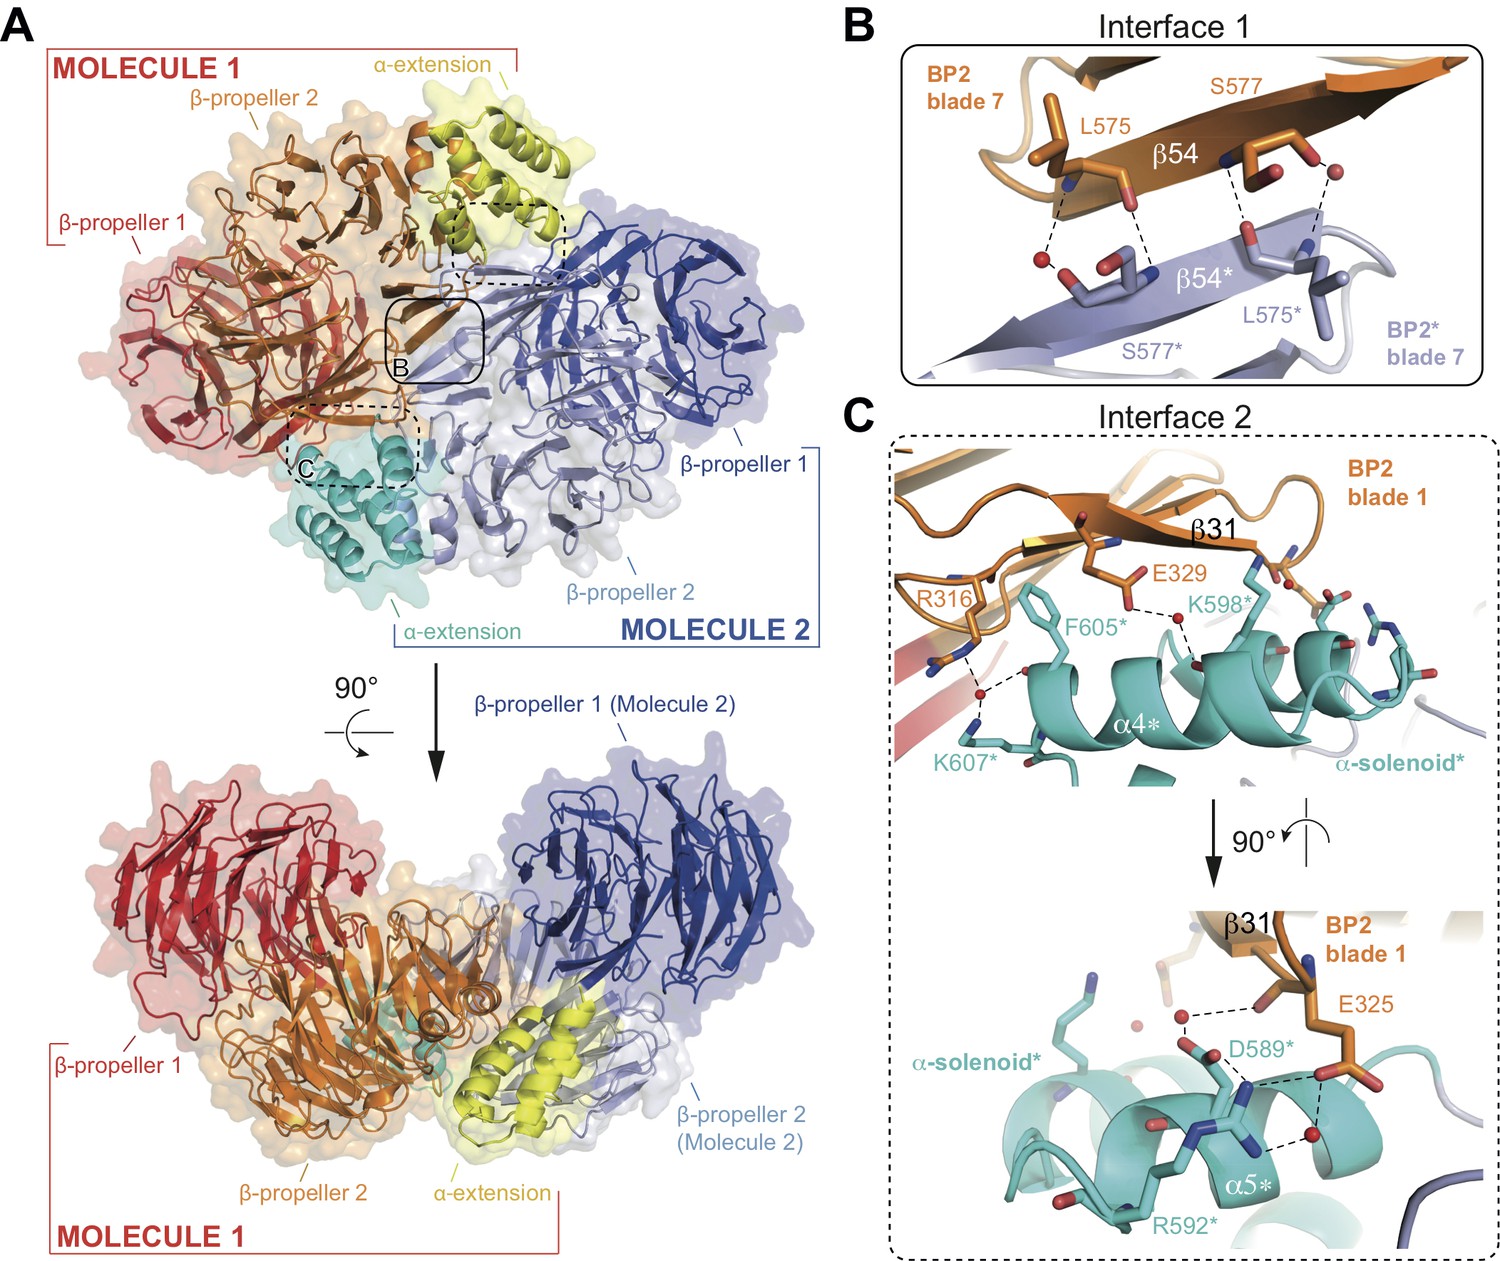
Structure of the CrIFT80 homo-dimer.
(A) Two views (related by a 90° rotation) on the IFT80 homodimer in cartoon representation with transparent surface. The two molecules are coloured in red/orange/yellow and dark blue/light blue/cyan for Molecule 1 and 2, respectively. Individual domains are labelled in the same colour. Two major interfaces hold the molecules together and are indicated by boxes. The solid box indicates the location of ‘interface 1’ (present only once in the dimer), and the dashed boxes indicate the locations of ‘interface 2’ (present twice due to symmetry). Zoom-in views on the interfaces are shown in (B) and (C). (B) Zoom-in view on interface 1, formed by backbone interactions between β-strand 54 from each of the two molecules. Asterisks after the labels of domains, secondary structure elements, and residues indicate that they are found on ‘Molecule 2’. The colour scheme is the same as in (A). Red spheres indicate water molecules. (C) Two perpendicular zoom-in views on interface 2, highlighting several interactions between the α-solenoid helices of Molecule two with BP2 blade 1 of Molecule 1. Asterisks after the labels of domains, secondary structure elements, and residues indicate that they are found on ‘Molecule 2’. The colour scheme is the same as in (A).
Figure 5

Analysis of the IFT80 homo-dimer by SEC and SAXS.
(A) SEC analysis (HiLoad Superdex200 column) of various constructs of CrIFT80. Full-length IFT80 elutes at different positions at low and high salt concentration (150 mM and 500 mM NaCl, respectively), indicating that the homo-dimer is salt-labile. This is consistent with the fact that most interactions between the molecules are hydrophilic (see Figure 4). Elution volumes and apparent Mw are indicated for each peak. As SEC is shape-dependent, the Mw values will deviate from the theoretical values. All peaks are far from the void volume of 45 mL for this particular column. The proteolysed IFT80 fragment (residues 1–654) elutes between the low- and high-salt peaks of full-length IFT80, consistent with a dimer, whereas the construct lacking the entire α-solenoid domain (IFT80 BP1-BP2) elutes at significantly lower molecular weight and is monomeric even at low salt concentrations. (B) P(r) vs. radius plot derived from SAXS analysis of full-length IFT80 at low and high salt concentrations (150 mM vs. 500 mM NaCl, respectively), indicating that an IFT80 dimer at low salt is broken up into monomers at high salt. (C) The SAXS envelope calculated for IFT80 at low salt concentrations (grey mesh) provides a much better fit to the crystal structure of the IFT80 homo-dimer (individual molecules shown in cartoon representation in red and blue, respectively), providing proof that IFT80 exists as a homo-dimer in solution at 150 mM NaCl. (D) The SAXS envelope calculated for IFT80 at high salt concentrations (grey mesh) fits better to the crystal structure of a monomeric form of IFT80 (shown in cartoon representation in red), indicating the dimer is broken up into monomers at 500 mM NaCl. Extra density in the SAXS envelope likely corresponds to the C-terminus of IFT80, which is not present in the crystallographic model.
Figure 6
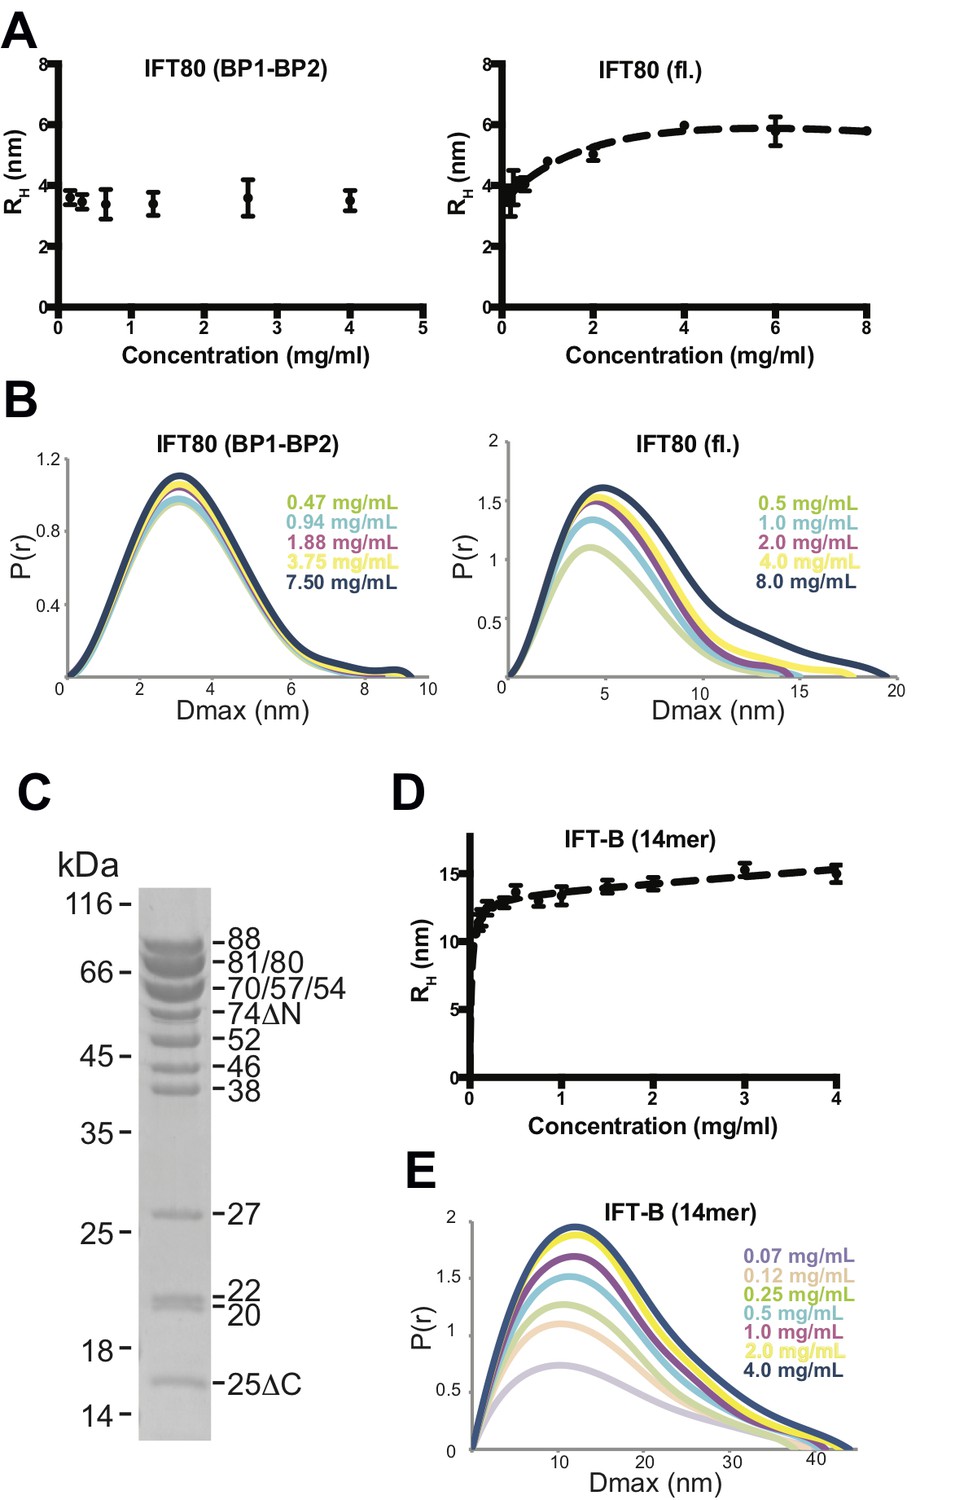
Analysis of IFT80 and the IFT-B complex by DLS and SAXS.
(A) (left) DLS analysis of the IFT80 (BP1-BP2) construct shows that the hydrodynamic radius (RH) is consistent with a monomeric form of the protein, and does not change with increasing concentration. (right) DLS analysis of full-length IFT80 indicates that the radius increases at higher concentrations, consistent with a concentration-dependent IFT80 homo-dimerization. (B) SAXS analysis (P(r) vs. Dmax plots indicates that whereas the Dmax of full-length IFT80 increases with increasing concentration (right), this is not the case for the truncated IFT80 (BP1-BP2) construct (left), confirming the results obtained by DLS shown in (A). (C) Coomassie-stained SDS-gel showing the purity of the reconstituted 14-subunit IFT-B complex used for the experiments shown in (D) and (E). (D) DLS analysis of a 14-subunit IFT-B complex containing IFT80 shows a concentration-dependent increase of the hydrodynamic radius, indicating IFT-B dimerization. (E) SAXS analysis (P(r) vs. Dmax plot) also indicates IFT-B dimerization at increasing protein concentrations, paralleling the DLS result shown in (D).
Figure 7 with 5 supplements

IFT80 is absolutely required for ciliary axoneme assembly.
(A) Complete absence of acetylated tubulin staining in IMCD3 cells carrying biallelic Ift80 frameshift mutations is rescued following transfection of human IFT80. (B) Super-resolution microscopy showing mIFT80-GFP IFT trains within cilia, co-localising with ciliary membrane marker ARl13b. (C) For the p.C288fs/pG289fs mutant clone, transfection of mouse IFT80-GFP is shown. Note that only GFP +cells produce cilia, while adjacent GFP- cells have a basal body but no cilia, demonstrating a cell autonomous requirement for IFT80.
Figure 7—figure supplement 1
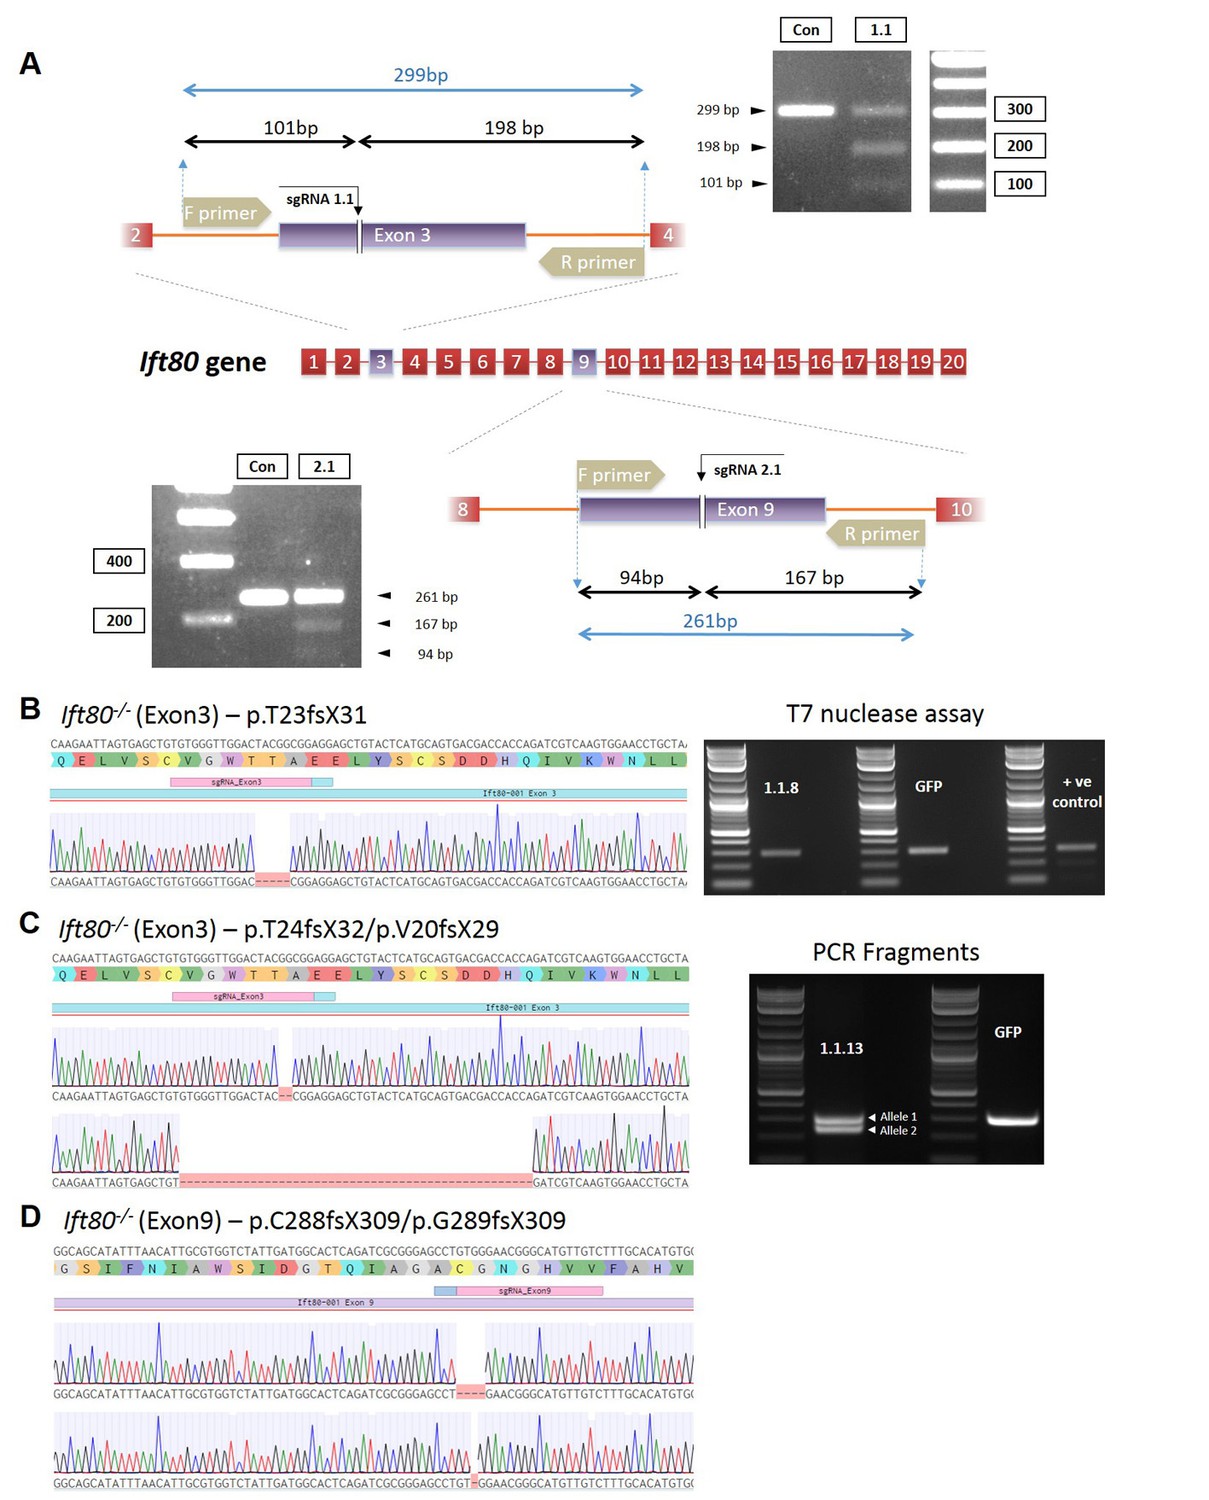
Characterization of Ift80 mutant cell clones.
(A) Schematics showing the targeting strategy using gRNAs in exons 3 or 9 of mouse ift80. Also shown is the PCR design for assaying for mutations. (B–D) Genotyping data for the three clonal cell lines characterized in detail in the current study. Left, sequencing chromatograms showing the particular mutations introduced. (B) Right, agarose gel showing T7 endnuclease I assay of the clone (1.1.8) or wild-type cells transfected with GFP alone. No heteroduplexes are detected, showing that the mutation is homozygous or hemizygous. Positive control shows a cell line heterozygous for a mutation in Ift80 showing the presence of heteroduplexes. (C) Right, agarose gel showing PCR amplification of exon 3 for clone 1.1.13, demonstrating the presence of two deletion alleles, as confirmed by Sanger sequencing.
Figure 7—figure supplement 2
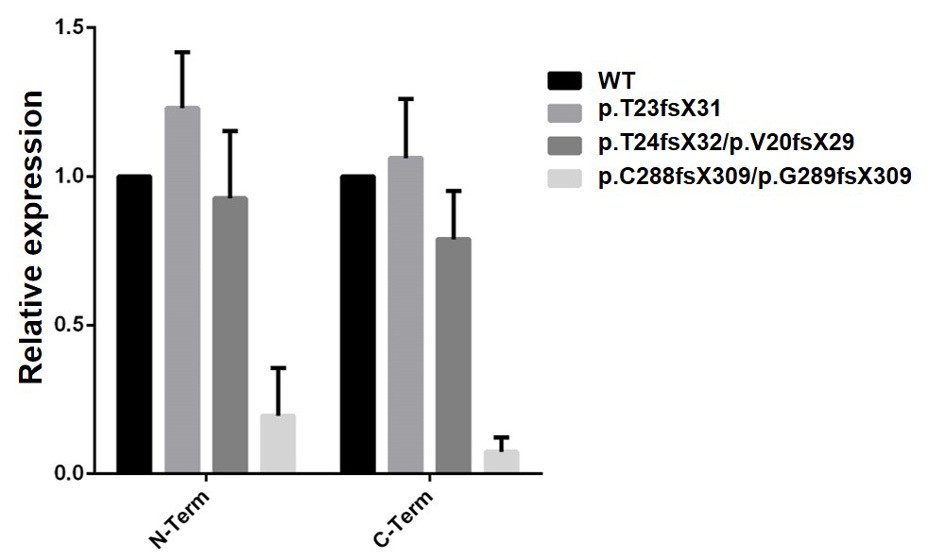
Analysis of WT and mutant cell clones by qRT-PCR.
Two independent primer sets in 5’ (N-ter) and 3’ (C-ter) parts of the gene were used. Transcript instability is noted for the cell clone carrying a mutation in exon 9, but not for the two clones located in exon 3. An alternative Ift80 transcript has been annotated, which is initiated at an internal ATG codon and lacks the first 137 amino acids, which encodes the first half of BP1. This transcript lacks the IFT38 binding domain, thereby encoding a likely non-functional protein, and explaining why the exon three mutations do not lead to transcript instability.
Figure 7—figure supplement 3

Analysis of ciliogenesis in multiple mutant cell clones.
Lower power images show many cells in the field of view for three independent clones. Every cell lacks cilia but retains a single basal body. Far right image shows confocal images at higher magnification. For the p.C288fs/pG289fs mutant clone, transfection of IFT80-GFP is shown. Note that only GFP +cells produce cilia, showing a functional rescue.
Figure 7—figure supplement 4
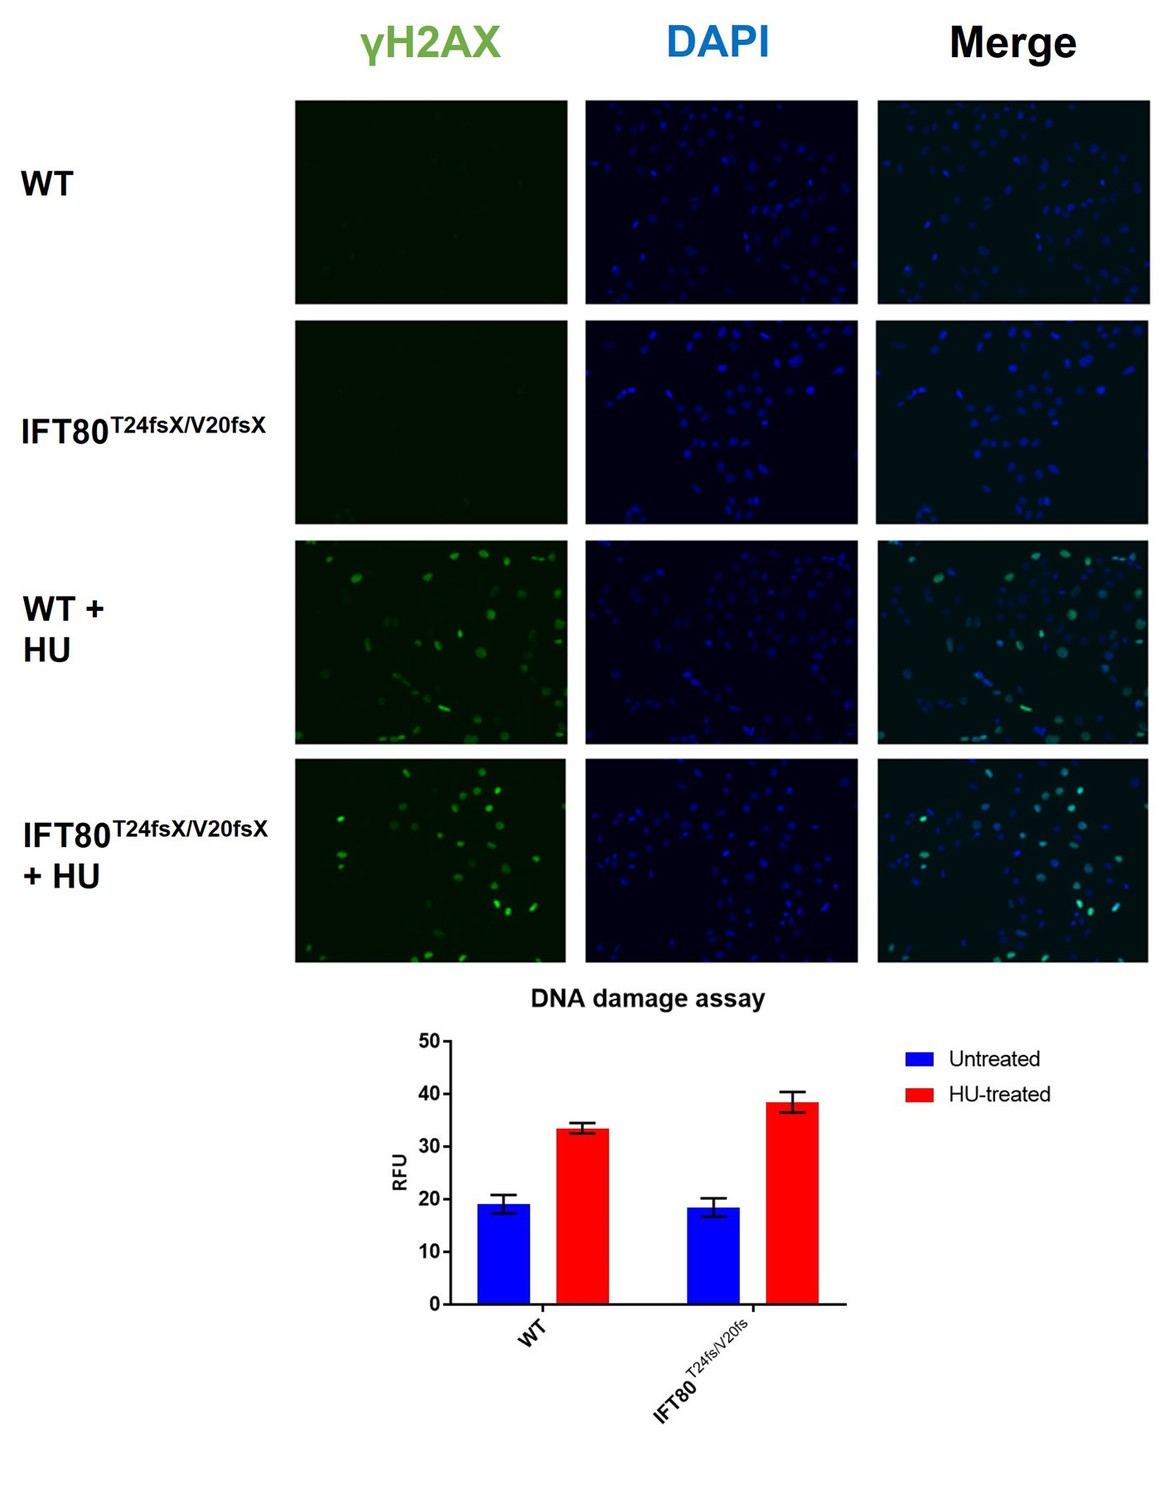
Quantification of DNA damage by H2AX staining.
As a positive control, cells were treated with hydroxy-urea, to induced DNA damage. N = 3 biological replicates, error bars are SEM. No difference between WT and KO cells was observed without (p-value=0.82; t-test) or with (p-value=0.09; t-test).
Figure 7—figure supplement 5
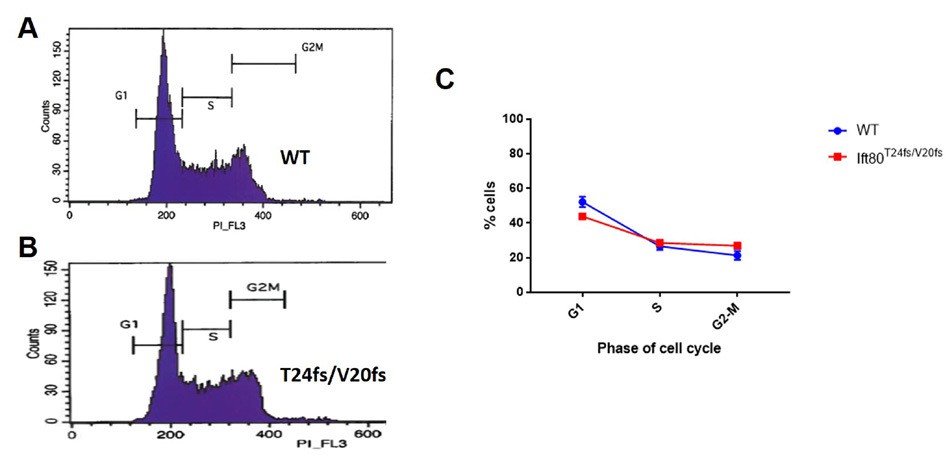
Analysis of cell cycle.
Propidium iodide staining/FACS was used to measure DNA content of >10,000 cells per replicate. N = 3 biological replicates; error bars are SEM. No significant difference is noted (Chi-square = 3.09, DF = 2. p-value=0.213, two tail test).
Figure 8 with 3 supplements

Functional analysis of IFT80 missense mutations.
(A) Immunoflourescence analysis of Ift80 KO cells showing that 100% of cells exhibit reduced ciliary membrane formation (Arl13b staining), while basal body formation (γ-tubulin) is unaffected. (B) Failed ciliogenesis in Ift80 KO cells is fully rescued following transfection of WT and missense mutant forms of IFT80-GFP. Punctate staining for IFT80-GFP is observed for all variants, representing IFT trains. (C) Quantification of cilia length (Arl13b) shows that transfection of untagged WT mIFT80 rescues failed ciliogenesis to the same degree as mIFT80-GFP. All mutants rescued ciliogenesis to the same degree as WT (n = 3 biological replicates; error bars are standard deviations). (D) Quantification of the proportion of GFP +cilia co-localizing with Arl13b staining following transfection of different mIFT80-GFP point mutations. (n = 3 biological replicates; error bars are standard errors of the mean; t-test).
Figure 8—figure supplement 1
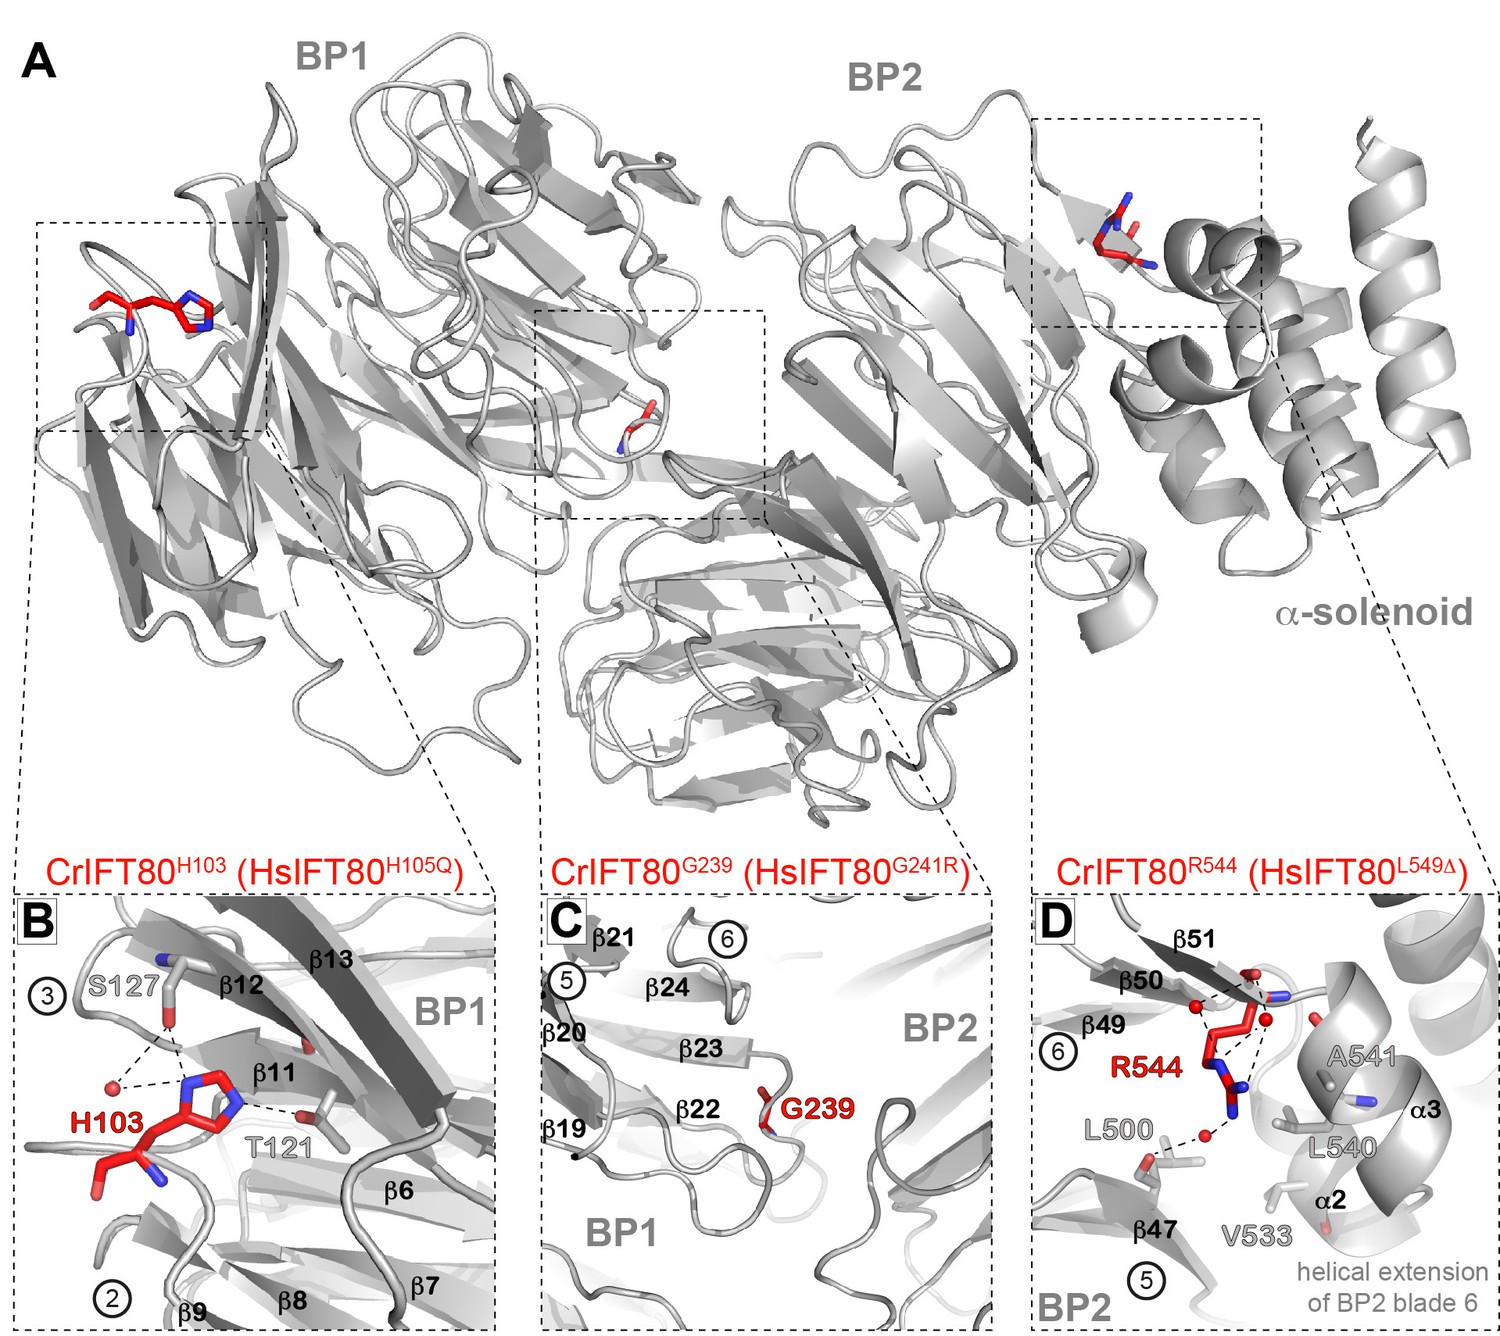
Structural analysis of IFT80 residues mutated in human ciliopathy patients.
(A) Localization of three residues found to be mutated in patients with skeletal cilipathies in the structure of CrIFT80. The overall IFT80 structure is shown in grey in cartoon representation, the amino-acids mutated in the patients are shown as red sticks. The dashed boxes indicate the region shown in detail in (B–E). (B) CrIFT80 H103 (corresponding to the human H105Q mutation) is located in a loop connecting BP1 blades 2 and 3, and participates in BP1 stability by forming electrostatic contacts with T121 and S127 in blade 3. (C) CrIFT80 L141 (corresponding to the human L143S mutation) is located in blade 3 of BP1and contributes to BP1 stability by hydrophobic interactions with a number of conserved hydrophobic residues in blade 4 (L173, K171, L160). (D) CrIFT80 G239 (corresponding to the human G241R mutation) sits in a loop in blade 6 of BP1 and is oriented towards the BP1/BP2 interface. Due to limited space the mutation to an arginine will alter the relative orientation of BP1 and BP2. (E) CrIFT80 R544 (corresponding to the human L549Δ mutation) is located at the beginning of a strand in BP2 blade 6, in close proximity to the helical blade six extension which keeps the IFT80 α-solenoid in place by hydrophobic contacts.
Figure 8—figure supplement 2
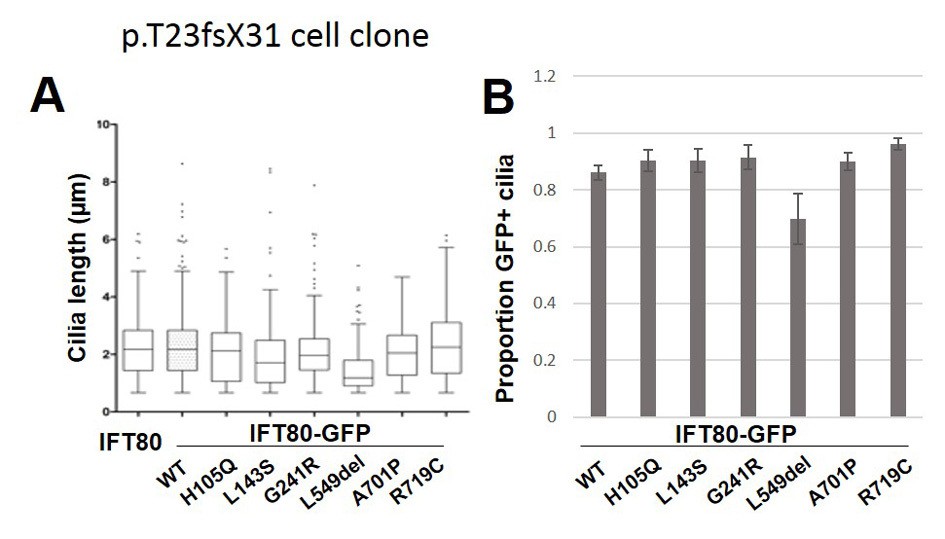
Quantification of functional rescue experiments in a second independent Ift80 mutant cell clone.
(A) Quantification of cilia length (Arl13b) shows that transfection of untagged WT mIFT80 rescues failed ciliogenesis to the same degree as mIFT80-GFP in a cell clone homozygous for the p.T23fsX31 mutation. All mutants rescued ciliogenesis to the same degree as WT (n = 3 biological replicates; error bars are standard deviations). (D) Quantification of the proportion of GFP +cilia co-localizing with Arl13b staining following transfection of different mIFT80-GFP point mutations. (n = 3 biological replicates; error bars are standard errors of the mean).
Figure 8—figure supplement 3
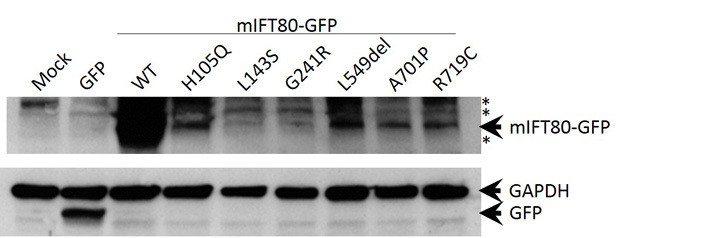
Western blot analysis of wild-type and missense mutant forms of mIFT80-GFP.
Mock and GFP transfected cells serve as controls distinguishing specific and non-specific bands. Arrowheads indicate specific bands at 26.9 kDa (GFP), 37 kDa (GAPDH) and 106.9 kDa (mIFT80-GFP). GAPDH serves as a loading control. Asterisks indicate non-specific bands present in control lanes.
Figure 9
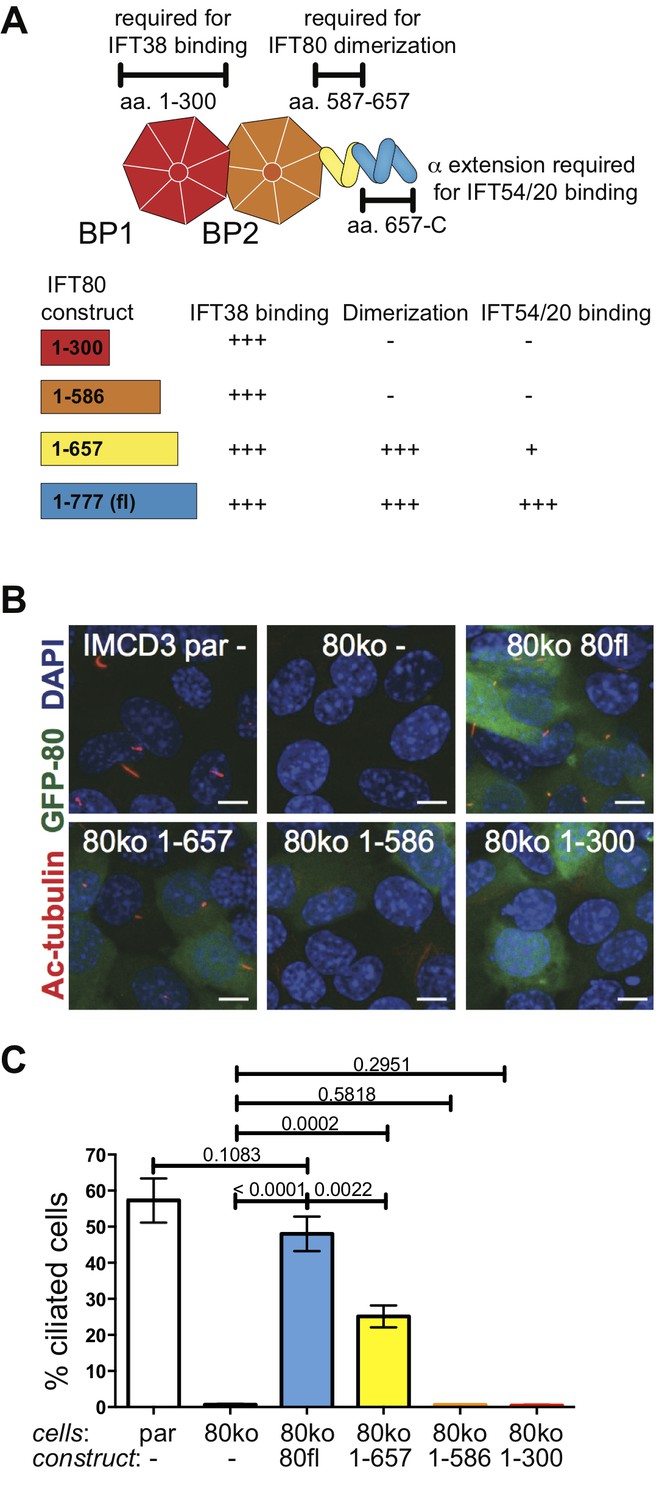
IFT80 dimerization domain is required for proper ciliogenesis in IMCD3 cells.
(A) Schematic of the human IFT80 protein architecture with the various functions of domains assigned according to the data presented in Figures 3–6. (B) Representative fluorescent microscopy images of parental (par) IMCD3 cells and IMCD3 cells with IFT80 knocked out by CRISPR/Cas (80ko) and rescue experiments with various human IFT80 constructs tagged with GFP (green) stained for cilia with acetylated tubulin antibody (red) and for nuclei with DAPI (blue). Scale bars represent 10 μm. (C) Quantification of the IMCD3 ciliogenesis rescue experiment shown in B (n = 3, biological replicates with at least 400 cells analyzed from four random areas, mean ±SD, unpaired t-tests).
Figure 10
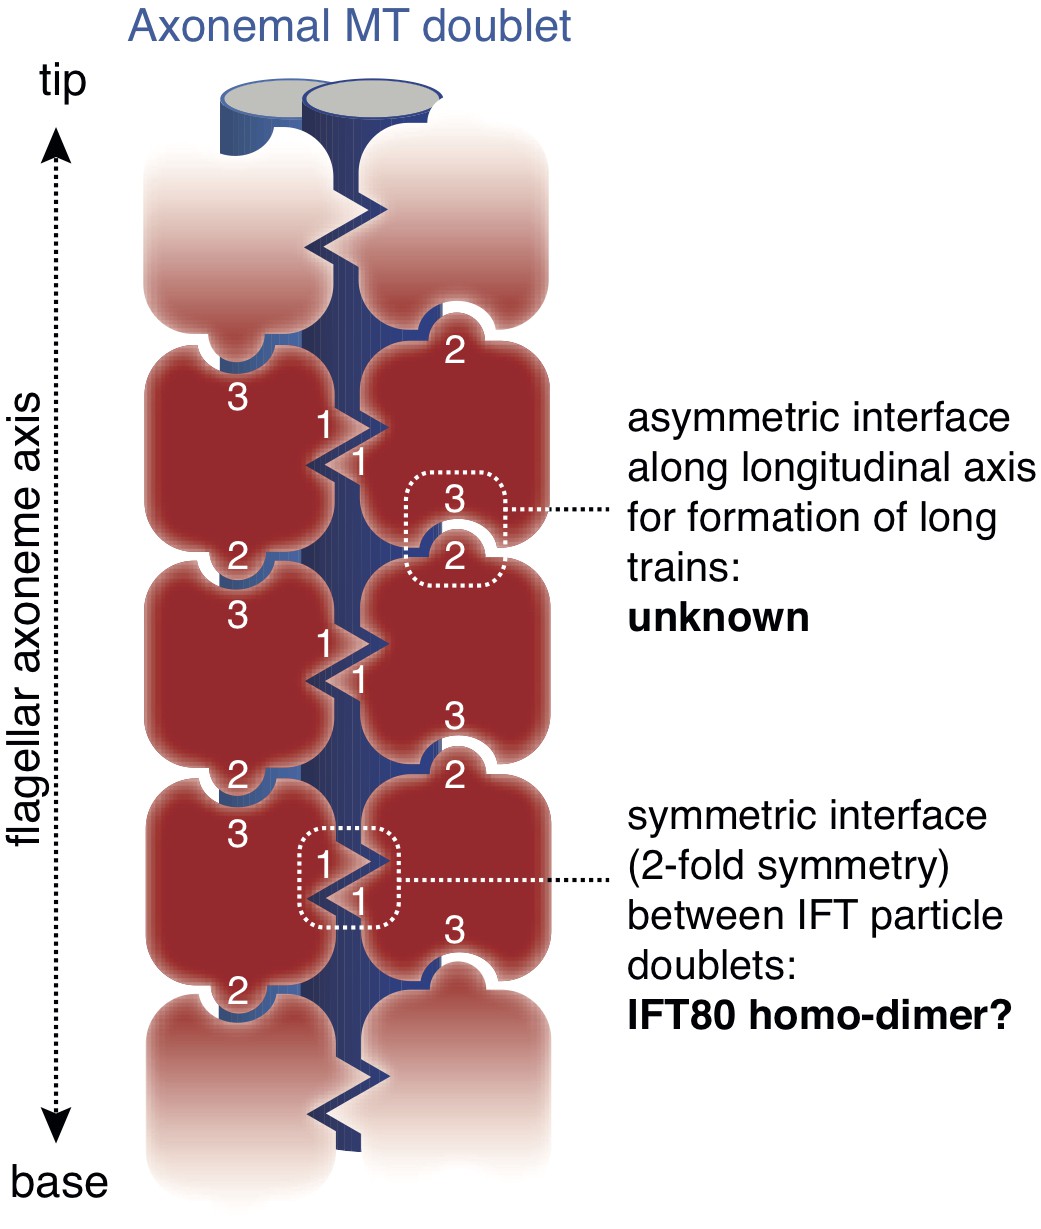
Model for the putative role of IFT80 the formation of IFT trains.
Electron tomography reconstructions of IFT trains in situ in Chlamydomonas reinhardtii flagella showed doublets of IFT particles repeated in a head-to-tail fashion along the longitudinal axis of the flagellar axoneme (Pigino et al., 2009). The 2-fold symmetry at the interface between particle doublets might be explained by homo-dimerization of the IFT complex through IFT80 (indicated with number ‘1’). However, IFT80 homo-dimerization cannot explain the head-to-tail arrangement of IFT particles, as this relies on an asymmetric interface (indicated with numbers ‘2’ and ‘3’).
Author response image 1
IFT80 Western blots.
Western blots performed on lysates of parental and Ift80null mIMCD-3 cells expressing human truncation mutants using various conditions and antibody concentrations could not detect mouse or human IFT80. Two representative Western blots are shown using anti-IFT80 antibodies #25230-1-AP from ProteinTech (A) or #PAB15842 from Abnova (B). The expected molecular weight of endogenous human IFT80, which should be expressed in the parental cell line (left lane) is indicated by a red arrowhead.
Tables
Table 1
X-ray data collection and refinement statistics
https://doi.org/10.7554/eLife.33067.005| CrIFT801-654 EMP soak | CrIFT80 (fl) native | |
|---|---|---|
| PDB code | 5N4A | |
| Data collection and scaling | Anomalous signal from Hg to ~ 4 Å | |
| Wavelength (Å) | 1.0077 | 1.0000 |
| Resolution range (Å) | 50–2.98 (3.13–2.98) | 47–1.79 (1.90–1.79) |
| Space group | P3112 | C2221 |
| Unit cell (Å) | a = 139.2 b = 139.2 c = 147.7 α = β = 90 γ = 120.0 | a = 82.8 b = 195.4 c = 117.5 α = β = γ = 90.0 |
| Total reflections | 1356277 (160974) | 718465 (109362) |
| Unique reflections | 33336 (4251) | 173548 (27521) |
| Multiplicity | 40.7 (37.9) | 6.6 (6.3) |
| Completeness (%) | 99.5 (96.5) | 99.5 (97.3) |
| Mean I/sigma(I) | 19.8 (2.8) | 11.3 (1.0) |
| R-merge | 0.225 (1.82) | 0.095 (1.40) |
| CC½ | 0.999 (0.817) | 0.998 (0.435) |
| Refinement | ||
| Number of reflections | 173479 (27521) | |
| Number of atoms (non-solvent) | 5286 | |
| Water (solvent) | 768 | |
| R-work | 0.175 (0.324) | |
| R-free | 0.208 (0.351) | |
| Ramachandran favoured (%) | 97.14 | |
| Ramachandran allowed (%) | 2.81 | |
| Ramachandran outliers (%) | 0.15 | |
| RMS bonds (Å) | 0.0074 | |
| RMS angles (°) | 1.1 | |
| Rotamer outliers (%) Clashscore | 1.2 13.2 | |
| Average B- Factors (Å2) | 28.2 |
Table 2
Small-angle X-ray scattering (SAXS) data
https://doi.org/10.7554/eLife.33067.010| Data-collection parameters | |||||
|---|---|---|---|---|---|
| Instrument: | ESRF BM29 | ||||
| Wavelength (Å) | 0.99 | ||||
| q-range (Å−1) | 0.0032–0.49 | ||||
| Sample-to-detector distance | 2.867 m | ||||
| Exposure time (sec/frame) | 1 | ||||
| Temperature (K) | 283 | ||||
| Detector | Pilatus 1M (Dectris) | ||||
| Flux (photons/s) | 1 × 10¹² | ||||
| Beam size (µm2) | 172 × 172 | ||||
| Structural parameters | IFT80 | IFT80(BP1-BP2) | IFT80 | ||
| Type of experiment | SEC SAXS | SEC SAXS | Concentration series | Concentration series | |
| Concentration used (mg/mL) | 2 | 2 | 0.47–7.5 | 0.5–8.0 | |
| NaCl concentration (mM) | 150 | 500 | 150 | 150 | |
| From* | Rg (Å) | 38.7 | 34.7 | 26.2 | 41.4–55.7 |
| p(r)* | Dmax (Å) | 122 | 114 | 86.1 | 140.4–194.4 |
| Porod volume Vp x103 (Å3) | 210.8 | 119.8 | 94.3 | 216–347 | |
| Molecular mass (kDa) from Vp | 131.8 | 74.8 | 58.9 | 126–202 | |
| Molecular mass (kDa) from sequence | 170 (dimer) | 85 (monomer) | 65 | 85 | |
| Modeling | |||||
| Dammif | NSD† | 0.597 | 0.795 | ||
-
*distance distribution function
†normalized spatial discrepancy between the 10 calculated models
Additional files
-
Transparent reporting form
- https://doi.org/10.7554/eLife.33067.024
Download links
A two-part list of links to download the article, or parts of the article, in various formats.
Downloads (link to download the article as PDF)
Open citations (links to open the citations from this article in various online reference manager services)
Cite this article (links to download the citations from this article in formats compatible with various reference manager tools)
Crystal structure of intraflagellar transport protein 80 reveals a homo-dimer required for ciliogenesis
eLife 7:e33067.
https://doi.org/10.7554/eLife.33067


