Determining the genetic basis of anthracycline-cardiotoxicity by molecular response QTL mapping in induced cardiomyocytes
- Stanford University, United States
- University of Chicago, United States
- Mayo Clinic, United States
Figures
Figure 1 with 8 supplements

The transcriptomic response of cardiomyocytes to doxorubicin is substantial.
(a) Cardiomyocytes were derived from lymphoblastoid cell lines (LCLs) of 45 Hutterite individuals, followed by exposure to differing concentrations of doxorubicin and RNA-sequencing. (b) PCA of gene expression levels across samples reveals that doxorubicin concentration explains more variance than inter-individual differences, and that the response is non-linear with respect to concentration. Lines connect samples from the same individual. (c) A probabilistic mixture model uncovers six distinct patterns of response across genes.
Figure 1—figure supplement 1
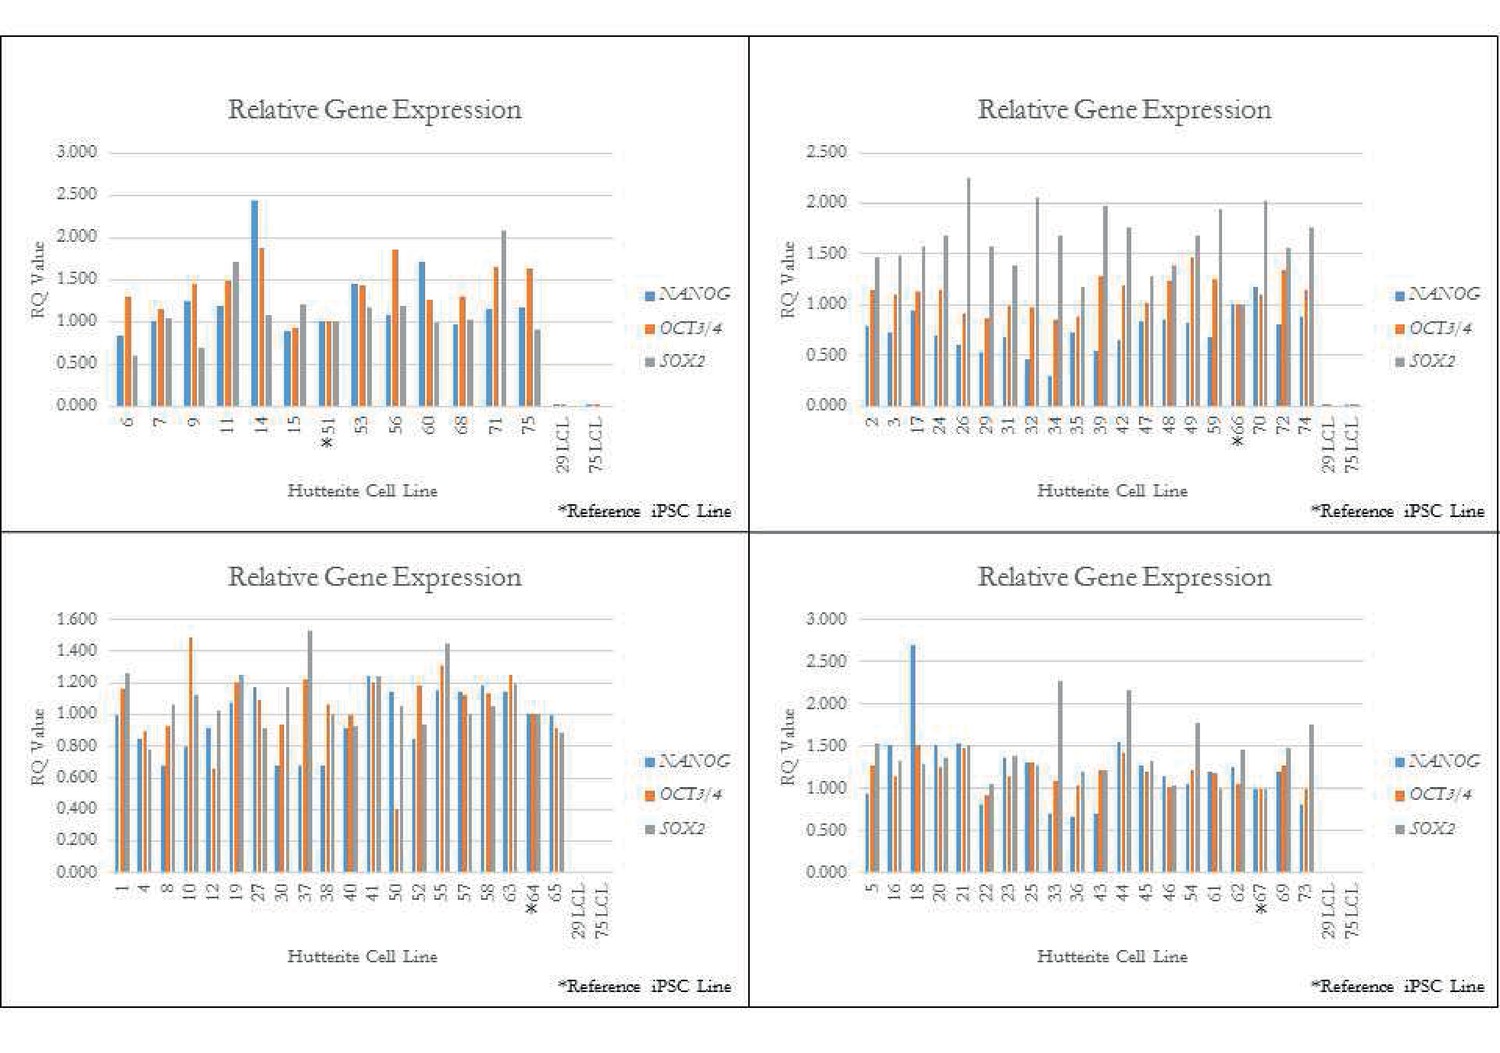
qPCR for key pluripotency genes for a subset of iPSCs.
qPCR quality control of iPSC lines. Quantitative PCR (qPCR) of pluripotency genes OCT3/4, NANOG, and SOX2 on randomly selected Hutterite iPSC lines (denoted by *). Relative expression is the RQ value with respect to GAPDH expression, with error bars representing the calculated min and max RQ value. All iPSC lines show endogenous expression of these pluripotency genes. Two original LCL lines are included as control and show little or no expression of pluripotency genes.
Figure 1—figure supplement 2
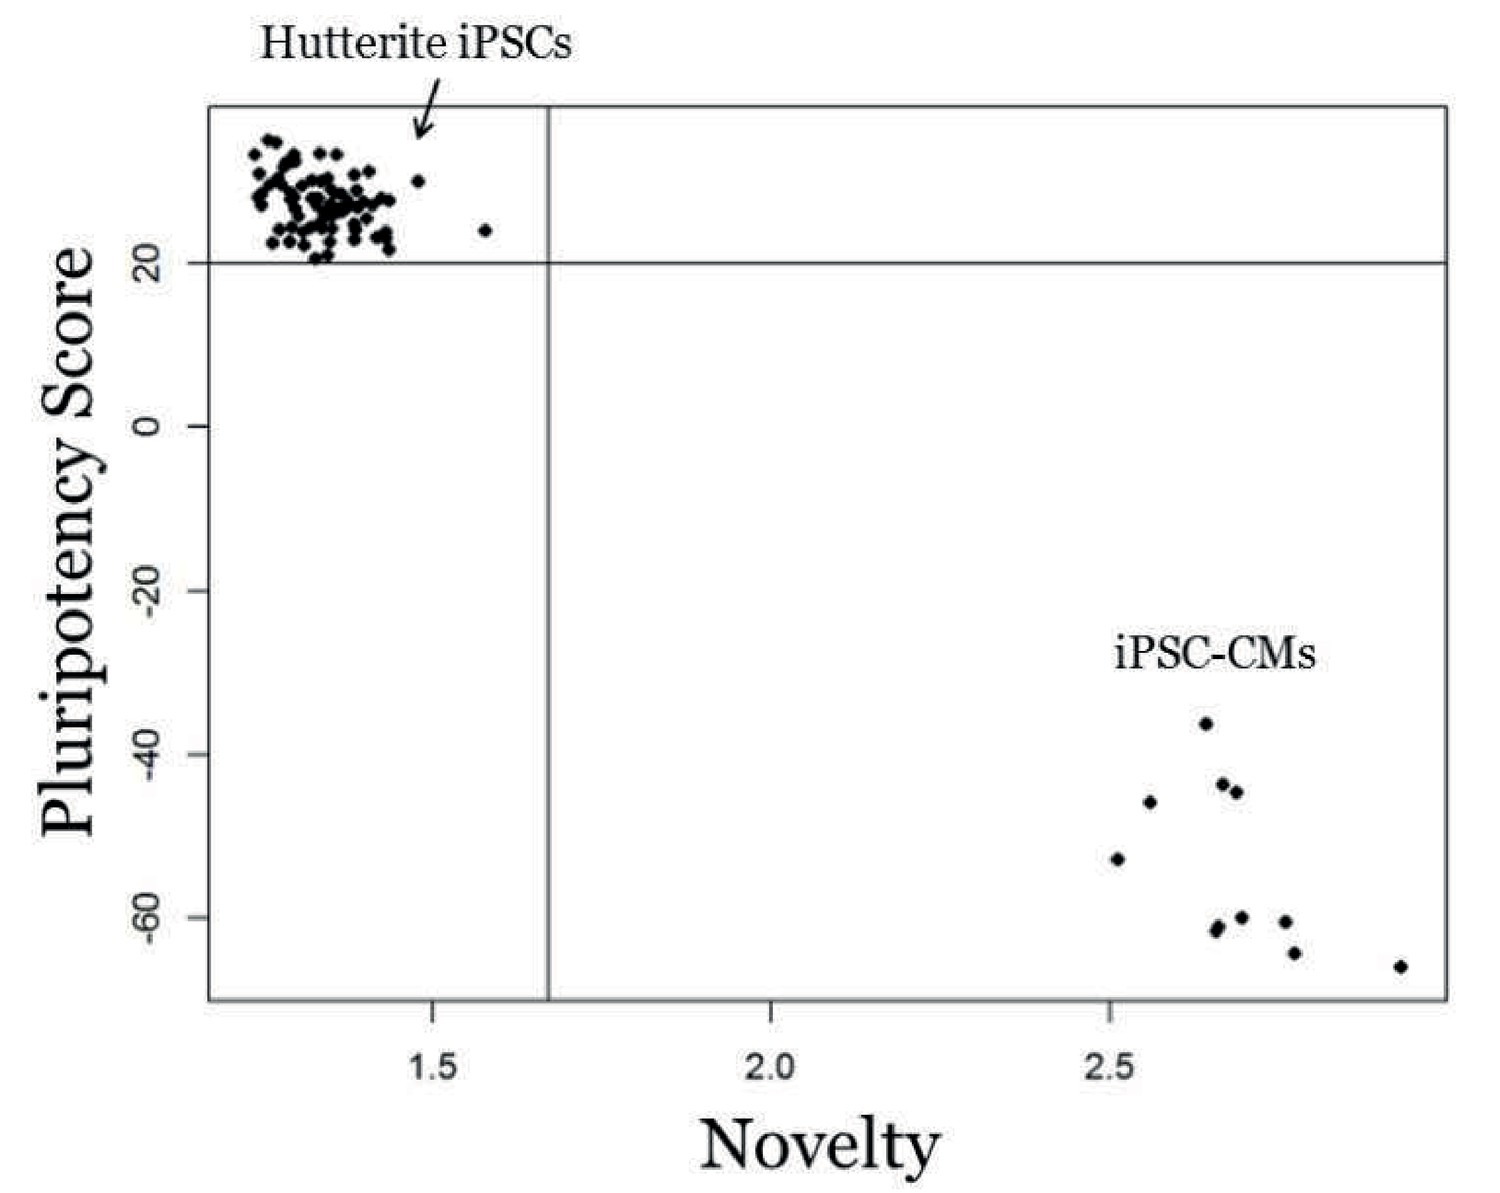
Genome-wide expression analysis of iPSCs using PluriTest.
PluriTest quality control of iPSCs. PluriTest pluriscore and novelty results shows all iPSC samples fall within the pluripotent and novelty threshold (black lines). All cell lines received a pluripotency score above the pluripotency classification threshold of 20 (average = 27.38) and showed low novelty scores below the threshold of 1.67 (average = 1.34). As a comparison, a subset of the iPSC-cardiomyocytes fall outside of the pluripotency classification for both pluriscore and novelty.
Figure 1—figure supplement 3
EBV integration analysis of iPSCs.
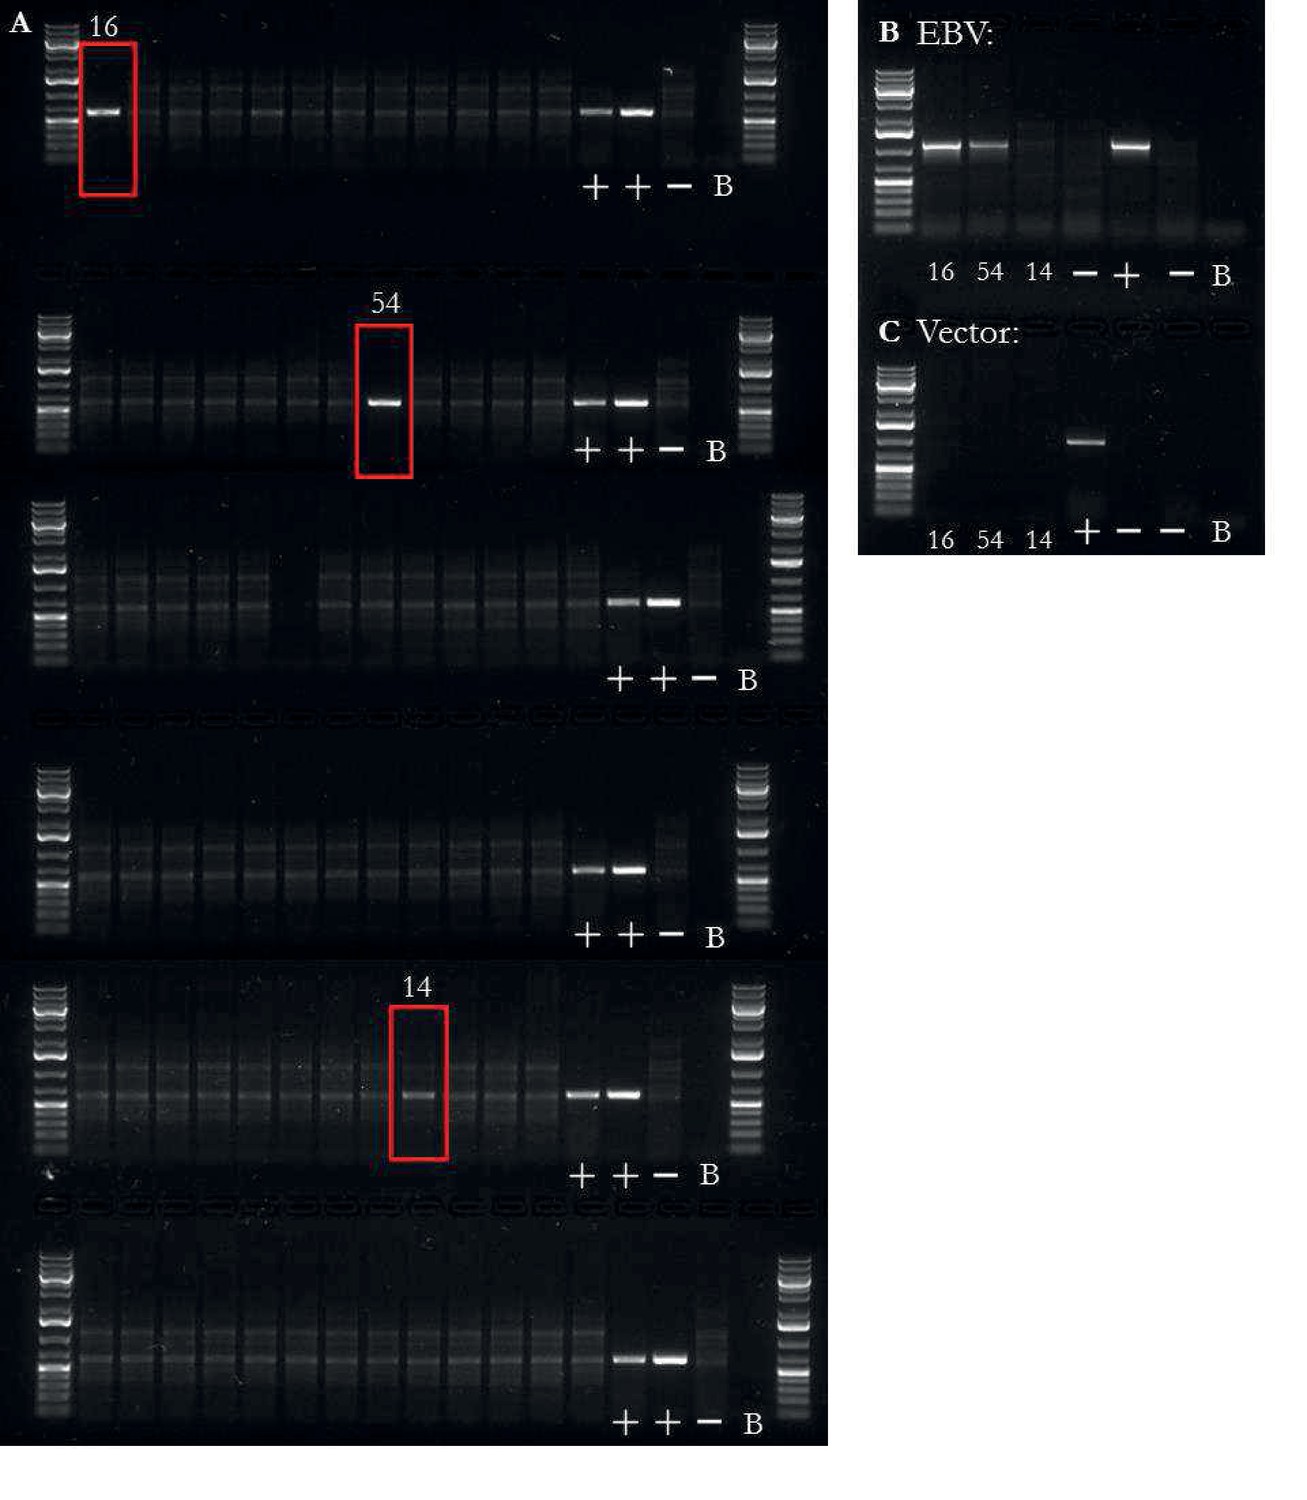
EBV presence/absence quality control of iPSCs.
(a) PCR on DNA for presence or absence of EBV, both integrated and non-integrated (reprogramming vector based). Two iPSC lines had obvious presence of EBV (16, 54) and one was unclear (14). Additional banding in the images was due to RNA in the sample. The three samples, highlighted by a red box, were taken forward for two additional PCRs. First, the three samples were tested for EBV based on the presence of the LMP-2A sequence (b); an EBV gene not found on the reprogramming vector), of which lines 16 and 54 were positive. Lastly, the three samples were tested for the presence of the reprogramming vectors (c), of which no samples were positive. Controls were ordered as followed for all PCRs: mixture of chimp and human fibroblast DNA at 10 ng/L with all reprogramming plasmids at 0.02 pg/L), mixture of two LCL lines DNA at 10 ng/L, mixture of human and chimp fibroblast DNA at 10 ng/L without any plasmid, and no sample blank.
Figure 1—figure supplement 4
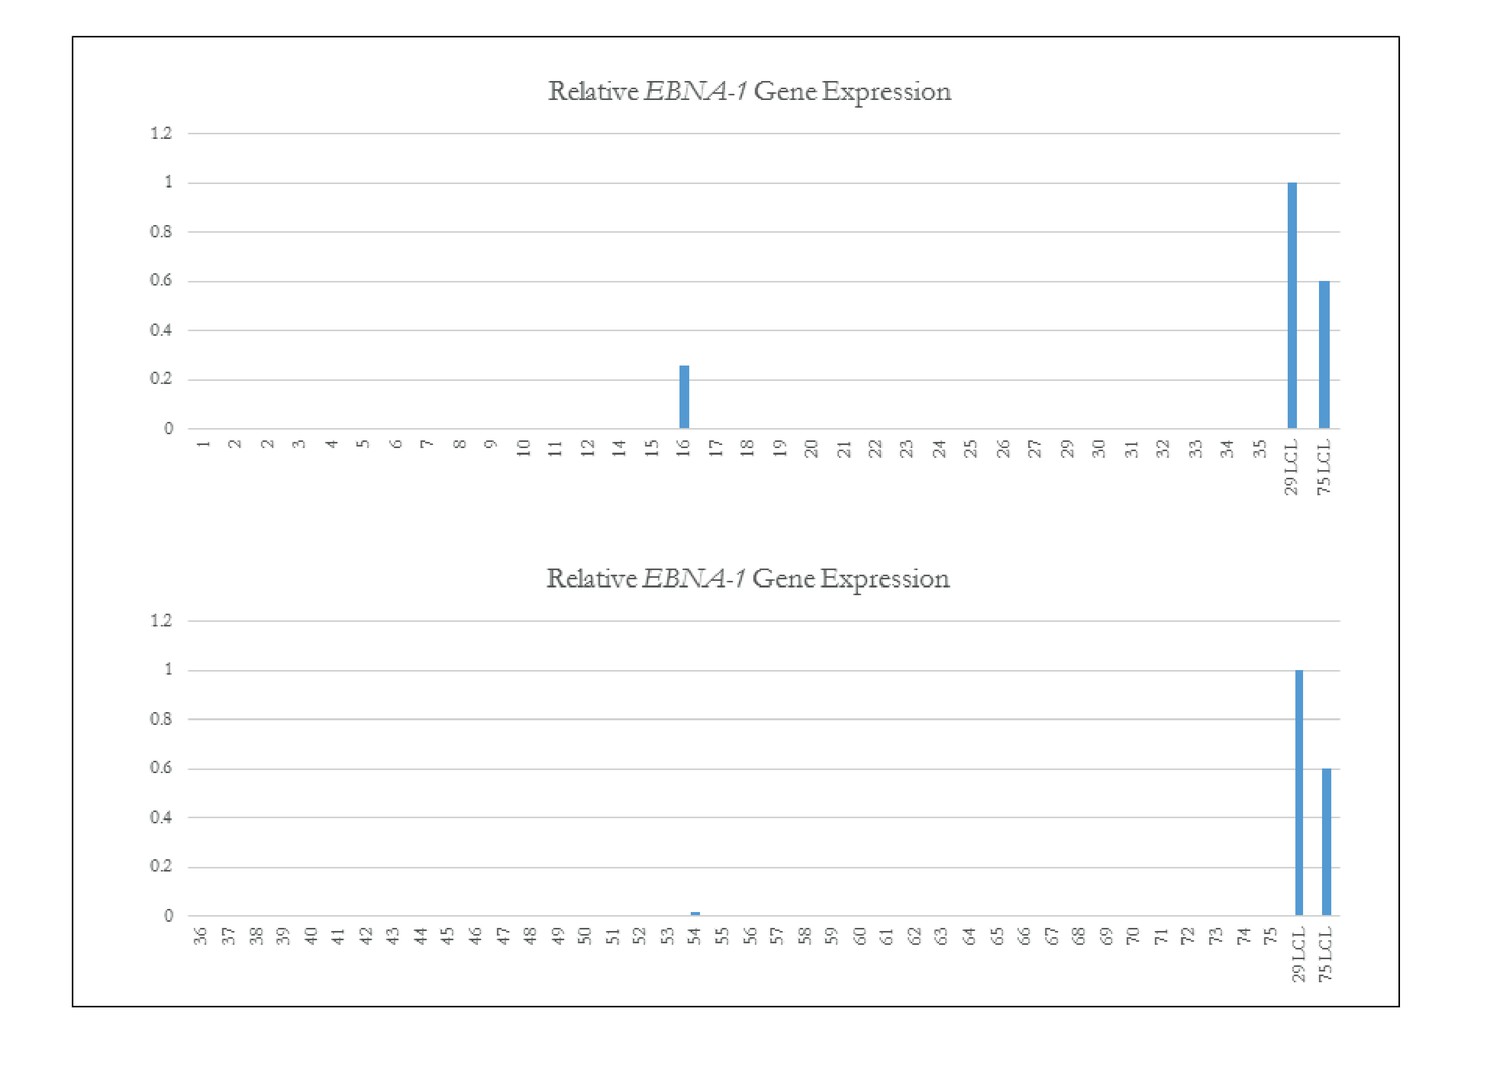
qPCR of EBNA-1 to assess EBV status in iPSCs.
Quantitative PCR of EBNA-1 quality control of iPSC Lines. Quantitative PCR (qPCR) of EBV-required gene EBNA-1. Lines 16 and 54 which both showed the presence of genomic integrations of EBV (as shown in Fig. Figure 1—figure supplement 3) are the only iPSC lines that have EBNA-1 expression. Line 14 is again confirmed as not having EBV.
Figure 1—figure supplement 5
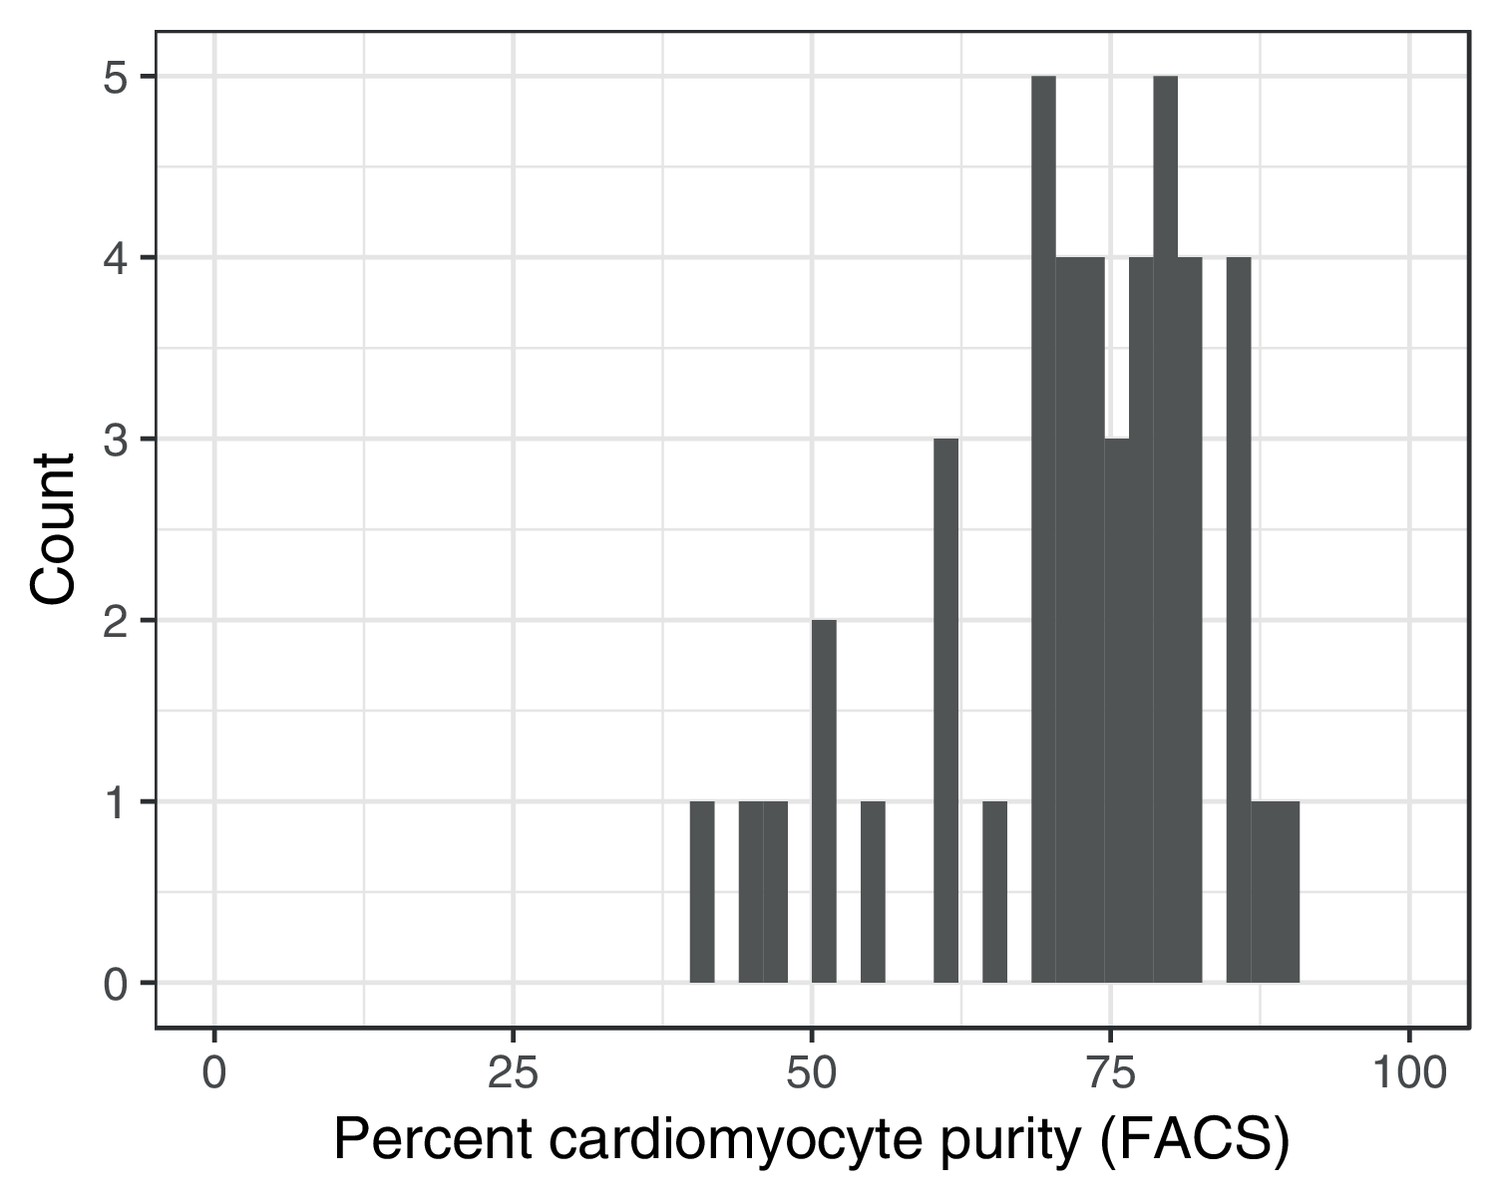
Fluorescence activated cell sorting (FACS) purity estimates for iPSC-derived cardiomyocytes.
https://doi.org/10.7554/eLife.33480.008
Figure 1—figure supplement 6

Our expression data is concordant with an existing small RNA-seqdataset (Burridge et al., 2016).
DOXTOX and DOX correspond to samples from patients that did and did not develop ACT after doxorubicin chemotherapy respectively. We additionally see that the transcriptional response at higher concentrations cannot be extrapolated from that at lower concentrations. Higher concentrations are not shown since including these compresses the first PC obscuring the relevant variation.
Figure 1—figure supplement 7
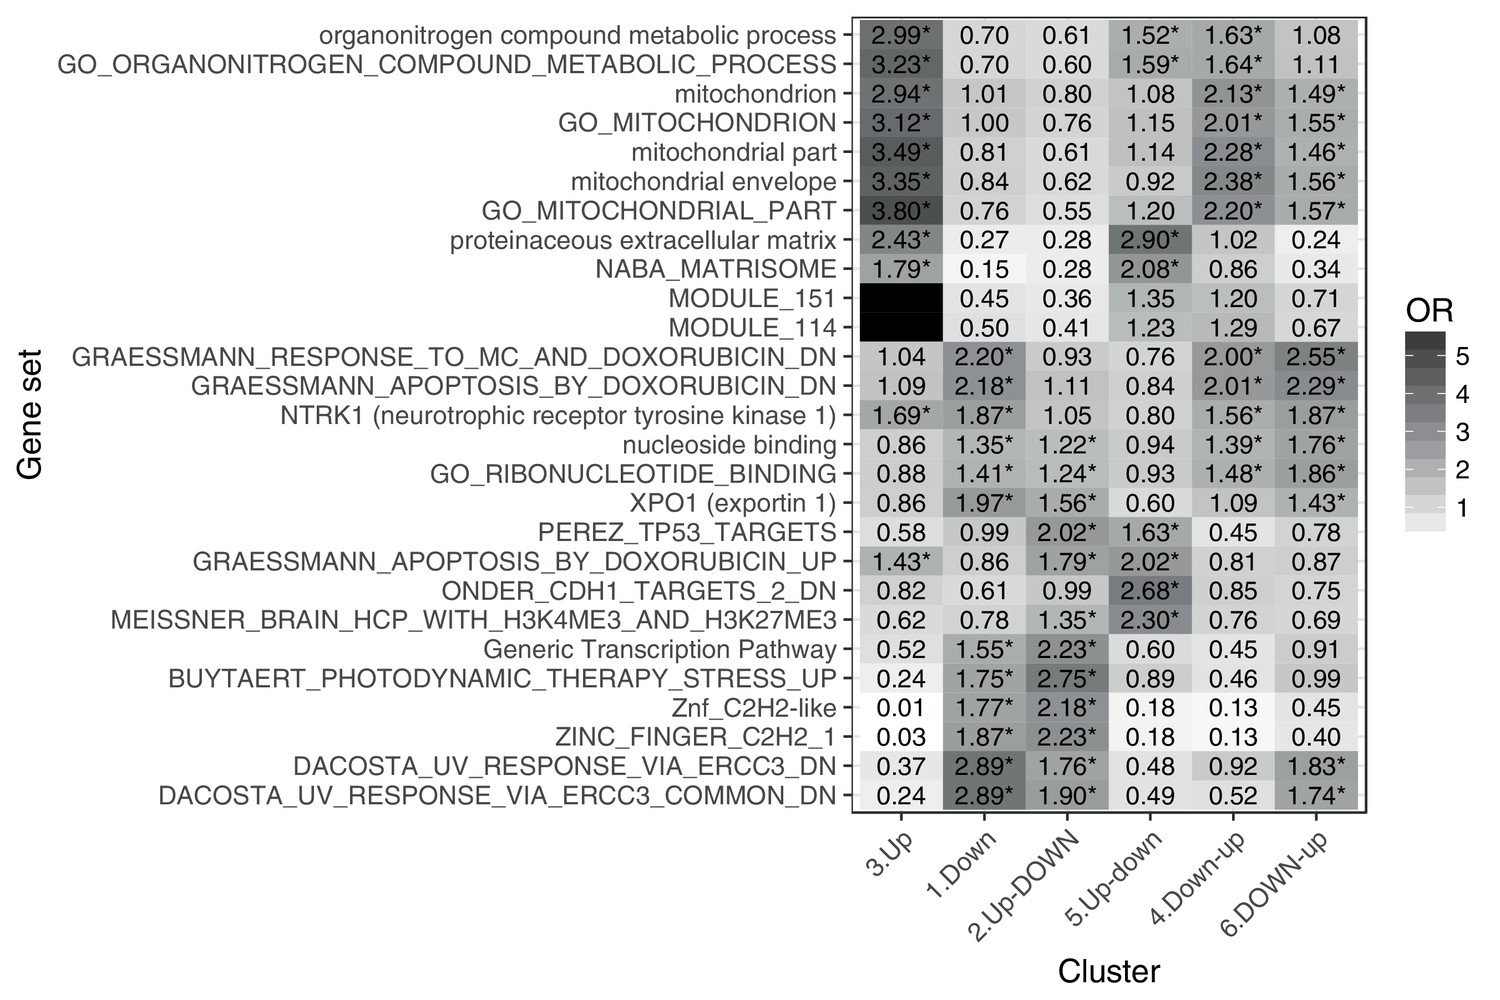
Gene set enrichment analysis of genes in each response cluster confirms expected patterns: metabolic, mitochrondrial and DNA damage processes, as well as existing doxorubicin response genes.
https://doi.org/10.7554/eLife.33480.010
Figure 1—figure supplement 8
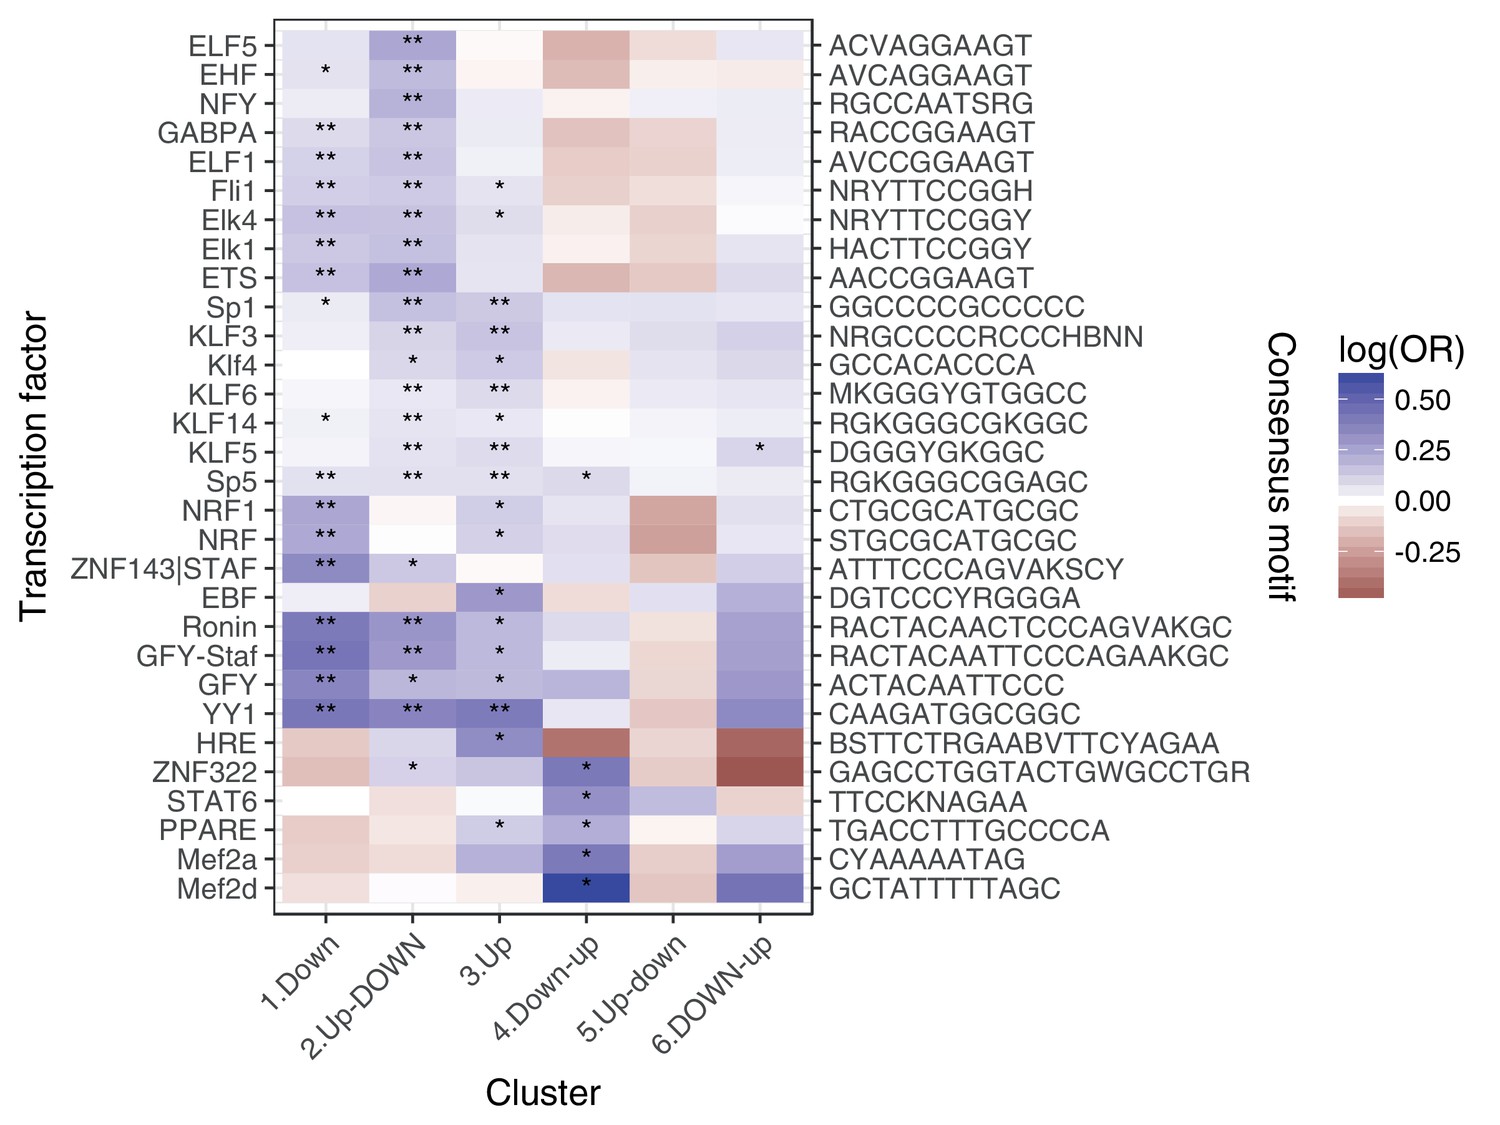
Enrichment of transcription factor binding motifs for each response pattern, using HOMER.
** denotes q < 0:05, * denotes q < 0:5.
Figure 2 with 4 supplements
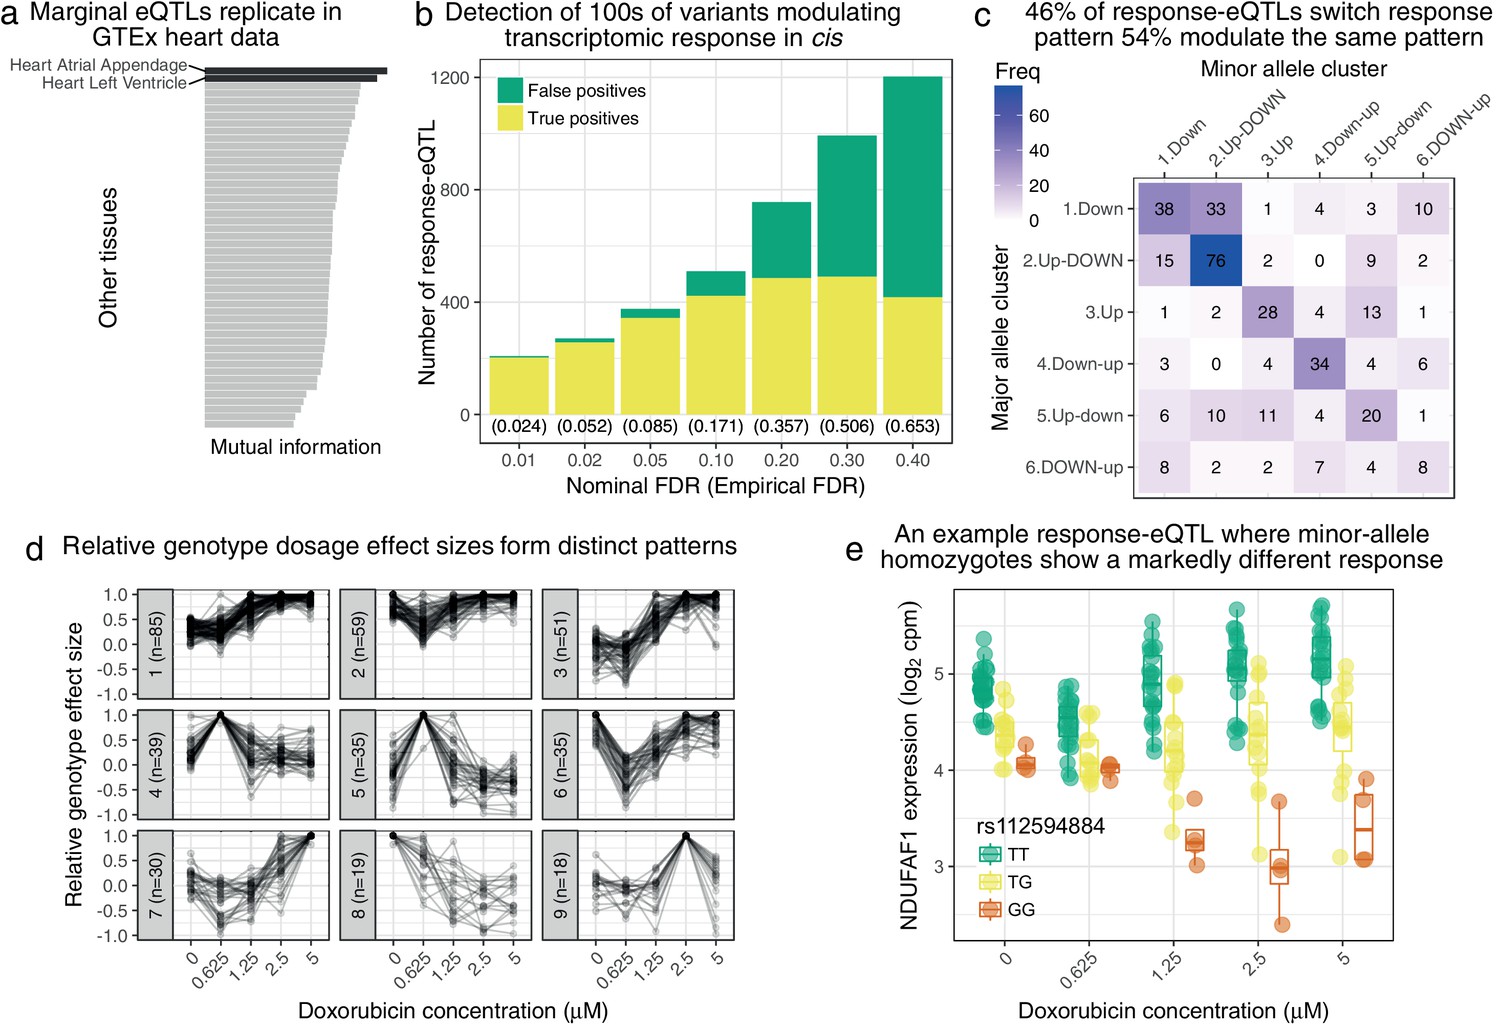
Genetic variation regulates the transcriptomic response to doxorubicin exposure.
(a) Marginal eQTLs show strong replication in GTEx heart data, and lower replication in other tissues (LCL = lymphoblastoid cell line). (b) We detect 100 s of response-eQTLs (reQTLs): variants that modulate response to doxorubicin. The false positive rate (FPR) is estimated using a parametric bootstrap. (c) We developed a statistical method to assign the major and minor allele response to one of the six clusters from Figure 1c. The strongest 46% of detected reQTLs result in a discretely different response, whereas the remainder only modulate the response. (d) For significant reQTLs we calculated relative genotype effect sizes by dividing the fitted effect size at each concentration by the (signed) effect size with the largest absolute value. -means clustering of these effect size profiles reveals distinct patterns, the most common being a small reduction in absolute effect size from to followed by the largest effects being at the highest concentrations. (e) An example response-eQTL where rs112594884 regulates the response of the mitochondrial complex I chaperone NDUFAF1. Under the major (T) allele we see moderate down-regulation at followed by up-regulation at higher concentrations. Under the minor (G) allele, there is little change at followed by substantial down-regulation. Since the genotype effects are reduced at and largest at high concentrations this reQTL is assigned to cluster 1 of panel d.
Figure 2—figure supplement 1
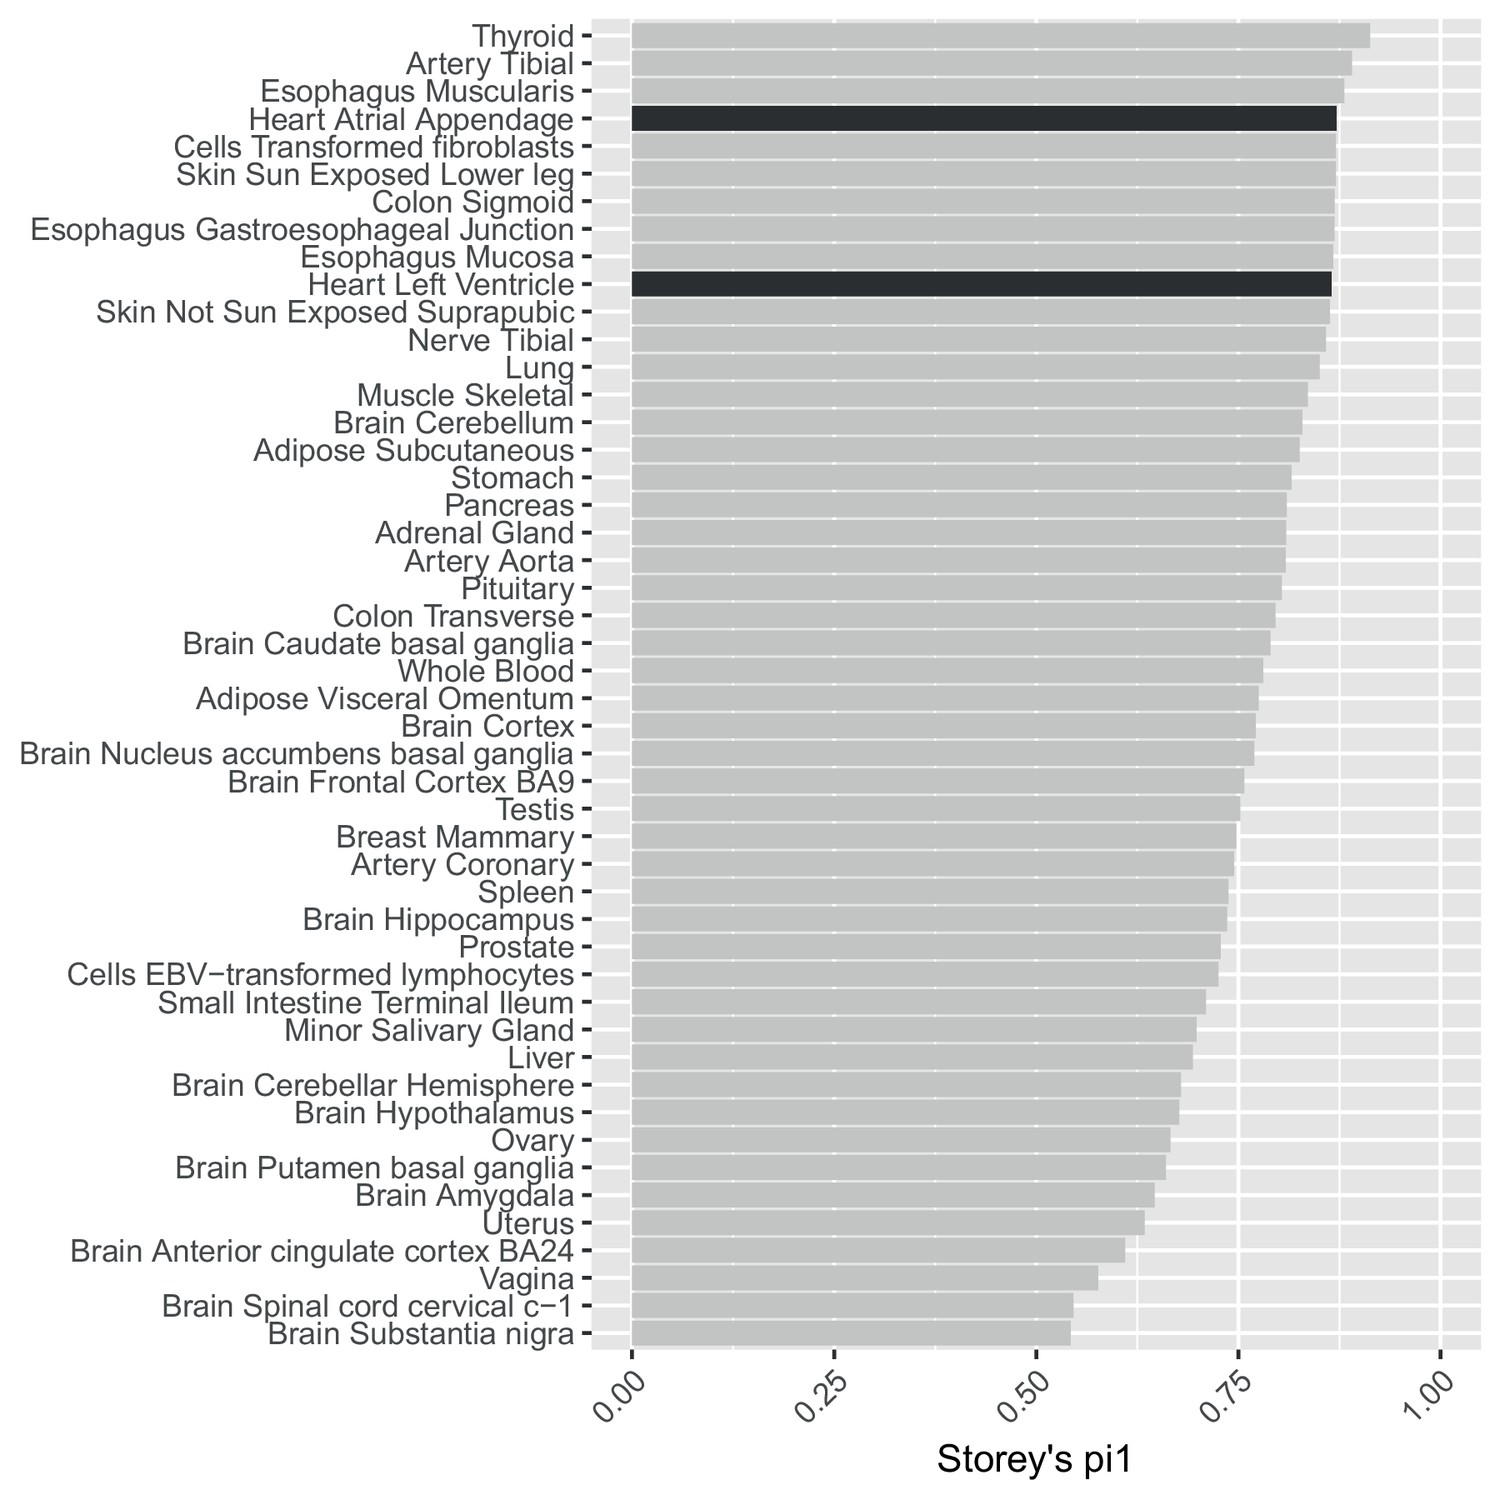
Using statistics to assess replication is confounded by different sample size/power across GTEx tissues.
Storey’s values to estimate the replication in GTEx tissues of SNP-gene eQTL pairs significant in our data at .This analysis is confounded by variable power across the GTEx tissues.
Figure 2—figure supplement 2
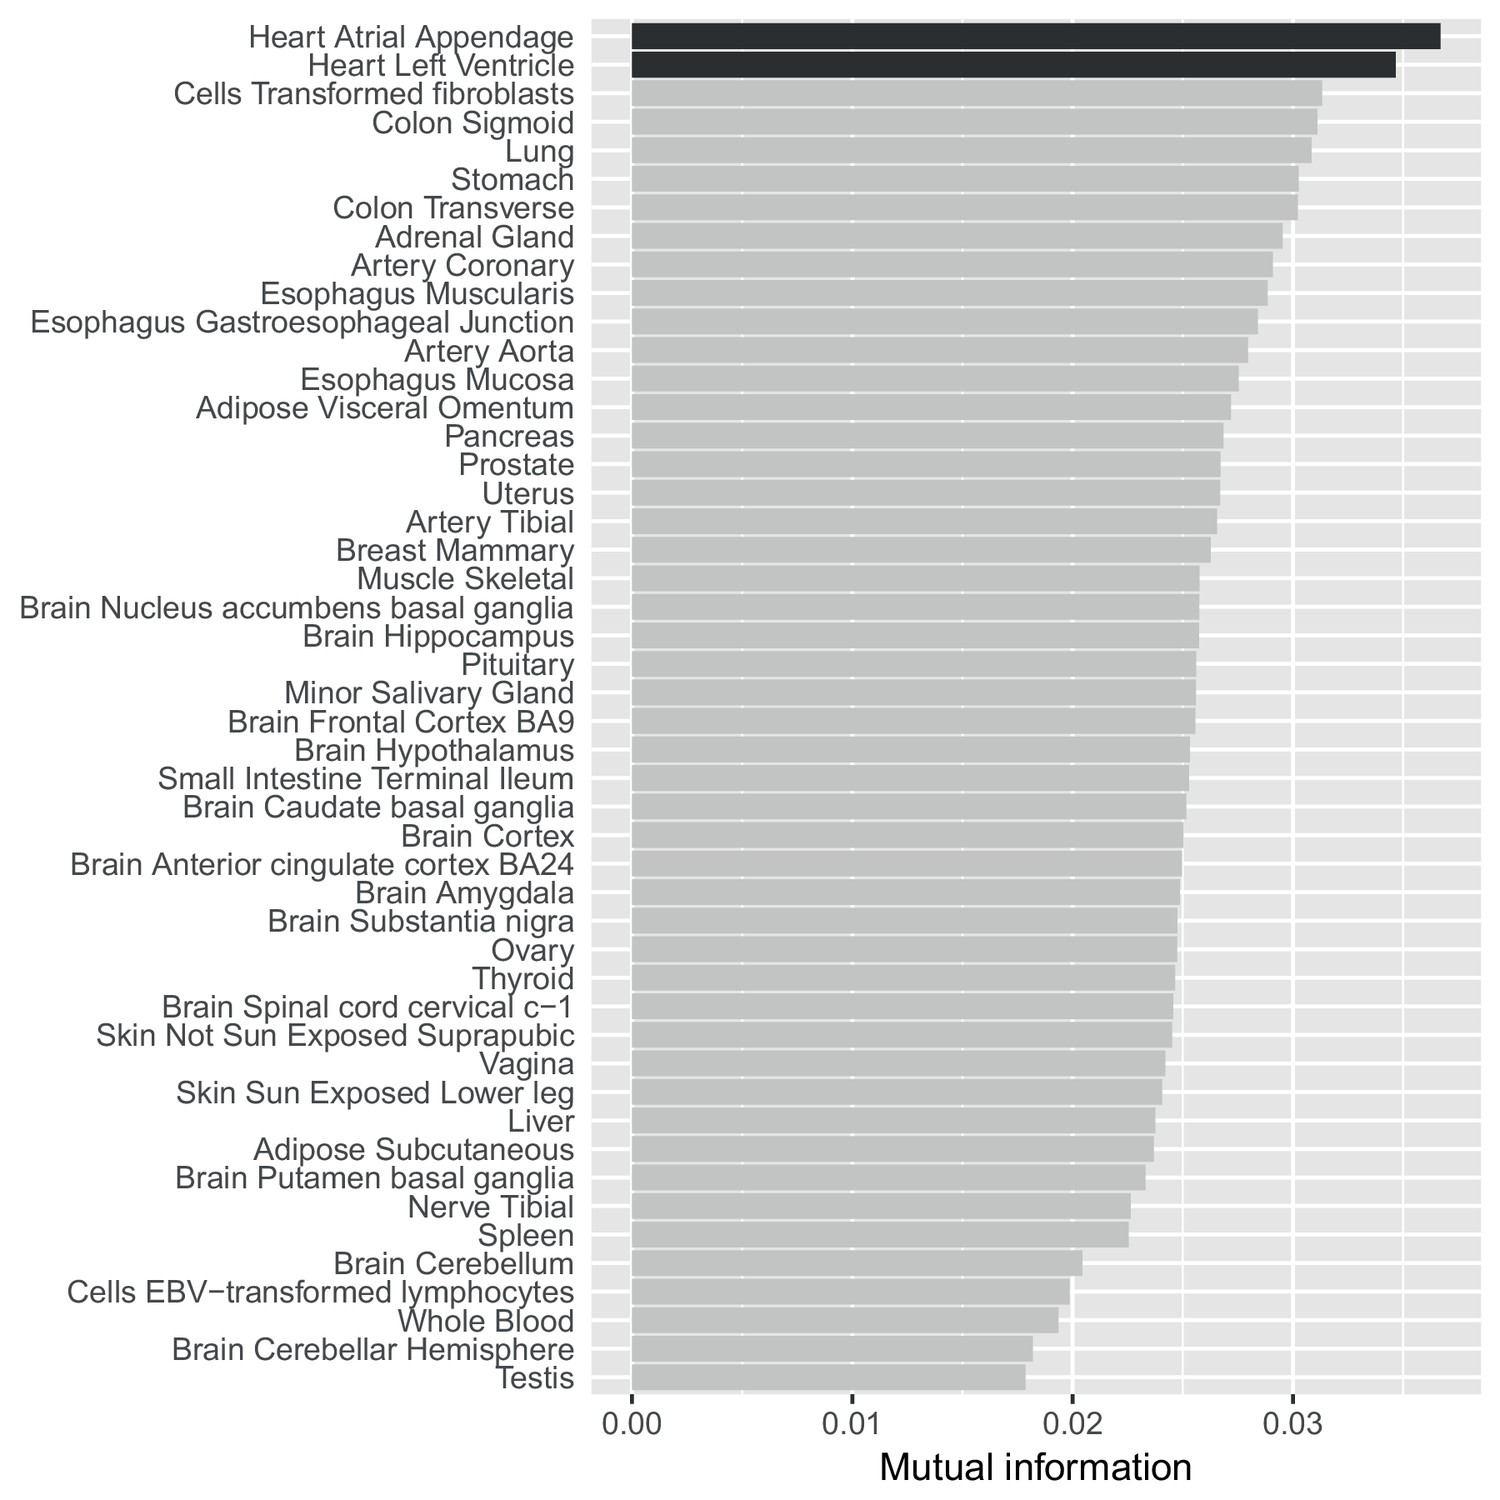
A mutual information approach to control for different sample sizes/power across GTEx tissues.
Estimates of the mutual information between whether SNP-gene pairs are associated in our data compared to all 48 GTEx tissues. Unlike a simple replication analysis our approach controls for differential power across the GTEx tissues (see Materials and methods) and shows that our eQTLs agree most strongly with eQTLs from the two heart tissues.
Figure 2—figure supplement 3
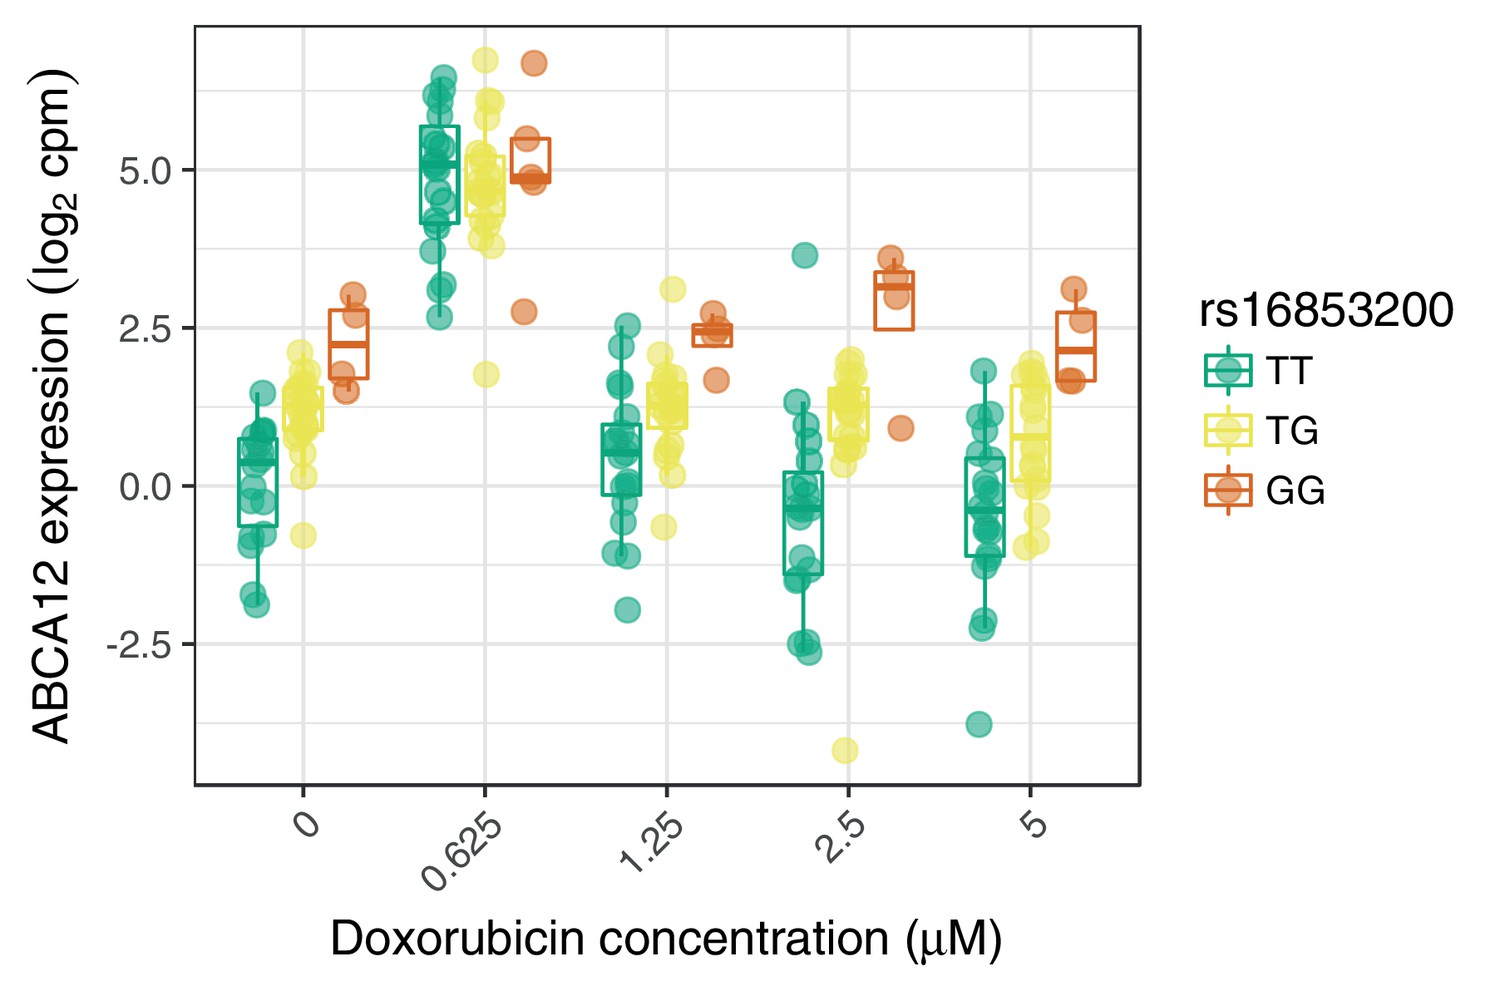
An example response expression QTL that may act through buffering at high expression levels.
https://doi.org/10.7554/eLife.33480.015
Figure 2—figure supplement 4
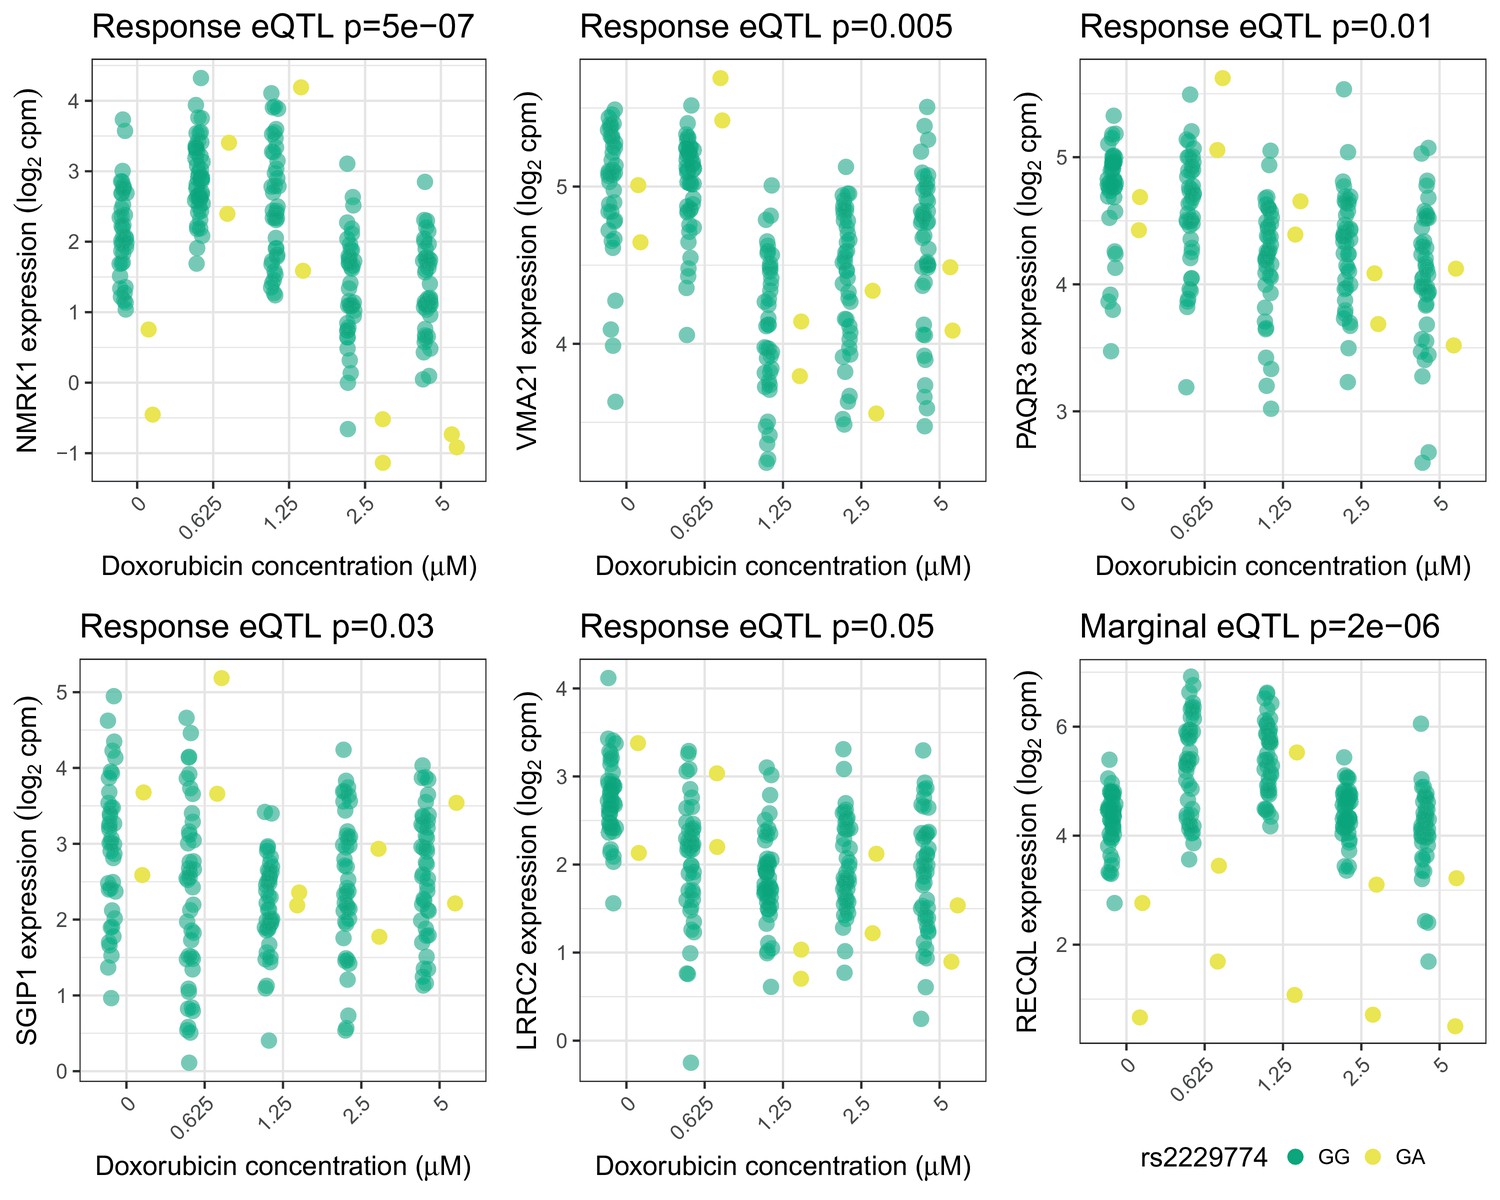
Trans-eQTLs for rs2229774 in RARG.
Trans-eQTLs (5 response and one marginal) at 5% FDR for rs2229774, a non-synonymous coding variant in RARG which is associated with ACT (Aminkeng et al., 2015). Only two individuals are heterozygous. -values shown have been adjusted for multiple testing by Benjamini Hochberg.
Figure 3 with 2 supplements
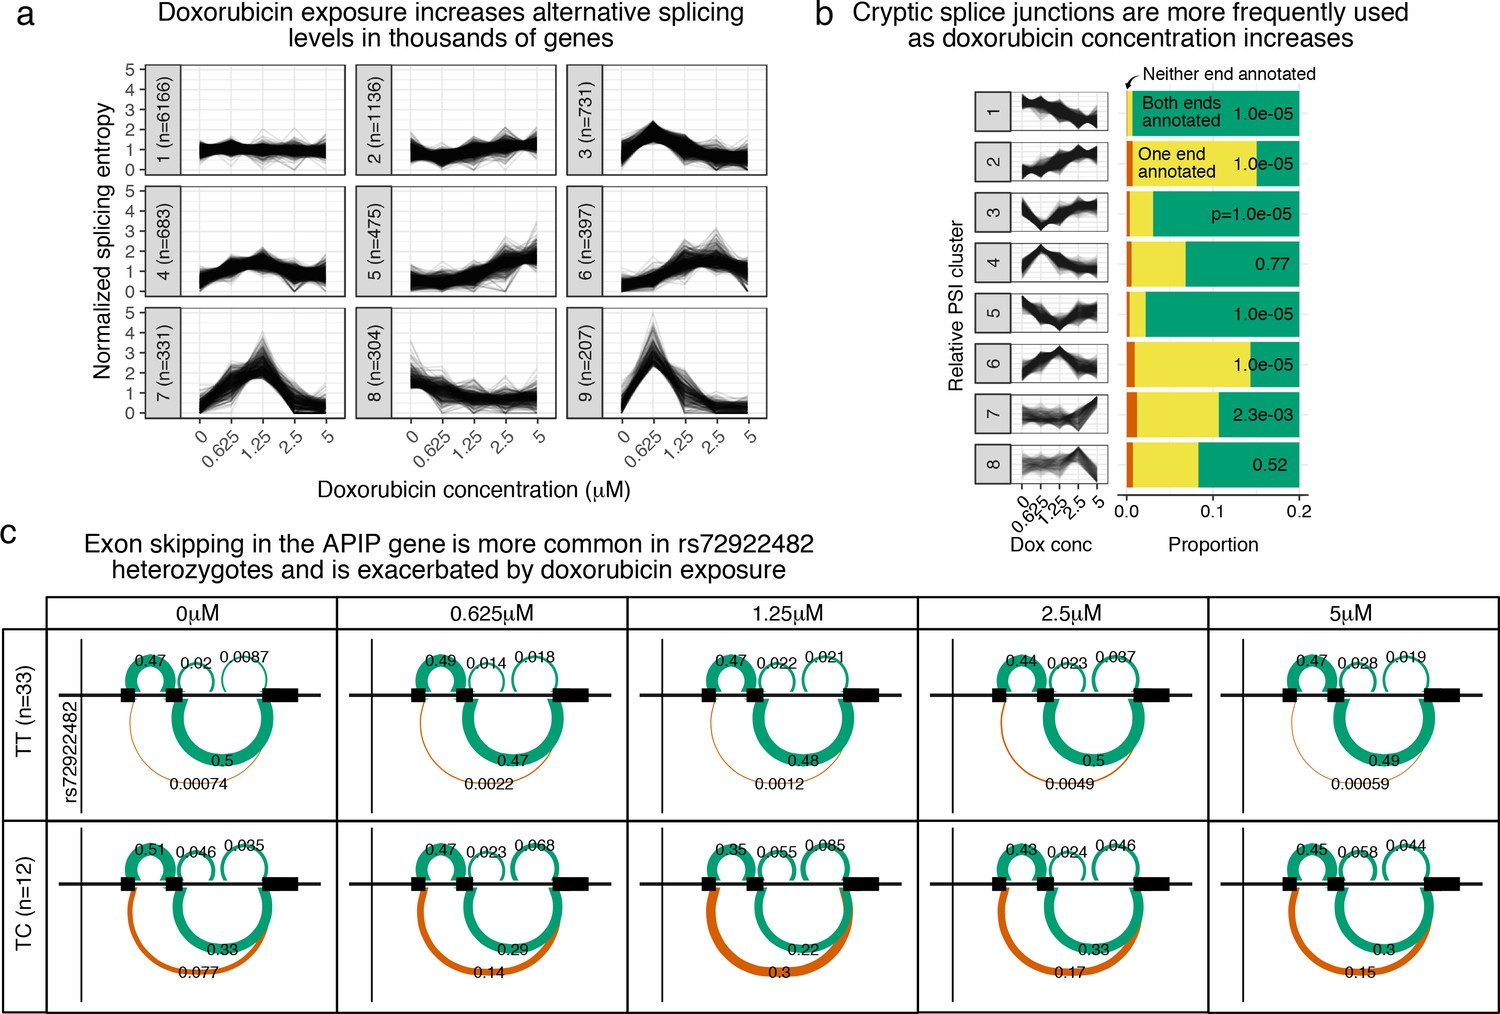
Doxorubicin exposure significantly impacts alternative splicing.
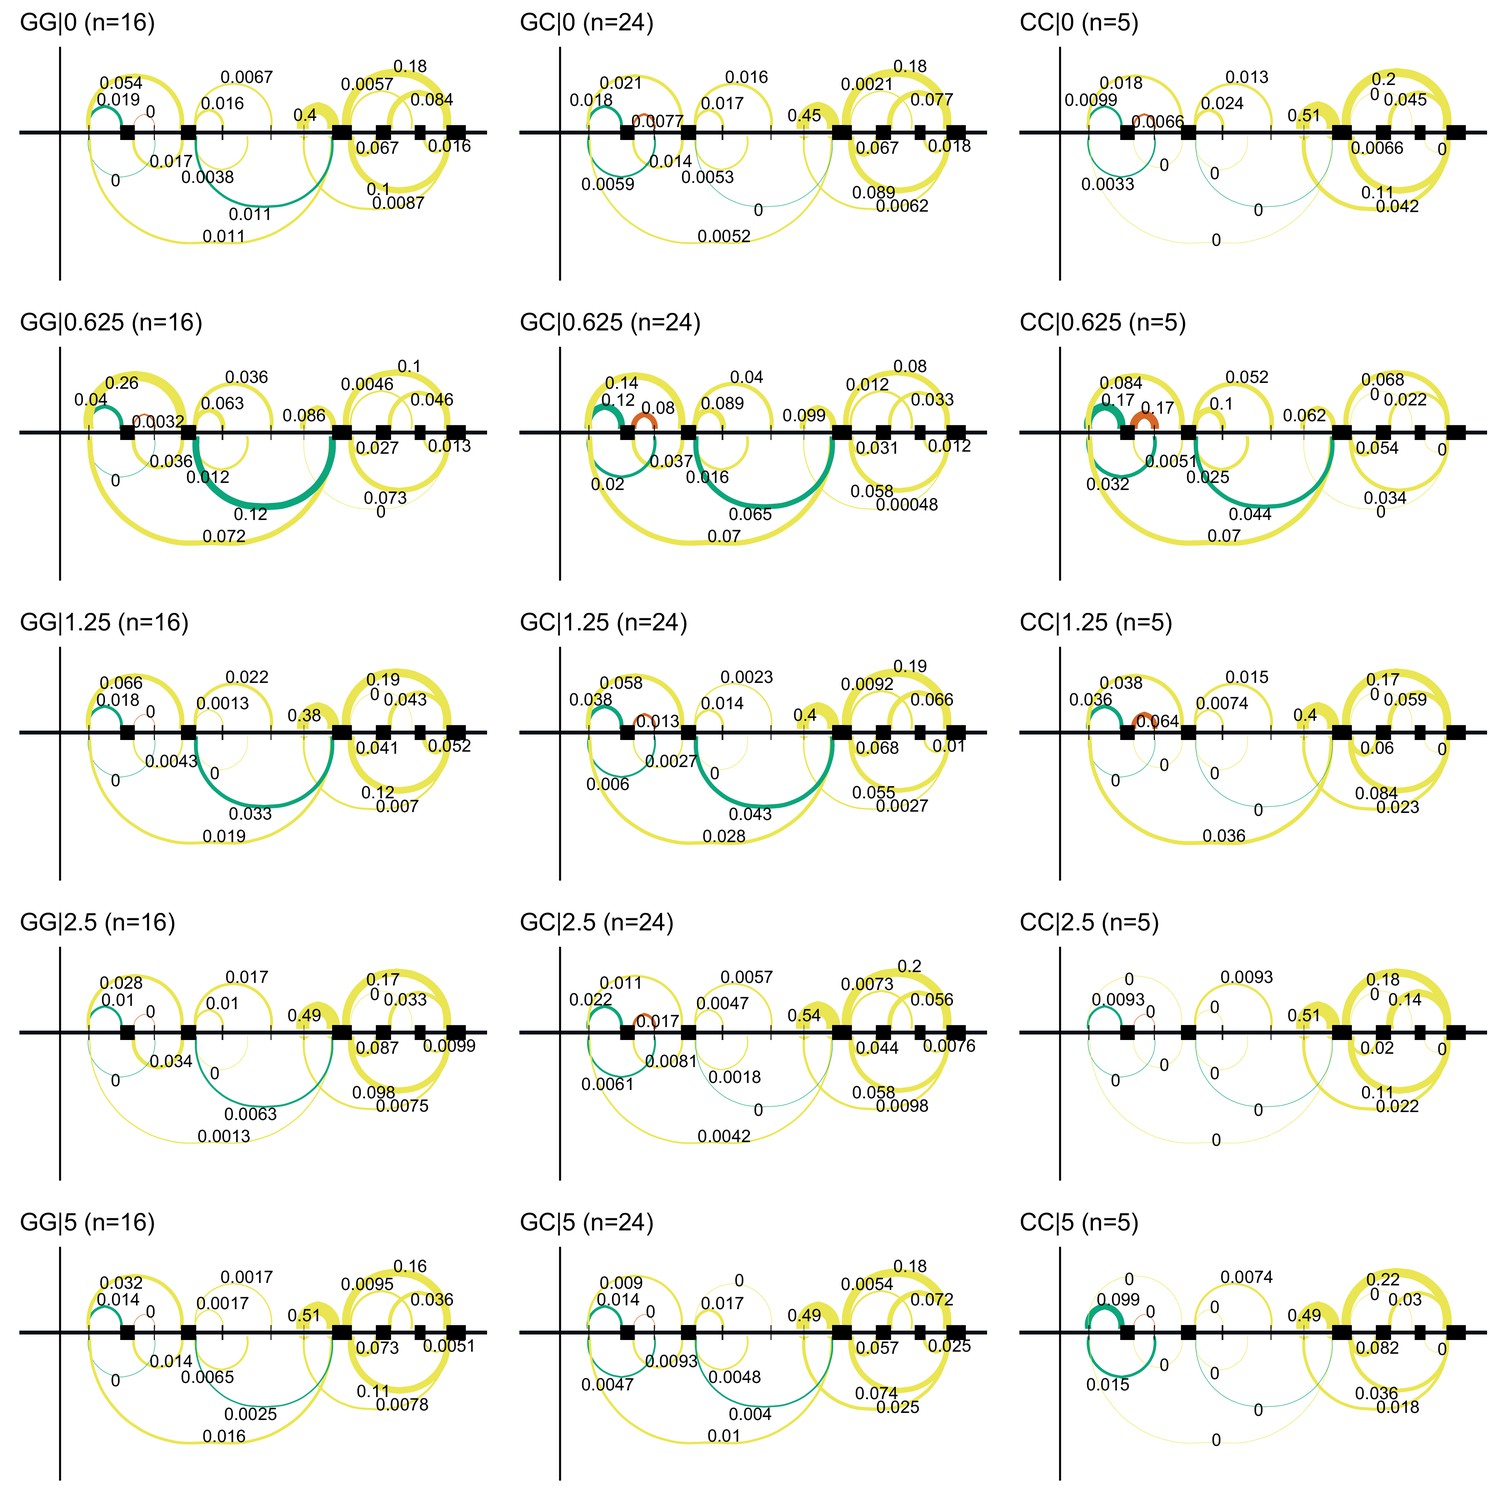
(a) The entropy of splicing choices increases in response to doxorubicin exposure. We measured splicing entropy at different concentrations within LeafCutter ‘Alternative Splicing Clusters’ (ACSs) and clustered these into patterns of entropy change. (b) We separated introns differentially excised with into eight clusters based on their relative excision level at each concentration. Introns in clusters corresponding to increased excision at higher doxorubicin concentrations (e.g. cluster 2) are far more likely to use a cryptic (unannotated) splice site at at least one end. -values shown are for a hypergeometric test of that cluster against all others. (c) We mapped 42 ASCs with response splicing QTLs, variants that modulate the differential splicing response to doxorubicin.
Figure 3—figure supplement 1
Alternative TSS use in NDUFAF6 on doxorubicin exposure.
Doxorubicin exposure results in the use of a downstream alternative TSS for NDUFAF6 which uncovers an association between rs896853 genotype and inclusion of the exon at chr8:94975318–94975415.
Figure 3—figure supplement 2
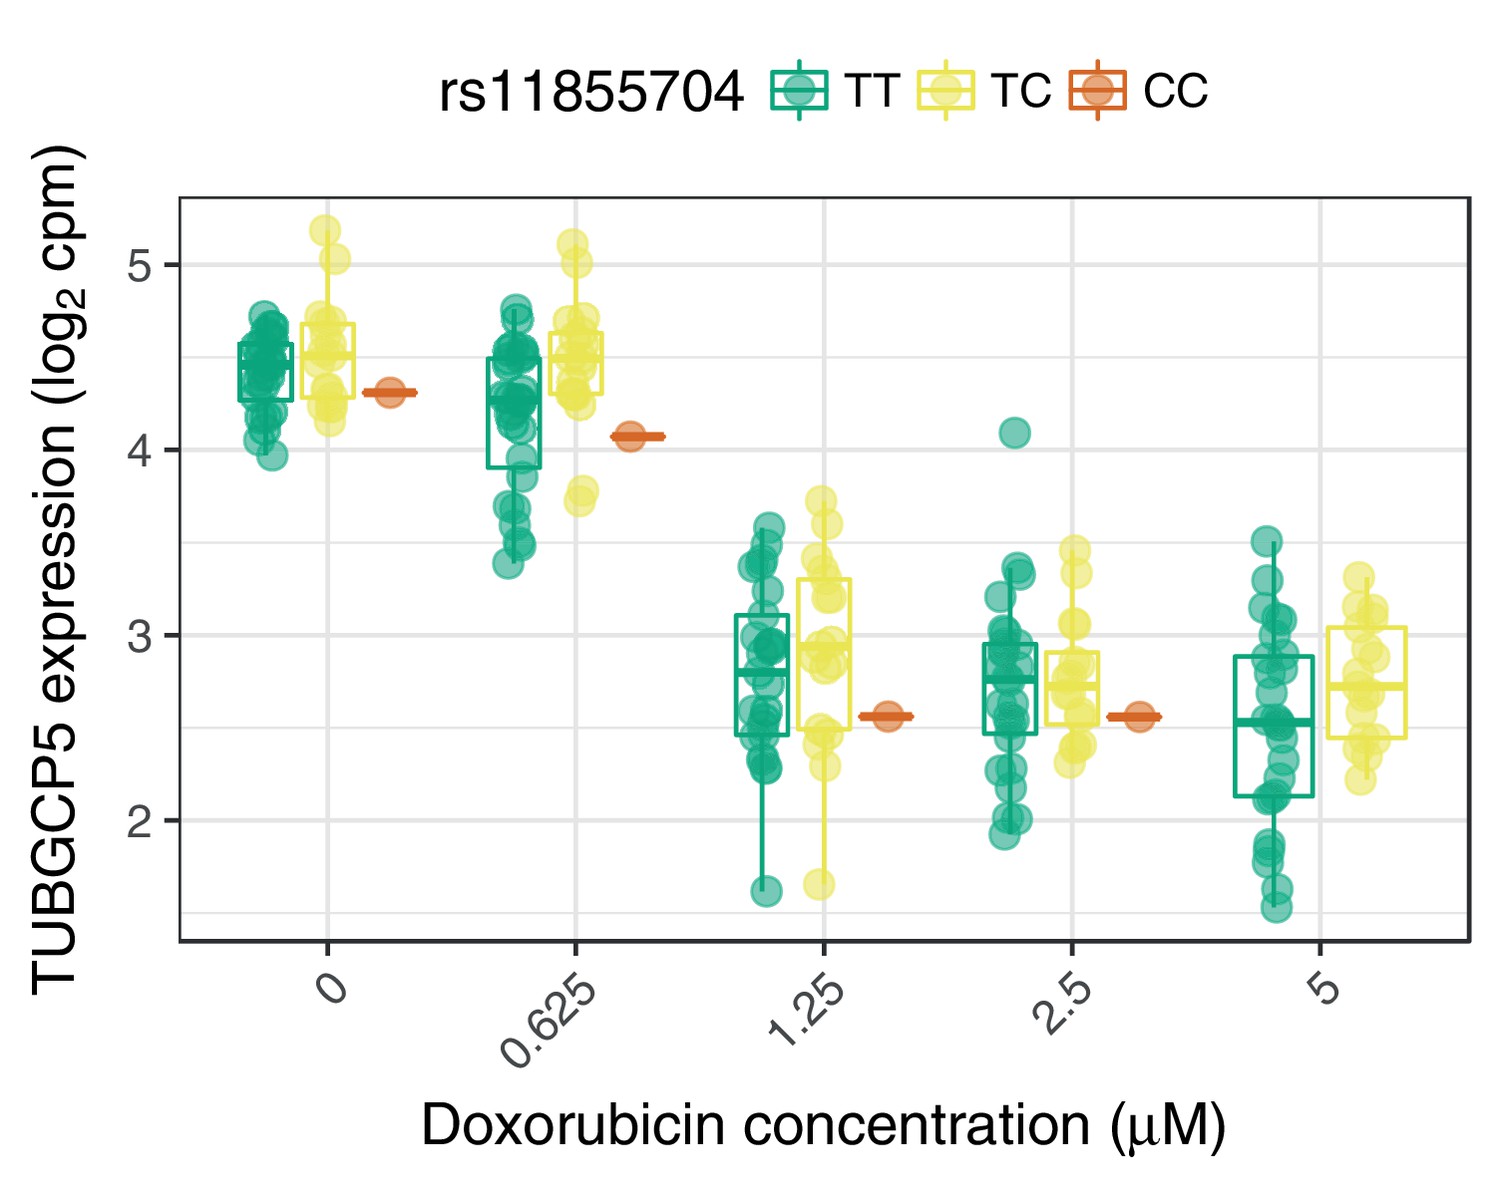
The ACT-sensitivity variant rs28714259 weakly modulates TUBGCP5’s response to doxorubicin.
rs28714259, the one replicated variant from (Schneider et al., 2017) is in high LD () with rs11855704, which is a nominally significant () eQTL for TUBGCP5. TUBGCP5 is strongly down-regulated in the presence of doxorubicin.
Figure 4
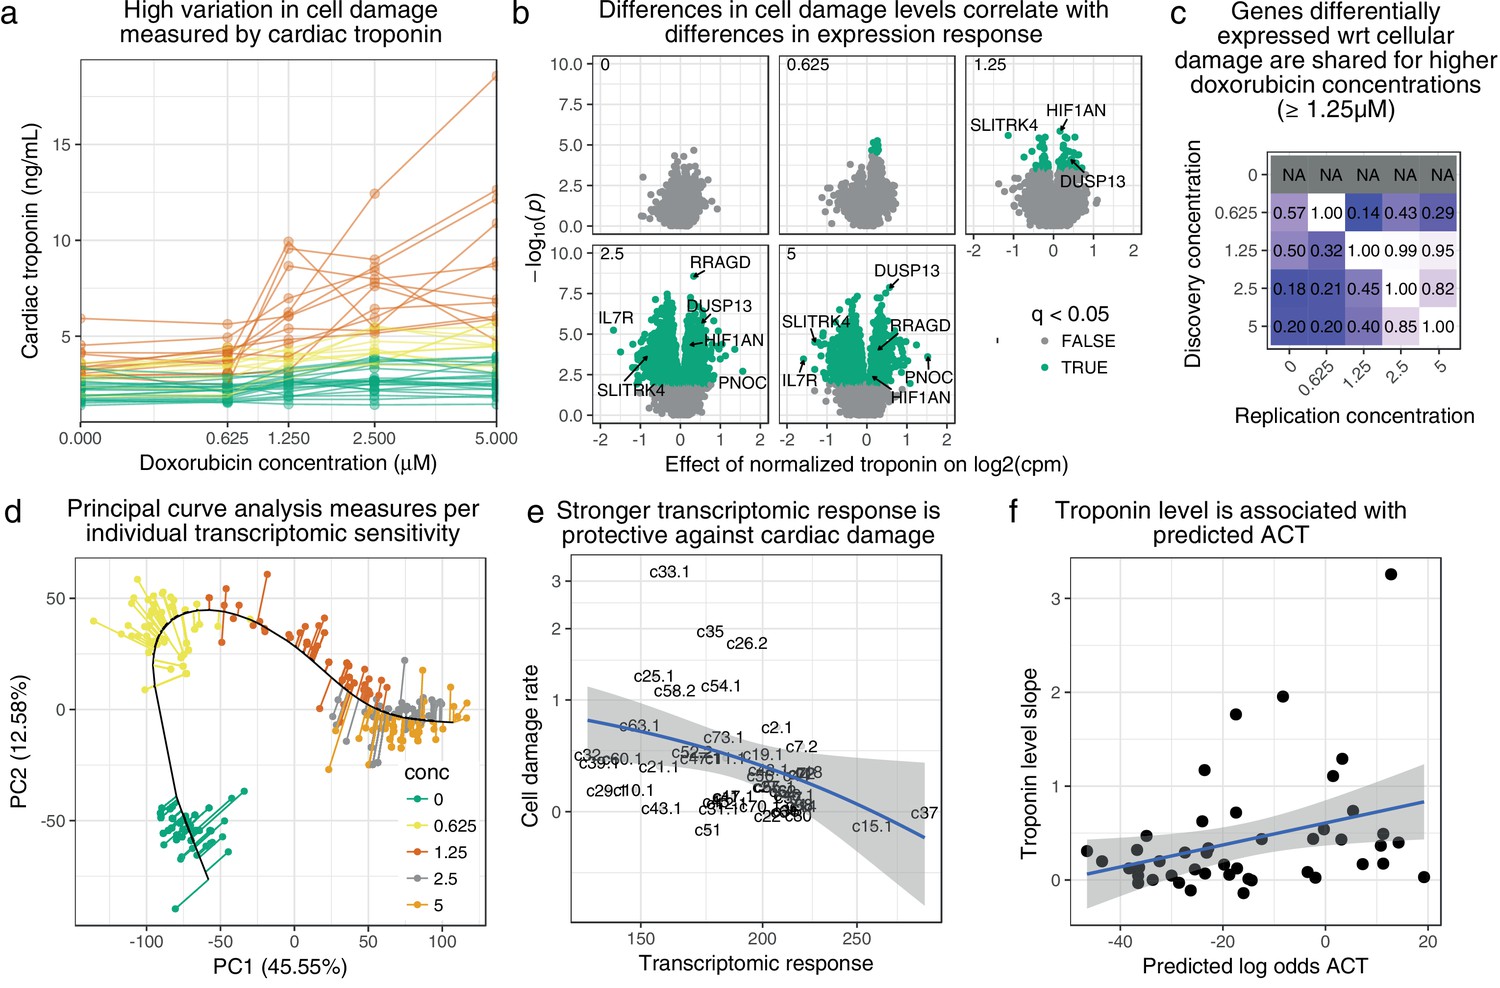
Transcriptomic response is predictive of doxorubicin induced damage as measured by cardiac troponin.
(a) We measured media levels of cardiac troponin, a sensitive and specific test for myocardial cell damage, in response to doxorubicin, across all cell lines. (b) We performed differential expression analyses with respect to troponin at each concentration separately, and observed more differentially expressed genes at higher concentrations corresponding to an increased dynamic range of troponin levels. (c) We took differentially expressed genes (5% FDR) at each concentration and checked for ‘replication’ nominal ) at the other concentrations. Note that no differentially expressed genes were discovered in control condition . (d) We summarized gene expression response by first fitting a ‘principal curve’ following increasing doxorubicin concentration, and then measuring the rate of progression along this curve for each individual. (e) Increased transcriptomic response is associated with reduced cardiac troponin levels, suggesting that the bulk of expression changes we observe are in fact protective against cardiac damage. (f) We trained a model to predict ACT risk from gene expression response using available 3 v. 3 case/control data (Burridge et al., 2016) and applied this model to our data. Predicted ACT risk correlated significantly with the slope of troponin level (Spearman ), supporting the in vivo disease relevance of our IC system.
Figure 5 with 5 supplements
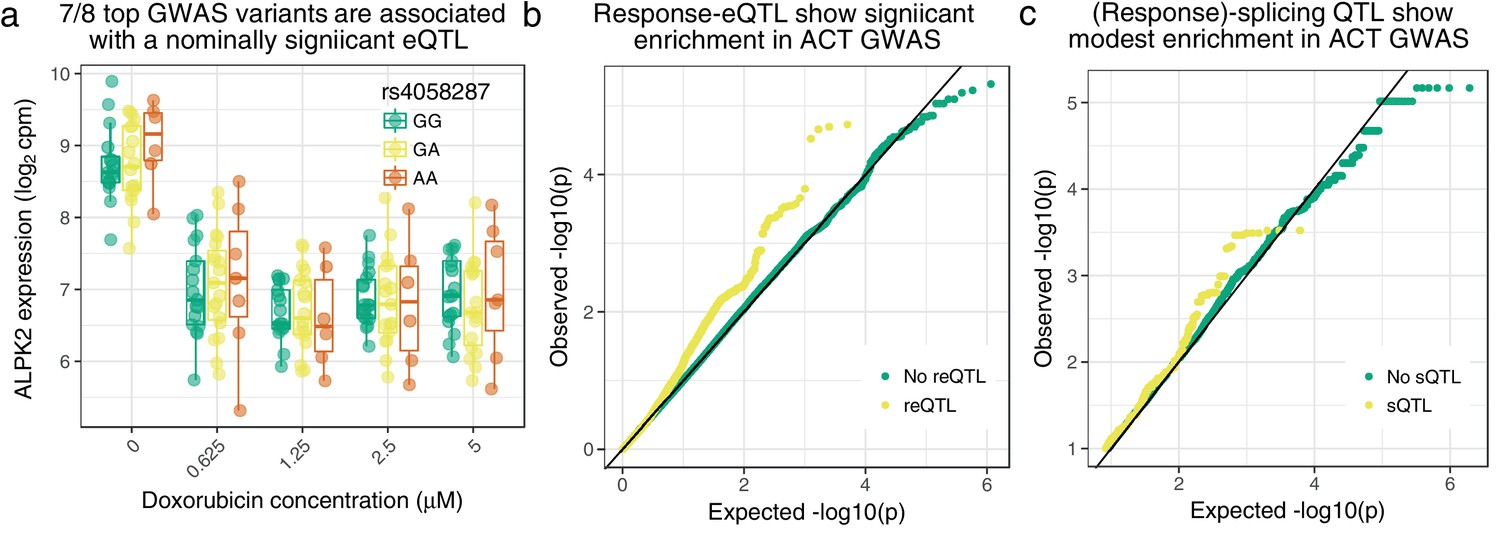
Cardiomyocyte molecular QTLs are enriched in meta-analyzed ACT GWAS (Schneider et al., 2017; Serie et al., 2017).
(a) rs4058287 has a GWAS -value of and is a nominally significant eQTL () for ALPK2, which is down-regulated in response to doxorubicin. (b) SNPs that have a response eQTL with are enriched in GWAS variants with (hypergeometric test ). (c) SNPs with a marginal or response splicing QTL at show modest enrichment in GWAS (hypergeometric ).
Figure 5—figure supplement 1
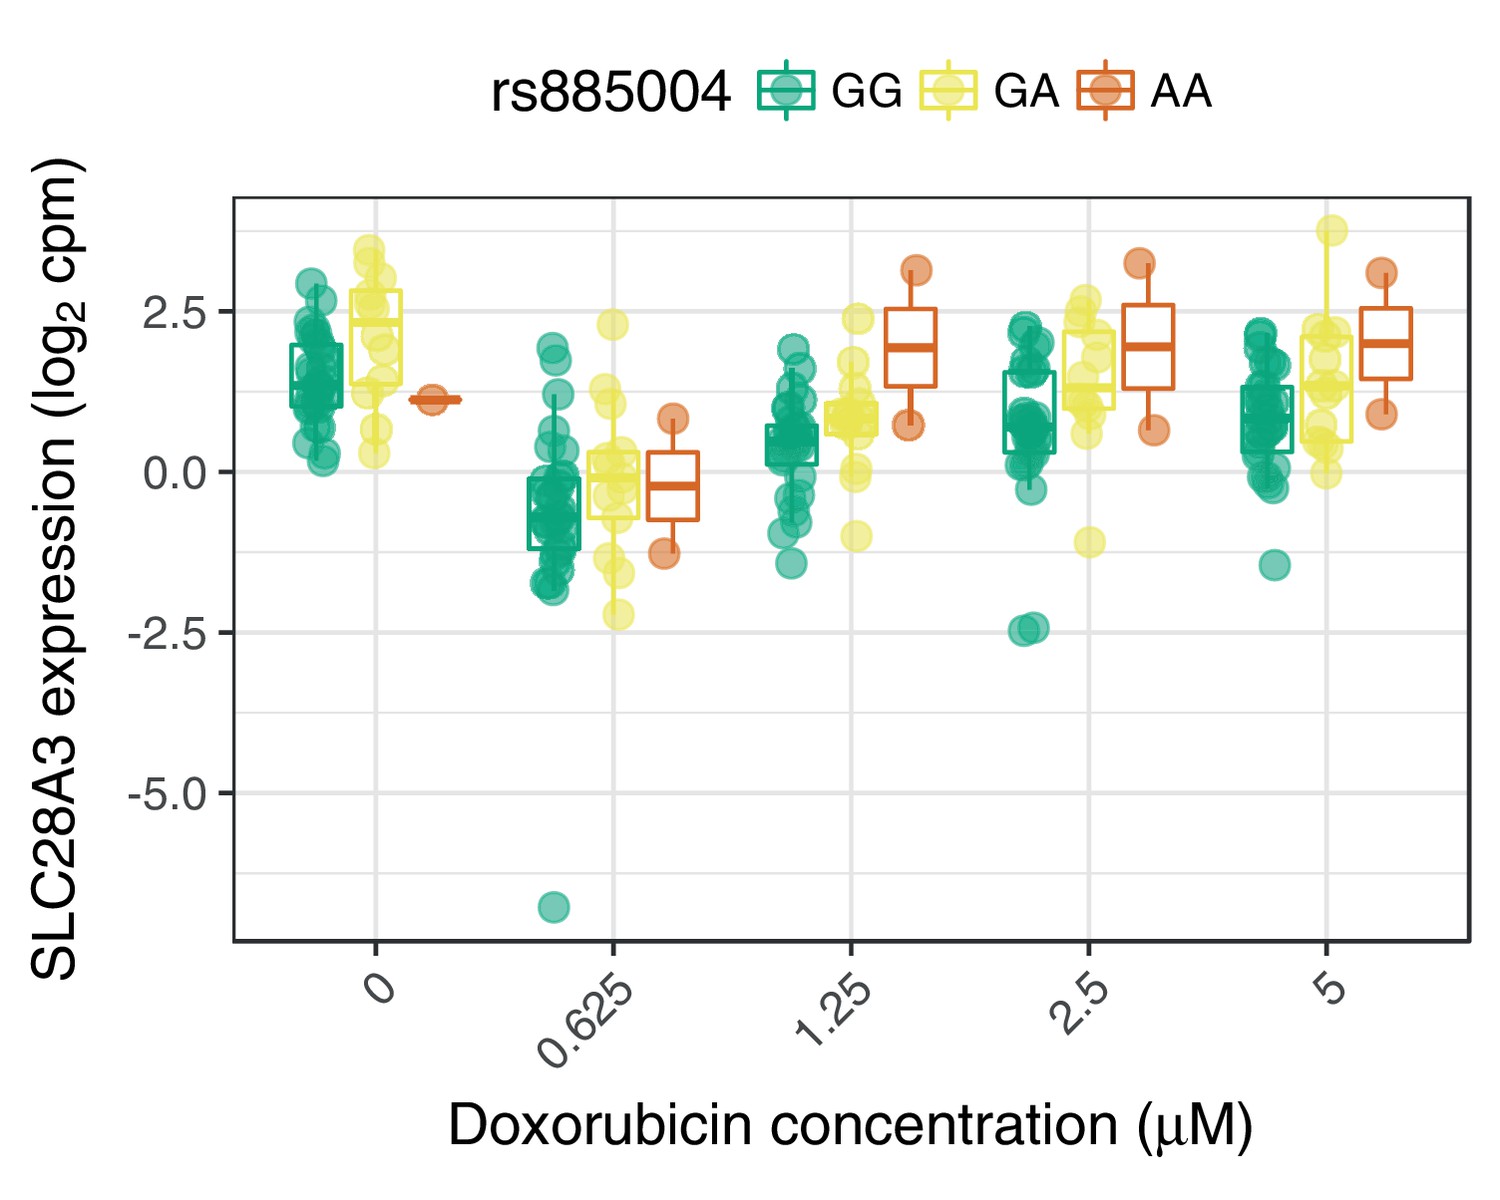
SLC28A3 expression may mediate the association of rs885004 with ACT-sensitivity.
The intronic (to SLC28A3) variant rs885004, and the closely linked () synonymous variant rs7853758, have been associated with ACT by candidate gene studies (Visscher et al., 2012; Visscher et al., 2013). We find rs885004, but not rs7853758, has a significant marginal effect on SLC28A3 expression.
Figure 5—figure supplement 2
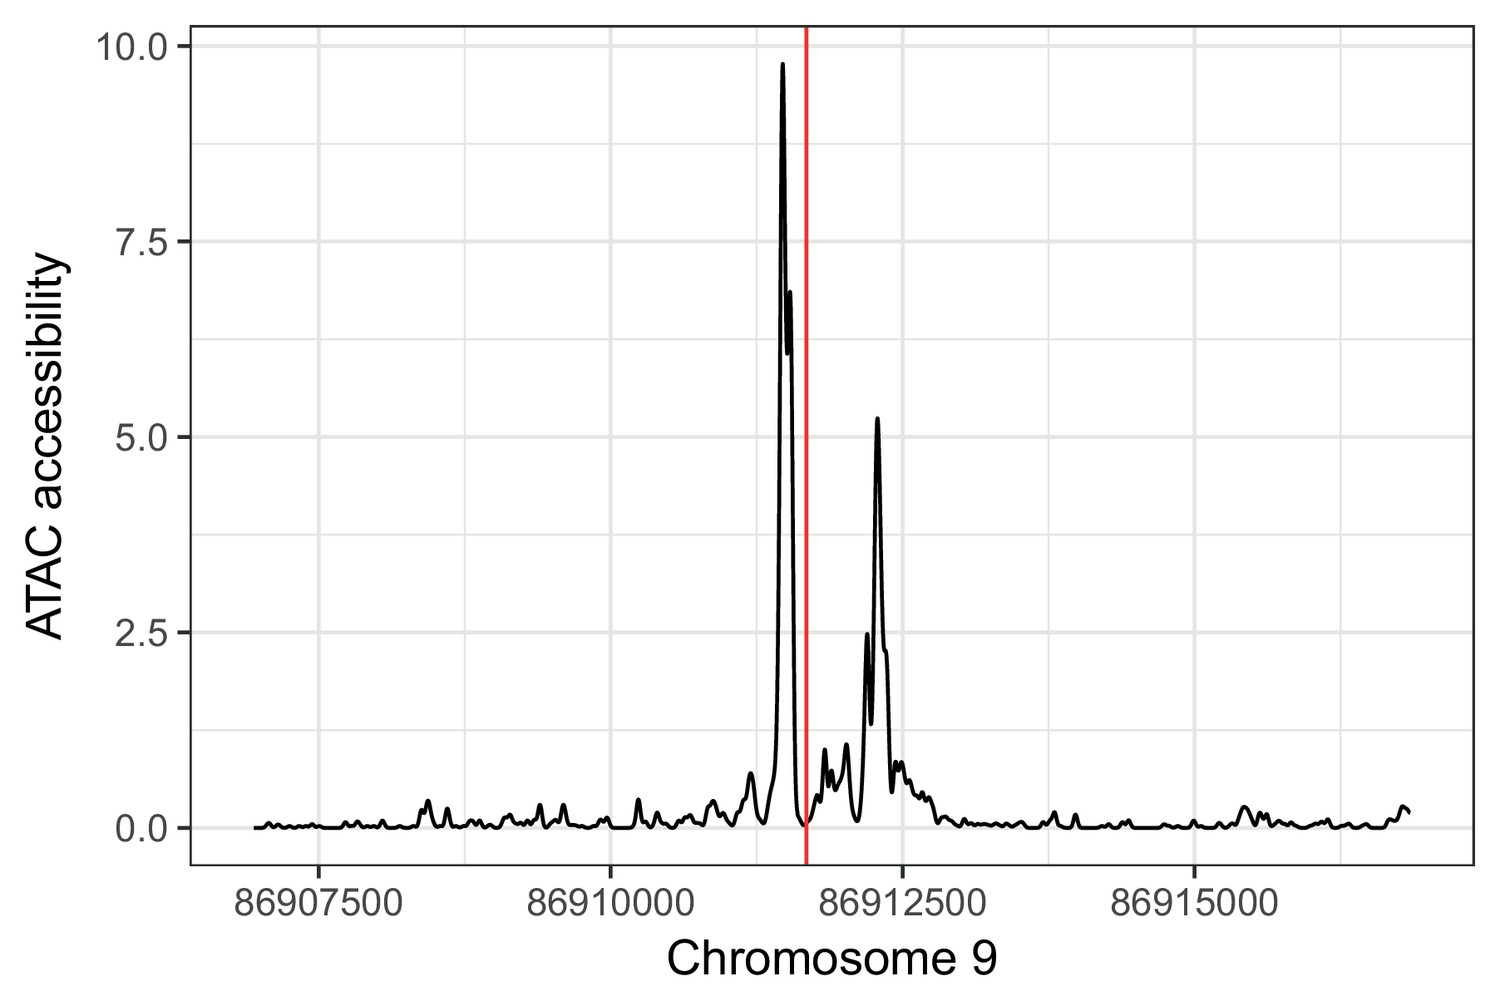
rs885004 falls in an IC ATAC-seq peak. rs885004 (shown in red) falls in an ATAC-seq footprint in (unrelated) iPSC-derived cardiomyocytes (unpublished data).
https://doi.org/10.7554/eLife.33480.023
Figure 5—figure supplement 3
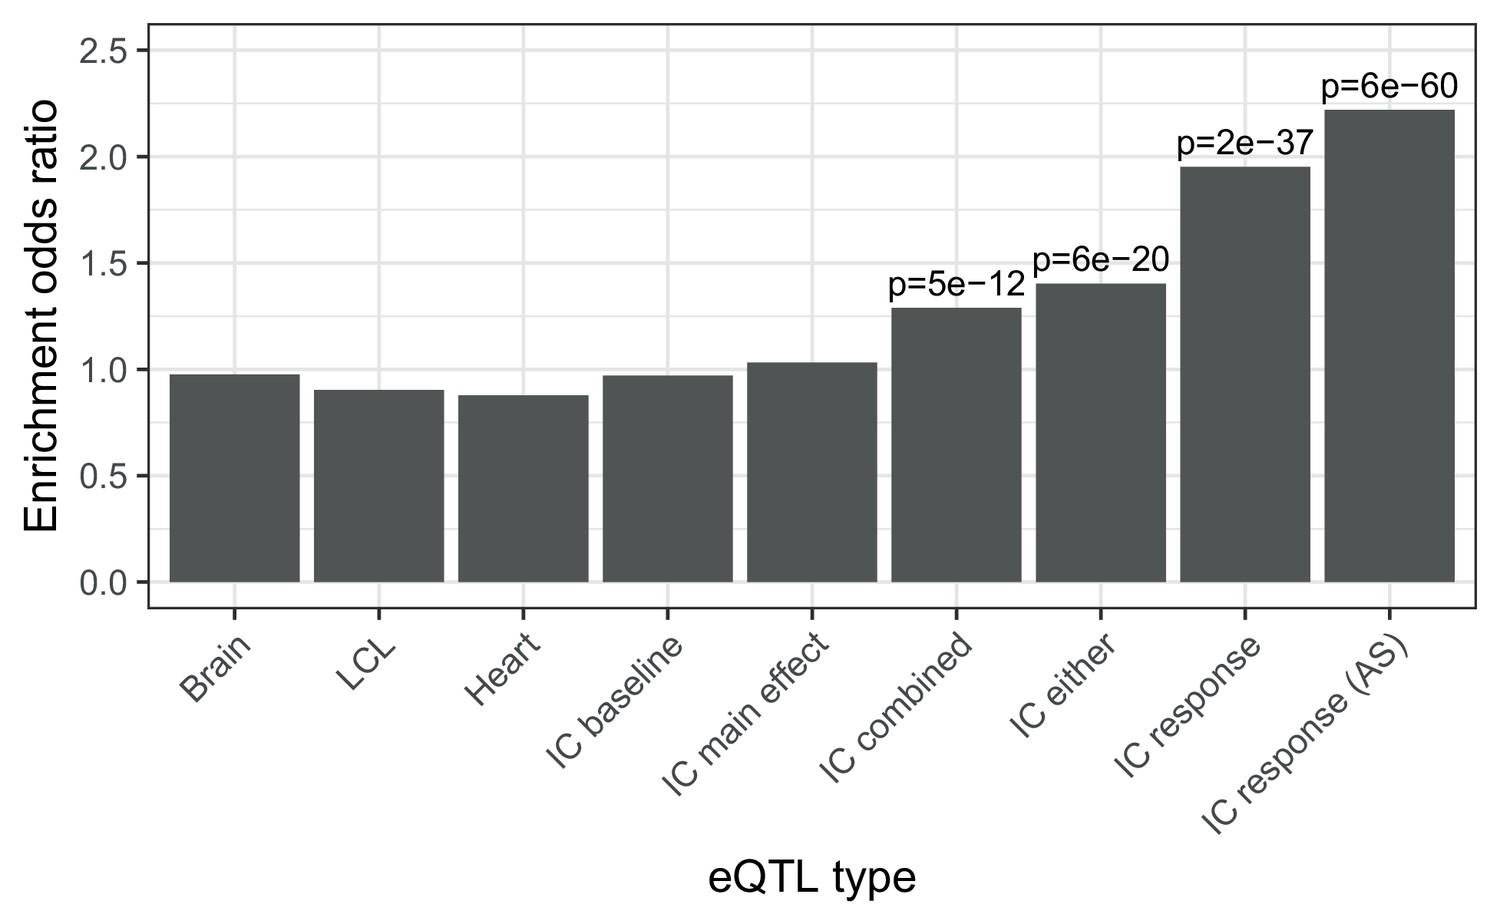
Enrichment of different classes of expression QTLs in ACT GWAS.
Enrichment of low () ACT GWAS -values in different classes of expression QTLs (). First three are GTEx tissues (steady-state). IC baseline: iPSC-derived cardiomyocytes at baseline (no doxorubicin). IC main effect: marginal effect of genotype across concentrations. IC combined: jointly testing for a main effect or interaction effect with concentration. IC either: either a marginal or response eQTL. IC response: testing for an interaction effect between genotype and concentration. IC response (AS): as for IC response but using both total and allele-specific expression to map reQTLs.
Figure 5—figure supplement 4
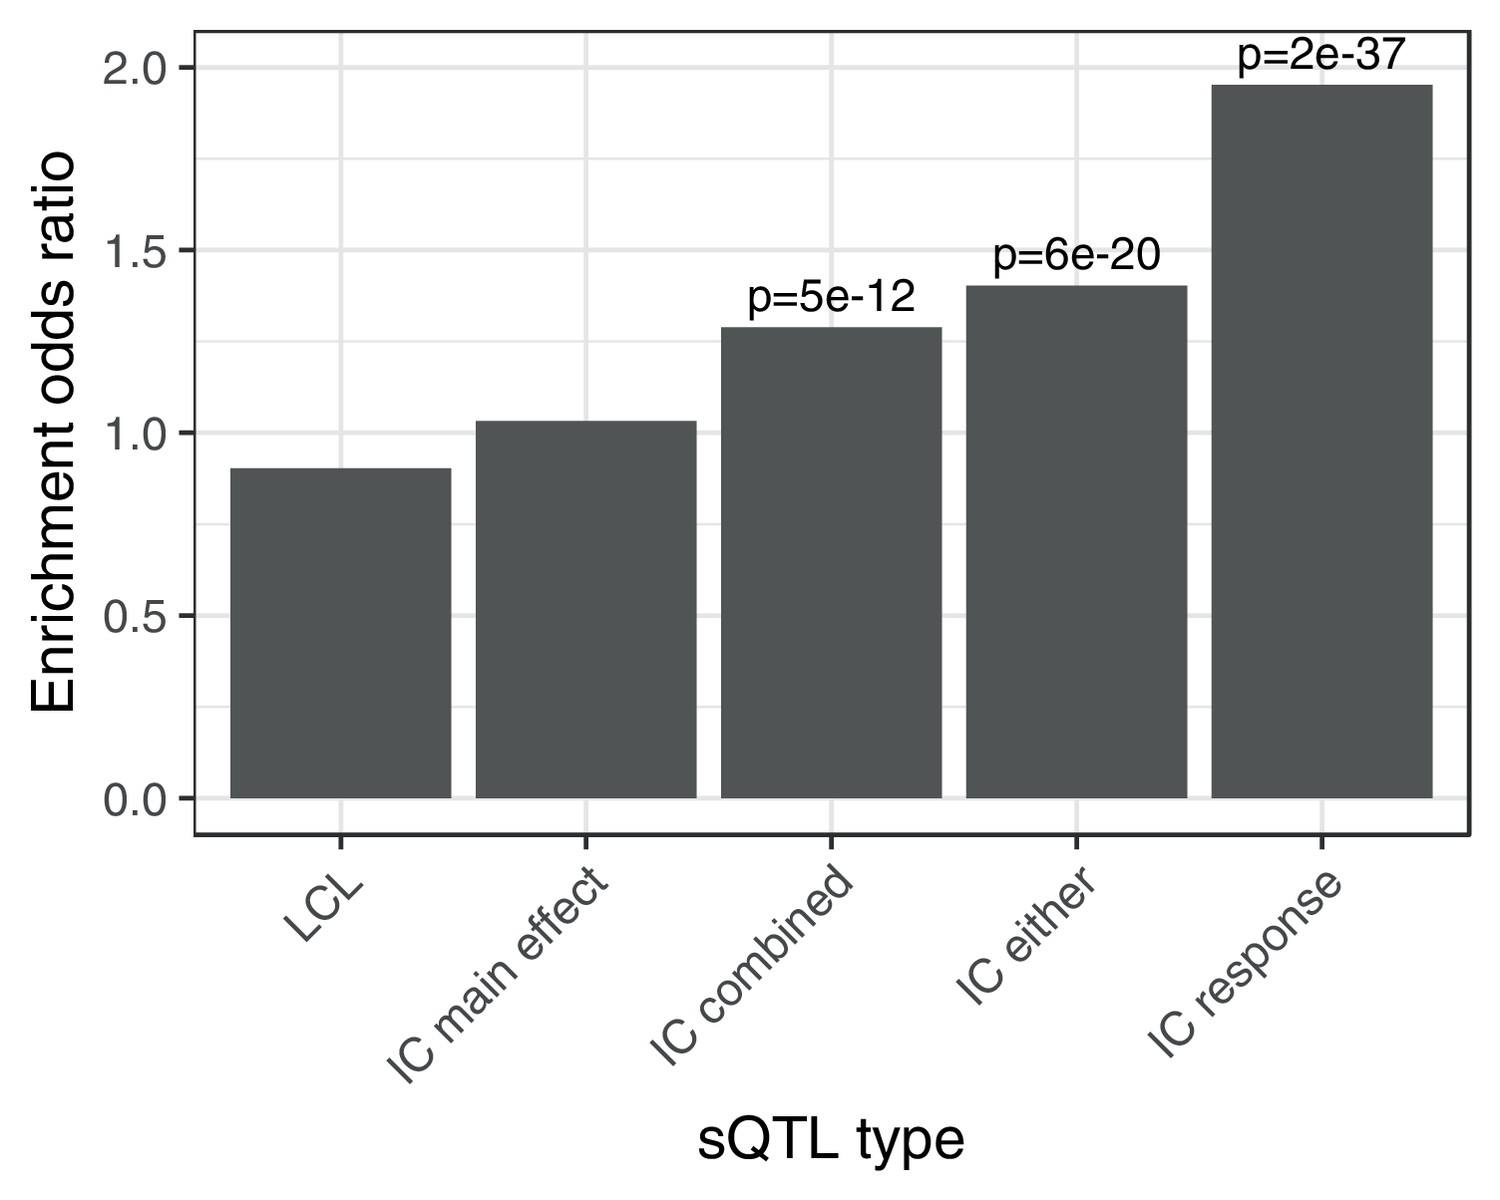
Enrichment of different classes of splicing QTLs in ACT GWAS.
Enrichment of low () ACT GWAS -values in different classes of splicing QTLs (). LCL: LeafCutter splicing QTLs mapped in the Yoruban LCLs (Li et al., 2016). IC main effect: marginal effect of genotype across concentrations. IC combined: jointly testing for a main effect or interaction effect with concentration. IC either: either a marginal or response eQTL. IC response: testing for an interaction effect between genotype and concentration.
Figure 5—figure supplement 5

Colocalization analysis.
Colocalization analysis for genes where the posterior probability of no association estimated by coloc is .
Additional files
-
Supplementary file 1
Assignment of each gene’s response profile to differing doxorubicin concentrations into one of 6 clusters.
- https://doi.org/10.7554/eLife.33480.027
-
Supplementary file 2
HOMER2 pathway enrichment for each cluster from Supplementary file 1.
Cluster: One of six clusters. TermID: Gene set ID. Term: gene set name. Odds_ratio: enrichment of this gene set in this cluster compared to background. p: -value from hypergeometric test. p_adjust: Benjamini-Hochberg adjusted -value. Overlap: number of genes shared by the gene set and the cluster. cluster_size: number of genes not in the cluster. Geneset_size: number of genes in the cluster. Total genes: total number of genes considered.
- https://doi.org/10.7554/eLife.33480.028
-
Supplementary file 3
HOMER2 promoter motif enrichment for each cluster from Supplementary file 1.
cluster: One of six clusters. motif_info: full motif name including GEO source if applicable. motif: name of transcription factor. mphConsensus: consensus motif using IUPAC notation. odds_ratio: enrichment of motif in promoters of genes in this cluster compared to background. log_p: log -value from hypergeometric test. p_adjust: Benjamini-Hochberg adjusted -value. Overlap: number of genes in the cluster with this motif in their promoter. Background_overlap: number of genes not in the cluster with this motif in their promoter. cluster_size: number of genes not in the cluster. hbackground_size: number of genes not in the cluster.
- https://doi.org/10.7554/eLife.33480.029
-
Supplementary file 4
All significant (5% FDR) marginal effect eQTL.
gene: Ensembl gene ID. chr: Chromosome. pos: eSNP position. RSID: Rapid Stain Identification Series of the eSNP. p: from suez Bonferroni corrected for the number of SNPs tested for the gene. q: Benjamini-Hochberg adjusted -value.
- https://doi.org/10.7554/eLife.33480.030
-
Supplementary file 5
All significant (5% FDR) response eQTL using total expression only.
Columns are as for Supplementary file 4
- https://doi.org/10.7554/eLife.33480.031
-
Supplementary file 6
All significant (5% FDR) response eQTL mapped using total and allele specific expression.
Columns are as for Supplementary file 4
- https://doi.org/10.7554/eLife.33480.032
-
Supplementary file 7
LeafCutter splicing clusters and their association with doxorubicin concentration. cluster: Cluster ID.
p: -value for Dirichlet-Multinomial GLM likelihood ratio test for differential splicing across doxorubicin concentrations. q: Benjamini-Hochberg adjusted -value.
- https://doi.org/10.7554/eLife.33480.033
-
Supplementary file 8
LeafCutter estimates of Percent Spliced In (PSI) for each splice junction (intron) at each doxorubicin concentration.
- https://doi.org/10.7554/eLife.33480.034
-
Supplementary file 9
Splicing QTL mapped using LeafCutter and suez.
Columns are as for Supplementary file 4 except that column one is the splice junction (intron) rather than the gene.
- https://doi.org/10.7554/eLife.33480.035
-
Supplementary file 10
Splicing response QTL mapped using LeafCutter and suez.
Columns are as for Supplementary file 9.
- https://doi.org/10.7554/eLife.33480.036
-
Supplementary file 11
Cardiac troponin levels at different doxorubicin dosages.
cell_line: internal cell line ID and replicate number. dbgap: individual ID in dbGaP. dosage: doxorubicin concentration. troponin: cardiac troponin level.
- https://doi.org/10.7554/eLife.33480.037
-
Supplementary file 12
Optimal lasso model predicting normalized troponin level from gene expression.
Troponin level was normalized to be zero-mean and unit-variance across individuals at each concentration. gene: Ensembl gene id. hugo: HUGO approved gene symbol. beta: regression coefficient from lasso.
- https://doi.org/10.7554/eLife.33480.038
-
Supplementary file 13
Optimal lasso model predicting normalized troponin level from the component of gene expression predictable from genotype.
Troponin level was normalized to be zero-mean and unit-variance across individuals at each concentration. gene: Ensembl gene id. hugo: HUGO approved gene symbol. beta: regression coefficient from lasso.
- https://doi.org/10.7554/eLife.33480.039
-
Supplementary file 14
Genes significantly differentially expressed with respect to troponin level at each doxorubicin concentration.
conc: doxorubicin concentration. gene: Ensembl gene id. rho: Spearman correlation between gene expression and troponin level. p: Spearman correlation -value. p_adjust: Benjamini-Hochberg adjusted -value.
- https://doi.org/10.7554/eLife.33480.040
-
Supplementary file 15
Optimal lasso model predicting ACT risk from gene expression using previously published data (Burridge et al., 2016).
gene: Ensembl gene id. beta: regression coefficient from lasso.
- https://doi.org/10.7554/eLife.33480.041
-
Supplementary file 16
Colocalization analysis of response-eQTL and ACT GWAS.
gene: Ensembl gene id. snps: number of SNPs tested. PP.H0.abf: posterior probability of no association. PP.H1.abf: posterior probability of GWAS association only. PP.H2.abf posterior probability of reQTL only. PP.H3.abf: posterior probability of GWAS variant and reQTL being independent. PP.H4.abf: posterior probability of GWAS and reQTL colocalizing to the same variant.fa
- https://doi.org/10.7554/eLife.33480.042
-
Transparent reporting form
- https://doi.org/10.7554/eLife.33480.043
Download links
A two-part list of links to download the article, or parts of the article, in various formats.
Downloads (link to download the article as PDF)
Open citations (links to open the citations from this article in various online reference manager services)
Cite this article (links to download the citations from this article in formats compatible with various reference manager tools)
Determining the genetic basis of anthracycline-cardiotoxicity by molecular response QTL mapping in induced cardiomyocytes
eLife 7:e33480.
https://doi.org/10.7554/eLife.33480


