Lamellar projections in the endolymphatic sac act as a relief valve to regulate inner ear pressure
- Harvard Medical School, United States
- Boston Children’s Hospital, United States
- Janelia Research Campus, Howard Hughes Medical Institute, United States
- Harvard University, United States
Figures
Figure 1 with 1 supplement
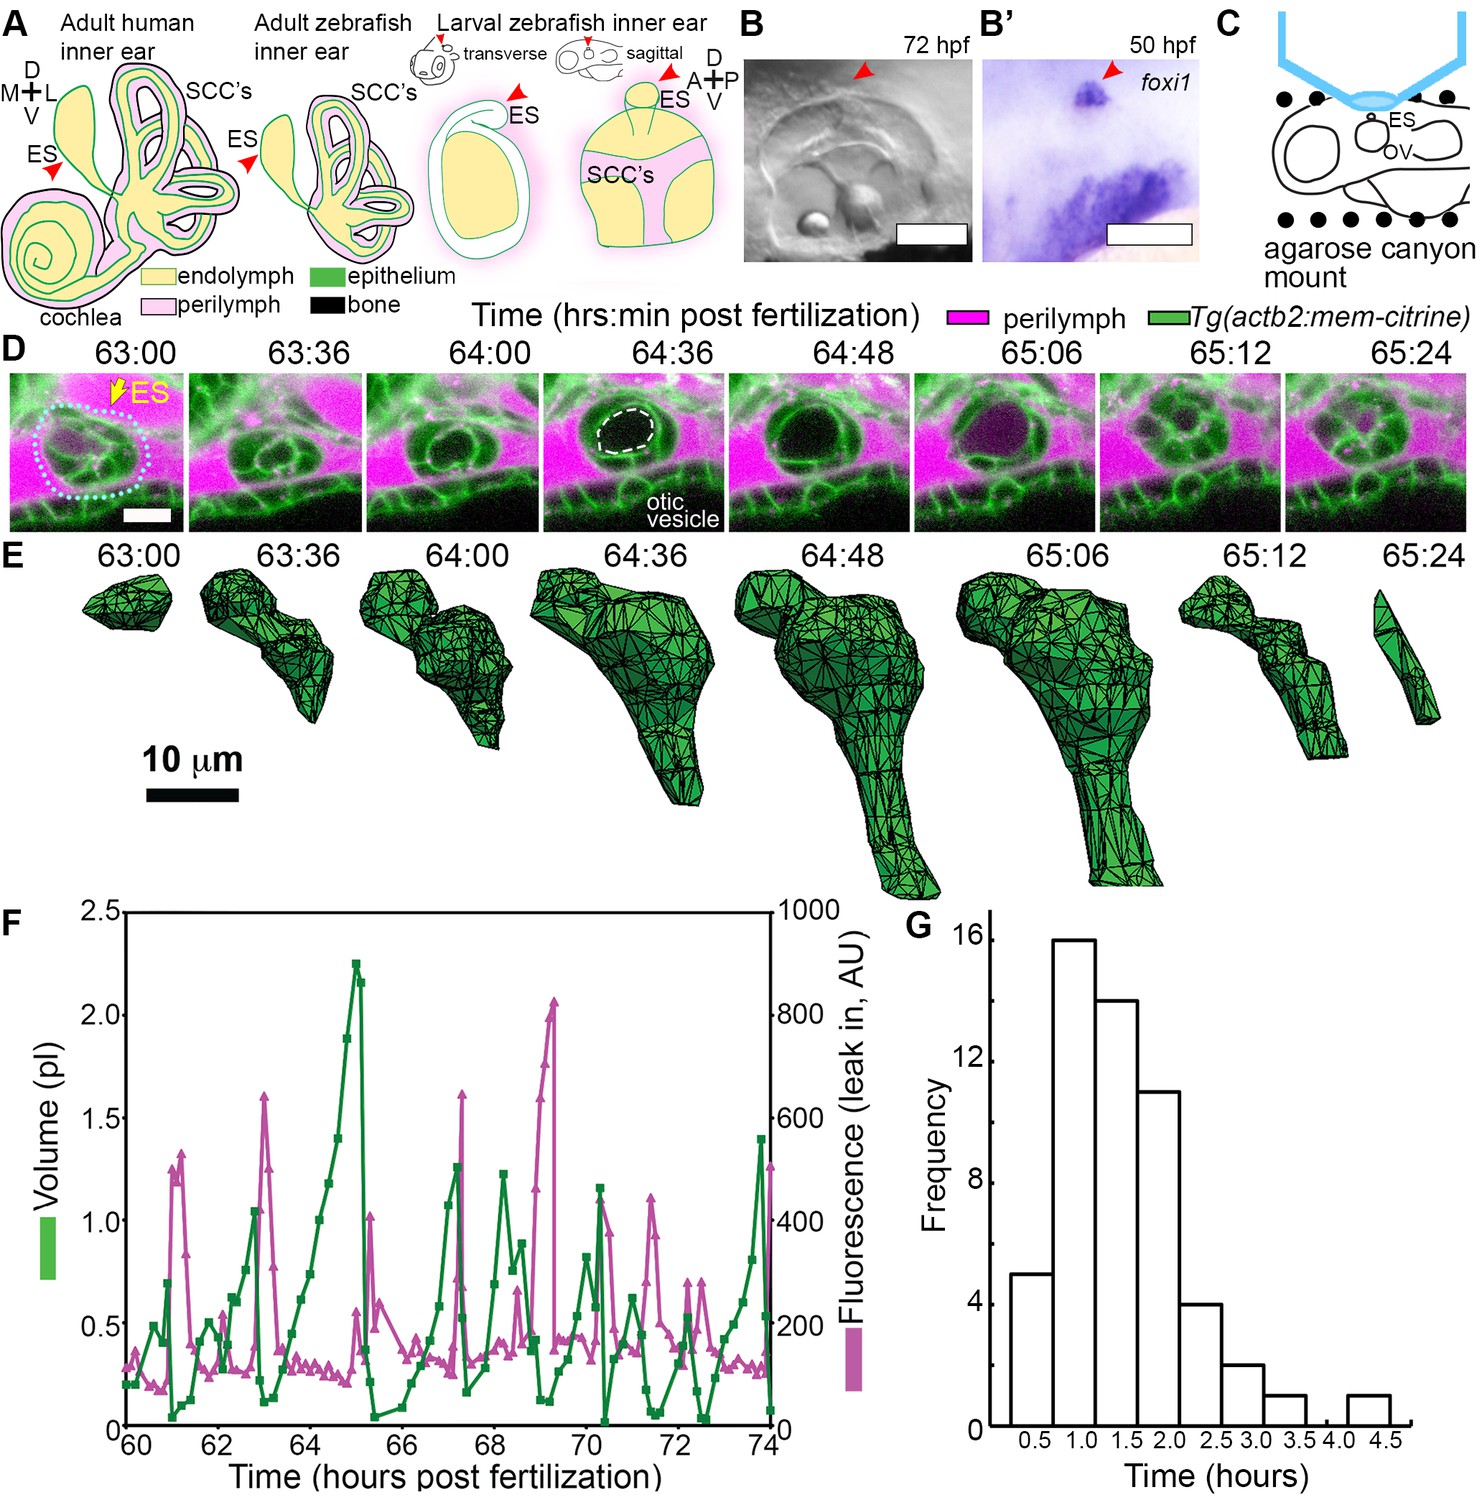
ES lumen slowly inflates and rapidly deflates every 0.3–4.5 hr.
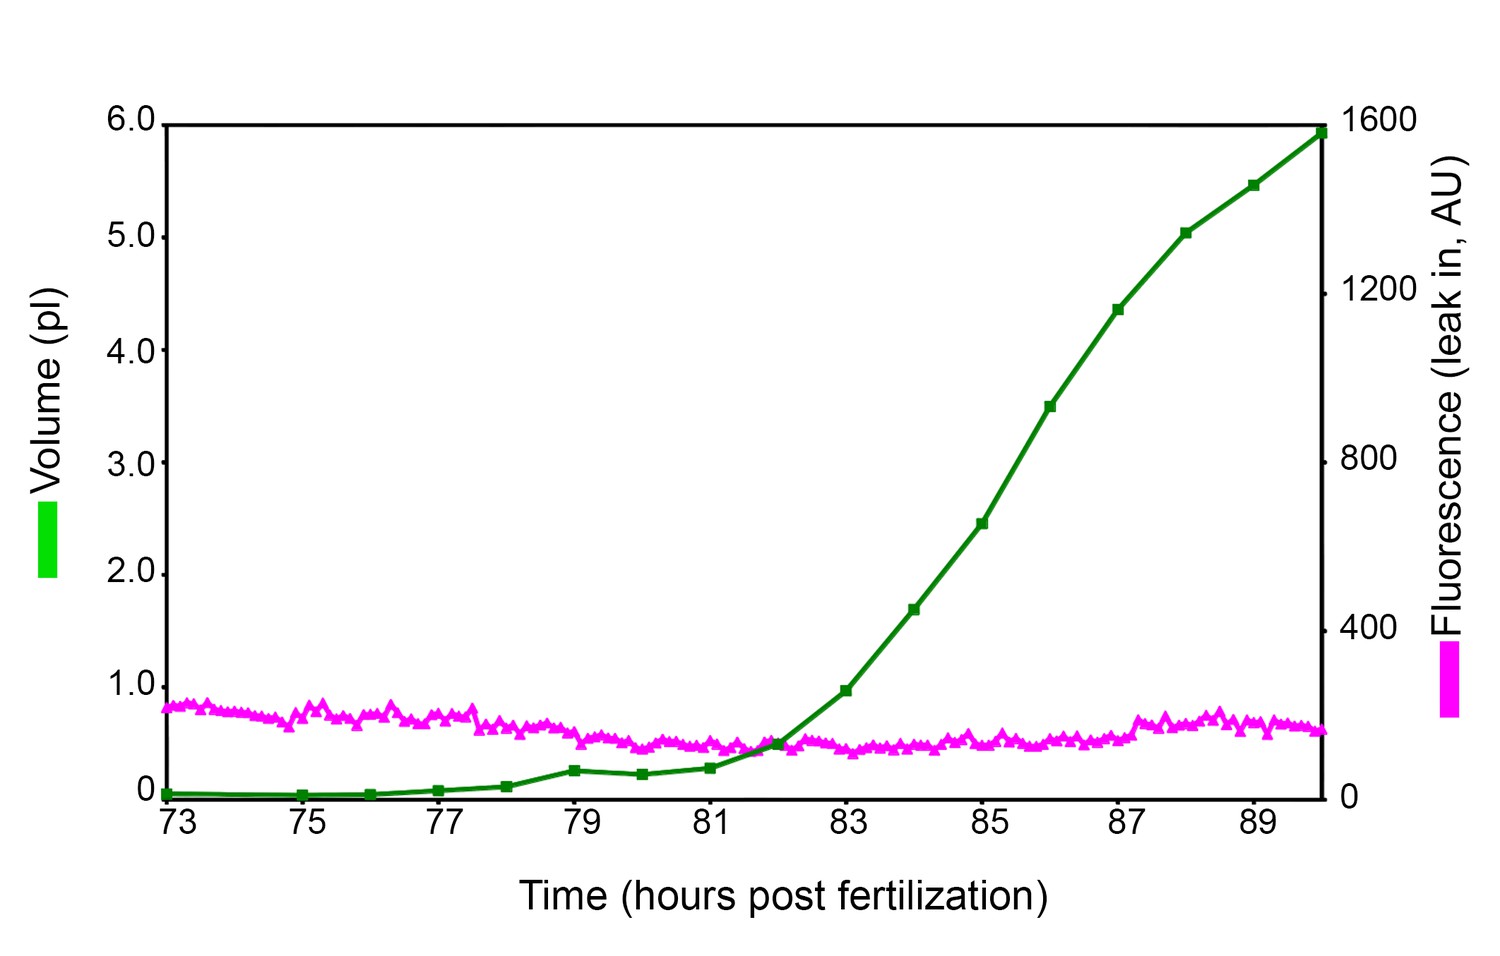
(A) Illustration of the adult human inner ear showing cochlea, semicircular canals (SCCs), and endolymphatic duct and sac (ES, red arrowhead) and their organization of tissue (green), endolymph (beige), perilymph (magenta), and bone (black). Illustrations of the adult and larval zebrafish inner ear showing ES (indicated with red arrowheads, see also Figure 1—figure supplement 1 and Video 1 for how the zebrafish ES first forms). (B) Micrograph of larval zebrafish, sagittal view. (B’) In situ of foxi1 highlights position of ES (red arrowhead), n = 12. (C) Illustration of imaging setup. (D) Slices and select time points from 3D confocal time course showing a single inflation and deflation event from a live zebrafish embryo. Cell membranes (green) are labeled using ubiquitous membrane citrine transgenes. Perilymph (magenta) is labeled with 3 kDa dextran-Texas red. ES identified with dotted blue outline and yellow arrow. Lumen of inflated ES identified with dashed white outline in 64:36 panel. (E) Corresponding 3D meshes of the segmented ES lumen volume. (F) Quantification of segmented ES volumes (primary axis, green) and leak in fluorescence (secondary axis, magenta) over multiple cycles (see also Figure 1—figure supplement 1B,C and Videos 2–3). (G) Histogram of times between peak inflation volumes, compiled from eight different time courses and 54 inflations. Scale bars 100 μm for (B) and 10 μm for (D,E).
Figure 1—figure supplement 1
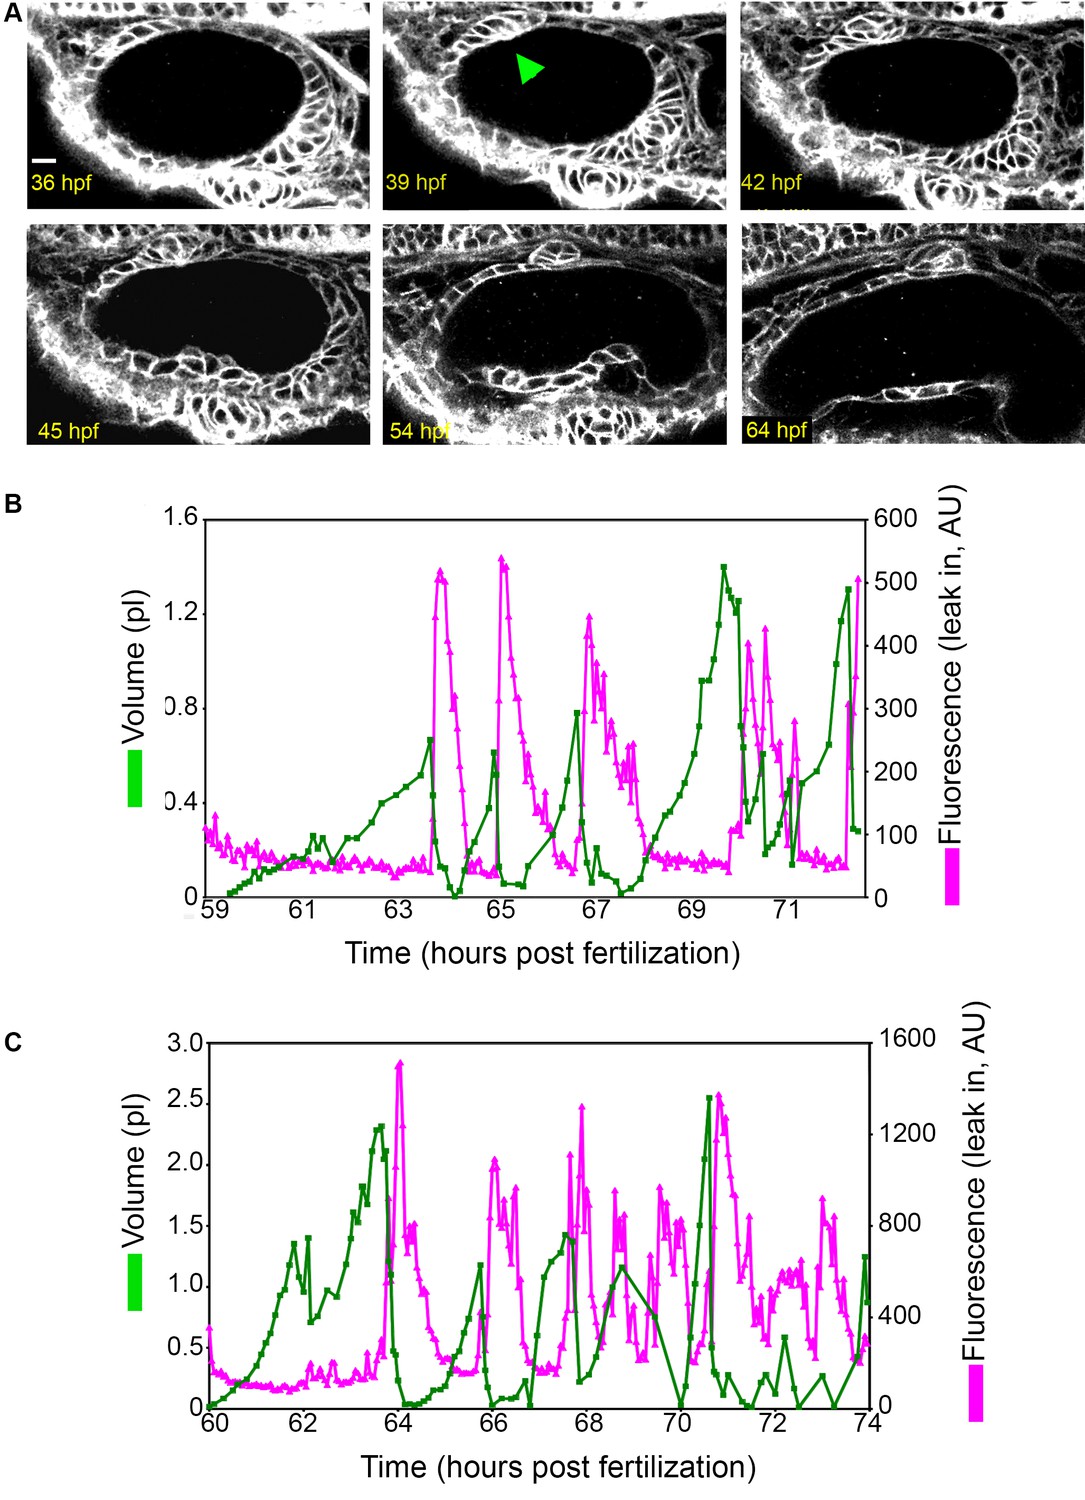
Early ES development and additional examples of wild-type ES inflation and deflation.
(A) ES morphogenesis begins at 36-hr post fertilization (hpf) as an evagination in the dorsal epithelial wall of the otic vesicle (green arrowhead points to nascent ES, see also Video 1). Scale bar 10 μm. (B–C) Quantification of segmented ES volumes (primary axis, green) and leak in fluorescence (secondary axis, magenta) over multiple cycles. (B) Quantification of segmented ES volumes (primary axis, green) and leak in fluorescence (secondary axis, magenta) over multiple cycles (see left panel of Video 3). (C) Additional time-lapse analysis (see right panel of Video 3).
Figure 2
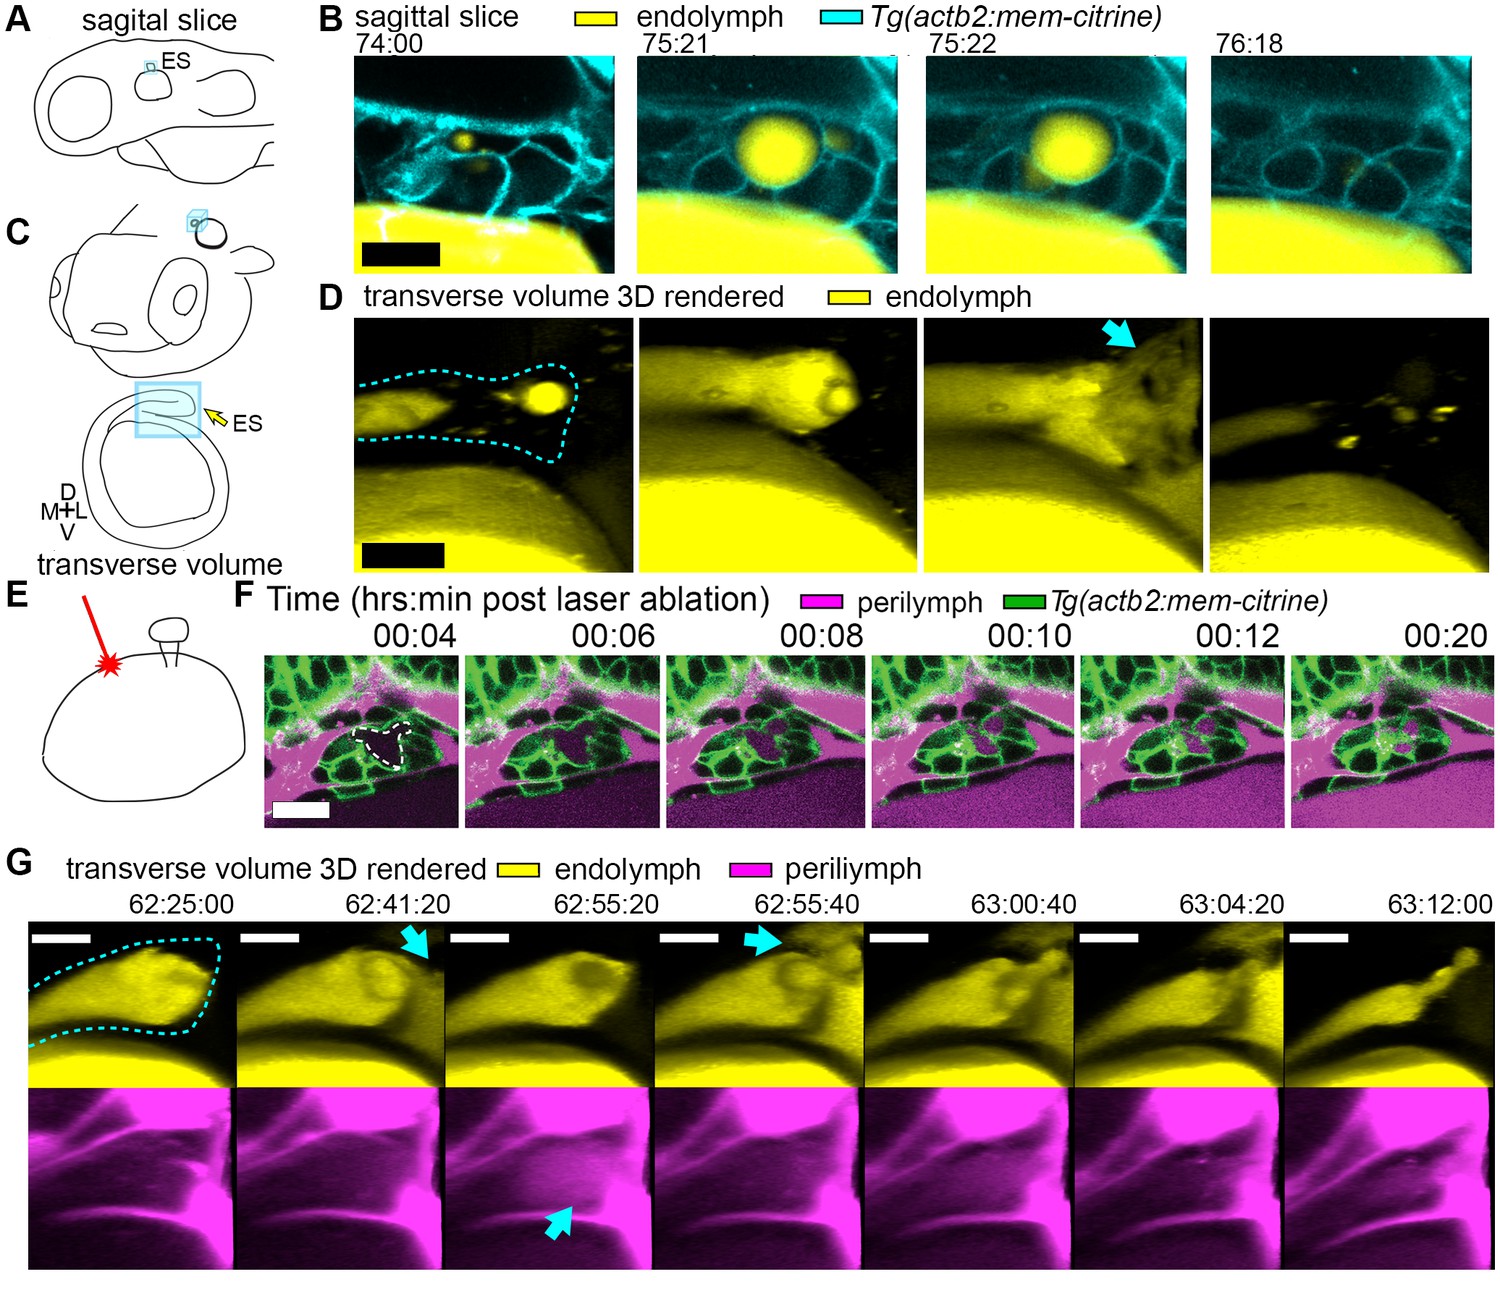
Hydrostatic pressure transmits endolymph through duct to inflate the ES.
(A) Illustration of larval zebrafish highlighting sagittal plane of image acquisition (blue square). (B) Time points of individual sagittal slices of raw data from 3D time course (endolymph labeled yellow by single dye injection into otic vesicle, membrane citrine in cyan). (C) Illustration of larval zebrafish highlighting transverse perspective (blue box) for rendered volumes of ES. (D) Time points from time course of raw data rendered in 3D transverse view (endolymph in yellow, ES tissue outlined with dashed line) showing endolymph flowing through duct to ES and then out to perilymph (blue arrow). (E) Illustration of strategy for laser ablating otic vesicle cells with point-scanning 2-photon laser to ablate 2–3 targeted cells. (F) Slices from 4D confocal time course after laser ablation showing ES deflation. ES lumen is outlined with a white dashed line in (F), n = 4. (G) Time points from time course rendered in 3D transverse view (endolymph in yellow, perilymph in magenta, ES tissue outlined with dashed line), n = 8. Blue arrows indicate endolymph expulsion or perilymph leak in events (D,G). All scale bars 10 μm.
Figure 3 with 1 supplement
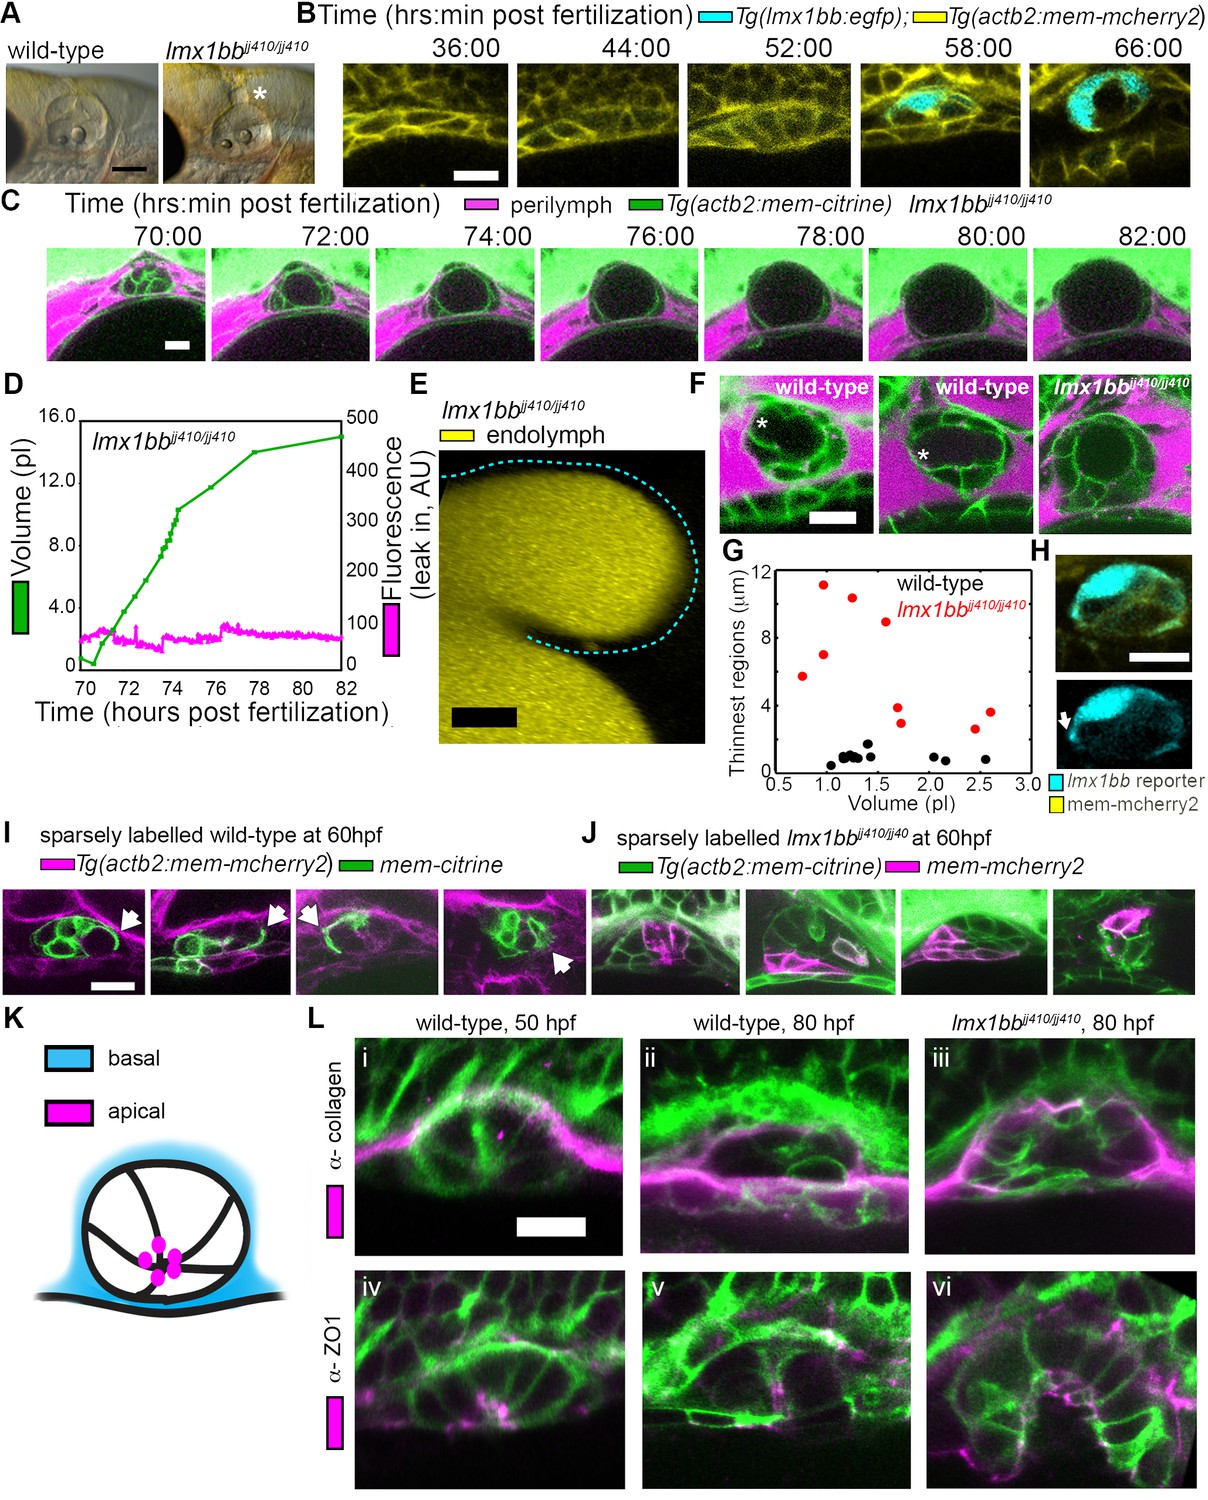
Lmx1bb is necessary for development of the ES’s ability to form breaks in its diffusion barrier and deflate.
(A) Lateral view of wild-type and lmx1bbjj410/jj410 mutant ears imaged by bright-field microscopy at 80 hpf, asterisk labels greatly enlarged mutant ES. Scale bar, 100 μm. (B) Slices from 3D confocal time course of an lmx1bb transcriptional reporter (cyan, Tg(lmx1bb:egfp)mw10/mw10; yellow, Tg(actb2:mem-mcherry2)hm29), n = 3. (C) Slices and select time points from 3D confocal time course of lmx1bbjj410/jj410 mutant embryos. Membrane (green) from ubiquitous membrane citrine transgenes. Perilymph (magenta) from 3 kDa dextran-Texas red, n = 4. (D) Quantification of segmented ES volumes (primary axis, green) and leak-in fluorescence (secondary axis, magenta) from lmx1bbjj410/jj410 time course in (C) (see also Figure 3—figure supplement 1 and Videos 5–6). (E) 3D transverse view (endolymph in yellow) from timelapse showing endolymph in dilated mutant ES, outlined with dashed blue line, n = 2. (F) Small regions with thin membranes (asterisks) form in the inflated ES of wild-type but not lmx1bb mutants. (G) Quantification of minimum epithelial thickness versus inflated ES volume in mutant (plotted in red, n = 9) and wild-type (plotted in black, n = 14). Compiled from 65 to 80 hpf embryos. (H) Uneven labeling from Tg(lmx1bb:egfp) reveals thin basal processes (white arrow). (I) Wild-type ES examples with sparsely labeled cells: membrane-labeled citrine (green) in a membrane-labeled cherry background (magenta), white arrows indicate lamellar projections, n = 15. (J) lmx1bbjj410/jj410 mutant ES examples with sparsely labeled cells: membrane cherry (magenta) in a membrane citrine background (green), n = 9. (K) Cartoon schematic of apico-basal organization of ES. (L) Supporting whole-mount immuno-stains for basal and apical markers (collagen and ZO-1, both magenta) in a membrane-labeled citrine background (green), n = 16, 15, 6, 32, 21, and 12 for (i-vi). Scale bars in (B-L), 10 μm.
Figure 3—figure supplement 1
Inflation of additional mutant ES.
Quantification of segmented ES volumes (primary axis, green) and leak in fluorescence (secondary axis, magenta) from an additional time-lapse of an lmx1bbjj410/jj410 mutant (see Video 6).
Figure 4
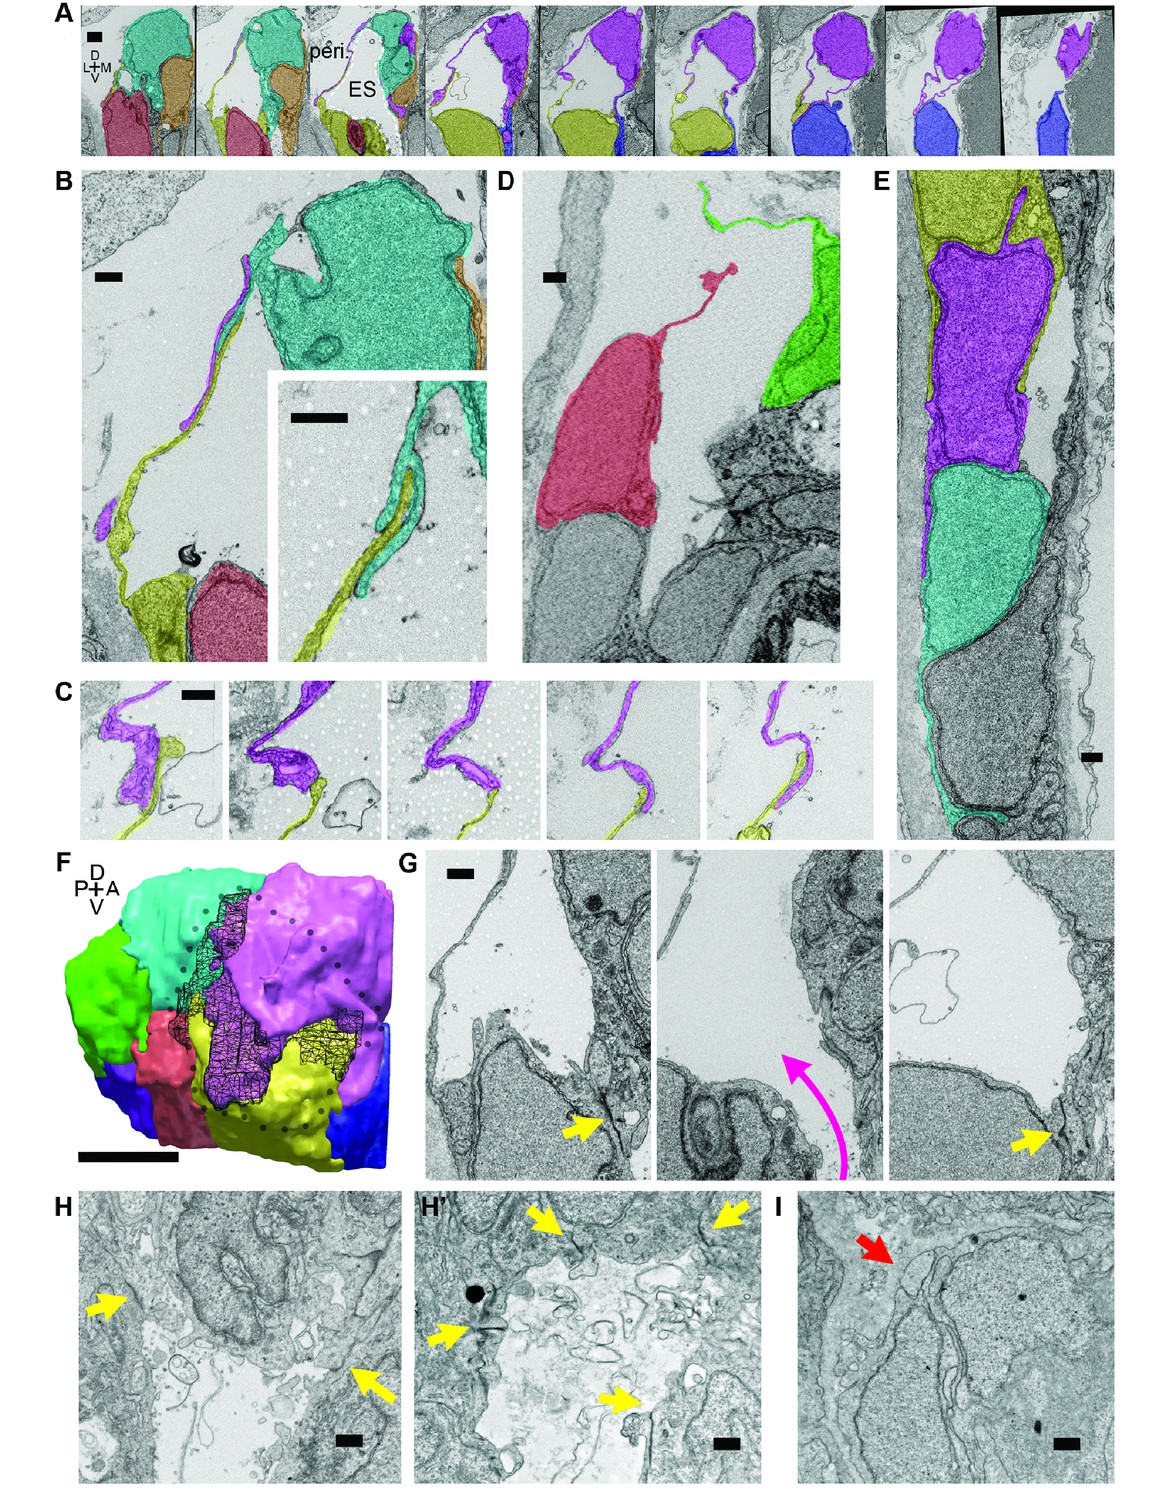
Lamellar protrusions at the tip of the ES exist in open and closed configurations.
(A) Select images from serial-section scanning electron microscopy of a 5.5 dpf zebrafish’s right inner ear. Dorsal is up, lateral left, medial right, ventral down, anterior top, and posterior bottom of the series z-stack. Cells forming lamellar barriers were labeled (color overlays, consistent across panels) to highlight connectivity of lamellae. Presented slices are a subset from the series, each separated by 960 nm (Video 8). The lumen of the ES is labeled and outlined with a white dashed line in third panel; perilymph (peri.). (B) Lamellae interdigitate and can form tongue-in-groove structures (inset). (C) Lamellae can interweave. (D) Example of lamellar junctions in an open configuration. (E) Cells in endolymphatic duct have basal lamellae, with the presented duct connecting with ES in panel A. (F) 3D rendering of ES segmentation from serial micrographs shown in panel (A) and Video 8. Black dotted-outline encompasses area of closed, endolymph-filled lamellae. Black mesh highlights areas of membrane overlap between lamellae that are spread open. (G) Electron-dense tight junctions (yellow arrows) present in cells that also have spread basal protrusions. An opening in the apical junctions creates a path from the duct to the basal protrusions (magenta arrow, slices in three panels 1.2 μm apart). (H, H’) lmx1bbjj410/jj410 embryos maintain apical junctions between ES cells (yellow arrows). (I) Mutant ES cells lack basal protrusions (red arrow). Scale bar in (A) is 1000 nm, (F) is 5 μm, and all other scale bars are 500 nm. (B–G) Serial section electron microscopy, n = 2, additional transmission EM, n = 3. (H–I) Serial section EM of mutant, n = 1, transmission EM, n = 3.
Figure 5
AO-LLSM reveals dynamics of ES cells.
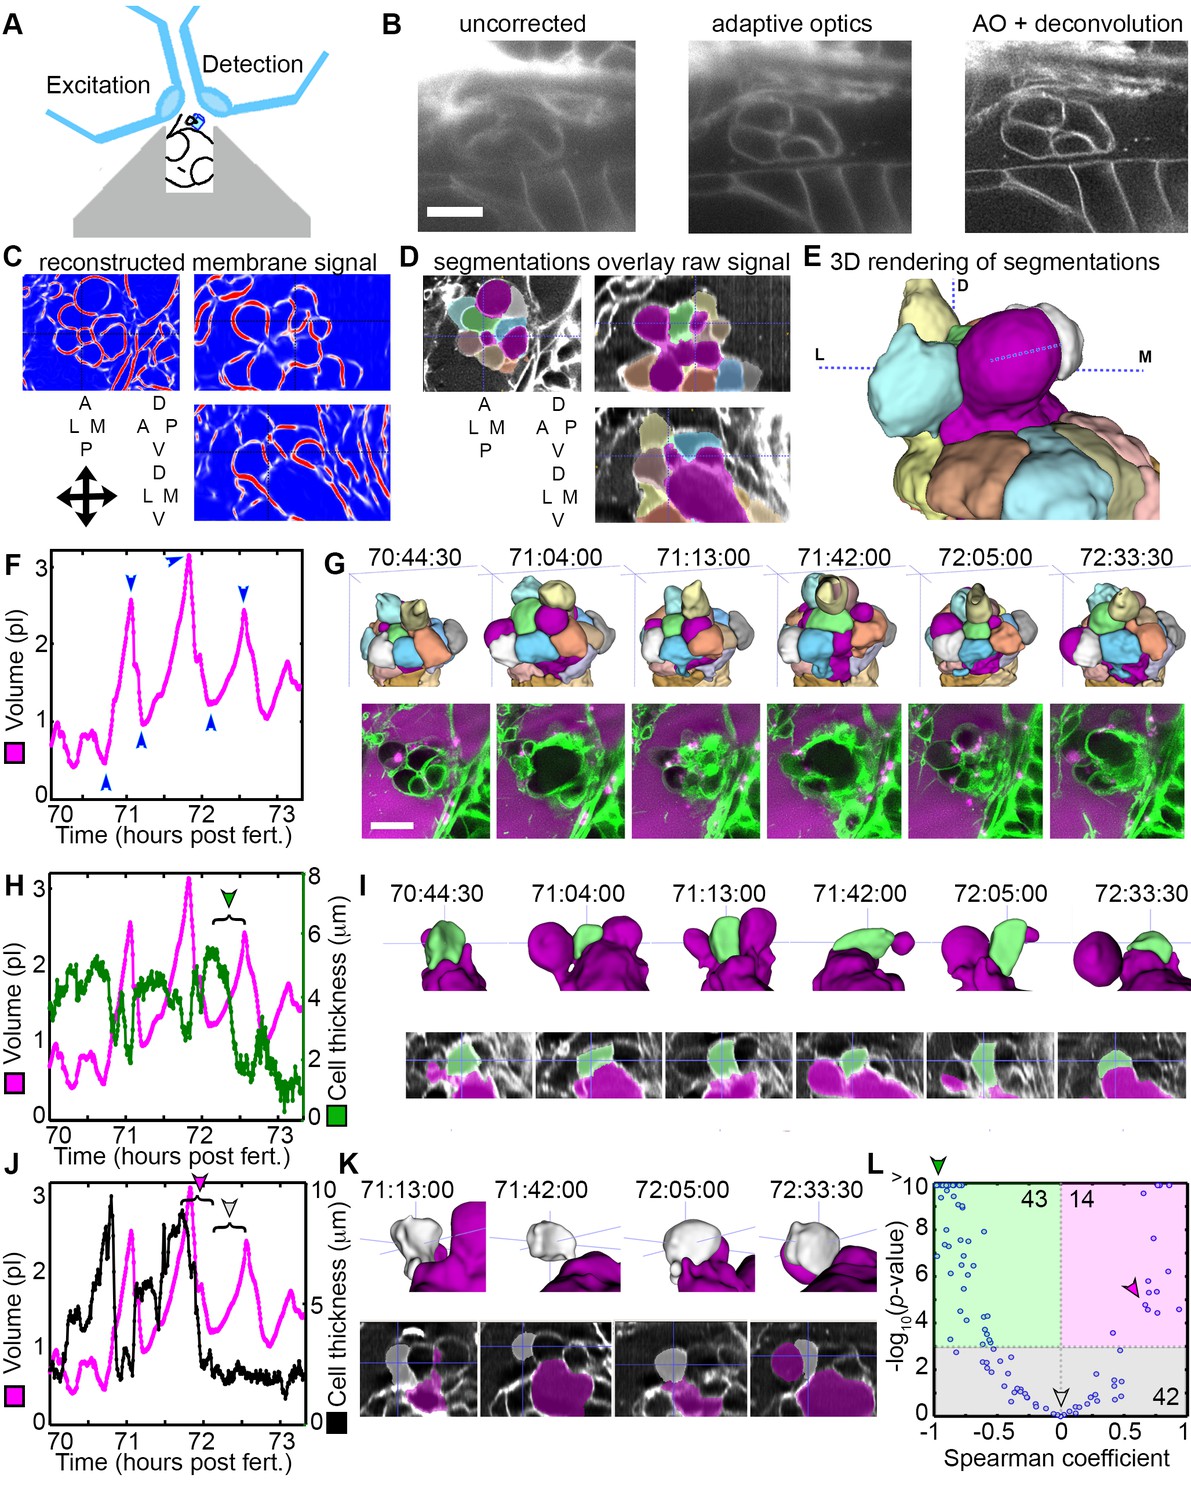
(A) Illustration of AO-LLSM mounting strategy for imaging ES using volcano mount. (B) Representative LLSM images without adaptive optics (AO), with AO, and with AO followed by deconvolution. (C) Three orthogonal views of ACME membrane reconstruction. (D) Three orthogonal views of raw fluorescence signal overlaid with cell segmentations and ES lumen segmentation (magenta), n = 4. (E) 3D rendering of segmented cells and ES lumen (magenta). (F) Volume measurements of segmented ES lumen, imaged every 30 s for over 3 hr (Videos 8–10). Blue arrowheads point to time points presented in G and I. (G) Top, dorsal perspective displaying 3D renderings of segmented cells. Bottom, maximum intensity projections (MIP) of 4.5 μm slab through tip of ES shows raw data of the ES for the same time points. (H) Secondary axis presents green cell’s thickness versus time (green cell in (G)). Again, primary axis is volume of ES lumen for comparison. (I) Top, 3D renderings of just green cell from (G) and magenta lumen highlight stretching of cell, dorsal-medial perspective. Bottom, centered cross-sectional view of raw data overlaid with green cell’s and ES lumen’s segmentations for the same time points. (J) Secondary axis is plot of grey cell’s thickness (grey in (G)). (K) Top, 3D renderings of only grey cell and magenta lumen. Bottom, centered cross-section view of raw data overlaid with grey cell’s and ES lumen’s segmentations for same time points. (L) Scatter plot of results from Spearman correlation test of cell thickness trajectories and ES lumen volume trajectories for individual inflation and deflation intervals that are monotonic (example intervals bracketed in H and J). Green region highlights significant correlation (p-value<10−3) between cells thinning during inflation or thickening during deflation. Green arrowhead points to test result for bracketed interval in H. Grey region highlights instances where there is no significant correlation between the trajectory of cell thickness and lumen volume. Grey arrowhead points to test result for bracketed interval in J (grey arrowhead). Magenta region highlights significant correlation between cells thinning during deflation or thickening during inflation. Magenta arrowhead points to test result for bracketed interval in J (magenta arrowhead). Y-axis was capped at 10 so that all values greater than or equal to 10 plot as 10, n = 99. All scale bars 10 μm.
Figure 6

Basal lamellae are dynamic.
(A) 3D rendering of AO-LLSM data, three sequential time points 30 s apart (membrane citrine depicted in grey, Video 10). Bright patches on surface move (red, blue, green arrows). (B) Consecutive 3D renderings overlaid as red (71:18:00), blue (71:18:30), and then green (71:19:00). Immobile regions remain grey, while regions of displacement are red, blue, and green. Arrows point to moving lamellae. (C) Additional example of moving lamellae, again visualized by overlaying consecutive images in red (70:08:30), blue (70:09:00), and then green (70:09:30). Arrows point to moving lamellae. (D) Top, time points of 3D rendered segmentations spanning 30 min. Below, 4.5 μm MIP slabs of the raw data for the same time points. For both views, arrow points to same region where lumen segmentation is slowly exposed as thin lamellar region expands. (E) Top, time points of 3D rendered segmentations spanning 2 min. Below, 4.5 μm MIP slabs of the raw data for the same time points. For both views, arrow points to same region where lumen segmentation rapidly inflates as thin lamellar region expands. (F) Consecutive 3D renderings, same as (E), overlaid as red (71:46:00), blue (71:46:30), and then green (71:47:00). Arrows point to rapidly inflating lamellae. (G) Consecutive 3D renderings, overlaid as red (70:48:30), blue (70:49:00), and then green (71:49:30). Arrows point to rapidly inflating lamellae, same region as (F). (H) 4.2 μm MIP slabs of a time point from a time-lapse of wild-type embryos expressing myosin GFP (top) mCherry-utrophin (middle), and merged (myosin, green, utrophin, magenta, see Video 12), n = 4. (I) 4.2 μm MIP slabs of a time point from a time-lapse of lmx1bb crispant embryos expressing myosin GFP (see Video 12), n = 2. (J) Dilated mutant ES collapses following puncture of the otic vesicle with a tungsten needle, n = 5. All scale bars 10 μm.
Figure 7
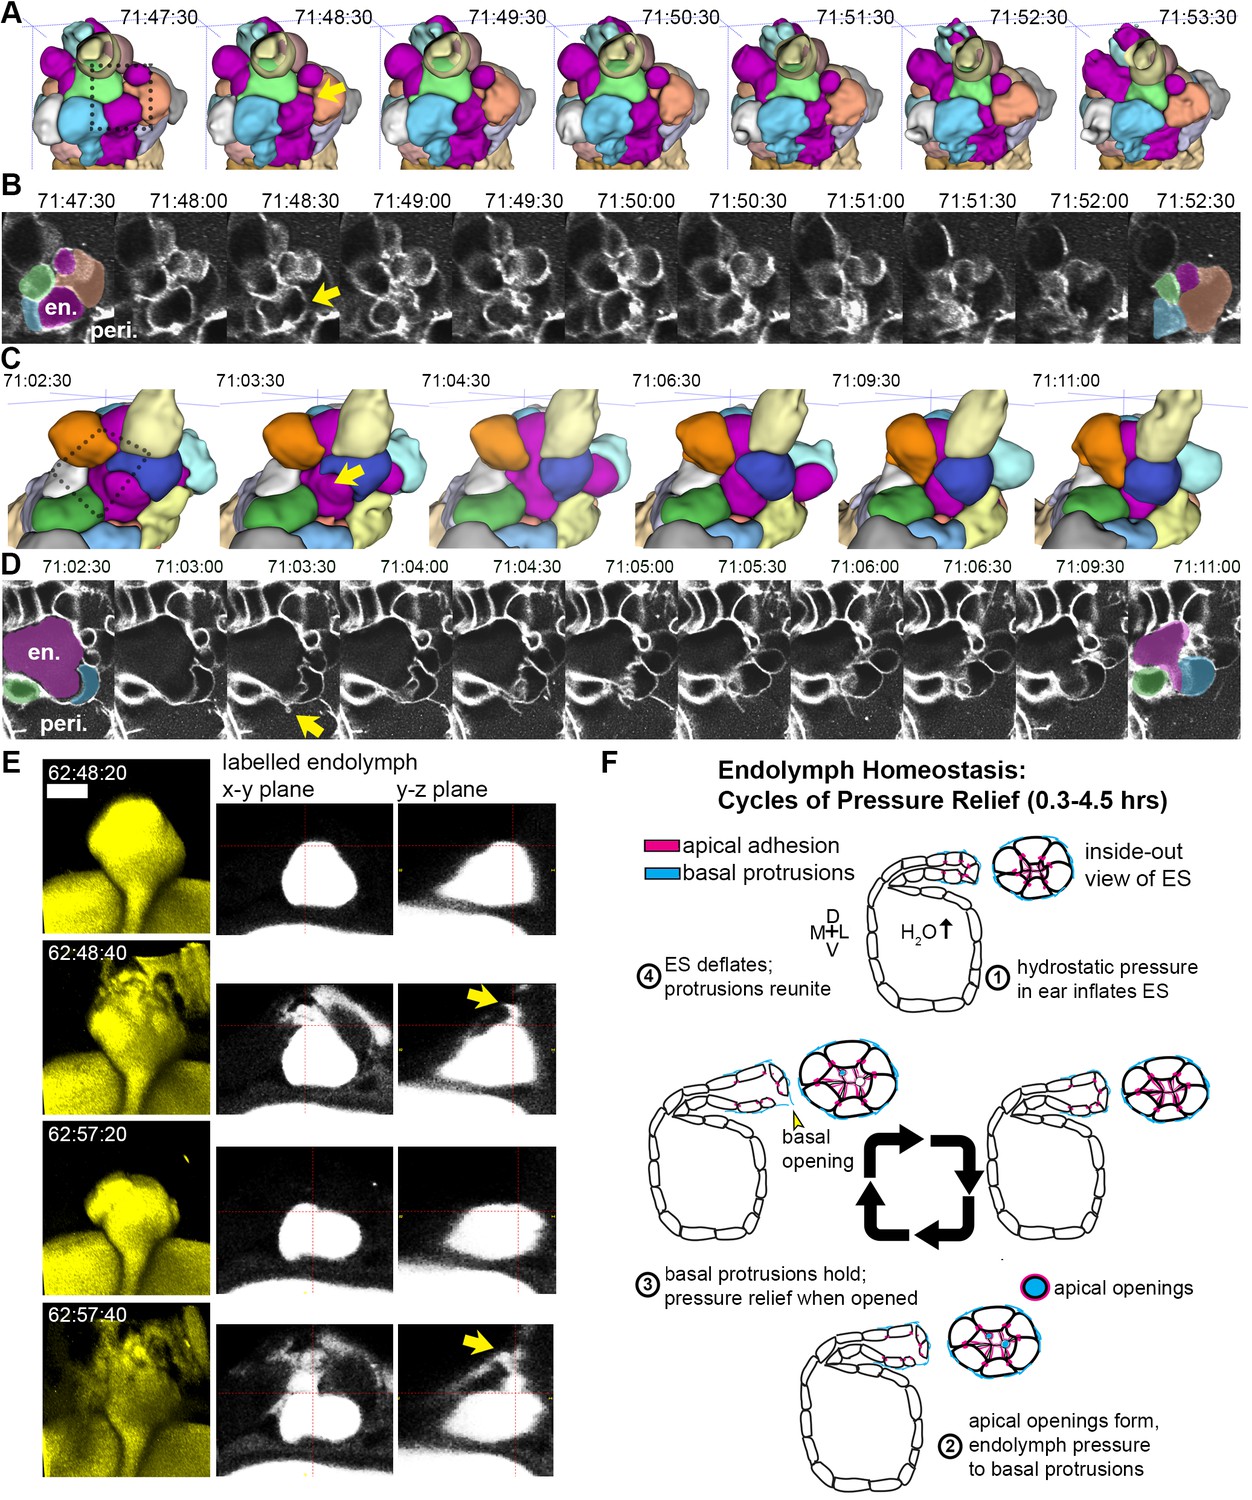
Basal lamellae open prior to deflation.
(A,C) 3D renderings of segmented cells and ES lumen. (A) Dorsal view. (B) Raw data of membrane citrine AO-LLSM data spanning same time range as in (A). First and last time point are overlaid with segmentations for cells and lumen (magenta) neighboring the region of valve opening. In (A–D) arrows point to site of lamellae separating, dotted outlines indicate field of views in B and D, en. indicates endolymph lumen, peri. indicates perilymph. (C) Anterior view of another instance of lamellae separating. (D) Raw data spanning time range of (C). (E) Dorsal view of endolymph volume within ES lumen and time points before and after two release events. Middle and right panels show x-y and y-z ortho-planes of the isolated release sites, highlighted with yellow arrows (See Video 14), n = 8 (F) Illustrated pressure relief mechanism.
Videos
Video 1
Early ES development.
Video begins with schematic of experimental set-up and context of the presented field of view. Then, an annotated time point is presented of the upcoming video. The presented video is of a sagittal slice from a 4D time course of early ES development (white arrow points to ES in introduction). ES morphogenesis begins at 36 hr post fertilization (hpf) as an evagination in the dorsal-anterior-lateral epithelial wall of the otic vesicle. Fluorescence from membrane citrine, shown in grey. Scale bar is 10 μm.
Video 2
Wild-type ES inflates and deflates.
Video begins with an illustration depicting the context of the presented field of view, which is a sagittal slice encompassing the developing ES from a 4D time course. Then, an annotated time point is presented of the upcoming video, a green arrow points to the ES, a dotted line outlines the ES lumen, the otic vesicle is labeled ventral to the ES, and the perilymph surrounds the ES structure, labeled in magenta. Video of sagittal slice from 4D dataset, quantified in Figure 1F. Fluorescence from membrane citrine, shown in green. Perilymph highlighted with fluorescence from 3 kDa dextran-Texas red, shown in magenta. Scale bar is 10 μm.
Video 3
Wild-type ES inflates and deflates.
A video of two time courses, sagittal slices from 4D datasets, quantified in Figure 1—figure supplement 1B (left) and Figure 1—figure supplement 1C (right). Fluorescence from membrane citrine, shown in green. Perilymph highlighted with fluorescence from 3 kDa dextran-Texas red, shown in magenta. Scale bars are 10 μm.
Video 4
Endolymph periodically inflates ES and then released into periotic space.
Time course of otic vesicle injected with 3 kDa dextran-Texas red at 55 hpf. Panels are transverse volumes of same time course. Left, labeled endolymph presented in yellow. Right, labeled endolymph in yellow, membrane citrine in cyan. Scale bar is 10 μm.
Video 5
Endolymph released into periotic space followed by perilymph leak-in.
Time course of otic vesicle injected with 3 kDa dextran-Texas red at 55 hpf, and perilymph labeled with 10 kDa dextran- Alexa Fluor 488. First three panels are transverse volumes while the fourth is a dorsal view of the same time course. Labeled endolymph presented in yellow, perilymph in magenta. Scale bar is 10 μm.
Video 6
Mutant ES over-inflates.
Video of sagittal slice from 4D dataset of lmx1bbjj410/jj410 mutant- quantified in Figure 3D. Fluorescence from membrane citrine shown in green. Perilymph highlighted with fluorescence from 3 kDa dextran-Texas red, shown in magenta. Scale bar is 10 μm.
Video 7
Mutant ES over-inflates.
Video of sagittal slice from 4D dataset of lmx1bbjj410/jj410 mutant- quantified in Figure 3—figure supplement 1. Fluorescence from membrane citrine shown in green. Perilymph highlighted with fluorescence from 3 kDa dextran-Texas red, shown in magenta. Scale bar is 10 μm.
Video 8
Serial-section electron micrographs of wild-type ES at 5.5 dpf.
Sections are 60 nm thick and color overlays highlight cells with lamellar barriers or basal lamellae. Second half explores organization of cells in space using cell segmentations.
Video 9
Slab view of ES time course acquired with lattice light-sheet microscopy with adaptive optics.
15 sequential slices (300 nm slice spacing) were combined as a maximum intensity projections (MIP) to make a 4.5 μm slab. 7 sequential 4.5 μm slabs were tiled to consolidate the presentation of a complete 3D time course. The membrane citrine signal is green and the 3 kDa dextran-Texas red perilymph highlighter is magenta. Lower right panel is an annotated reference, with the basal surface of the ES labeled and outlined with a dotted yellow line, the apical interface enclosing endolymph outlined with a dotted blue line, the endolymph within the ES lumen indicated with a blue arrow, exposed basal lamellae indicated with a green arrow, and the perilymph labeled with magenta text. Scale bar is 10 μm.
Video 10
3D rendering of tracked and segmented cells and ES lumen.
An anterior view on the left and dorsal view on the right. Segmented ES lumen is colored magenta. All other objects are ES cells. Labeled cubes indicate body axes. Same time course as Video 9.
Video 11
3D rendering of membrane citrine signal.
The video begins with an annotated time point from the 3D rendering of signal from an AO-LLSM time course. A yellow dotted line highlights the rendered ES, green arrows point to basal lamellae, and the surrounding space is labeled as perilymph with magenta text. Dorsal view of ES, membrane citrine signal rendered in 3D. Scale bar is 10 μm.
Video 12
Slab view of myosin-GFP during ES time course.
Seven sequential slices (600 nm slice spacing) were combined as a maximum intensity projections (MIP) to make a 4.2 μm slabs. 4 sequential 4.2 μm slabs, starting with the distal tip of the ES on the left, were tiled to consolidate the presentation of a complete 3D time course. On top is the time lapse of a wild-type embryo expression myosin-GFP. Below is an lmx1bb crispant expressing myosin-GFP. Scale bar is 10 μm.
Video 13
Representative heat shock dnRac1 time course.
Embryos were heat shocked at 55 hpf. At 57 hpf, α-bungarotoxin protein and 3 kDa dextran-Texas red were injected into the hearts. Time course began at 58 hpf, membrane citrine is green, perilymph is magenta. Scale bar is 10 μm.
Video 14
Endolymph time course at high time resolution reveal sites of release.
Four embryos with 3 kDa dextran-Texas red injected into the otic vesicle. First three are 3-D rendered volumes from a dorsal view. The fourth fish is 3-D rendered from a transverse view (as in Videos 4 and 5). Scale bar is 10 μm.
Tables
Key resources table
| Reagent type (species) or resource | Designation | Source or reference | Identifiers | Additional information |
|---|---|---|---|---|
| Strain, strain background (Danio rerio) | AB | ZIRC, Eugene, OR | ZFIN ID: ZDB-GENO-960809–7 | |
| Strain, strain background (Danio rerio) | lmx1bb mutant, ale uchu (jj410 allele) | ZIRC, Eugene, OR, PMID: 17574823 | jj410; ZFIN ID: ZDB-ALT-070426–3 | Schibler and Malicki, 2007 |
| Strain, strain background (Danio rerio) | Tg(actb2:mem-citrine-citrine)hm30 | Megason lab, PMID: 25303534 | hm30; ZFIN ID: ZDB-ALT-150209–1 | Xiong et al., 2014 |
| Strain, strain background (Danio rerio) | Tg(actb2:mem-citrine)/(actb2:Hsa.H2b-tdTomato)hm32 | Megason lab, PMID: 27535432 | hm32; ZFIN ID: ZDB-ALT-161213–1 | Aguet et al., 2016 |
| Strain, strain background (Danio rerio) | Tg(actb2:mem-citrine)/(actb2:Hsa.H2b-tdTomato)hm33 | Megason lab, PMID: 27535432 | hm33; ZFIN ID: ZDB-ALT-161213–2 | Aguet et al., 2016 |
| Strain, strain background (Danio rerio) | Tg(−5.0lmx1bb:d2eEGFP)mw10 | gift from Brian Link's lab, PMID: 19500562 | mw10; ZFIN ID: ZDB-ALT-091218–2 | McMahon et al., 2009 |
| Strain, strain background (Danio rerio) | Tg(actb2:mem-mcherry2)hm29 | Megason lab, PMID: 23622240 | hm29; ZFIN ID: ZDB-ALT-130625–1 | Xiong et al., 2013 |
| Strain, strain background (Danio rerio) | Tg(hsp70:rac1_T17N-p2a-mem-cherry2)hm35 | Megason lab, rac1 mutant plasmid gift from Raz lab, this paper | hm35 | Kardash et al., 2010 |
| Strain, strain background (Danio rerio) | Tg(elavl3:GCaMP5G)a4598 | gift from Alexander Schier's lab, PMID: 23524393 | a4598; ZFIN ID: ZDB-ALT-130924–1 | Ahrens et al., 2013 |
| Strain, strain background (Danio rerio) | Tg(actb2:myl12.1-EGFP)e2212 | gift from C.P. Heisenberg's lab, PMID: 25535919 | e2212; ZFIN ID: ZDB-ALT-130108–2 | Compagnon et al., 2014 |
| Strain, strain background (Danio rerio) | Tg(actb2:mCherry-Hsa.UTRN)e119 | gift from C.P. Heisenberg's lab, PMID: 25535919 | e119; ZFIN ID: ZDB-ALT-151029–2 | Compagnon et al., 2014 |
| Antibody | mouse anti ZO-1 | Thermo Fisher Scientific, Waltham, MA | ZO1-1A12 | |
| Antibody | rabbit anti collagen II | Abcam, Cambridge, United Kingdom | ab209865 | |
| Antibody | rabbit anti laminin | Sigma-Aldrich, St. Louis, MO | L9393 | |
| Recombinant DNA reagent | pet-28b-Cas9-His | gift from Alexander Schier's lab, PMID: 24873830 | addgene id: 47327 | Gagnon et al., 2014 |
| Recombinant DNA reagent | pmtb-t7-alpha-bungarotoxin | Megason lab, PMID: 26244658 | addgene id: 69542 | Swinburne et al., 2015 |
| Sequence-based reagent | foxi in situ probes,Danio rerio | PCRtemplate + T7 reaction (Sigma) | RefSeq:NM_181735 | Thisse and Thisse, 2014 |
| Sequence-based reagent | bmp4 in situ probes, Danio rerio | PCRtemplate + T7 reaction (Sigma) | RefSeq:NM_131342 | Thisse and Thisse, 2014 |
| Sequence-based reagent | lmx1bb sgRNA (exon 2), Danio rerio | annealedoligos + SP6 reaction (NEB) | GenBank:CR376762 | Gagnon et al., 2014 |
| Sequence-based reagent | lmx1bb sgRNA (exon 3),Danio rerio | annealed oligos + SP6 reaction (NEB) | GenBank:CR376762 | Gagnon et al., 2014 |
| Peptide, recombinant protein | cas9 protein | Megason lab | purification scheme fromGagnon et al., 2014 | |
| Peptide, recombinant protein | alpha-bungarotoxin | Tocris Bioscience (Bristol, United Kingdom) | Tocris catalog number 2133 | Swinburne et al., 2015 |
| Commercial assay or kit | mMessage mMachine T7 ULTRA kit | Thermo Fisher Scientific, Waltham, MA | AM1345 | |
| Chemical compound, drug | Dextran, Texas Red, 3000 MW | Thermo Fisher Scientific, Waltham, MA | D-3329 | |
| Chemical compound, drug | Dextran, Alexa Fluor 488, 10000 MW | Thermo Fisher Scientific, Waltham, MA | D-22913 | |
| Chemical compound, drug | tricaine methanosulfate | Sigma-Aldrich, St. Louis, MO | E10521 | |
| Chemical compound, drug | nonenyl succinic anhydride | Electron Microscopy Sciences, Hatfield, PA | 19050 | |
| Chemical compound, drug | DMP-30 | Electron Microscopy Sciences, Hatfield, PA | 13600 | |
| Chemical compound, drug | 1,2,7,8-diepoxyoctane (97%) | Sigma-Aldrich, St. Louis, MO | 139564 | |
| Chemical compound, drug | Sorensen's Phosphate Buffer | Electron Microscopy Sciences, Hatfield, PA | 11600–10 | |
| Chemical compound, drug | glutaraldehyde, EM grade | Electron Microscopy Sciences, Hatfield, PA | 16220 | |
| Chemical compound, drug | paraformaldehyde | Electron Microscopy Sciences, Hatfield, PA | 15710 | |
| Chemical compound, drug | potassium ferricyanide | Sigma-Aldrich, St. Louis, MO | 702587 | |
| Chemical compound, drug | osmium tetroxide | Electron Microscopy Sciences, Hatfield, PA | 19140 | |
| Chemical compound, drug | uranyl acetate | Electron Microscopy Sciences, Hatfield, PA | 22400 | |
| Chemical compound, drug | maleic acid | Sigma-Aldrich, St. Louis, MO | m5757 | |
| Chemical compound, drug | acetronitrile | Electron Microscopy Sciences, Hatfield, PA | 10020 | |
| Chemical compound, drug | Taab 812 Resin | Marivac Ltd., Nova Scotia, Canada | ||
| Software, algorithm | MovingROIExtract, convertFormat | https://github.com/krm15/AO-LLSM | ||
| Software, algorithm | ConvertToMegacapture, GoFigure2ContoursToMeshes | https://github.com/krm15/GF2Exchange | ||
| Software, algorithm | Itk-snap | www.itksnap.org PMID: 16545965 | Yushkevich et al., 2006 | |
| Software, algorithm | Fluorender | www.sci.utah.edu/software/fluorender.html PMID:23584131 | Wan et al., 2012 | |
| Software, algorithm | HandBrake | https://handbrake.fr/ | ||
| Software, algorithm | LabVIEW | National Instruments | ||
| Software, algorithm | MATLAB (R2014A) | www.mathworks.com | ||
| Software, algorithm | ParaView | www.paraview.org | ||
| Software, algorithm | GoFigure2 | Xiong et al., 2013 | ||
| Software, algorithm | FIJI (imagJ) | www.fiji.sc PMID: 22743772 | Schindelin et al., 2012 | |
| Software, algorithm | cellPreprocess, multiscalePlanarityAndVoting3D, DistanceFromMask, resample, MorphologicalErosionOnLabelImageFilter, SizeThreshold, MembraneSegmentation, MembraneSegmentationWithMarkersImageFilter, CellSegmentationStatistics | https://github.com/krm15/ACME/tree/MultithreadLookup | ||
| Software, algorithm | Zen software | http://www.zeiss.com/microscopy/us/products/microscope-software/zen-lite.html | ||
| Other | Volcano mould,‘frosted extreme detail’ | https://www.shapeways.com/, this paper | Volcano400 | |
| Other | FemtoJet 4x | Eppendorf, Hamburg, Germany | 5253000017 | |
| Other | Nanoject | Drummond Scientific, Broomall, PA | 3-000-204 | |
| Other | Tungsten wire | Sigma-Aldrich, St. Louis, MO | 267554–9.5G |
Additional files
-
Transparent reporting form
- https://doi.org/10.7554/eLife.37131.026
Download links
A two-part list of links to download the article, or parts of the article, in various formats.
Downloads (link to download the article as PDF)
Open citations (links to open the citations from this article in various online reference manager services)
Cite this article (links to download the citations from this article in formats compatible with various reference manager tools)
Lamellar projections in the endolymphatic sac act as a relief valve to regulate inner ear pressure
eLife 7:e37131.
https://doi.org/10.7554/eLife.37131


