Temperature explains broad patterns of Ross River virus transmission
- Stanford University, United States
- University of Florida, United States
- Emerging Pathogens Institute, University of Florida, United States
- University of KwaZulu Natal, South Africa
Figures
Figure 1

Vector species implicated in RRV disease outbreaks.
Map of specific mosquito species identified as important vectors based on collected field specimens. Grid (right) shows data availability of trait thermal responses for the five Australian species. Data sources listed in Figure 1—source data 1. Trait parameters are biting rate (a), fecundity (as eggs per female per day, EFD), mosquito development rate (MDR), the proportion surviving from egg-to-adulthood (pEA), adult mosquito mortality (μ = 1/lifespan), vector competence (bc), and parasite development rate (PDR).
-
Figure 1—source data 1
Vector species implicated in RRV disease outbreaks.
Location and year of RRV disease outbreaks and mosquito species identified as likely vectors based on the collection of field specimens. Only the six most important mosquito species are included. Citation key: A: Biggs and Mottram, 2008; B: Brokenshire et al., 2000; C: Campbell et al., 1989; D: Dhileepan, 1996; E: Frances et al., 2004; F: Harley et al., 2000; G: Harley et al., 2001; H: Jacups et al., 2008b; I: Kelly-Hope et al., 2004b; J: Lau et al., 2017; K: Yang et al., 2009; L: Lindsay et al., 1993b; M: Lindsay et al., 1993a; N: Lindsay et al., 1996; O: Lindsay et al., 2007; P: McDonnell et al., 1994; Q: McManus et al., 1992; R: Merianos et al., 1992; S: Ritchie et al., 1997; T: Rosen et al., 1981; U: Russell et al., 1991; V: Russell, 1994; W: Russell, 2002; X: Ryan et al., 2000; Y: Schmaedick et al., 2008; Z: Whelan et al., 1992; AA: Whelan et al., 1995; AB: Whelan et al., 1997.
- https://doi.org/10.7554/eLife.37762.004
Figure 2 with 4 supplements
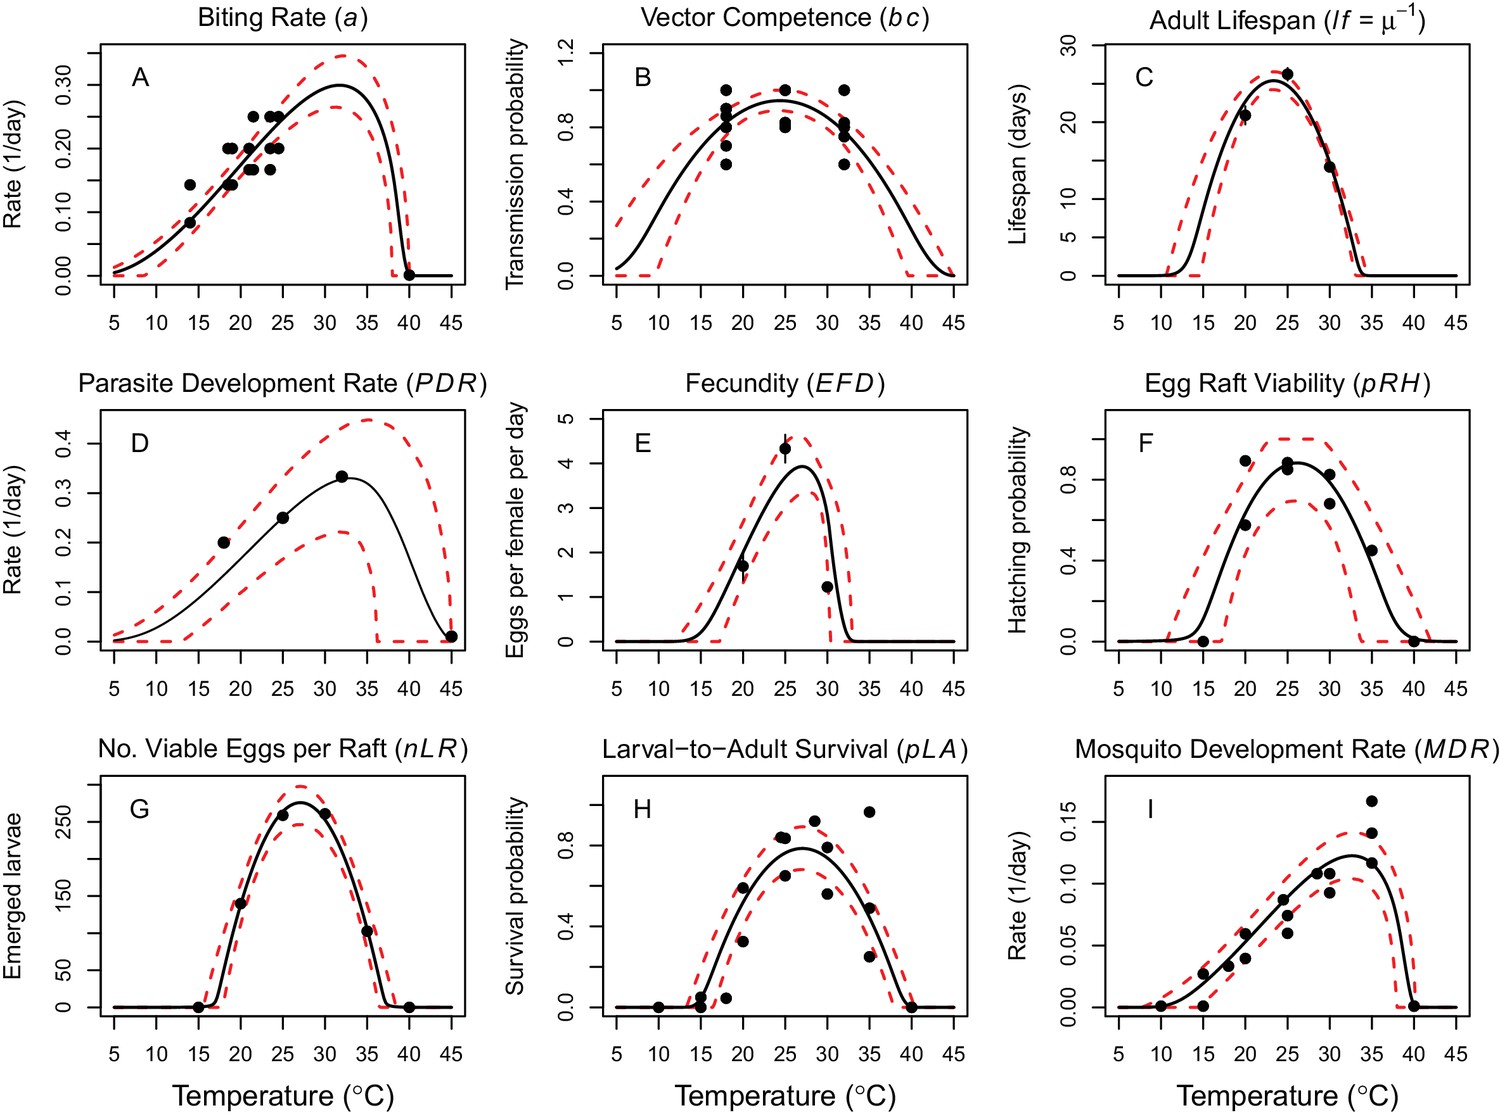
Thermal responses of Cx. annulirostris and RRV (in Ae. vigilax) traits that drive transmission.
Mosquito life history traits (A, C, E, F, G, H, I) are from Cx. annulirostris. Virus-mosquito infection traits (B, D) are from Ae. vigilax. Functions were fit using Bayesian inference with priors fit using data from other mosquito species and viruses. Black solid lines are posterior distribution means; dashed red lines are 95% credible intervals. (E, C) Points are data means; error bars are standard error. Data sources and function parameter estimates given in Figure 2—source data 1. Data sources and function parameter estimates for priors given in Figure 2—source data 2. Thermal responses fit with uniform priors given in Figure 2—figure supplement 1. Thermal responses for alternative vectors and virus given in Figure 2—figure supplements 2, 3 and 4.
-
Figure 2—source data 1
Trait thermal response functions and data sources for Ross River virus R0 models (Equations 1 and 2).
‘Par.’=model parameter. Results are given for fits from data-informed priors. Asymmetrical responses fit with Brière function (B): B(T)= qT(T – Tmin)(Tmax – T)1/2; symmetrical responses fit with quadratic function (Q): Q(T) = -q(T – Tmin)(T – Tmax). Function coefficients (and 95% credible intervals) fit via Bayesian inference.
- https://doi.org/10.7554/eLife.37762.011
-
Figure 2—source data 2
Trait thermal response functions and data sources used to parameterize priors for data-informed trait thermal responses.
‘Par.’=model parameter. Fits were made with uniform priors. Asymmetrical responses fit with Brière function (B): B(T)= qT(T – Tmin)(Tmax – T)1/2; symmetrical responses fit with quadratic function (Q): Q(T) = -q(T – Tmin)(T – Tmax). Function coefficients (and 95% credible intervals) fit via Bayesian inference.
- https://doi.org/10.7554/eLife.37762.012
Figure 2—figure supplement 1
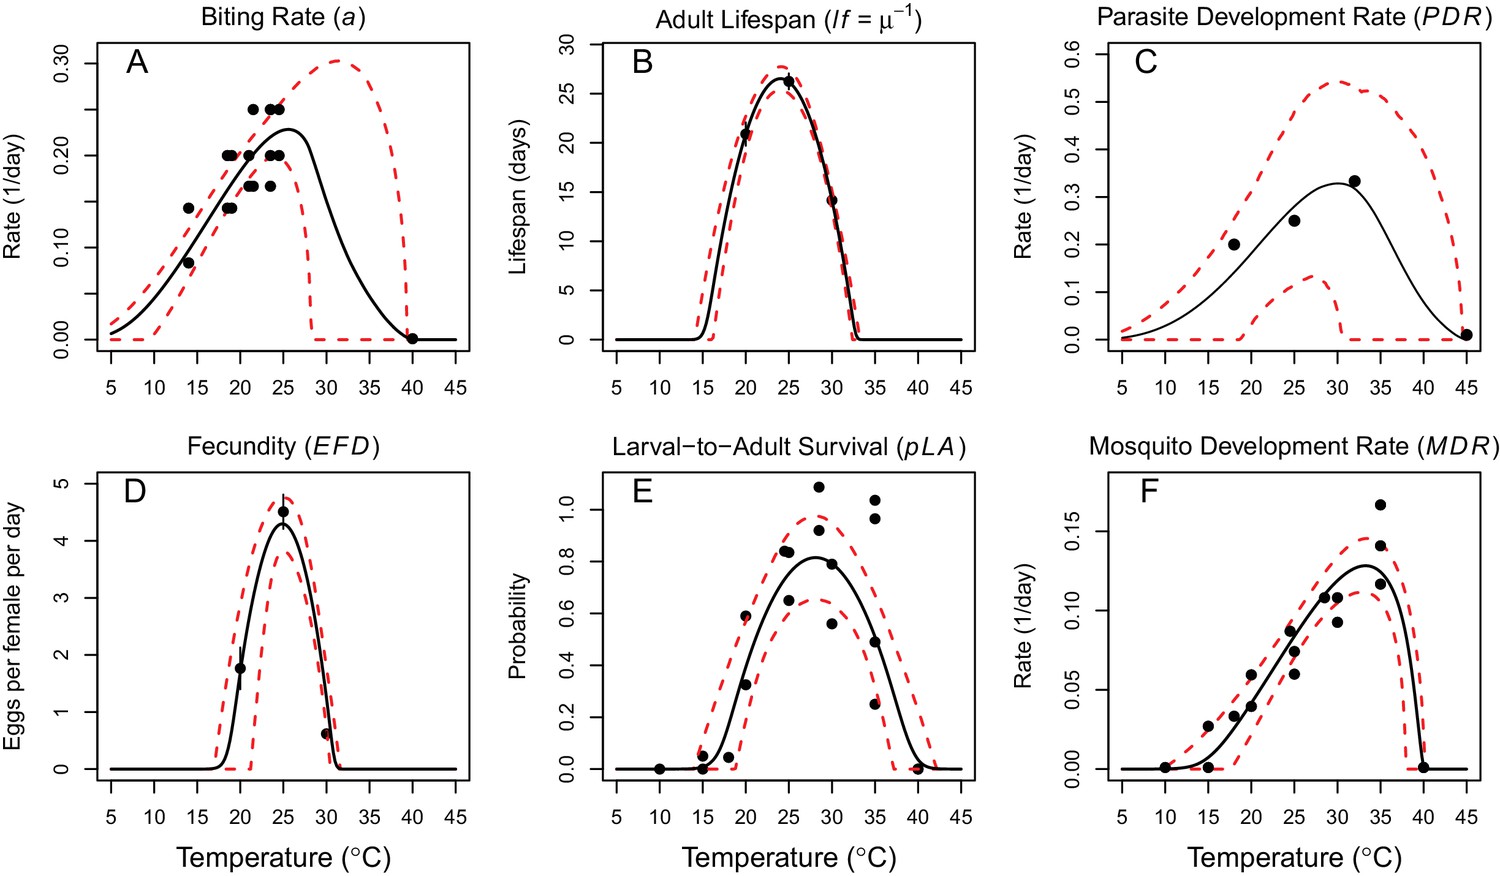
Thermal responses of Cx. annulirostris fit with uniform priors.
https://doi.org/10.7554/eLife.37762.006
Figure 2—figure supplement 2

Thermal responses of Ae. camptorhynchus.
https://doi.org/10.7554/eLife.37762.007-
Figure 2—figure supplement 2—source data 1
Trait thermal response functions and data sources for Murray Valley Encephalitis virus and additional vector species (Ae. notoscriptus and Ae. camptorhynchus).
‘Par.’=model parameter. Results are given for fits from data-informed priors. Asymmetrical responses fit with Brière function (B): B(T)= qT(T – Tmin)(Tmax – T)1/2; symmetrical responses fit with quadratic function (Q): Q(T) = -q(T – Tmin)(T – Tmax). Function coefficients (and 95% credible intervals) fit via Bayesian inference. This table also includes source data for Figure 2—figure supplement 3 and Figure 2—figure supplement 4.
- https://doi.org/10.7554/eLife.37762.008
Figure 2—figure supplement 3

Thermal responses of Ae. notoscriptus.
https://doi.org/10.7554/eLife.37762.009
Figure 2—figure supplement 4
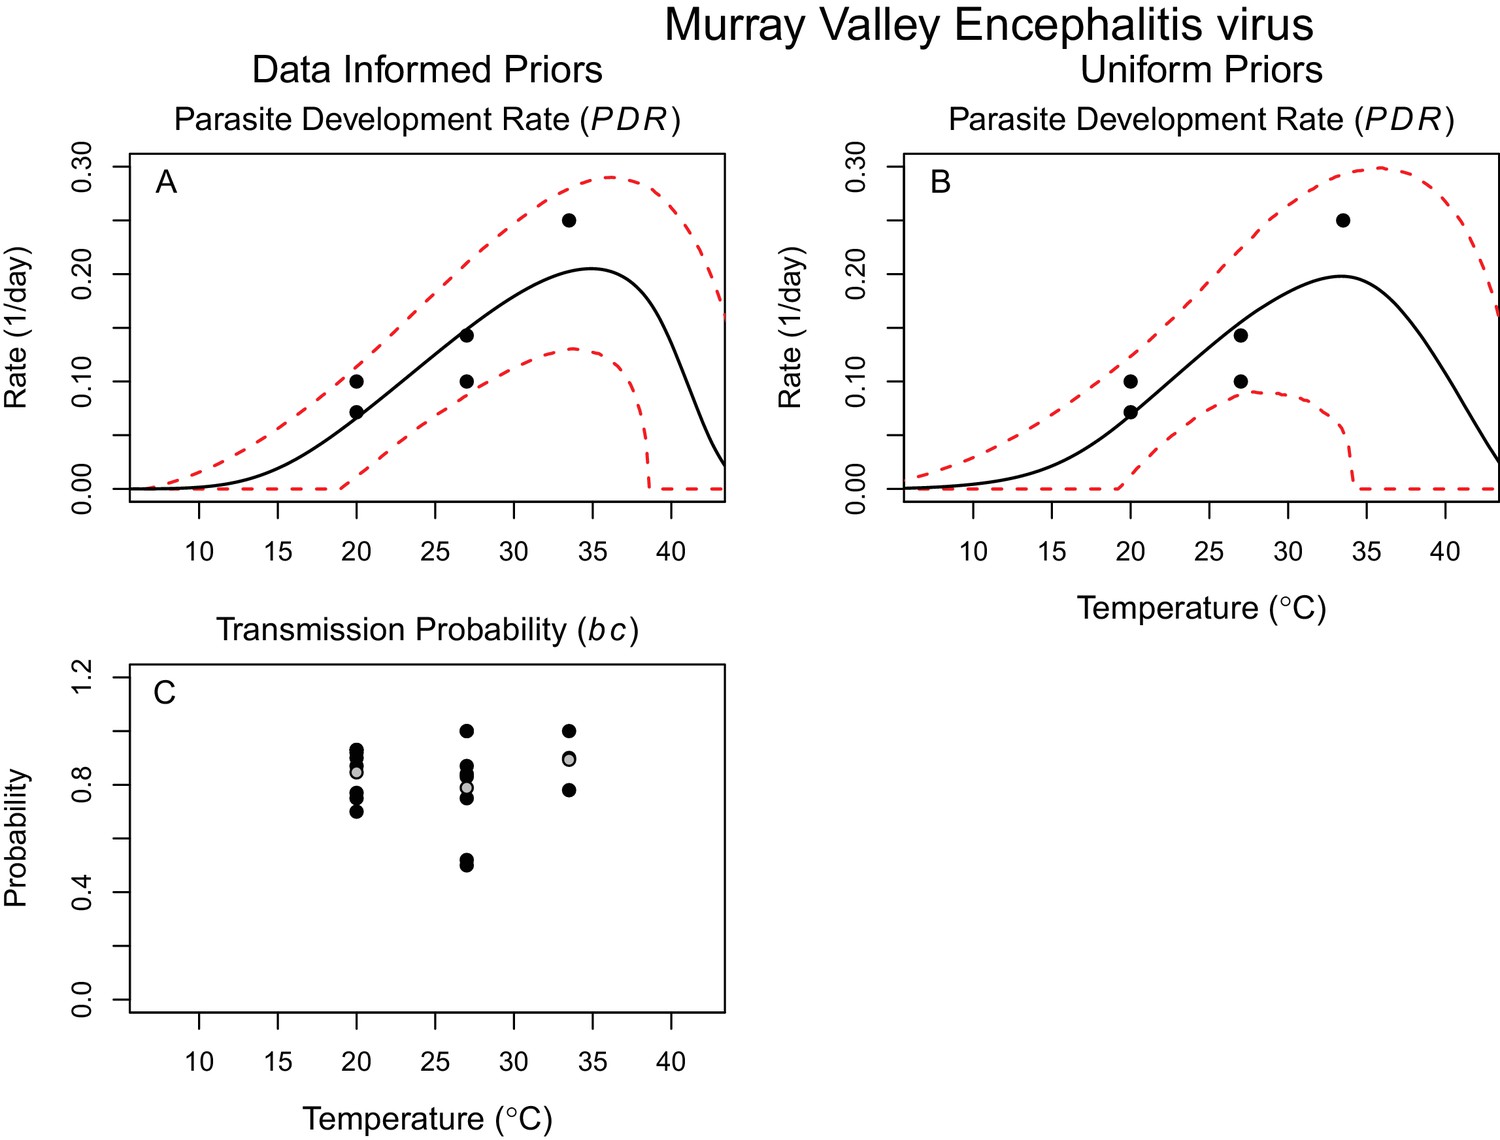
Thermal responses of Murray Valley Encephalitis virus.
https://doi.org/10.7554/eLife.37762.010
Figure 3 with 3 supplements
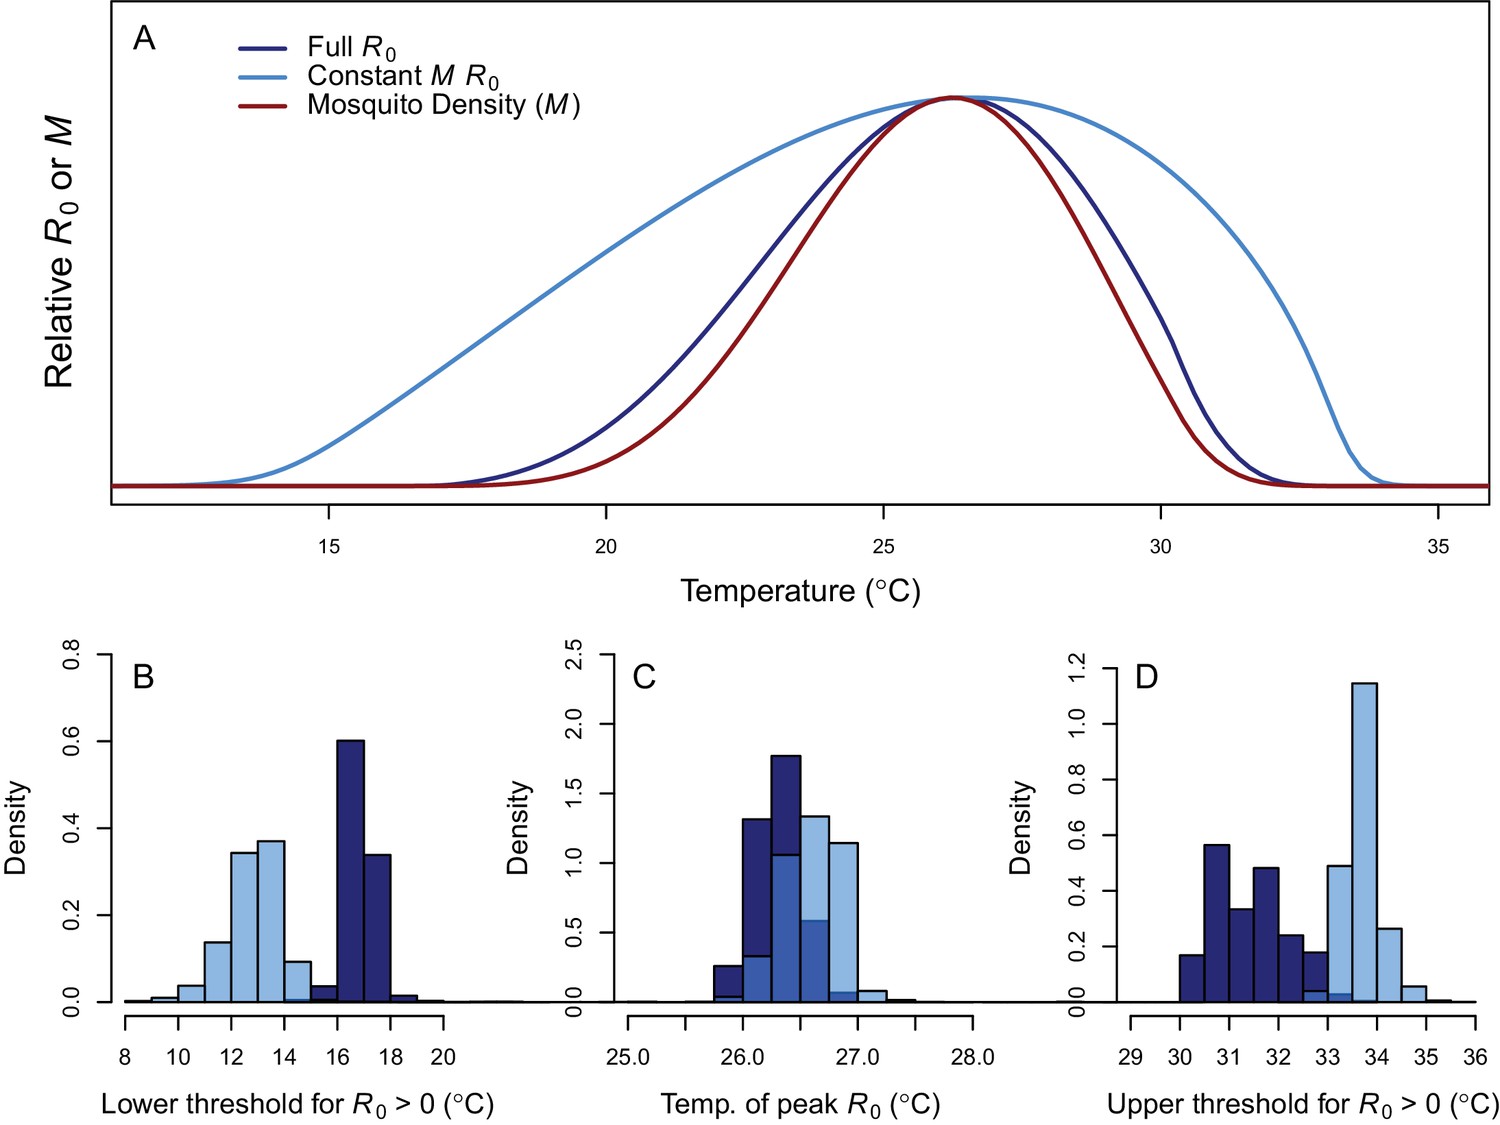
Thermal response of relative R0.
(A) Posterior means across temperature for the full R0 model (Equation 1, dark blue) and constant M model (Equation 2, light blue). Predicted mosquito density (M) shown for comparison (red). The y-axis shows relative R0 (or M) rather than absolute values, which would require additional information. Histograms of posterior distributions for (B) critical thermal minimum, (C) thermal optimum, and (D) critical thermal maximum temperatures for both models (same colors as in A). Additional R0 model results given in Figure 3—figure supplement 1. Sensitivity and uncertainty analyses given in Figure 3—figure supplement 2. Example comparison of mean and median results given in Figure 3—figure supplement 3.
Figure 3—figure supplement 1

Thermal response of relative R0 using traits from alternative vectors.
https://doi.org/10.7554/eLife.37762.014
Figure 3—figure supplement 2
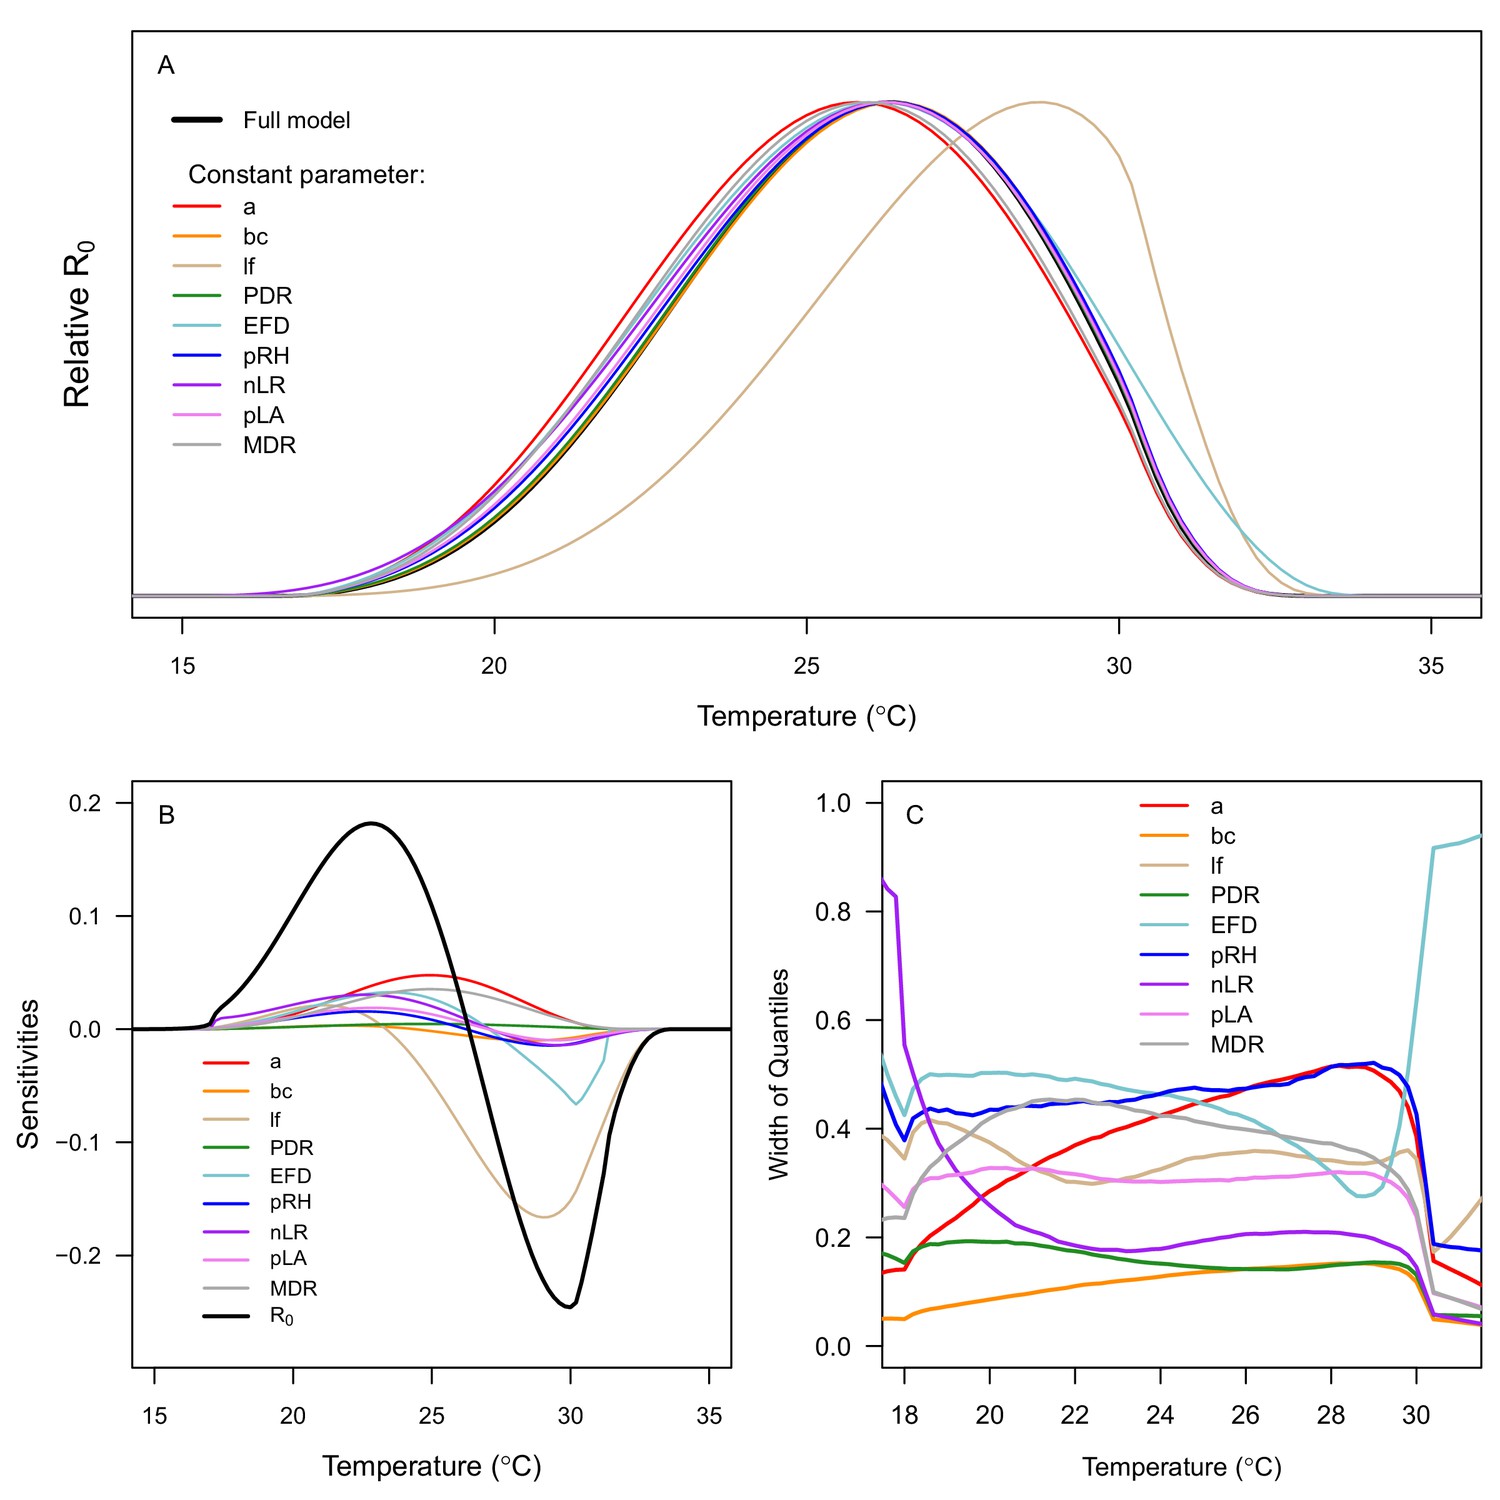
Sensitivity and uncertainty analyses for R0 results.
https://doi.org/10.7554/eLife.37762.015
Figure 3—figure supplement 3

Example comparison of mean and median R0 results.
https://doi.org/10.7554/eLife.37762.016
Figure 4
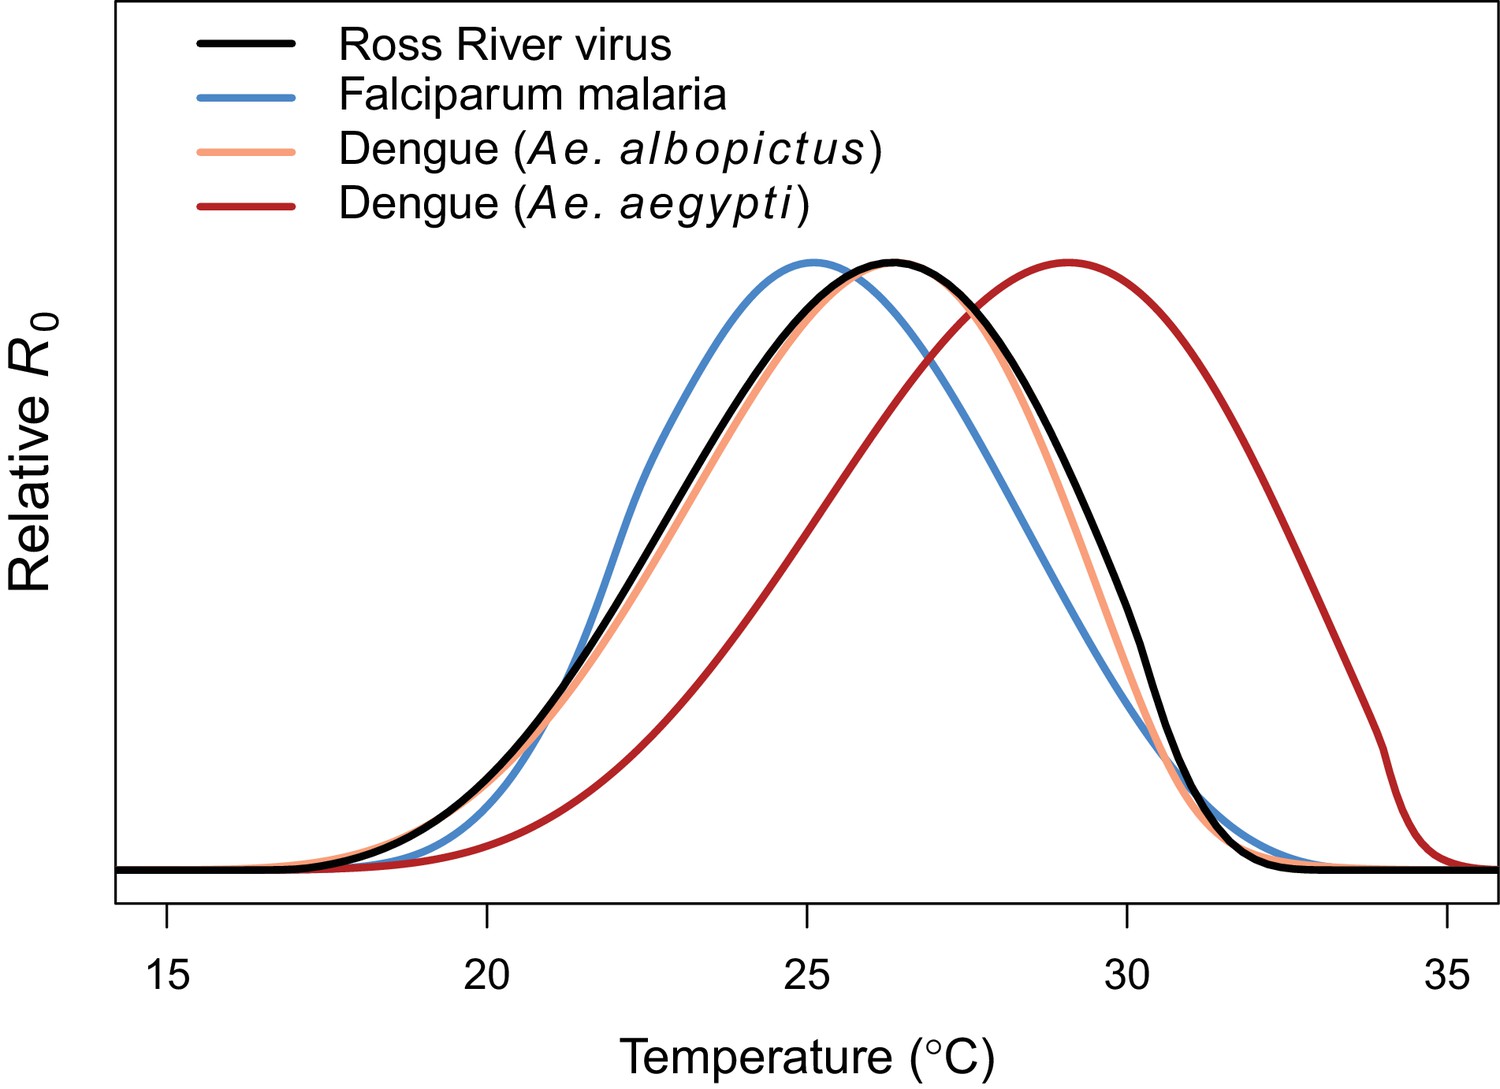
Comparing relative R0 for RRV and other diseases.
Malaria (blue, optimum = 25.2°C), Ross River virus (black, optimum = 26.4°C), dengue virus in Ae. albopictus (orange, optimum = 26.4°C), and dengue virus in Ae. agypti (red, optimum = 29.1°C). Results for all diseases use the full R0 model.
Figure 5 with 1 supplement

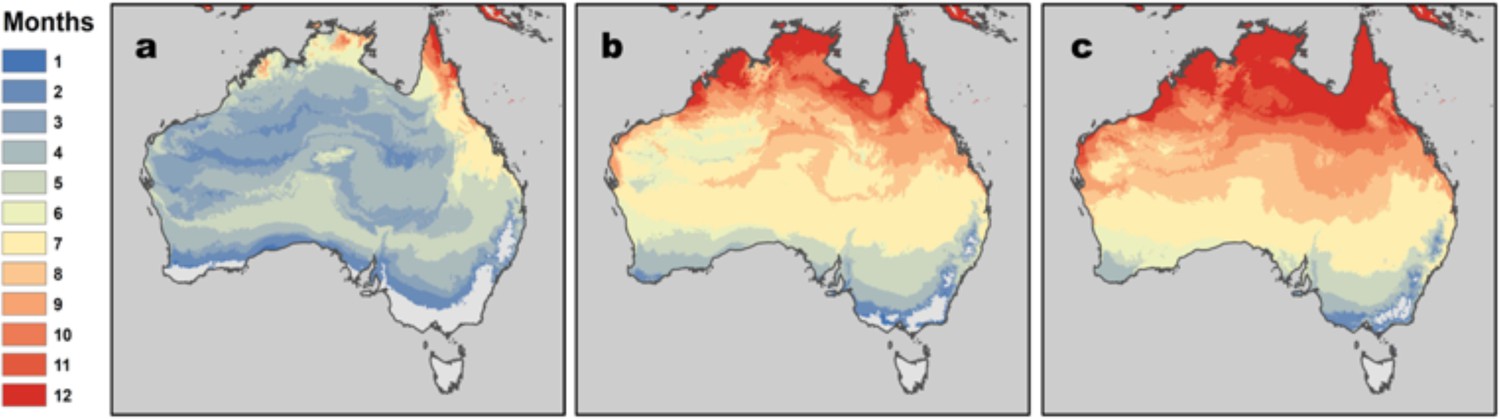
RRV transmission potential from monthly mean temperatures.
Color indicates number of months where (A) relative R0 >0 and (B) relative R0 >0.5. Predictions are based on the posterior median of the full R0 model (Equation 1) parameterized with trait thermal responses shown in Figure 2. Points indicate selected cities (Figure 5), scaled by the percentage of total Australian population residing in each city. Maps with 2.5% and 97.5% credible intervals are given in Figure 5—figure supplement 1.
Figure 5—figure supplement 1
RRV transmission potential from monthly mean temperatures using R0 model 2.5% and 97.5% credible intervals.
https://doi.org/10.7554/eLife.37762.019
Figure 6
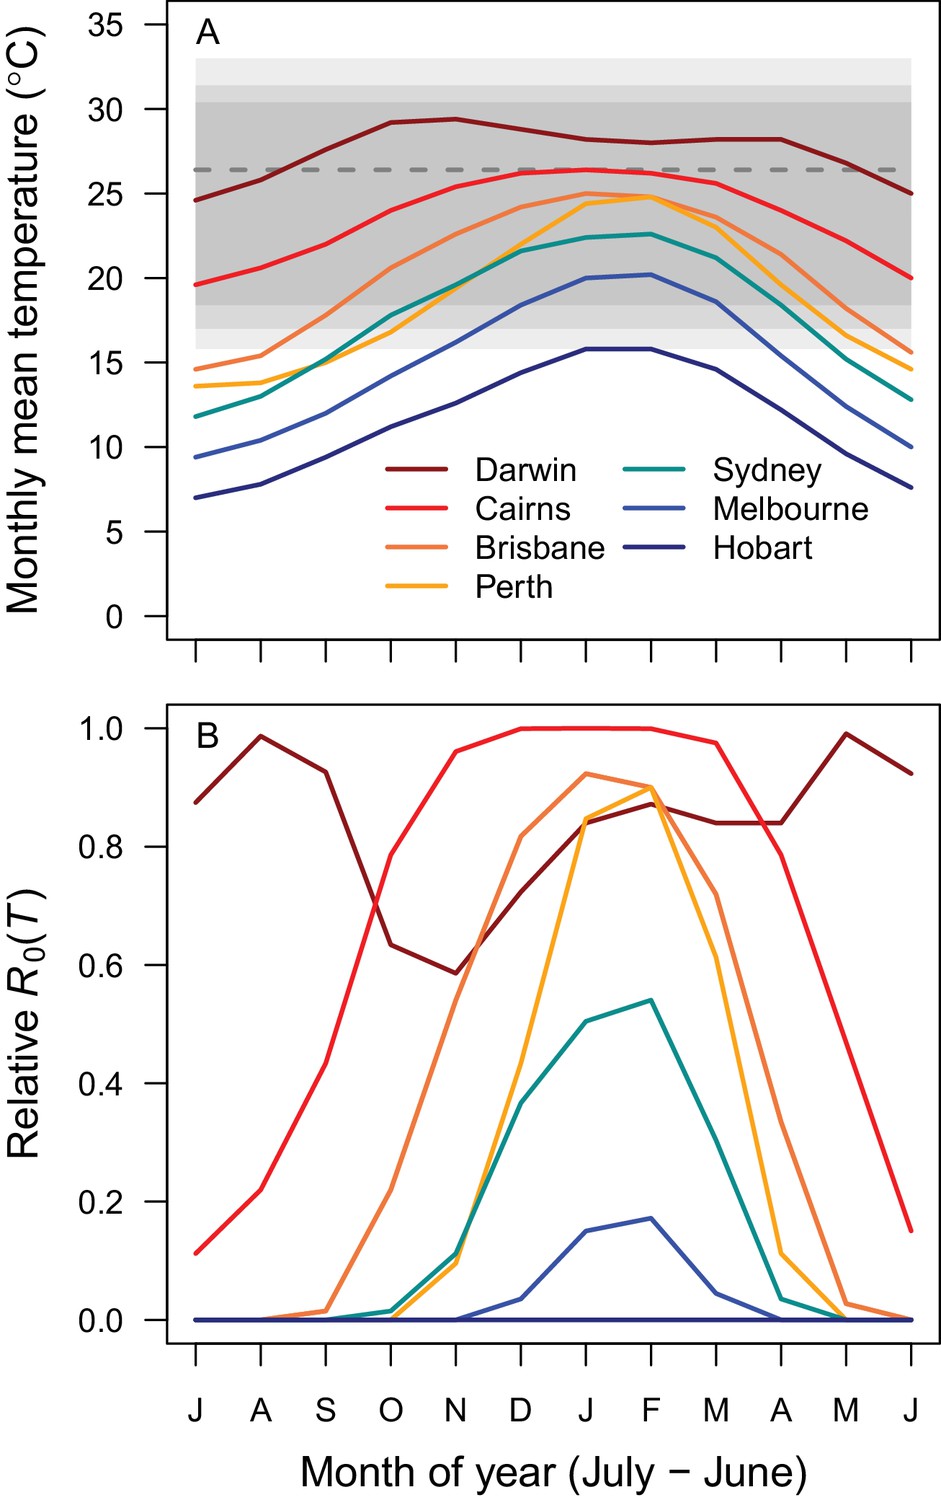
Average seasonality of temperature and relative R0 in Australian cities.
The selected cities span a latitudinal and temperature gradient (Darwin = dark red, Cairns = red, Brisbane = dark orange, Perth = light orange, Sydney = aqua, Melbourne = blue, Hobart = dark blue). The x-axis begins in July and ends in June (during winter). (A) Mean monthly temperatures. Shaded areas show temperature thresholds where R0 >0 for: outer 95% CI (light grey), median (medium grey), and inner 95% CI (dark grey). Dashed line shows median R0 optimal temperature. (B) Temperature-dependent R0. Predictions are based on the posterior median of the full R0 model (Equation 1) parameterized with trait thermal responses shown in Figure 2.
Figure 7
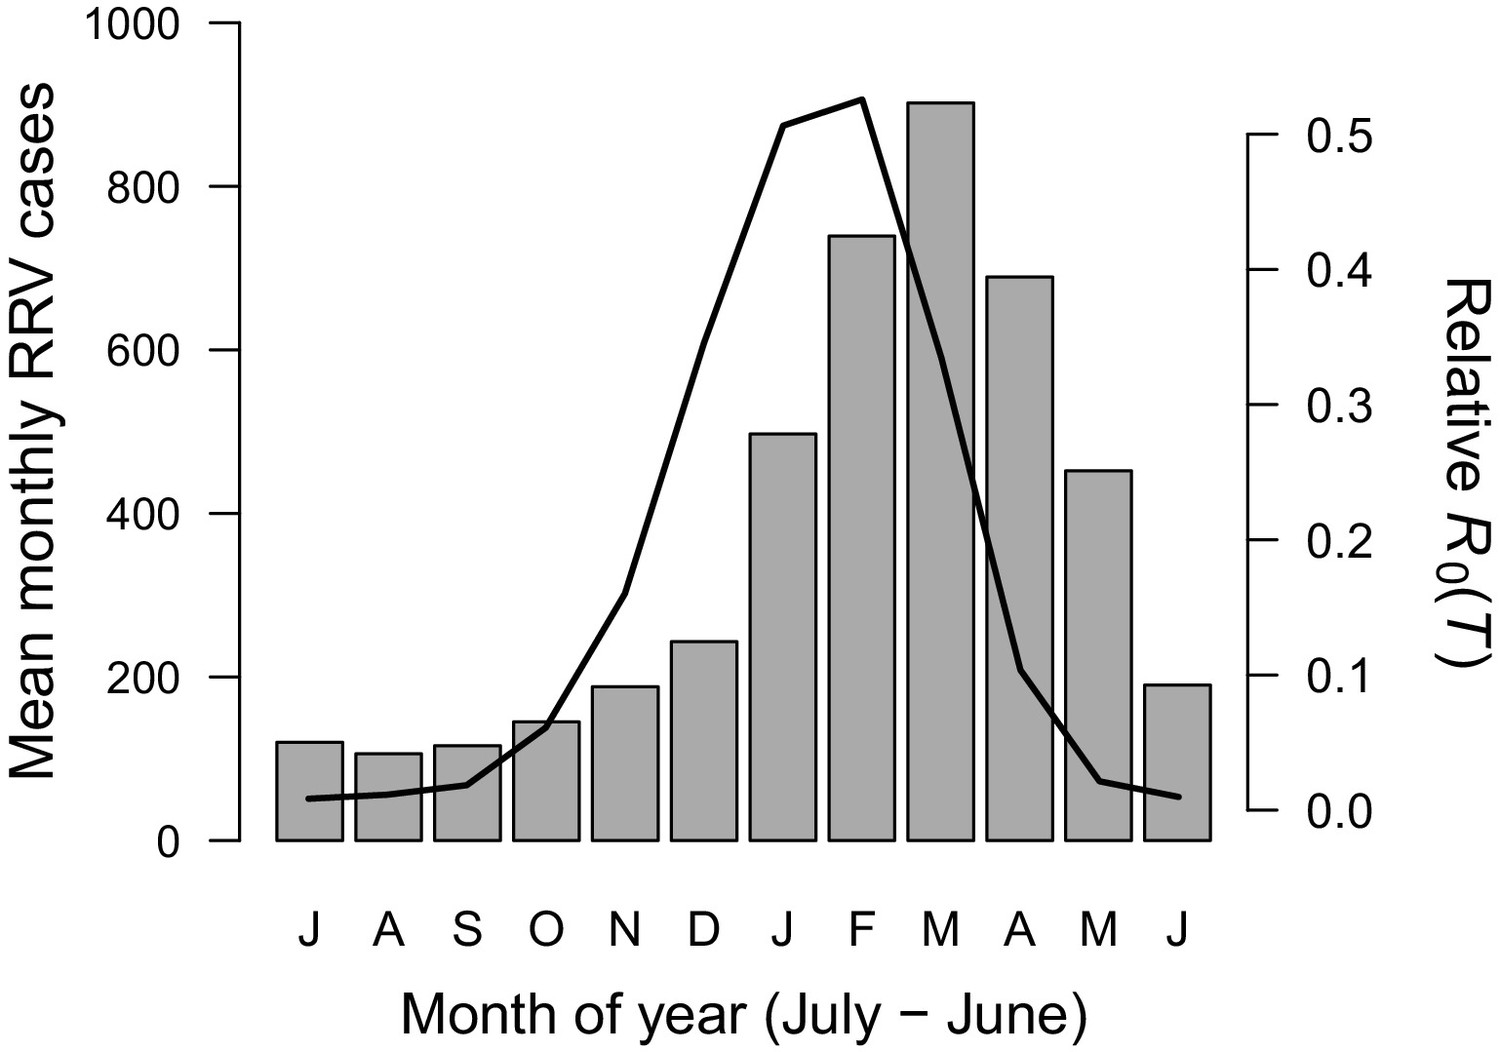
Seasonality of relative R0 and RRV infections.
Human cases aggregated nationwide from 1992 to 2013 (bars). Temperature-dependent R0 weighted by population (line), calculated from Australia’s 15 largest cities (76.6% of total population). Predictions are based on the posterior median of the full R0 model (Equation 1) parameterized with trait thermal responses shown in Figure 2. The x-axis begins in July and ends in June (during winter). Cases peak two months after R0, the a priori expected lag between temperature and reported cases.
Additional files
-
Transparent reporting form
- https://doi.org/10.7554/eLife.37762.022
Download links
A two-part list of links to download the article, or parts of the article, in various formats.
Downloads (link to download the article as PDF)
Open citations (links to open the citations from this article in various online reference manager services)
Cite this article (links to download the citations from this article in formats compatible with various reference manager tools)
Temperature explains broad patterns of Ross River virus transmission
eLife 7:e37762.
https://doi.org/10.7554/eLife.37762


