Insulin mutations impair beta-cell development in a patient-derived iPSC model of neonatal diabetes
- University of Helsinki, Finland
- University of Eastern Finland and Kuopio University Hospital, Finland
- Helsinki University Central Hospital, Finland
- Children’s Hospital, University of Helsinki and Helsinki University Hospital, Finland
Figures
Figure 1 with 3 supplements
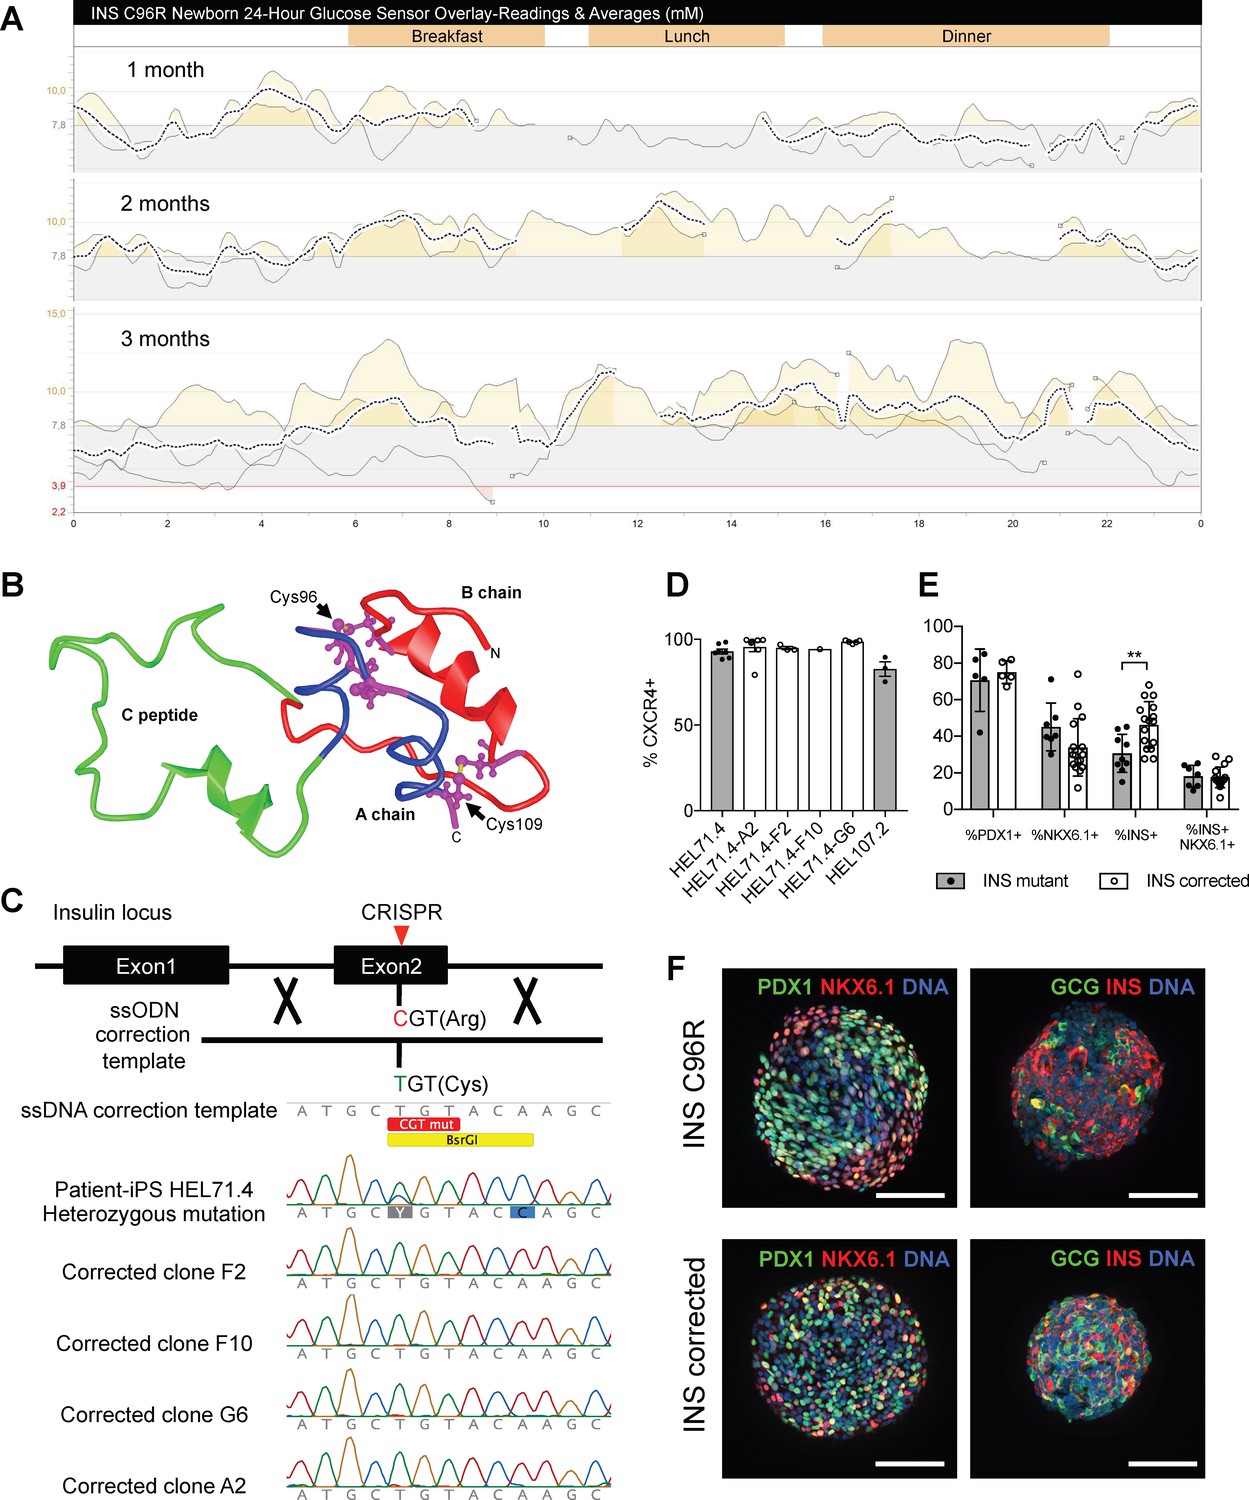
Generation of a disease model of neonatal diabetes caused by insulin mutations.
(A) 24 hr glucose sensor curves of a newborn carrying the INS C96R mutation showing deterioration of glycemic control during the first 3 months of life. (B) Proinsulin model depicting the mutated disulphide bridge-forming cysteines. (C) Mutation correction strategy mediated by CRISPR/Cas9 stimulated homology directed repair, resulting in four INS C96R mutation corrected iPSC clones. (D) Flow cytometry for definitive endoderm marker CXCR4 on day 3 of differentiation of INS mutant and corrected cells lines (n = 1–7 independent differentiation experiments per cell line). (E) Flow cytometry for PDX1, NKX6.1 and INS on Stage 7 of differentiation (n = 3–16 independent differentiation experiments). (F) Whole-mount immunostaining for the pancreatic transcription factors PDX1 and NKX6.1 and islet hormones glucagon (GCG) and INS of Stage 7 differentiated islet-like clusters. Scale bars = 100 μm. Data represent mean ± SEM. **p < 0.01, Student’s t test.
Figure 1—figure supplement 1
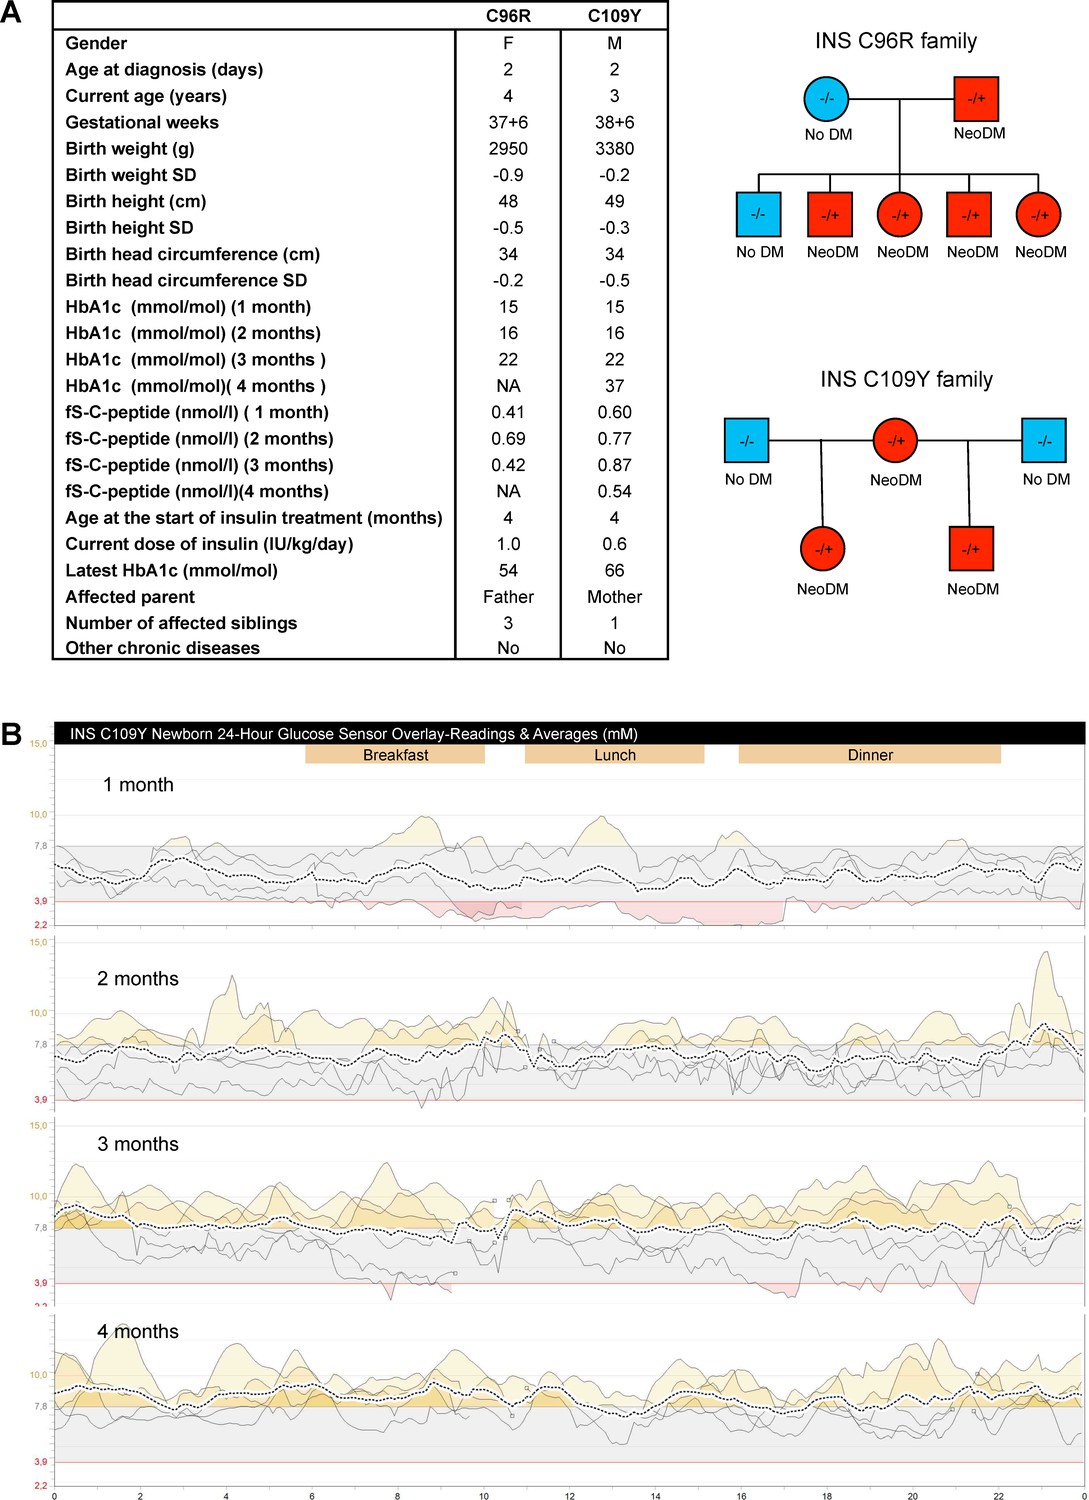
Clinical history of the people carrying insulin gene mutations.
(A) Clinical characteristics and family pedigree of the people carrying insulin gene mutations C96R and C109Y. NeoDM = Neonatal Diabetes Mellitus. (B) Glucose sensor readings and averages of the newborn carrying the C109Y mutation.
Figure 1—figure supplement 2
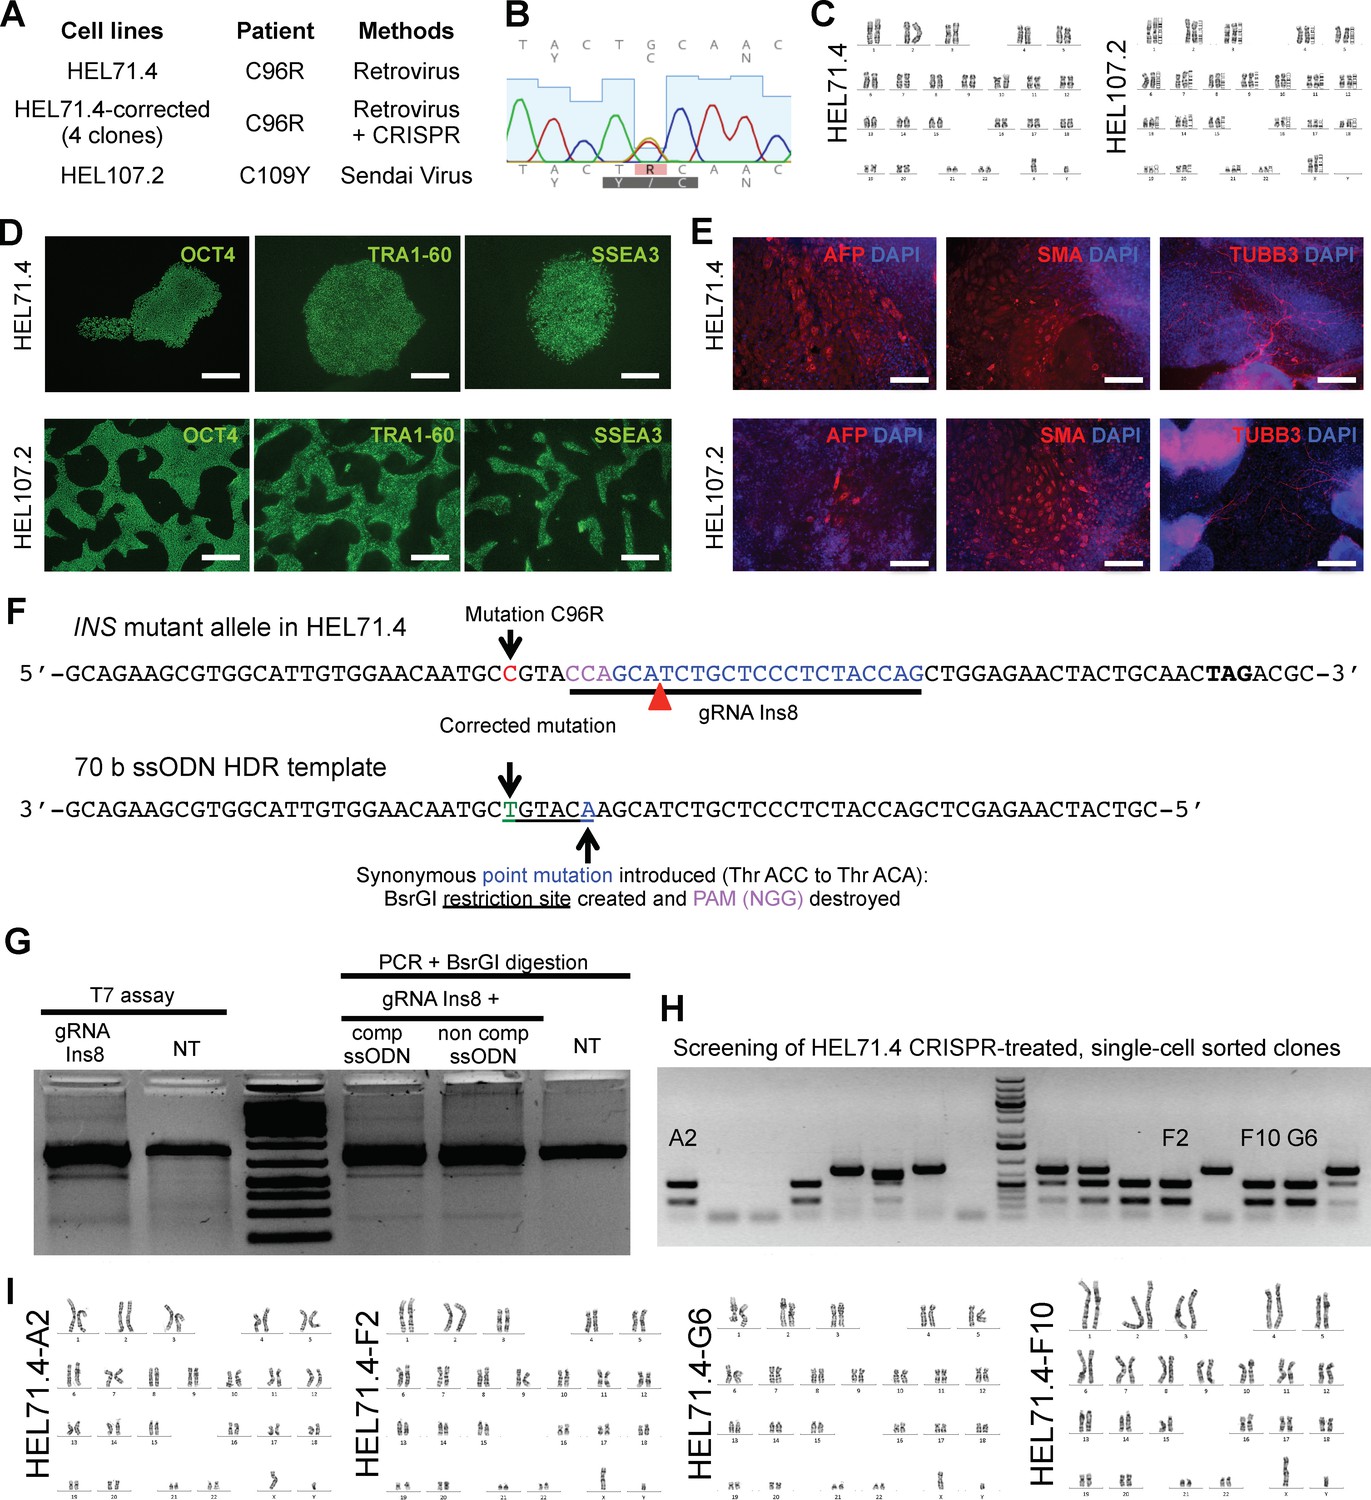
iPSC lines characterization and correction of INS C96R mutation.
(A) Table of cell lines generated from people carrying insulin gene mutations. (B) Sequencing of C109Y G to A heterozygous mutation in HEL107.2 cell line. (C) Normal 46XY and 46XX karyotypes of the derived iPSC lines. (D) Immunocytochemistry for pluripotency markers. Scale bars = 500 μm. (E) Immunocytochemistry for markers of different germ layers in embryoid-body differentiated iPSC lines. AFP, alphafetoprotein (endoderm); SMA, smooth muscle actin (mesoderm); TUBB3, tubulin beta-3 (ectoderm). Scale bars = 200 μm. (F) Schematic representation of gRNA targeting the INSC96R mutation and the 70 b donor template used for the CRISPR-SpCas9-stimulated homology directed repair (HDR) correction. (G) Cutting efficiency of gRNA Ins8 and recombination efficiency of ssODNs repair templates complementary and non complementary to gRNA Ins8 in HEK293 cells. (H) Screening of corrected clones. BsrGI restriction of PCR amplicons coming from different HEL71.4, CRISPR-treated, single cell-sorted clones. Recombinant clones A2, F2, F10 and G6 were verified as corrected by Sanger sequencing (Figure 1c). (I) Normal 46XY karyotypes of HEL71.4 corrected clones.
Figure 1—figure supplement 3
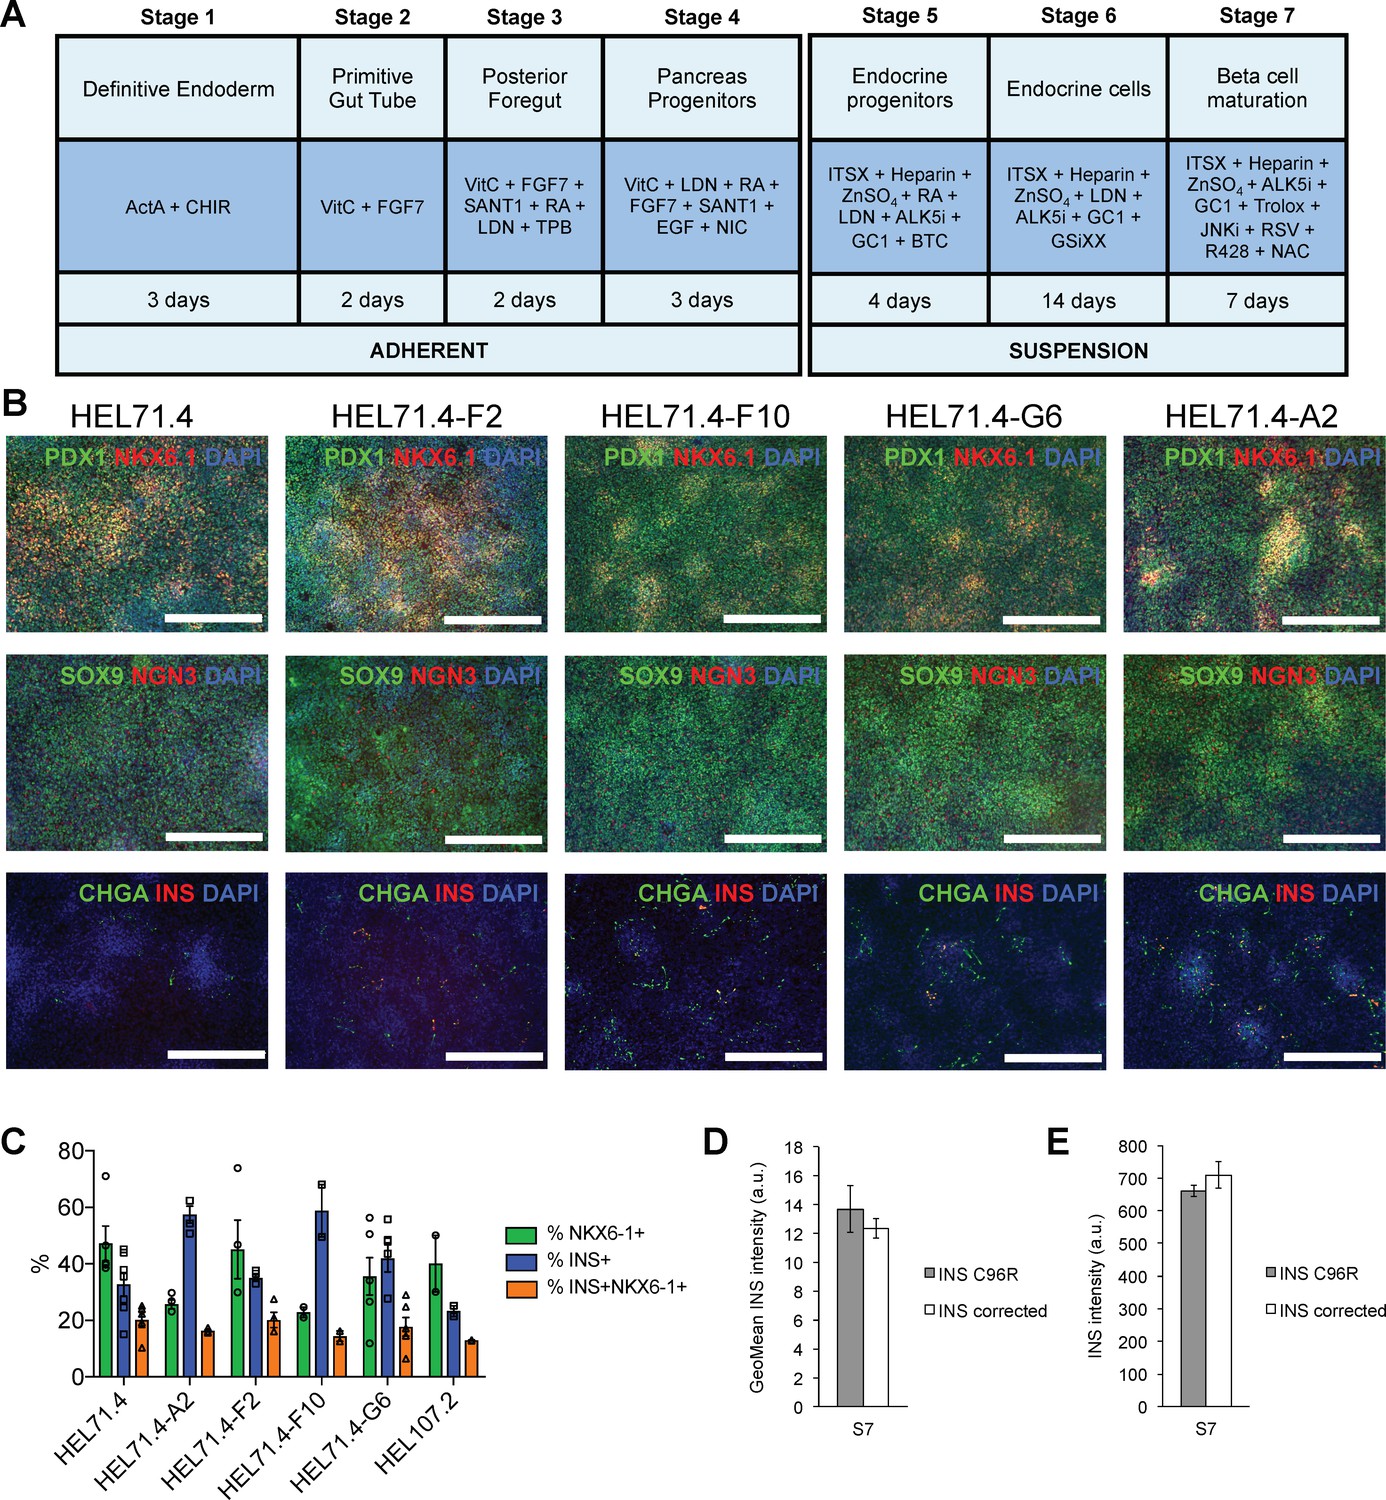
Differentiation efficiency of HEL71.4 mutant and corrected cell lines.
(A) Outline of the iPSC to beta cell differentiation protocol. (B) Immunocytochemistry for pancreatic progenitor markers PDX1, NKX6.1, SOX9 and NGN3 and endocrine markers CHGA and INS at the end of Stage 4. (C) Cytometry for NKX6.1 and INS of INS mutant (HEL71.4 and HEL107.2) and INS corrected iPSC lines differentiated to Stage 7. (D) Quantification by cytometry of INS staining intensity in S7 INS+ cells for INS C96R and INS corrected cells. Data represent mean ± SEM, n = 7–9. (E) Quantification of INS staining intensity from S7 immunostainings for INS C96R and INS corrected cells. Data represent mean ± SEM, n = 7–9.
Figure 2 with 4 supplements
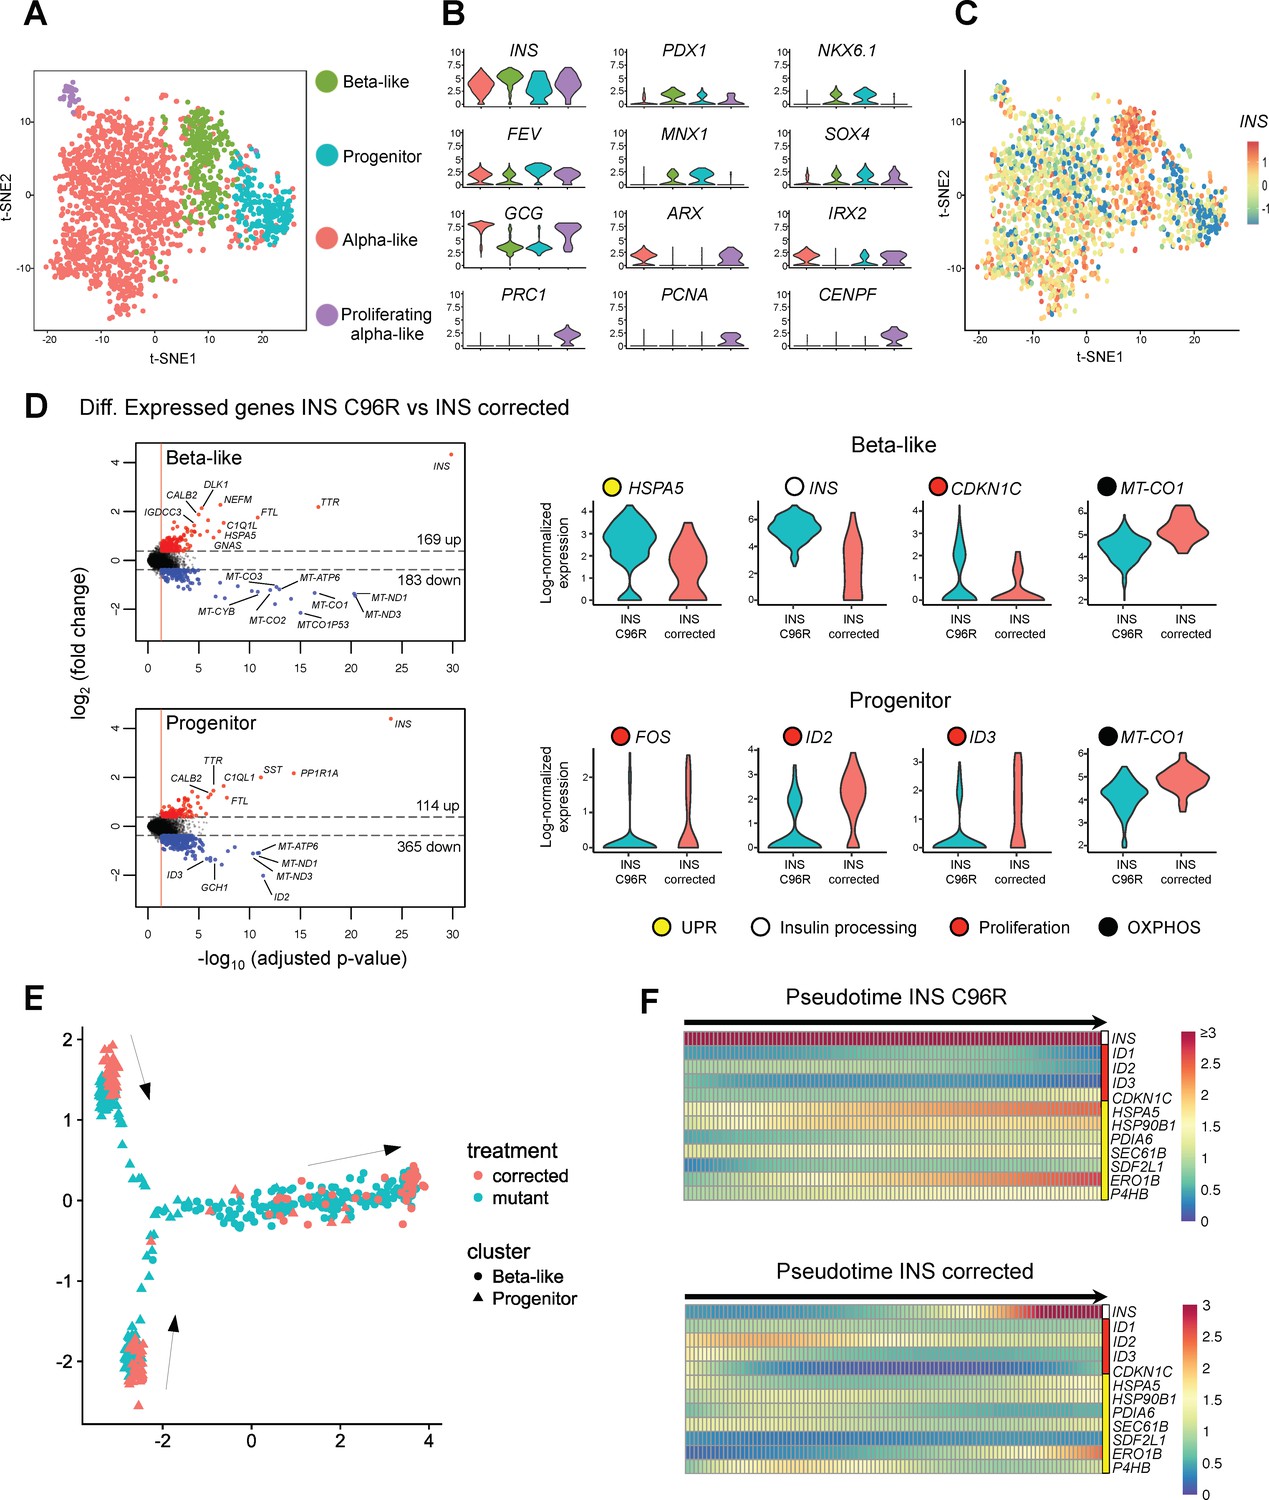
Single cell RNA sequencing revealed increased ER-stress and reduced proliferation in INS mutant beta-like cells.
(A) Single cell RNAseq clustering analysis of Stage 7 islet-like aggregates cells derived from both INS C96R and INS corrected iPSC. A total of 1991 post-QC cells mapped to the Baron et al. (2016) dataset were used for clustering. Four distinct clusters were identified: beta-like cells (308 cells), endocrine progenitor cells (236 cells), alpha-like cells (1252 cells) and proliferating alpha-like cells (45 cells). (B) Violin plots showing log-normalized expression of selected marker genes for each cluster. See also Supplementary file 1 – Table 2. (C) Expression of INS in the different cell populations clusters. (D) Volcano plots illustrate the differentially expressed genes between INS C96R and INS corrected cells in beta-like and progenitor clusters. Violin plots show the relative expression of INS, unfolded protein response (UPR) gene HSPA5 (BIP), proliferation and oxidative phosphorylation related genes that are differentially expressed (fold change ≥ 1.3, adjusted p value < 0.05) between INS C96R and INS corrected cells in the beta-like and progenitor clusters. See also Supplementary file 1 – Table 3. (E) Differentiation trajectory inferred from pseudotime analysis of the beta-like and progenitor clusters. (F) Heatmaps show the normalized, smoothed expression of INS, proliferation (red) and ER-stress (yellow) genes that are differentially regulated across pseudotime between INS C96R and INS corrected cells.
-
Figure 2—source data 1
Single-cell RNA-seq gene count matrices and alignment statistics.
- https://doi.org/10.7554/eLife.38519.012
-
Figure 2—source data 2
HALLMARK_APOPTOSIS and curated C2 gene sets from Broad Institute’s Molecular Signatures Database (MSigDB).
- https://doi.org/10.7554/eLife.38519.014
Figure 2—figure supplement 1
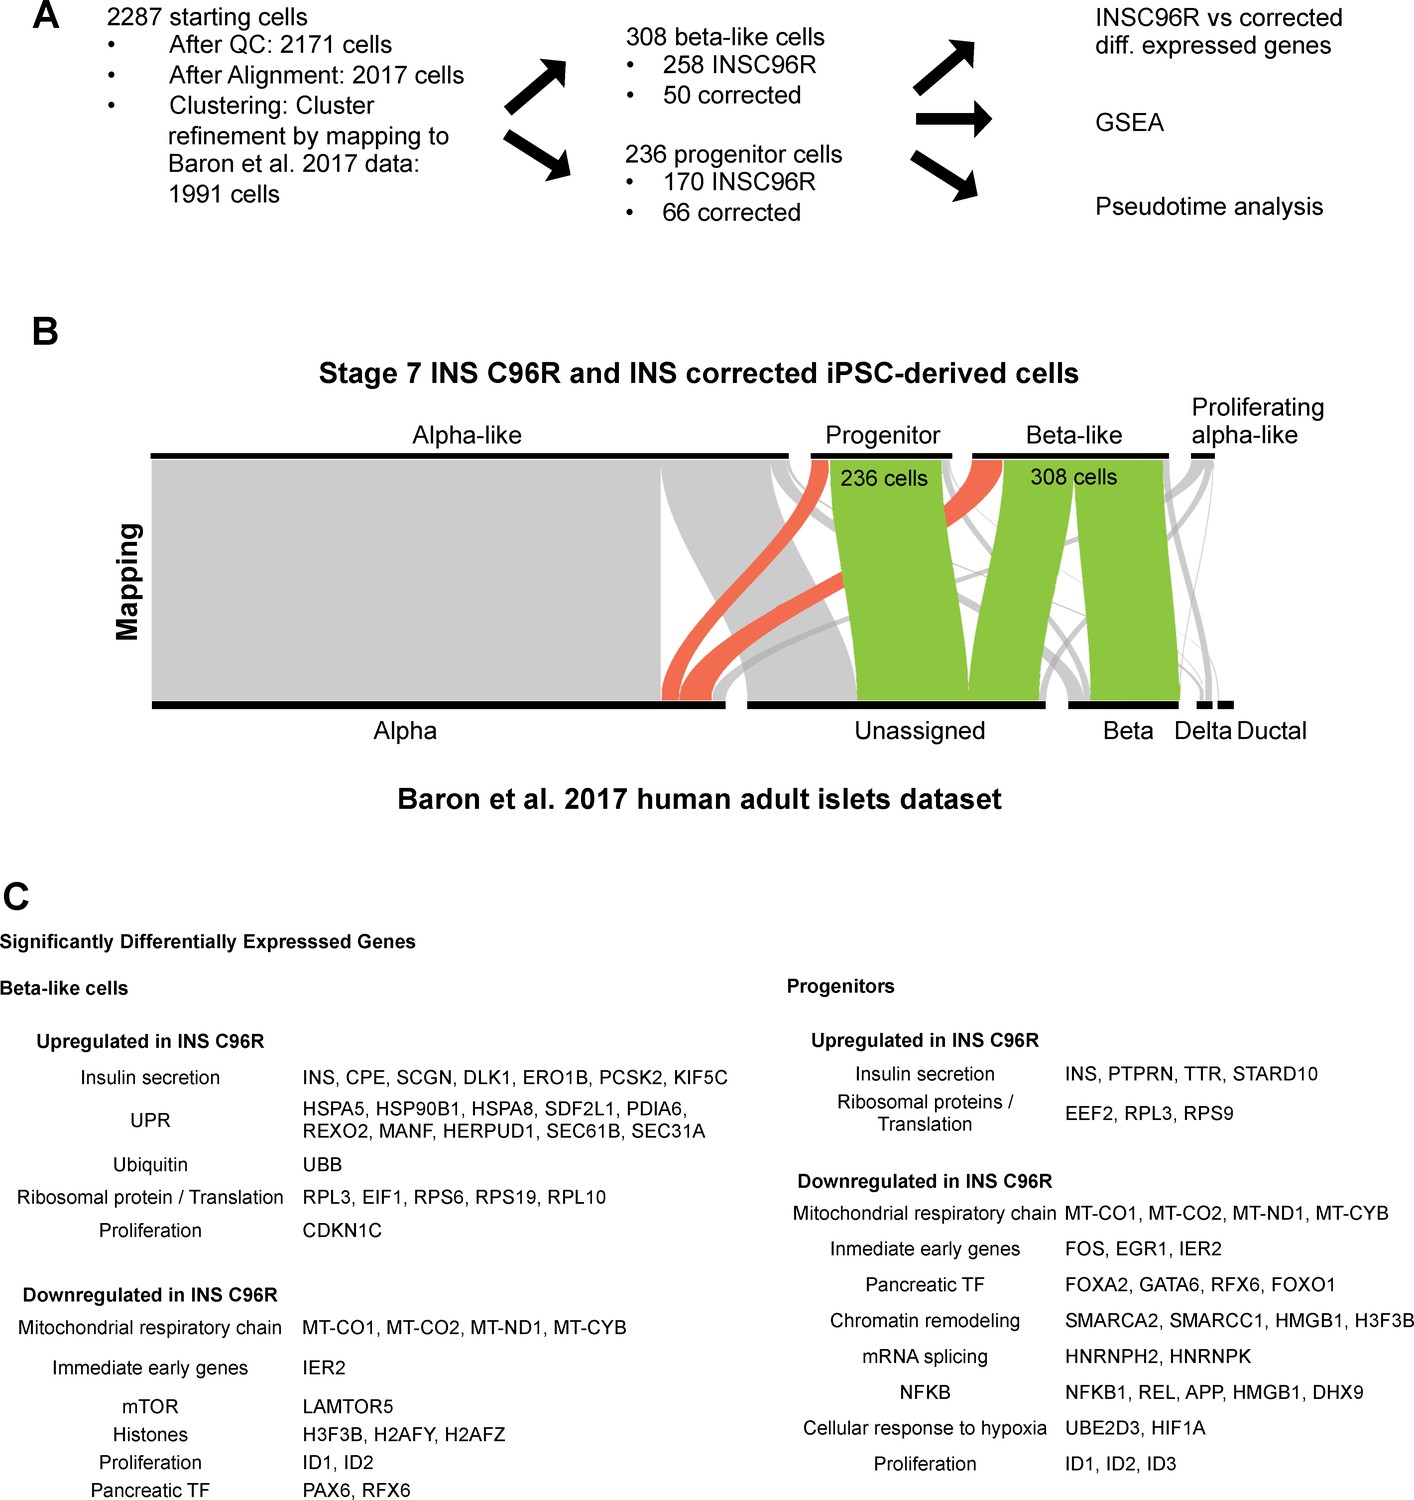
Single cell RNA sequencing data analysis strategy.
(A) Steps in the analysis of the scRNAseq data. (B) Clustering refinement by mapping the Stage 7 scRNAseq cell clusters to the published InDrop dataset of human adult islets by Baron et al. (2016). (C) Selected summary of gene sets that are up- and down-regulated between INS C96R and INS corrected cells in beta-like and progenitor clusters. See also Supplementary file 1 – Tables 3-6.
Figure 2—figure supplement 2
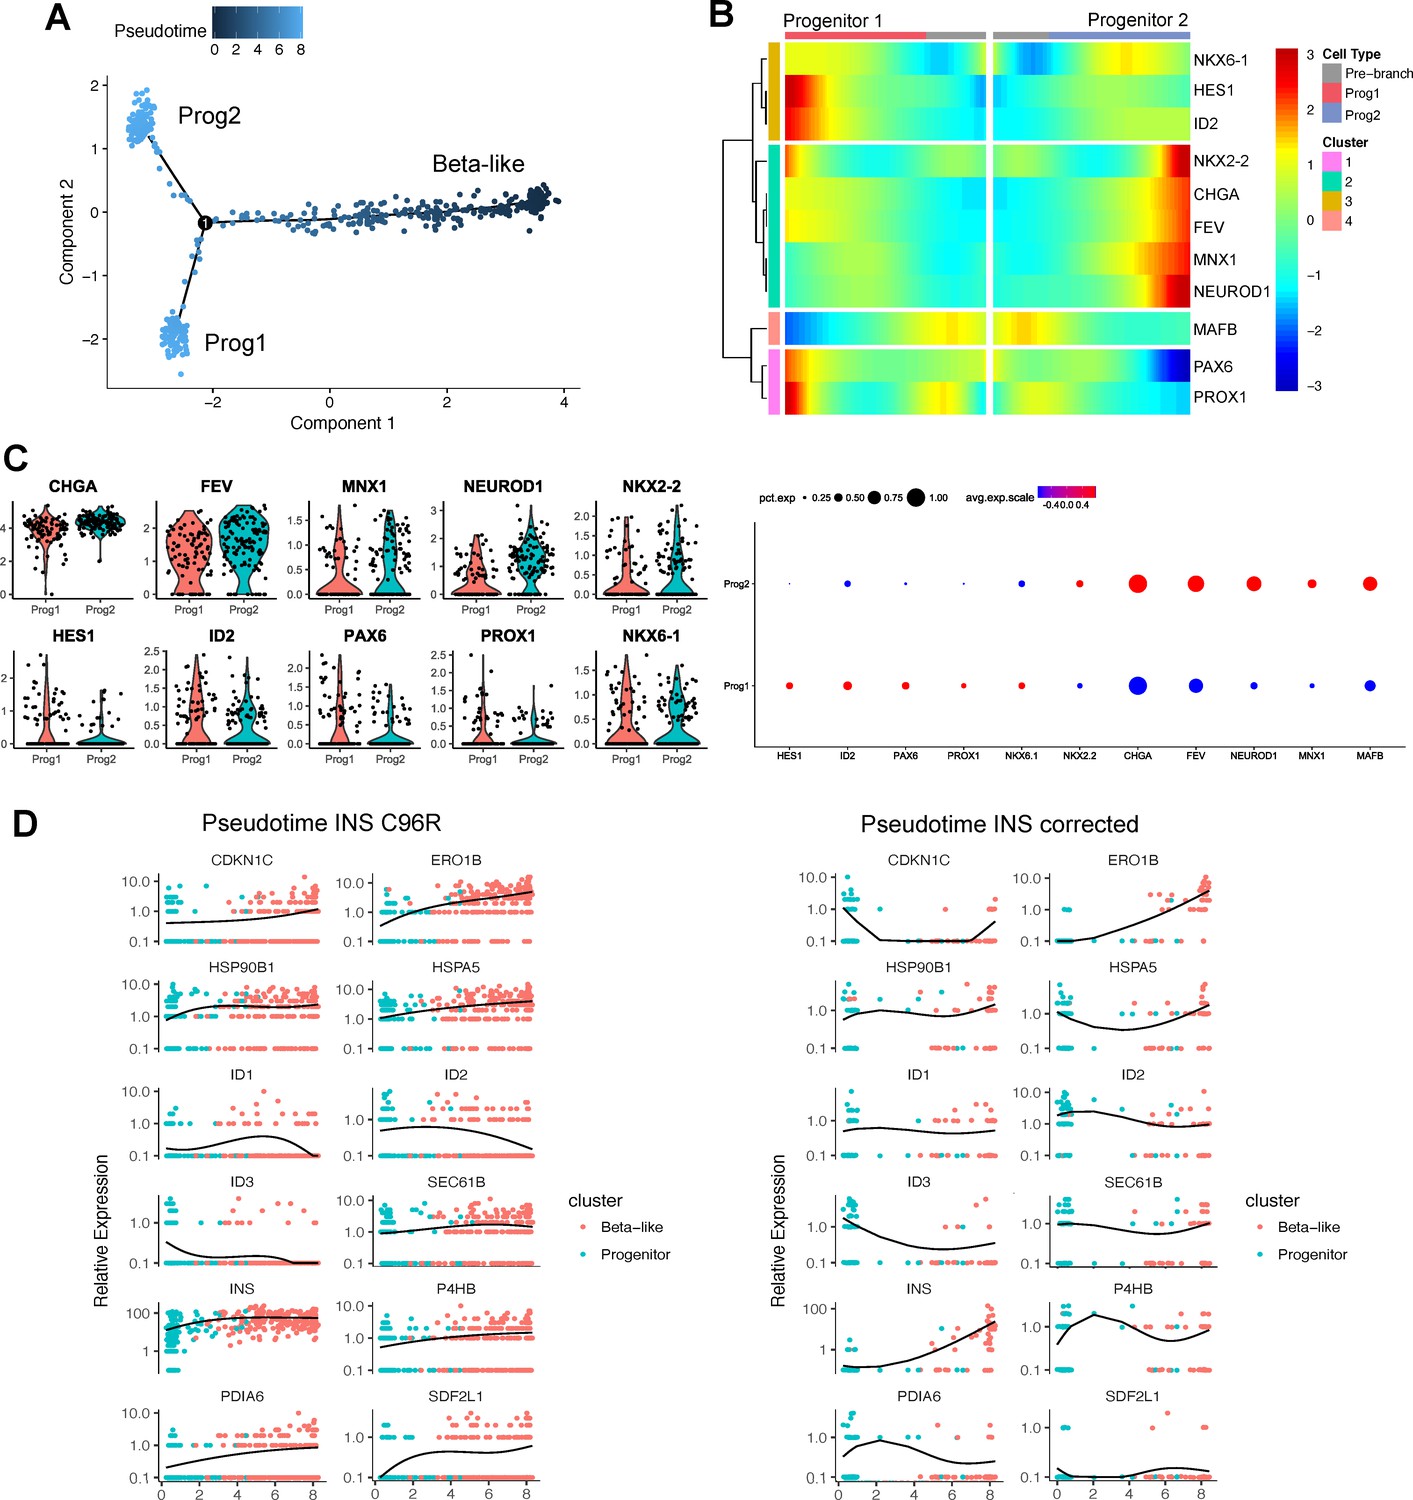
Pseudotime analysis of INS C96R vs INS corrected cells.
(A) Pseudotime trajectory inferred from beta-like and progenitor clusters (non-reversed). (B) Heatmap clustering of selected marker genes differentially expressed genes between the two progenitor branches. (C) Violin plots representing the expression of selected markers genes in the two progenitor populations. Dot plots represent the percentage of cells in a given progenitor population expressing a particular marker, and the scaled mean relative expression of the gene. (D) Relative expression of the genes differentially regulated along pseudotime between INS C96R and INS corrected cells, presented as a heatmap in Figure 2F. Graphs represent individual single cell expression levels and the expression trend fitted over pseudotime.
Figure 2—figure supplement 3
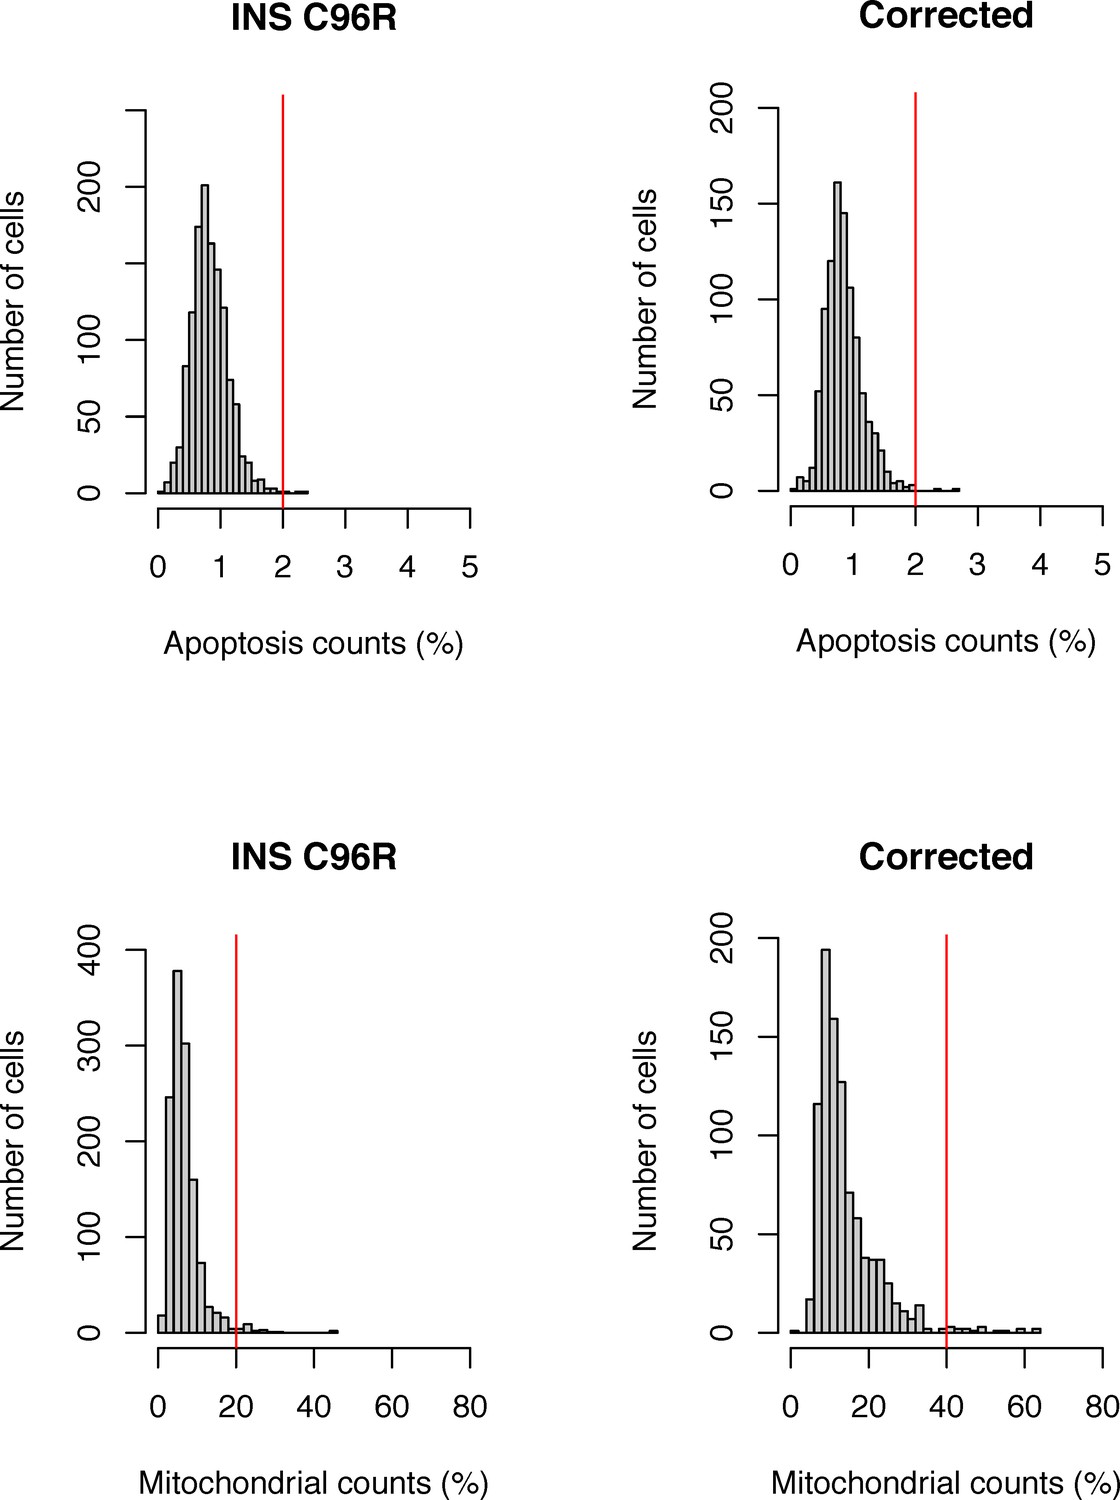
Single-cell RNA-seq quality control with mitochondrial and apoptosis count filters.
(A) Distributions of mitochondrial counts per cell in mutant and corrected samples. (B) Distributions of apoptosis gene counts per cell in mutant and corrected samples. Cells with values above the threshold (red vertical line) were filtered out.
Figure 2—figure supplement 4
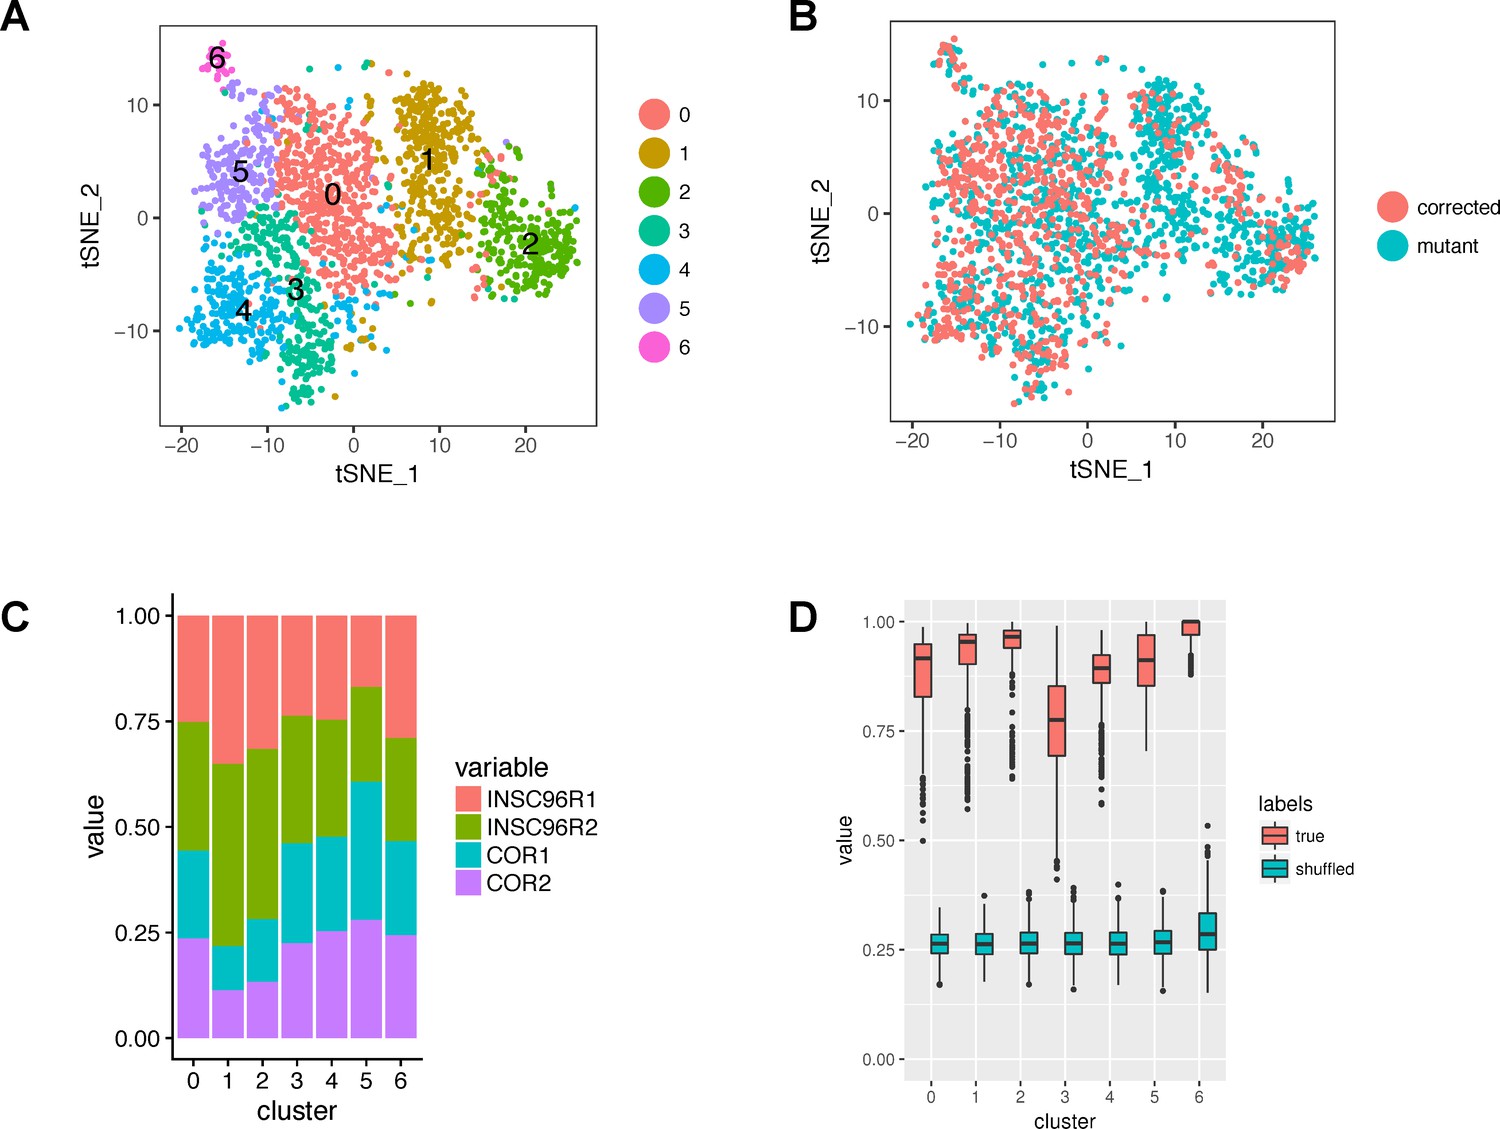
Cluster composition and robustness.
(A) A tSNE plot showing the original clusters (before merging and refinement) identified by Seurat. (B) The same tSNE plot with cells colored by mutation status. (C) Bar graph showing the proportions of samples within the original clusters. (D) Robustness of clusters. The boxplots show the maximum proportions of co-clustered cells from a given original cluster in 1000 subsampling runs. The proportions are shown also for the null distribution of shuffled cell-cluster pairs.
Figure 3 with 1 supplement
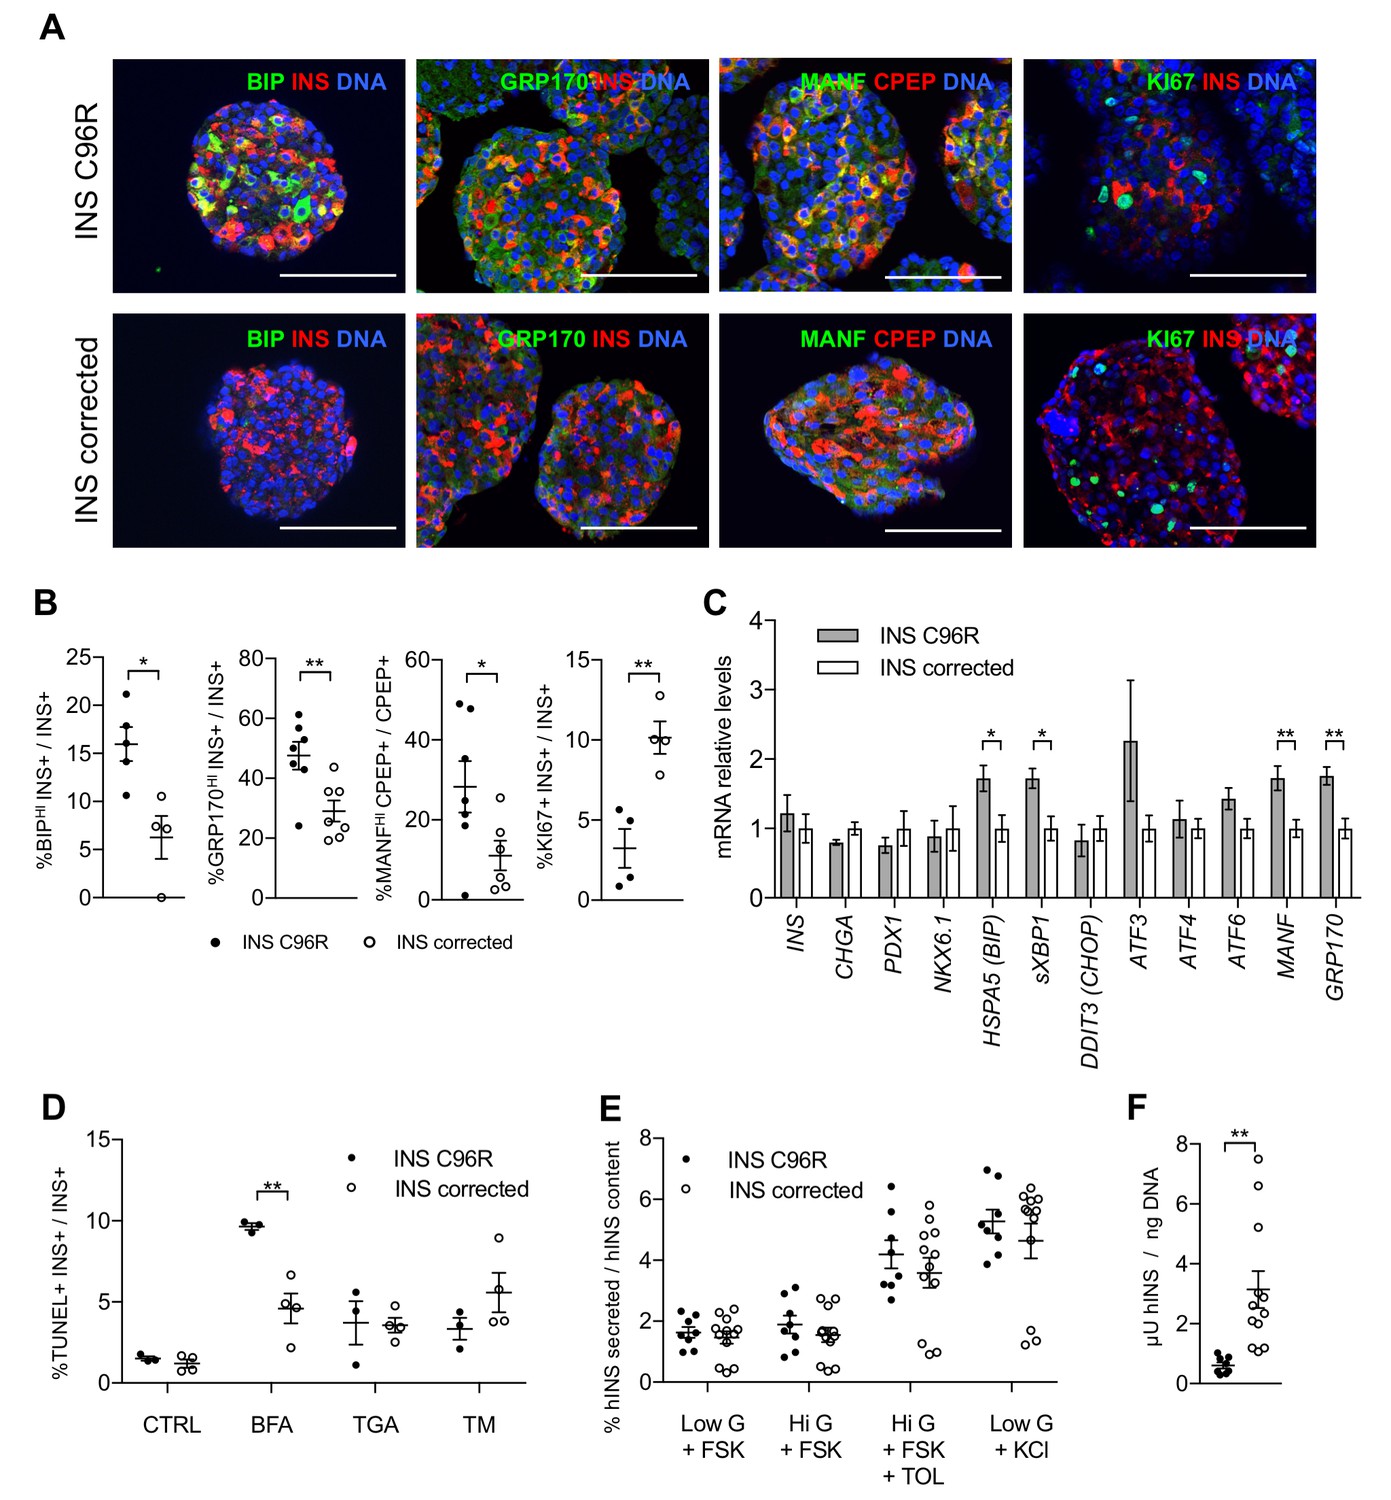
In vitro differentiated INS mutant cells presented increased ER-stress associated with reduced proliferation and insulin content.
(A) Immunohistochemistry for ER-stress markers (BIP, GRP170, MANF) and proliferation marker KI67 along with INS in Stage 7 cells. Scale bars = 100 μm. (B) Quantification of (A). Percentage of Stage 7 insulin positive cells that express BIP, GRP170, MANF and KI67 (n = 3–7 independent differentiation experiments per genotype). (C) qRT-PCR of beta-cell and ER-stress markers (n = 5–6 independent differentiation experiments per genotype). (D) Sensitivity to ER-stress-induced apoptosis of Stage 7 cells. Percentage of insulin positive cells that are labeled by TUNEL assay in control conditions and after treatment with ER-stress inducers brefeldin A (BFA), thapsigargin (TGA) and tunicamycin (TM). (E) Static sequentially stimulated insulin secretion of Stage 7 cells, presented as fractional secretion of total INS content. Low G = 3.3 mM glucose; Hi G = 20 mM glucose; TOL = tolbutamide 100 μM; KCl = 30 mM KCl; FSK = 1 μM forskolin. (n = 8–12 independent stimulations per genotype). (F) Human insulin content in Stage 7 cells. Cell mass normalized by DNA content (n = 8–12 independent stimulations per cell genotype). Data represent mean ± SEM. Student’s t test, *p < 0.05, **p < 0.01.
Figure 3—figure supplement 1
Characterization of in vitro Stage 7 cells and 3 months old grafts.
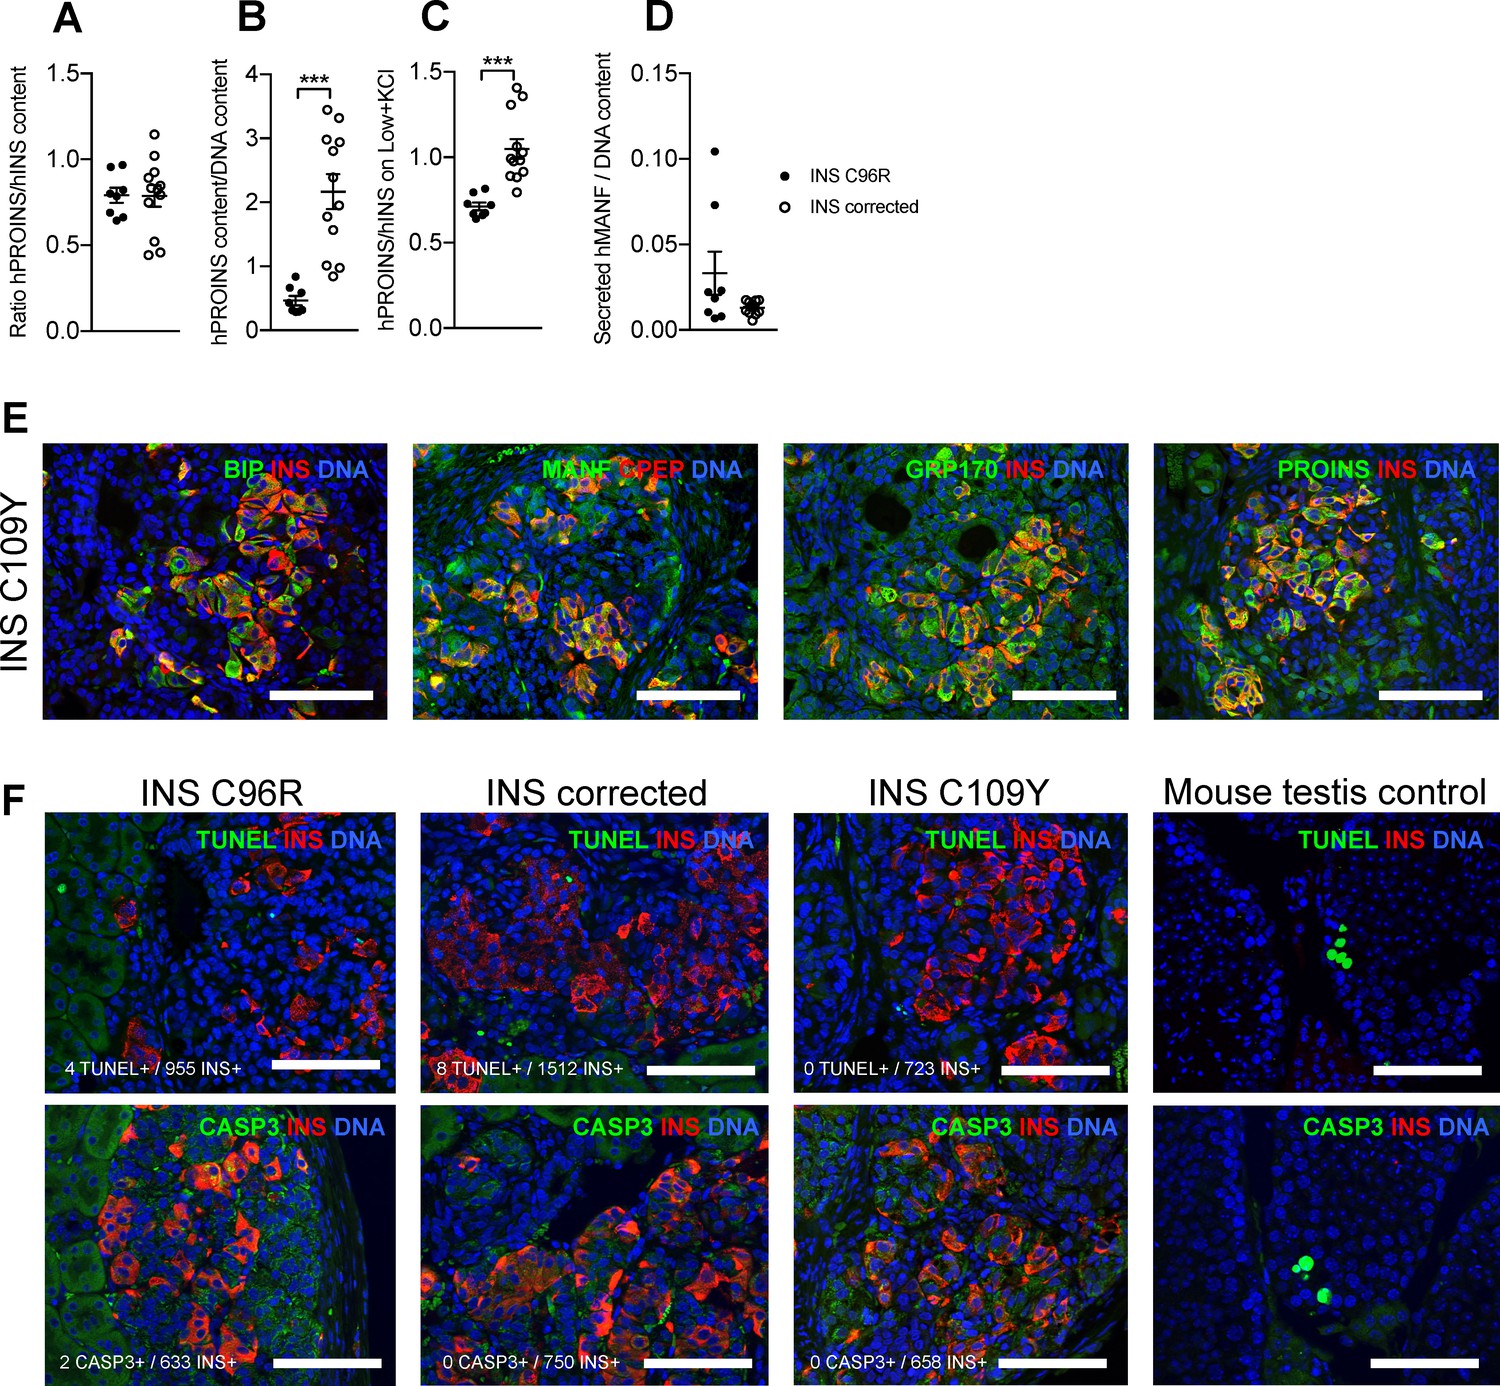
Related to Figures 3, 4 and 5. (A) Ratio of human proinsulin to insulin content of Stage 7 islet-like aggregates. (B) Human proinsulin content of Stage 7 islet-like aggregates. (C) Ratio of human proinsulin to human insulin secretion in response to maximal stimulation with Low glucose + KCl of Stage 7 islet-like aggregates. (D) Overnight secretion of human MANF by Stage 7 islet-like aggregates. ***p < 0.001, Student’s t test for (B), Student’s t test with Welch’s correction for (C). Data represent mean ± SEM, n = 8–12 independent stimulations per cell genotype. (E) Immunohistochemistry for apoptosis markers TUNEL and CASP3 in INS+ cells. (F) Immunohistochemistry for ER-stress markers BIP, MANF, GRP170 and proinsulin (PROINS) in INS C109Y 3 month old grafts. Scale bars = 100 µm.
Figure 4
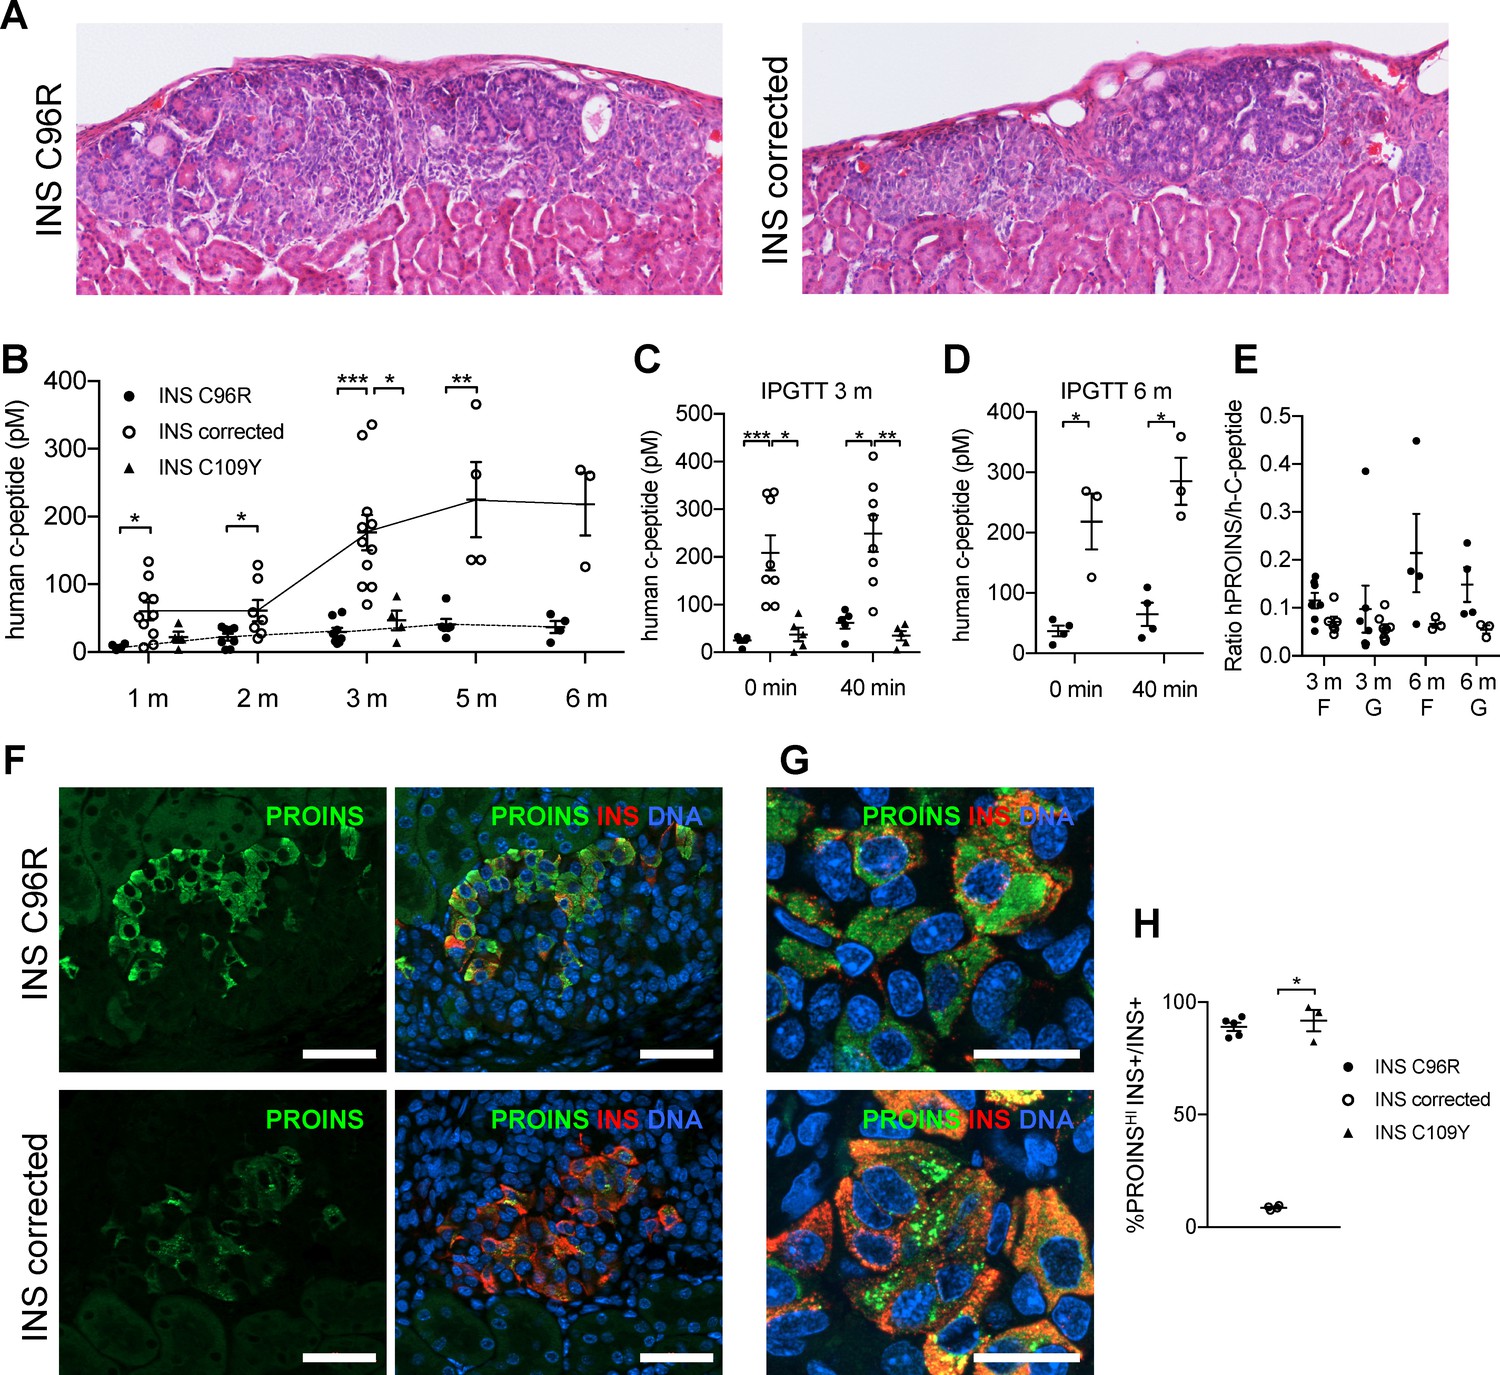
Reduced insulin secretion and increased proinsulin accumulation in transplanted INS mutant beta-cells.
(A) Hematoxylin-eosin staining of Stage 7 islet-like cell clusters transplanted under the kidney capsule of NSG mice and retrieved after 3 months. (B) Monthly tracking of INS C96R, INS C109Y and INS corrected grafts functionality by measuring circulating human C-peptide in randomly fed transplanted mice (n = 3–11 independent transplanted animals per cell genotype and time point; Kruskal-Wallis test for 1 and 3 months, Mann-Whitney test for 2, 5 and 6 months). (C–D) Intraperitoneal glucose tolerance test (IPGTT) in mice transplanted for 3 and 6 months. C-peptide levels measured on fasted animals 0 min and 40 min after glucose injection. (n = 5–8 independent transplanted animals per cell genotype and time points; Kruskal-Wallis test for (C), Mann-Whitney test for (D)). (E) Ratio of human proinsulin to human C-peptide in fasted mice (F) and 40 min after glucose injection (G) at 3 and 6 months after transplantation (n = 3–8 independent transplanted animals per cell genotype and time point). (F) Immunohistochemistry for insulin (INS) and proinsulin (PROINS) in 3-months old grafts. Scale bars = 50 μm. (G) Higher magnification of immunohistochemistry for insulin (INS) and proinsulin (PROINS) in 3-months old grafts. Scale bars = 20 μm. (H) Percentage of INS+ cells stained for PROINS in 3 month old grafted beta-like cells (n = 3–5; Kruskal-Wallis test). Data represent mean ± SEM. *p < 0.05, **p < 0.01, ***p < 0.001.
Figure 5 with 2 supplements
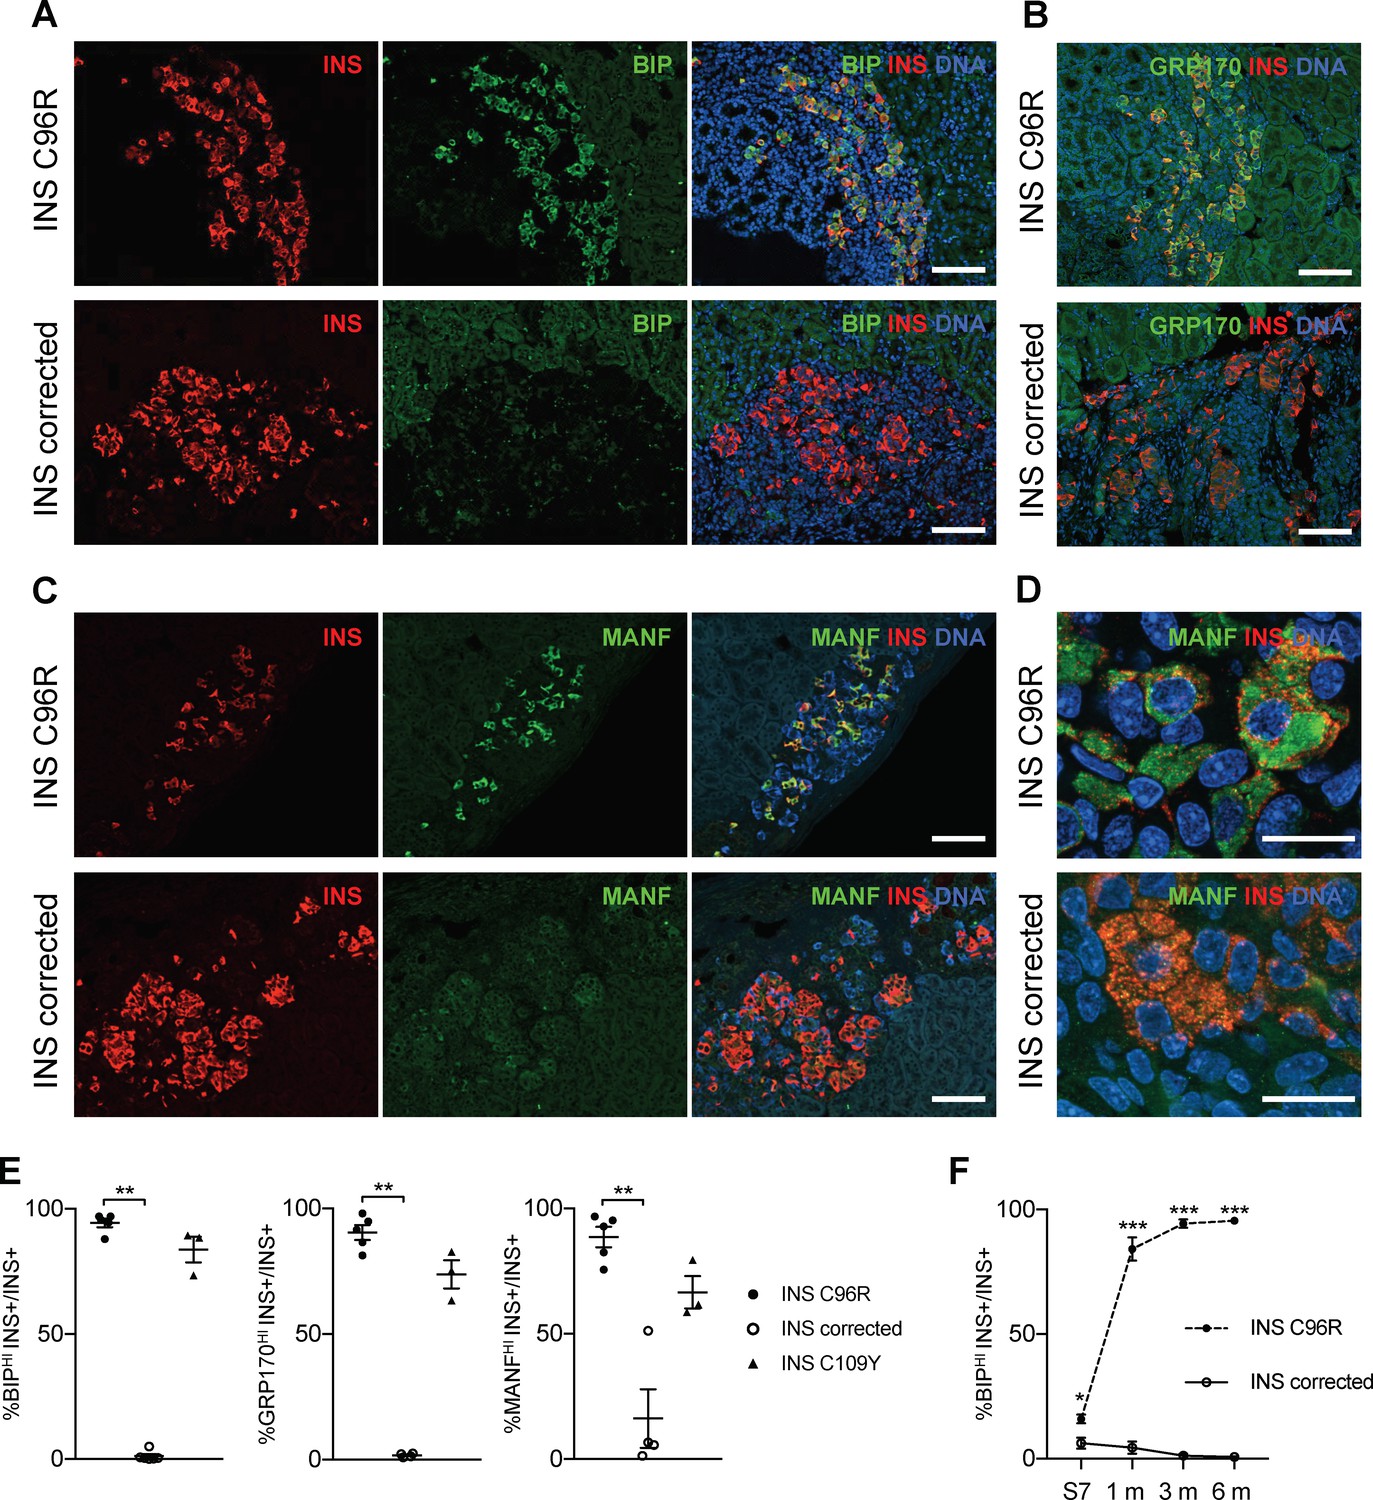
Transplanted INS mutant beta-cells presented increased expression of ER-stress markers.
(A–C) Immunohistochemistry for ER-stress markers BIP, GRP170 and MANF together with INS in 3 months old grafts. Scale bars = 100 μm. (D) Closer magnification of immunohistochemistry for MANF. Scale bars 20 μm. (E) Quantification of (A–C). Percentage of insulin positive cells expressing BIP, GRP170 or MANF in 3 months old grafts (n = 3–5 independent transplanted animals per genotype; Kruskal-Wallis test). (F) Dynamic changes in the percentage of insulin positive cells expressing BIP between Stage 7 and 6 months old grafts (n = 3–6; Student’s t test). Data represent mean ± SEM. *p < 0.05, **p < 0.01, ***p < 0.001.
Figure 5—figure supplement 1
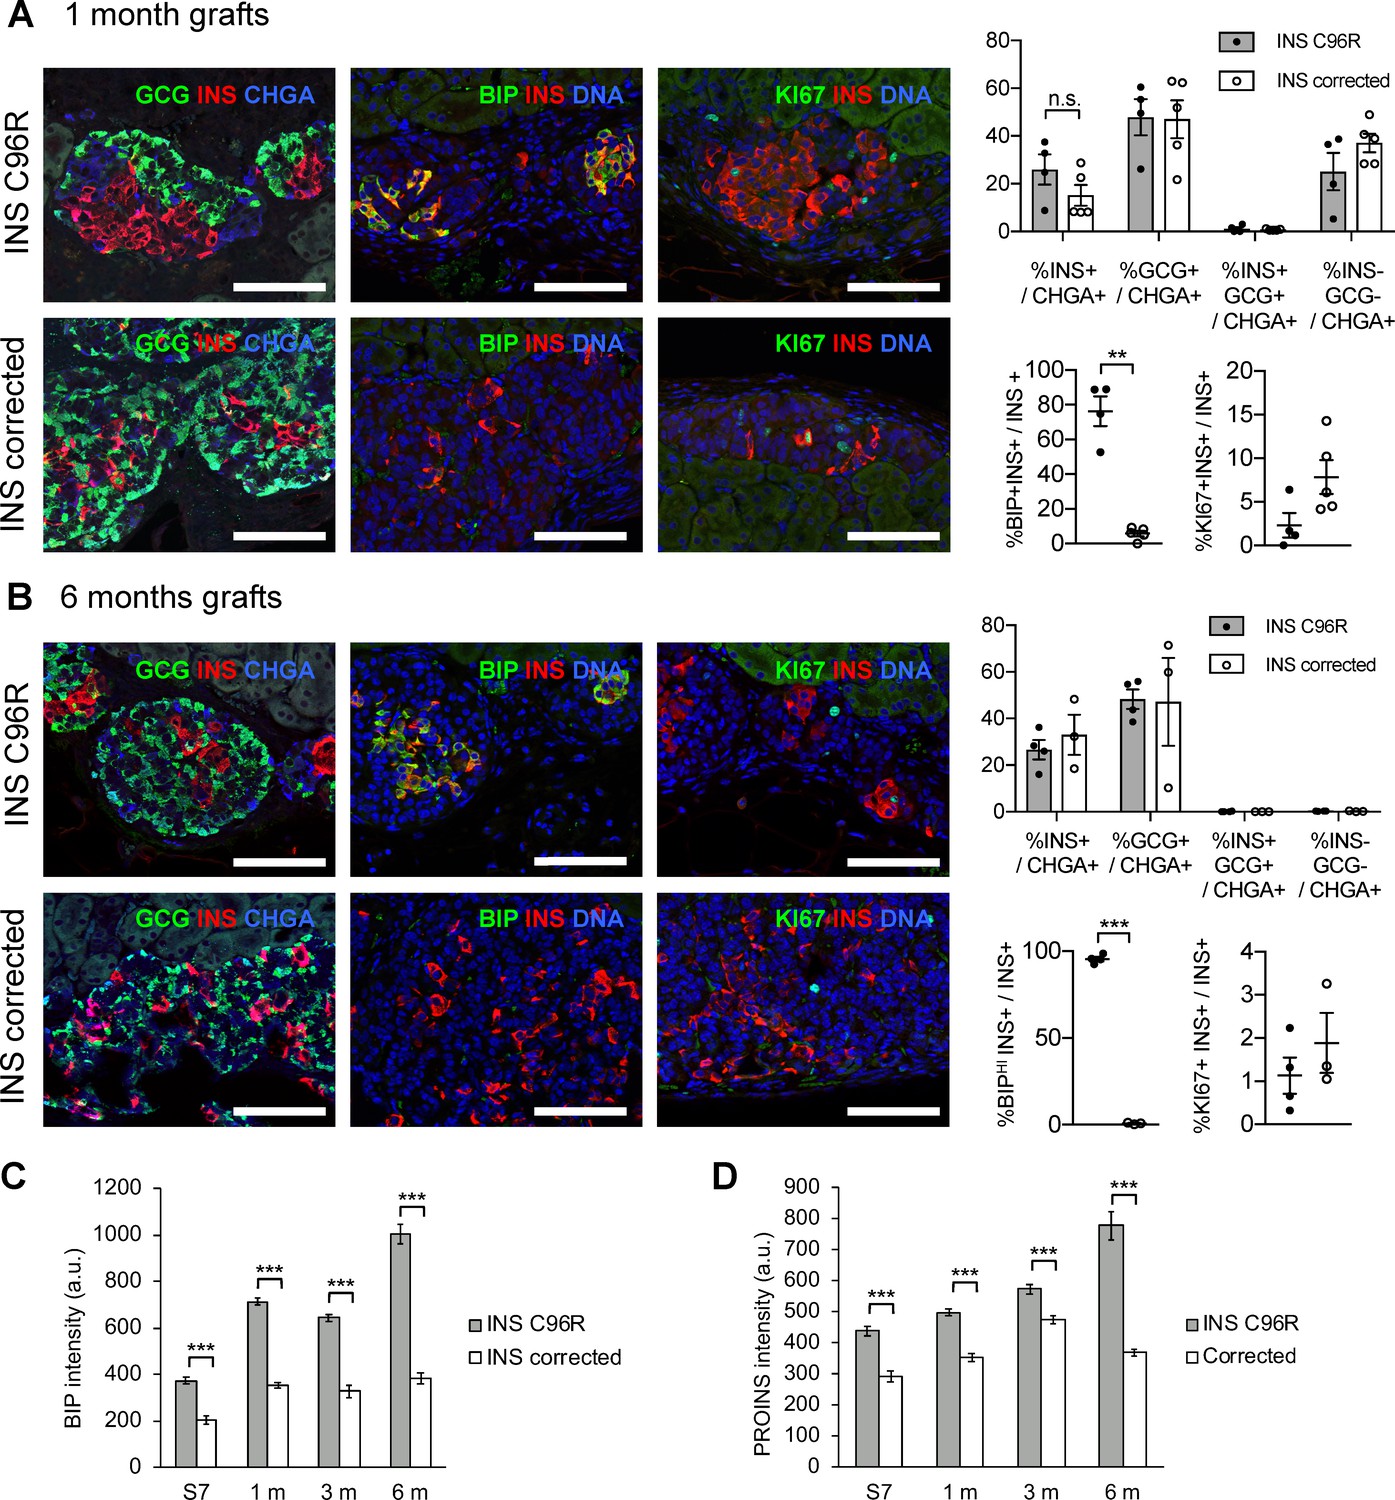
Increased ER-stress and reduced proliferation in 1 and 6–month grafts.
(A) Immunohistochemistry for endocrine hormones GCG, INS and CHGA, ER-stress marker BIP and proliferation marker KI67 in 1 month old grafts, and its quantification (n = 4–5; n.s. = not significant using Mann-Whitney test; **p < 0.01 using Student’s t test with Welch’s correction). (B) Immunohistochemistry for endocrine hormones GCG, INS and CHGA, ER-stress marker BIP and proliferation marker KI67 in 6 months old grafts, and its quantification. Data represent mean ± SEM, n = 3–4 independent grafts per cell genotype. Scale bars = 100 µm. (C–D) Quantification of BIP and PROINS staining mean fluorescence intensity per individual INS+ cell across genotypes and timepoints. ***p < 0.001, Student’s t test. Data represent mean ± SEM, n = 44–268, a.u. = arbitrary units.
Figure 5—figure supplement 2

Correlation of proliferation markers with ER-stress marker levels in INS+ cells.
(A–C) Quantification of BIP, INS and PROINS staining mean fluorescence intensity per individual proliferating (PCNA+ or KI67+) and non-proliferating INS+ cell across genotypes and timepoints. *p < 0.05, **p < 0.01, ***p < 0.001, Student’s t test. Data represent mean ± SEM, n = 7–268, a.u. = fluorescence intensity arbitrary units.
Figure 6
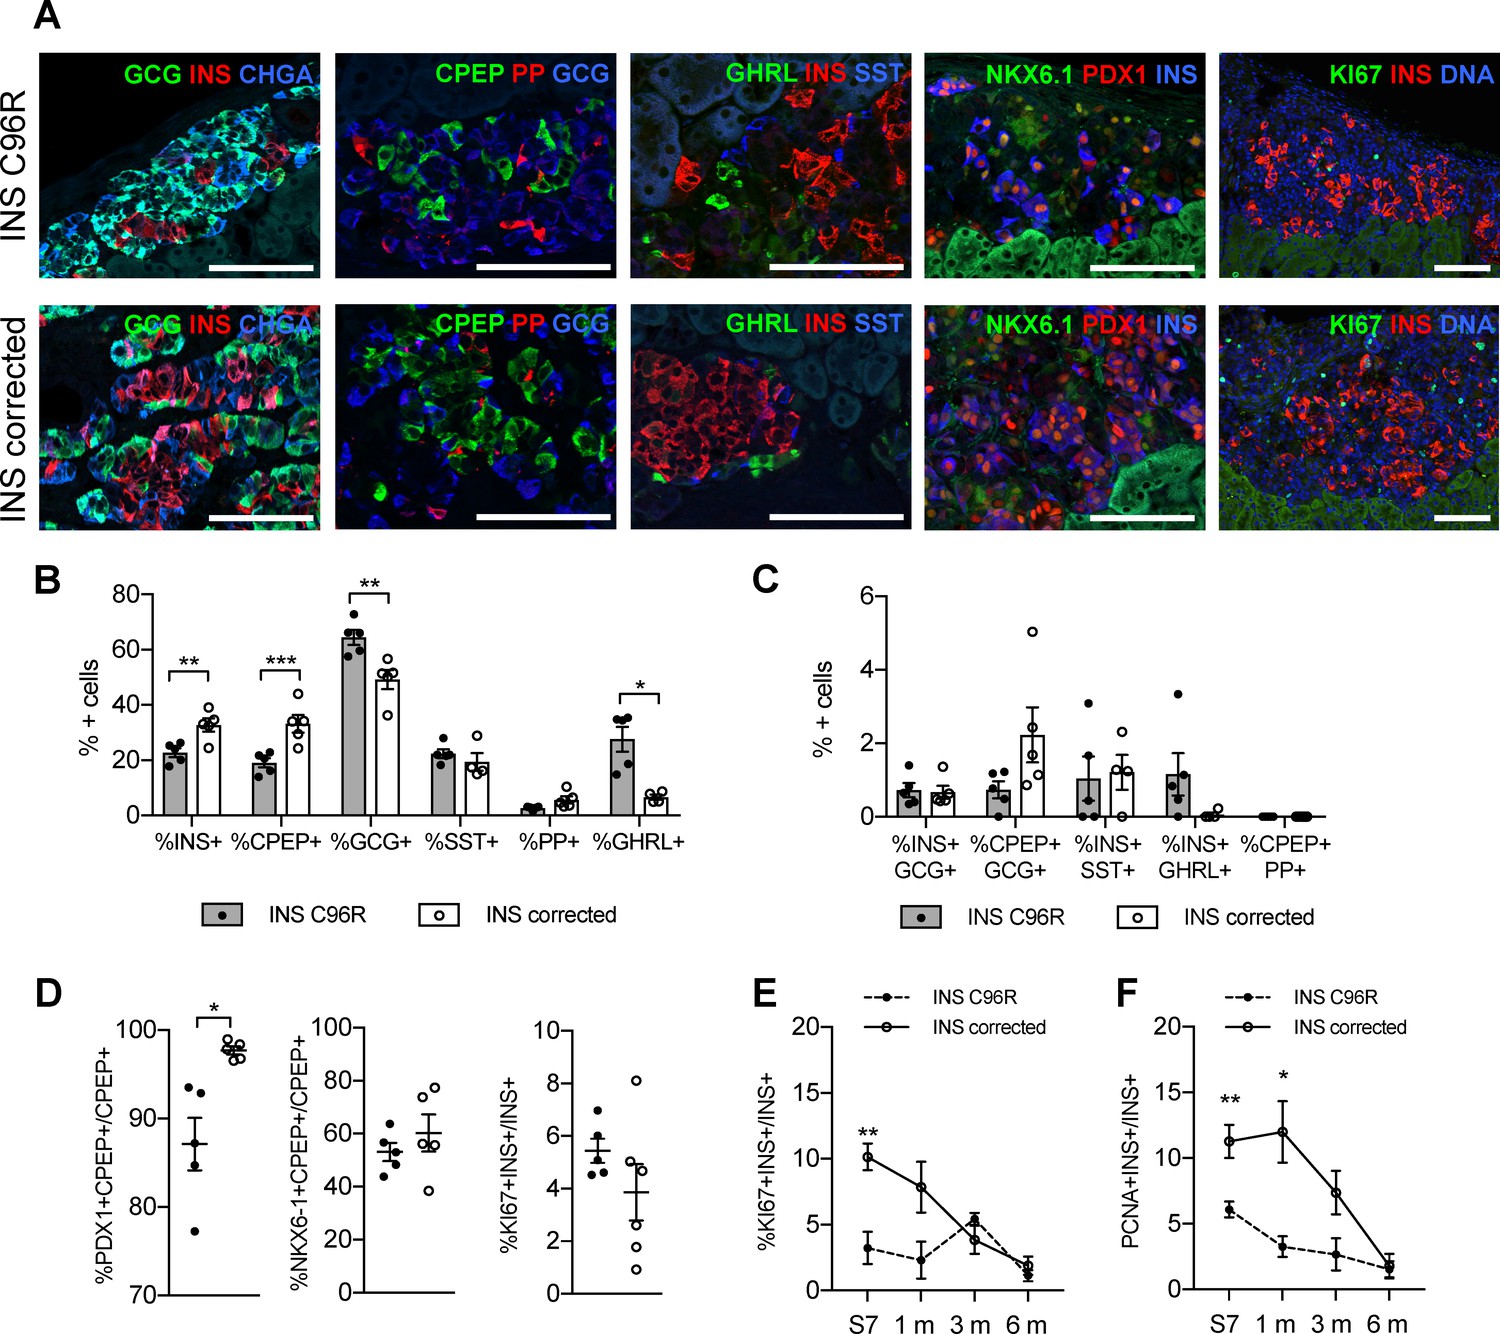
Altered endocrine cell proportions and reduced PDX1 expression in INS mutant grafts.
(A) Immunohistochemistry for endocrine hormones glucagon (GCG), insulin (INS), chromogranin A (CHGA), C-peptide (CPEP), pancreatic polypeptide (PP), ghrelin (GHRL), somatostatin (SST), transcription factors PDX1 and NKX6.1, and proliferation marker MK67 (KI67) on 3 months old grafts. Scale bars = 100 μm. (B) Quantification of immunohistochemistry presented in (A) for proportions of monohormonal cells in 3 months old grafts. (n = 4–5, Student’s t test for all except for GHRL where Mann-Whitney test was used) (C) Proportions of polyhormonal cells in 3 months old grafts. (D) Quantification of immunohistochemistry presented in (A). Percentage of c-peptide/insulin positive cells expressing PDX1, NKX6.1 or KI67 in 3 months old grafts (n = 5–6 independent transplanted animals per genotype, Student’s t test with Welch’s correction). (E) Dynamic changes in the percentage of insulin positive cells expressing KI67 between Stage 7 and 6 months old grafts (n = 4–6; Student’s t test). (F) Dynamic changes in the percentage of insulin positive cells expressing PCNA between Stage 7 and 6 months old grafts (n = 4–6; Student’s t test). Data represents individual values and mean ± SEM. See also Figure 5—figure supplement 1.
Figure 7
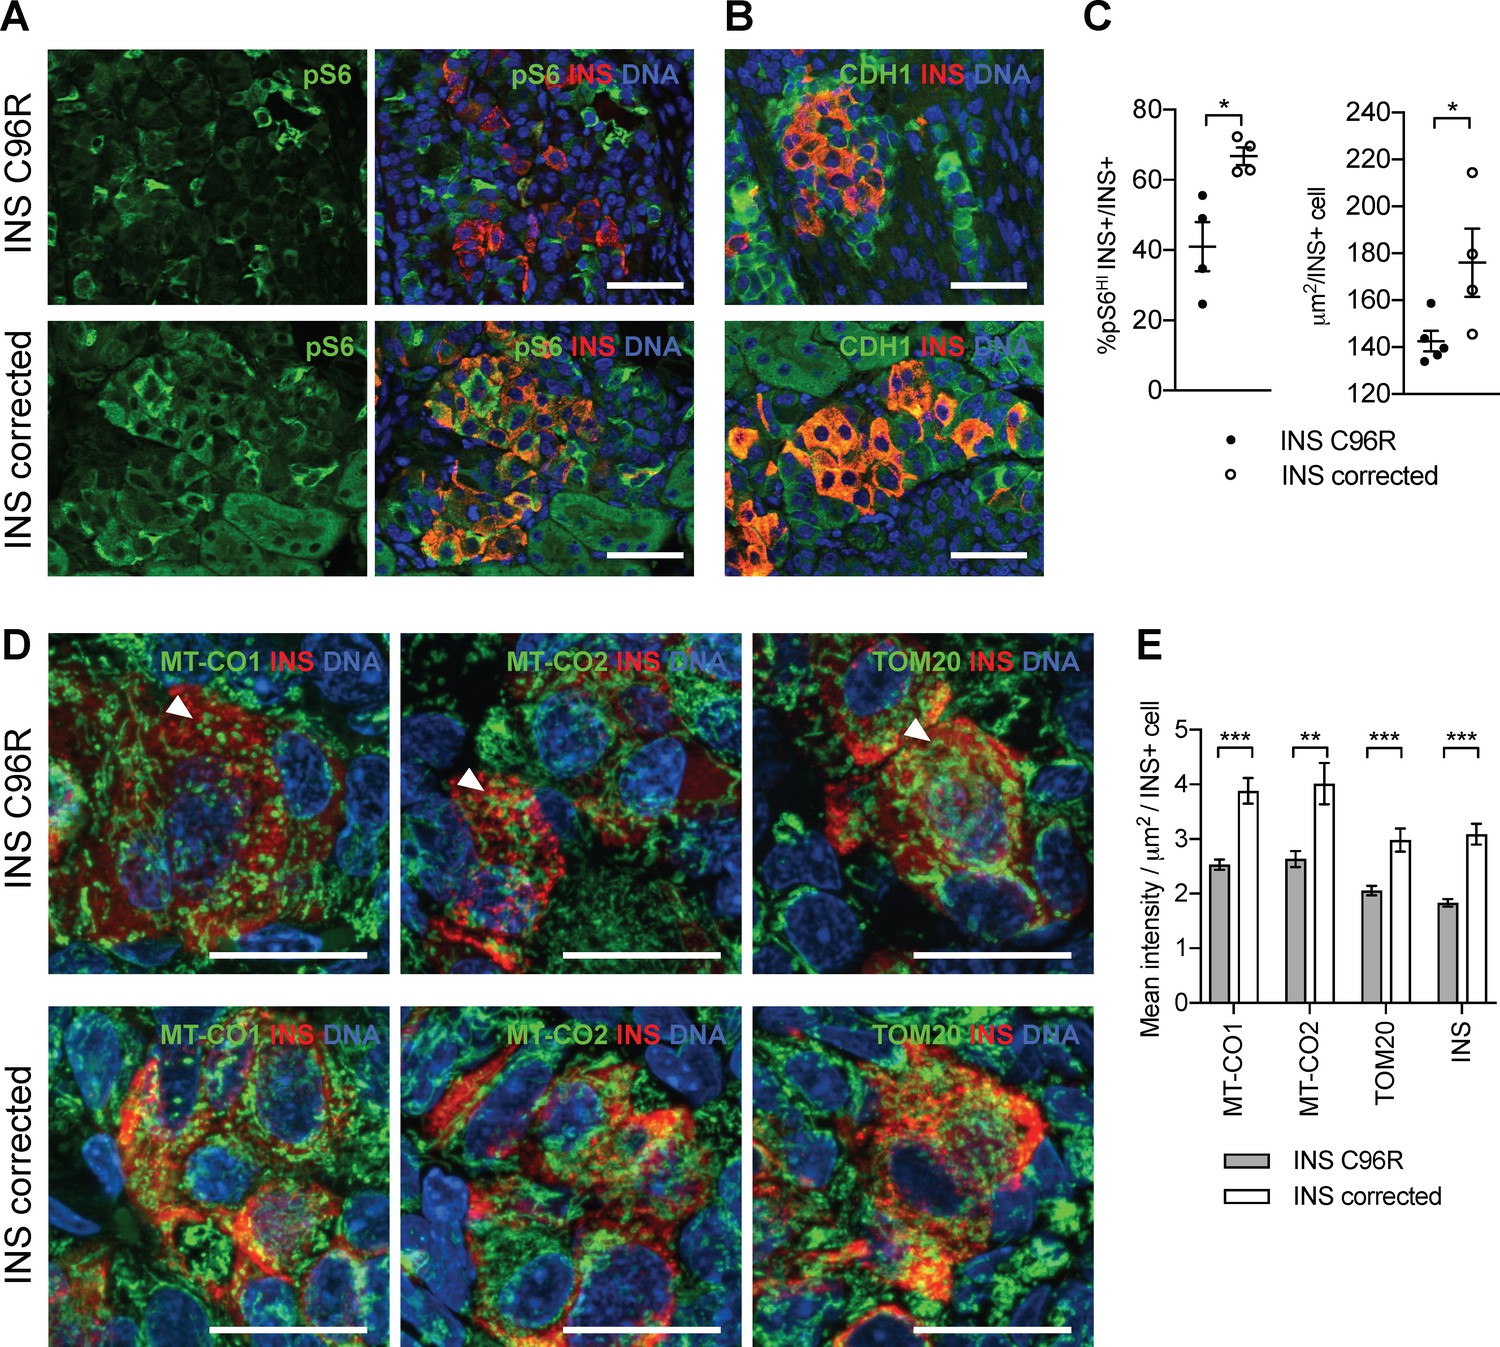
Transplanted INS mutant beta-like cells presented reduced mTORC1 signaling, reduced size and decreased mitochondrial respiratory chain subunits expression.
(A) Immunohistochemistry for the mTORC1 activity marker pS6 and INS in 3 months old grafts. (B) Immunohistochemistry for E-Cadherin (CDH1) and INS to quantify beta-cell size. Scale bars in (A) and (B) = 50 μm. (C) Quantification of (A) and (B) (n = 4–5 independent transplanted animals per genotype; Student’s t test). (D) Immunohistochemistry for mitochondrial proteins cytochrome oxidase subunit 1 (MT-CO1) and 2 (MT-CO2), transporter of the outer membrane 20 (TOM20) and INS in 3 months old grafts. Quantification of the mean fluorescence intensity of each immunostaining per individual INS+ cell (n > 100 individual INS+ cells per genotype, from 4 to 5 independent transplanted animals per genotype; Student’s t test). Scale bars = 20 μm. **p < 0.01, ***p < 0.001.
Tables
Key resources table
| Reagent type (species) or resource | Designation | Source or reference | Identifiers | Additional information |
|---|---|---|---|---|
| Cell line (Homo sapiens) Male | HEL71.4 | Biomedicum Stem Cell Center, University of Helsinki | ||
| Cell line (Homo sapiens) Male | HEL71.4 - corrected clones A2, F2, F10 and G6 | Biomedicum Stem Cell Center, University of Helsinki | ||
| Cell line (Homo sapiens) Female | HEL107.2 | Biomedicum Stem Cell Center, University of Helsinki | ||
| Recombinant DNA reagent | CAG-Cas9-T2A-EGFP-ires-puro | DOI: 10.1016/j.celrep.2017.03.055 | Addgene plasmid # 78311 | |
| Antibody | Rabbit anti-OCT4 | Santa Cruz Biotechnology Cat# sc-9081; RRID:AB_2167703 | ICC; (1:500) | |
| Antibody | Mouse anti-TRA1-60 | Thermo Fisher Scientific Cat# MA1-023; RRID:AB_2536699 | ICC; (1:50) | |
| Antibody | Rat anti-SSEA3 | Millipore Cat# MAB4303; RRID:AB_177628 | ICC; (1:70) | |
| Antibody | Rabbit anti-AFP | Dako Cat# A0008; RRID:AB_2650473 | ICC; (1:500) | |
| Antibody | Mouse anti-SMA | Sigma-Aldrich Cat# A2547; RRID:AB_476701 | ICC; (1:400) | |
| Antibody | Mouse anti-TUJ1 | R and D Systems Cat# MAB1195; RRID:AB_357520 | ICC; (1:500) | |
| Antibody | Goat anti-PDX1 | R and D Systems Cat# AF2419; RRID:AB_355257 | ICC, IHC; (1:200) | |
| Antibody | Mouse anti-NKX6.1 | DSHB Cat# F55A10; RRID:AB_532378 | ICC, IHC; (1:200) | |
| Antibody | Rabbit anti-SOX9 | Millipore Cat# AB5535; RRID:AB_2239761 | ICC; (1:500) | |
| Antibody | Sheep anti-NEUROG3 | R and D Systems Cat# AF3444; RRID:AB_2149527 | ICC; (1:500) | |
| Antibody | Guinea pig anti-INS | Dako Cat# A0564; RRID:AB_10013624 | ICC, IHC; (1:1000) | |
| Antibody | Rabbit anti-C-peptide | Cell Signaling Technology Cat# 4593S; RRID:AB_10691857 | IHC; (1:150) | |
| Antibody | Mouse anti-ProINS | DSHB Cat# GS-9A8; RRID:AB_532383 | IHC; (1:200) | |
| Antibody | Mouse anti-GCG | Sigma-Aldrich Cat# G2654; RRID:AB_259852 | IHC; (1:1000) | |
| Antibody | Rabbit anti-CHGA | Dako Cat# A0564 | IHC; (1:500) | |
| Antibody | Rabbit anti-SST | Dako Cat# A0566; RRID:AB_10013726 | IHC; (1:1000) | |
| Antibody | Goat anti-PPY | Sigma-Aldrich Cat# SAB2500747; RRID:AB_10611538 | IHC; (1:1000) | |
| Antibody | Goat anti-GHRL | Santa Cruz Biotechnology Cat# sc-10368; RRID:AB_2232479 | IHC; (1:300) | |
| Antibody | Rabbit anti-KI67 | Leica Microsystems Cat# NCL-Ki67p; RRID:AB_442102 | IHC; (1:500) | |
| Antibody | Mouse anti-PCNA | Thermo Fisher Scientific Cat# MA5-11358; RRID:AB_10982348 | IHC; (1:200) | |
| Antibody | Rabbit anti-BIP | Cell Signaling Technology Cat# 3177S; RRID:AB_2119845 | IHC; (1:250) | |
| Antibody | Rabbit anti-GRP170 | Abcam Cat# ab124884; RRID:AB_10973544 | IHC; (1:200) | |
| Antibody | Goat anti-MANF | Santa Cruz Biotechnology Cat# sc-34560; RRID:AB_670934 | IHC; (1:300) | |
| Antibody | Mouse anti-CDH1 (E-Cadherin) | BD Biosciences Cat# 610181; RRID:AB_397580 | IHC; (1:500) | |
| Antibody | Rabbit anti-pS6 | Cell Signaling Technology Cat# 4858; RRID:AB_916156 | IHC; (1:400) | |
| Antibody | Mouse anti-MT-CO1 | Abcam Cat# ab14705; RRID:AB_2084810 | IHC; (1:200) | |
| Antibody | Rabbit anti-MT-CO2 | Abcam Cat# ab79393; RRID:AB_1603751 | IHC; (1:100) | |
| Antibody | Rabbit anti-TOM20 | Santa Cruz Biotechnology Cat# sc-11415; RRID:AB_2207533 | IHC; (1:250) | |
| Antibody | Rabbit anti-Caspase3 | Cell Signaling Technology Cat# 9664; RRID:AB_2070042 | IHC; (1:250) | |
| Antibody | Mouse Anti-CD184 (CXCR4) Monoclonal Antibody, Phycoerythrin Conjugated, Clone 12G5 | BD Biosciences Cat# 555974; RRID:AB_396267 | FC; (1:1) | |
| Antibody | Mouse IgG2a, kappa Isotype Control, Phycoerythrin Conjugated, Clone G155-178 antibody | BD Biosciences Cat# 563023 | FC; (1:1) | |
| Antibody | Insulin (C27C9) Rabbit Antibody (Alexa Fluor 647 Conjugate) | Cell Signaling Technology Cat# 9008; RRID:AB_2687822 | FC; (1:80) | |
| Antibody | Rabbit IgG Isotype Control (Alexa Fluor 647 Conjugate) antibody | Cell Signaling Technology Cat# 3452S; RRID:AB_10695811 | FC; (1:40) | |
| Antibody | Mouse Anti-NKX6.1 Phycoerythrin Conjugated | BD Biosciences Cat# 555574 | FC; (1:40) | |
| Antibody | Mouse IgG1, kappa Isotype Control, Phycoerythrin Conjugated, Clone MOPC-21 antibody | BD Biosciences Cat# 555749; RRID:AB_396091 | FC; (1:40) | |
| Antibody | Mouse Anti-NKX6-1 Alexa Fluor 647 Conjugated | BD Biosciences Cat# 563338 | FC; (1:40) | |
| Antibody | Mouse IgG1 kappa isotype control Alexa 647 Conjugated | BD Biosciences Cat# 557714; RRID:AB_396823 | FC; (1:40) | |
| Antibody | Mouse Anti-PDX1 Phycoerythrin Conjugated | BD Biosciences Cat# 562161; RRID:AB_10893589 | FC; (1:40) | |
| Antibody | Donkey anti-Rabbit IgG (H + L) Highly Cross-Adsorbed Secondary Antibody, Alexa Fluor 350 | Thermo Fisher Scientific Cat# A10039; RRID:AB_2534015 | IHC; (1:500) | |
| Antibody | Donkey anti-Mouse IgG (H + L) Highly Cross-Adsorbed Secondary Antibody, Alexa Fluor 350 | Thermo Fisher Scientific Cat# A10035; RRID:AB_2534011 | IHC; (1:500) | |
| Antibody | Donkey anti-Rabbit IgG (H + L) Highly Cross-Adsorbed Secondary Antibody, Alexa Fluor 488 | Thermo Fisher Scientific Cat# A-21206; RRID:AB_2535792 | ICC, IHC; (1:500) | |
| Antibody | Donkey anti-Mouse IgG (H + L) Highly Cross-Adsorbed Secondary Antibody, Alexa Fluor 488 | Thermo Fisher Scientific Cat# A-21202; RRID:AB_141607 | ICC, IHC; (1:500) | |
| Antibody | Goat anti-Guinea Pig IgG (H + L) Highly Cross-Adsorbed Secondary Antibody, Alexa Fluor 594 | Thermo Fisher Scientific Cat# A-11076; RRID:AB_2534120 | ICC, IHC; (1:500) | |
| Antibody | Donkey anti-Sheep IgG (H + L) Cross-Adsorbed Secondary Antibody, Alexa Fluor 594 | Thermo Fisher Scientific Cat# A-11016; RRID:AB_2534083 | ICC, IHC; (1:500) | |
| Antibody | Donkey anti-Goat IgG (H + L) Cross-Adsorbed Secondary Antibody, Alexa Fluor 594 | Thermo Fisher Scientific Cat# A-11058; RRID:AB_2534105 | ICC, IHC; (1:500) | |
| Antibody | Donkey anti-Goat IgG (H + L) Cross-Adsorbed Secondary Antibody, Alexa Fluor 488 | Thermo Fisher Scientific Cat# A-11055; RRID:AB_2534102 | ICC, IHC; (1:500) | |
| Antibody | Donkey anti-Mouse IgG (H + L) Highly Cross-Adsorbed Secondary Antibody, Alexa Fluor 594 | Thermo Fisher Scientific Cat# A-21203; RRID:AB_2535789 | ICC, IHC; (1:500) | |
| Antibody | Donkey anti-Rabbit IgG (H + L) Highly Cross-Adsorbed Secondary Antibody, Alexa Fluor 594 | Thermo Fisher Scientific Cat# A-21207; RRID:AB_141637 | ICC, IHC; (1:500) | |
| Antibody | Goat anti-Rat IgM Heavy Chain Cross-Adsorbed Secondary Antibody, Alexa Fluor 488 | Thermo Fisher Scientific Cat# A-21212; RRID:AB_2535798 | ICC, IHC; (1:500) | |
| Antibody | Donkey anti-Mouse IgG (H + L) Highly Cross-Adsorbed Secondary Antibody, Alexa Fluor 594 | Thermo Fisher Scientific Cat# A-21203; RRID:AB_2535789 | ICC, IHC; (1:500) | |
| Antibody | Donkey anti-Goat IgG (H + L) Cross-Adsorbed Secondary Antibody, Alexa Fluor 594 | Thermo Fisher Scientific Cat# A-11058; RRID:AB_2534105 | ICC, IHC; (1:500) | |
| Sequence-based reagent | CYCLOG qRT-PCR primer pair | NM_004792 | Fw: TCTTGTCAATGGCCAACAGAG; Rv: GCCCATCTAAATGAGGAGTTG;84 bp | |
| Sequence-based reagent | PDX1 qRT-PCR primer pair | NM_004792 | Fw: TCTTGTCAATGGCCAACAGAG; Rv: GCCCATCTAAATGAGGAGTTG; 84 bp | |
| Sequence-based reagent | NKX6.1 qRT-PCR primer pair | NM_000209.3 | Fw: AAGTCTACCAAAGCTCACGCG; Rv: CGTAGGCGCCGCCTGC; 52 bp | |
| Sequence-based reagent | CHGA qRT-PCR primer pair | NM_001275.3 | Fw: AACCGCAGACCAGAGGACCA; Rv: GTCTCAGCCCCGCCGTAGT;102 bp | |
| Sequence-based reagent | INS qRT-PCR primer pair | NM_020999 | Fw: GACGACGCGAAGCTCACCAA; Rv: TACAAGCTGTGGTCCGCTAT; 98 bp | |
| Sequence-based reagent | BIP (HSPA5) qRT-PCR primer pair | NM_005347.4 | Fw: TGGCTGGAAAGCCACCAAGATGCT; Rv: GGGGGAGGGCCTGCACTTCCAT; 116 bp | |
| Sequence-based reagent | sXBP1 qRT-PCR primer pair | NM_001079539.1 | Fw: CTGCTGAGTCCGCAGCAGGTGCA; Rv: GGTCCAAGTTGTCCAGAATGC; 129 bp | |
| Sequence-based reagent | CHOP (DDIT3) qRT-PCR primer pair | NM_001195053.1 | Fw: GCACCTCCCAGAGCCCTCACTC; Rv: CCCGGGCTGGGGAATGACCA;120 bp | |
| Sequence-based reagent | ATF3 qRT-PCR primer pair | NM_001206488.2 | Fw: AGAAAGAGTCGGAGAAGC; Rv: TGAAGGTTGAGCATGTATATC; 103 bp | |
| Sequence-based reagent | ATF4 qRT-PCR primer pair | NM_001675.2 | Fw: AAGGCGGGCTCCTCCGAATGG; Rv: CAATCTGTCCCGGAGAAGGCATCC;89 bp | |
| Sequence-based reagent | ATF6 qRT-PCR primer pair | NM_001675.2 | Fw: ACCTGCTGTTACCAGCTACCACCCA; Rv: GCATCATCACTTCGTAGTCCTGCCC;120 bp | |
| Sequence-based reagent | MANF qRT-PCR primer pair | NM_006010.4 | Fw: GGCGACTGCGAAGTTTGTAT; Rv: TTGCTTCCCGGCAGAACTTT; 121 bp | |
| Sequence-based reagent | GRP170 (HYOU1) qRT-PCR primer pair | NM_001130991.2 | Fw: GTCCAAGGGCATCAAGGCTC; Rv: TTCTGCGCTGTCCTCTACCA; 103 bp |
Additional files
-
Supplementary file 1
Table 1: Predicted Ins8 gRNA off-target sites assessed for mutations by Sanger sequencing. Table 2: Single-cell RNA-seq analysis cluster marker genes. Table 3: Differentially expressed genes in beta-like cluster between INS C96R vs INS corrected cells. Table 4: Differentially expressed genes in progenitor cluster between INS C96R vs INS corrected cells.Table 5: Gene Set Enrichment Analysis of INS C96R vs INS corrected cells. Table 6: Gene Ontology Analysis of INS C96R vs INS corrected cells. Table 7: Differentially expressed genes between pseudotime analysis progenitor branches. Table 8: Differentially expressed genes along pseudotime between INS C96R vs INS corrected cells. Table 9: Single-cell RNA-seq reads and quality control statistics.
- https://doi.org/10.7554/eLife.38519.023
-
Source code 1
Python and R scripts used in the analysis of the single-cell data in this manuscript.
- https://doi.org/10.7554/eLife.38519.024
-
Transparent reporting form
- https://doi.org/10.7554/eLife.38519.025
Download links
A two-part list of links to download the article, or parts of the article, in various formats.
Downloads (link to download the article as PDF)
Open citations (links to open the citations from this article in various online reference manager services)
Cite this article (links to download the citations from this article in formats compatible with various reference manager tools)
Insulin mutations impair beta-cell development in a patient-derived iPSC model of neonatal diabetes
eLife 7:e38519.
https://doi.org/10.7554/eLife.38519


