Ligand discrimination and gating in cyclic nucleotide-gated ion channels from apo and partial agonist-bound cryo-EM structures
- Weill Cornell Medical College, United States
Figures
Figure 1 with 6 supplements

Cryo-EM structures of SthK.
(A) Apo SthK side-view density map, colored by subunit. Dashed lines indicate the bilayer boundaries. The top is the extracellular side. Insets on the left are extracellular (top) and intracelluar (bottom) views. TMD-transmembrane domain, CNBD-cyclic nucleotide binding domain. (B) Atomic model of apo SthK colored as in (A). Insets on the right are extracelluar (top), and intracellular (bottom) views. (C) cAMP-bound SthK density map (grey) with bound cAMP highlighted in purple. (D) cGMP-bound SthK density map (grey) with bound cGMP highlighted in cyan. (E) Representative single-channel recording traces from SthK in horizontal lipid bilayers at +100 mV with 100 µM cAMP (top trace), 7 mM cGMP (middle), and no ligand (bottom). The zero-current level (closed channel) is indicated to the right by the letter C.
Figure 1—figure supplement 1
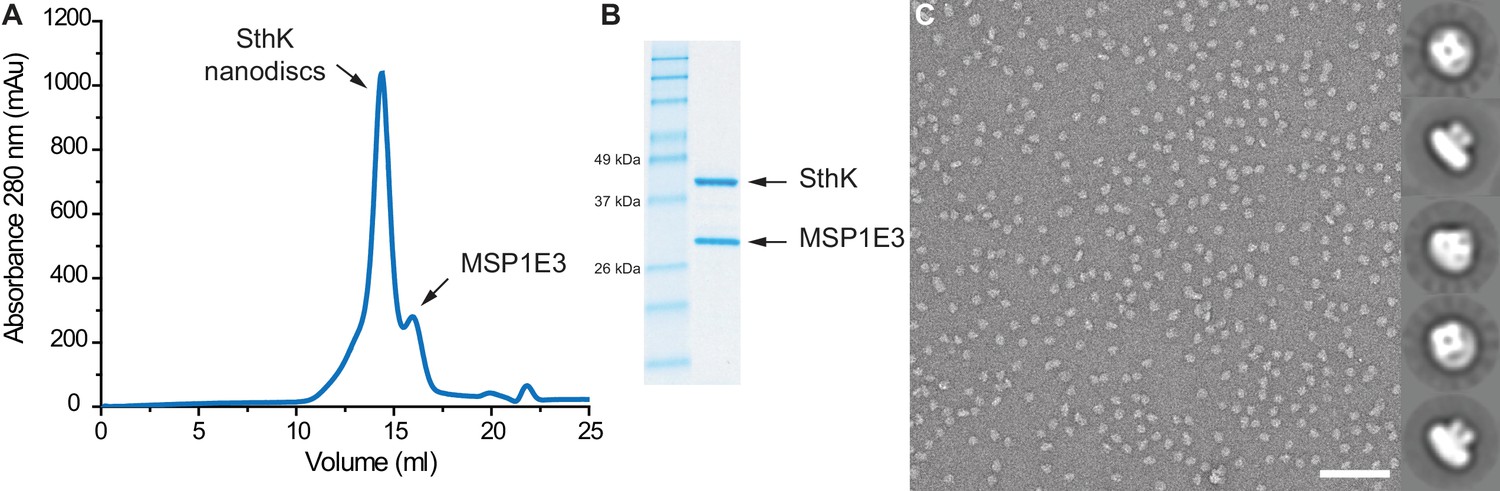
Purification of SthK in lipid nanodiscs.
(A) Size exclusion chromatography profile of SthK in lipid nanodiscs. (B) SDS-PAGE of SthK lipid nanodiscs showing both components (SthK monomer and MSP1E3). (C) Representative negative stain image with selected 2D classes (right) depicting the tetrameric nature of the channel in lipid nanodiscs. Scale bar is 100 nm and the box size is 330 Å.
Figure 1—figure supplement 2
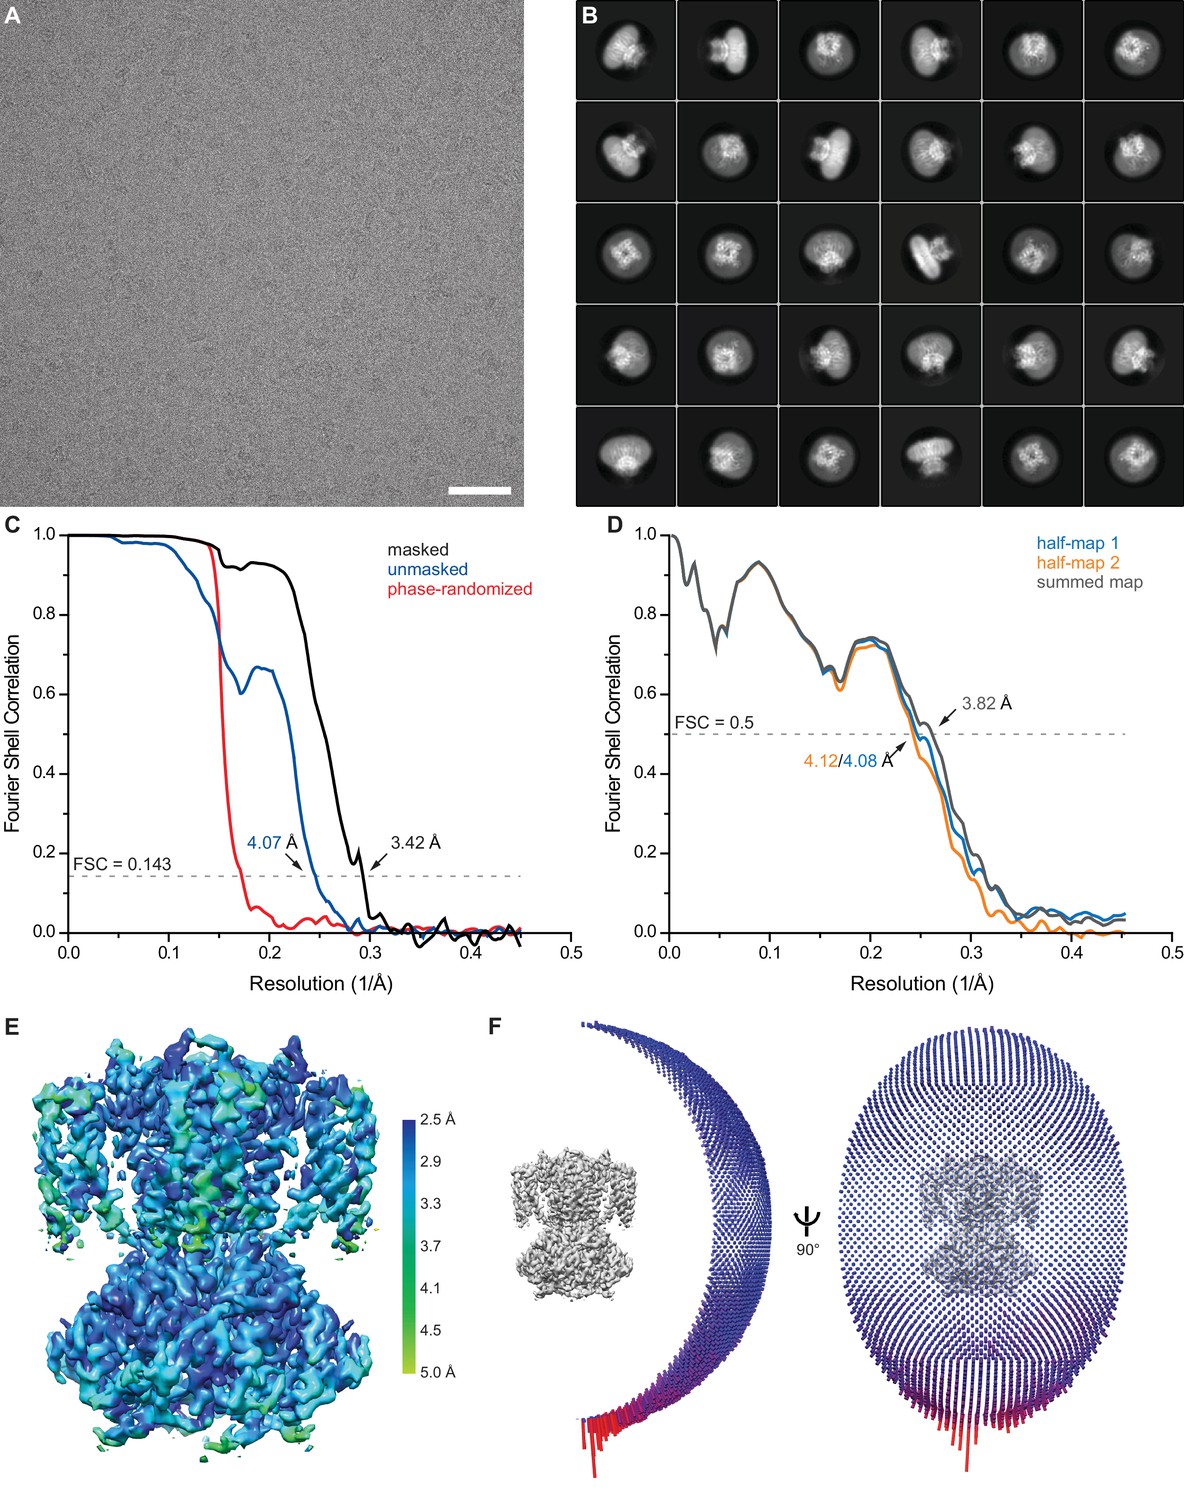
Single particle cryo-EM of apo SthK.
(A) Representative motion-corrected and dose-weighted micrograph of apo SthK in nanodiscs. (B) Selected 2D class averages. (C) Fourier shell correlation (FSC) curves between two independently refined half maps before (blue) and after (black) masking. Phase randomization was used to avoid effects from masking (red). (D) FSC curve from cross validation between the atomic model refined against half map 1 and half map 1 (blue), half map 2 (orange), and the summed map (grey). (E) Final map after Relion post-processing colored according to local resolution estimation using blocres. (F) Angular distribution of particles contributing to the final reconstitution. Scale bar is 50 nm and the box size is 281 Å.
Figure 1—figure supplement 3
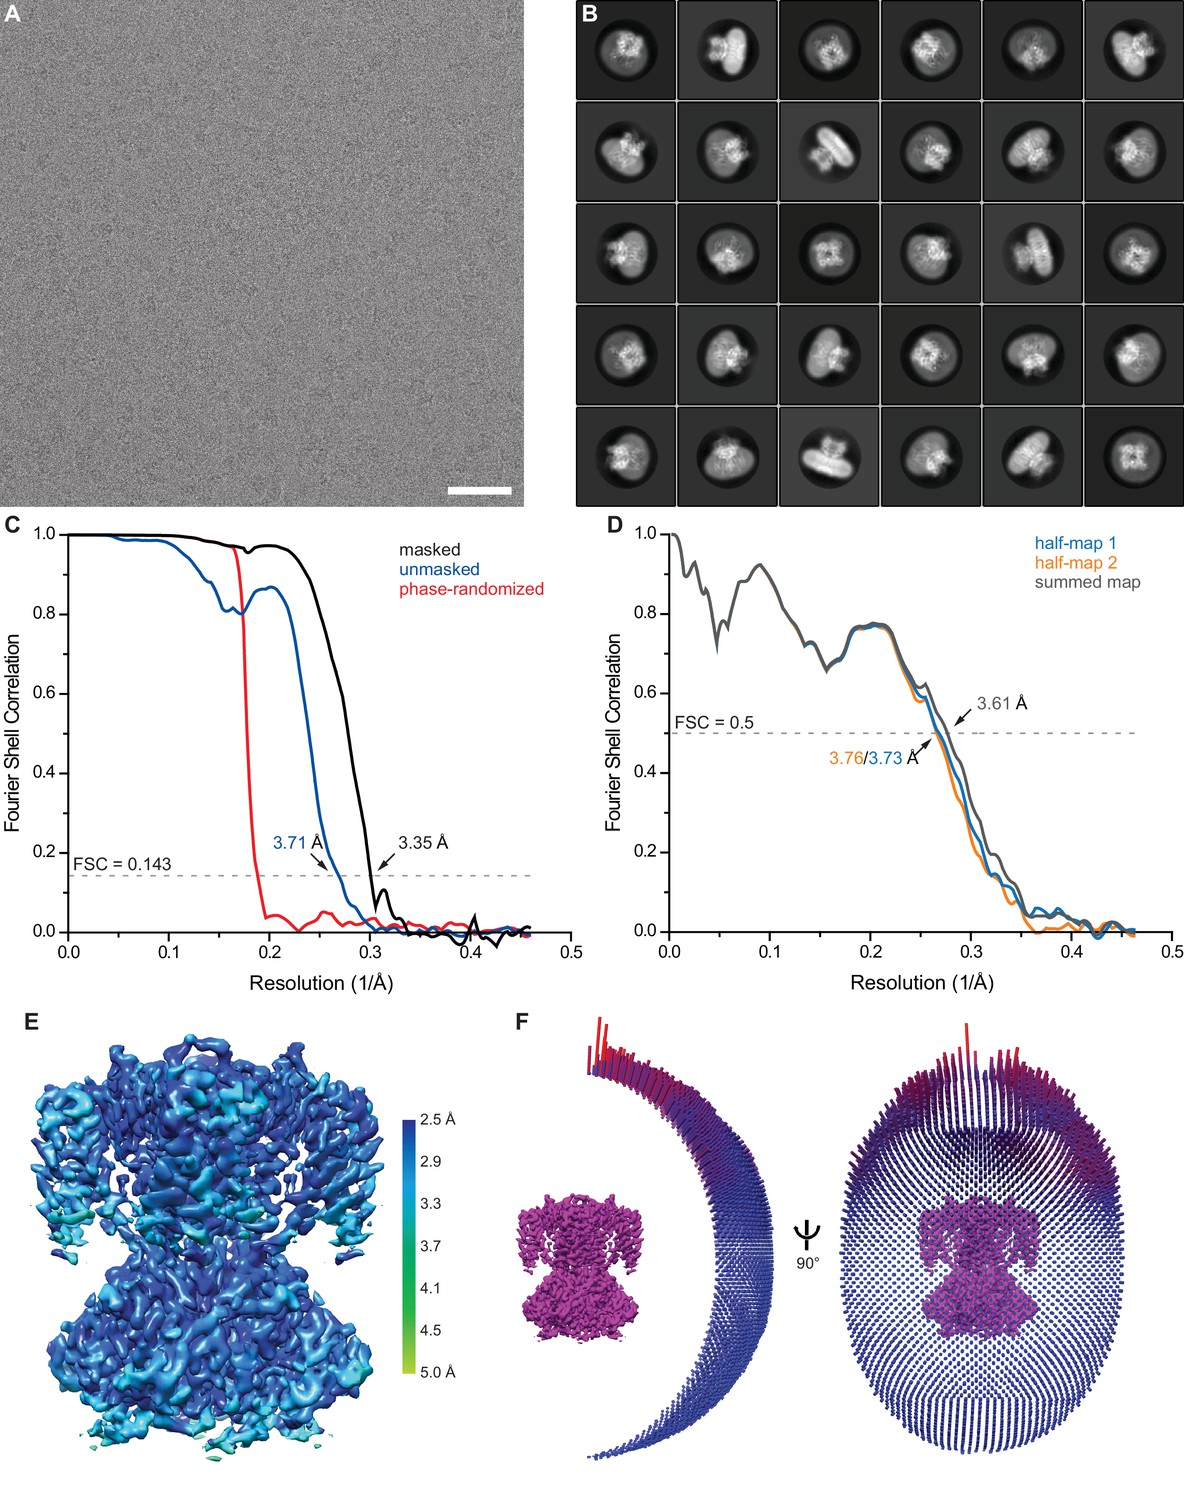
Single particle cryo-EM of SthK in the precence of 2 mM cAMP.
(A) Representative motion-corrected and dose-weighted micrograph of cAMP SthK in nanodiscs. (B) Selected 2D class averages. (C) Fourier shell correlation (FSC) curves between two independently refined half maps before (blue) and after (black) masking. Phase randomization was used to avoid effects from masking (red). (D) FSC curve from cross validation between the atomic model refined against half map 1 and half map 1 (blue), half map 2 (orange), and the summed map (grey). (E) Final map after Relion post-processing colored according to local resolution estimation using blocres. (F) Angular distribution of particles contributing to the final reconstitution. Scale bar is 50 nm and the box size is 275 Å.
Figure 1—figure supplement 4
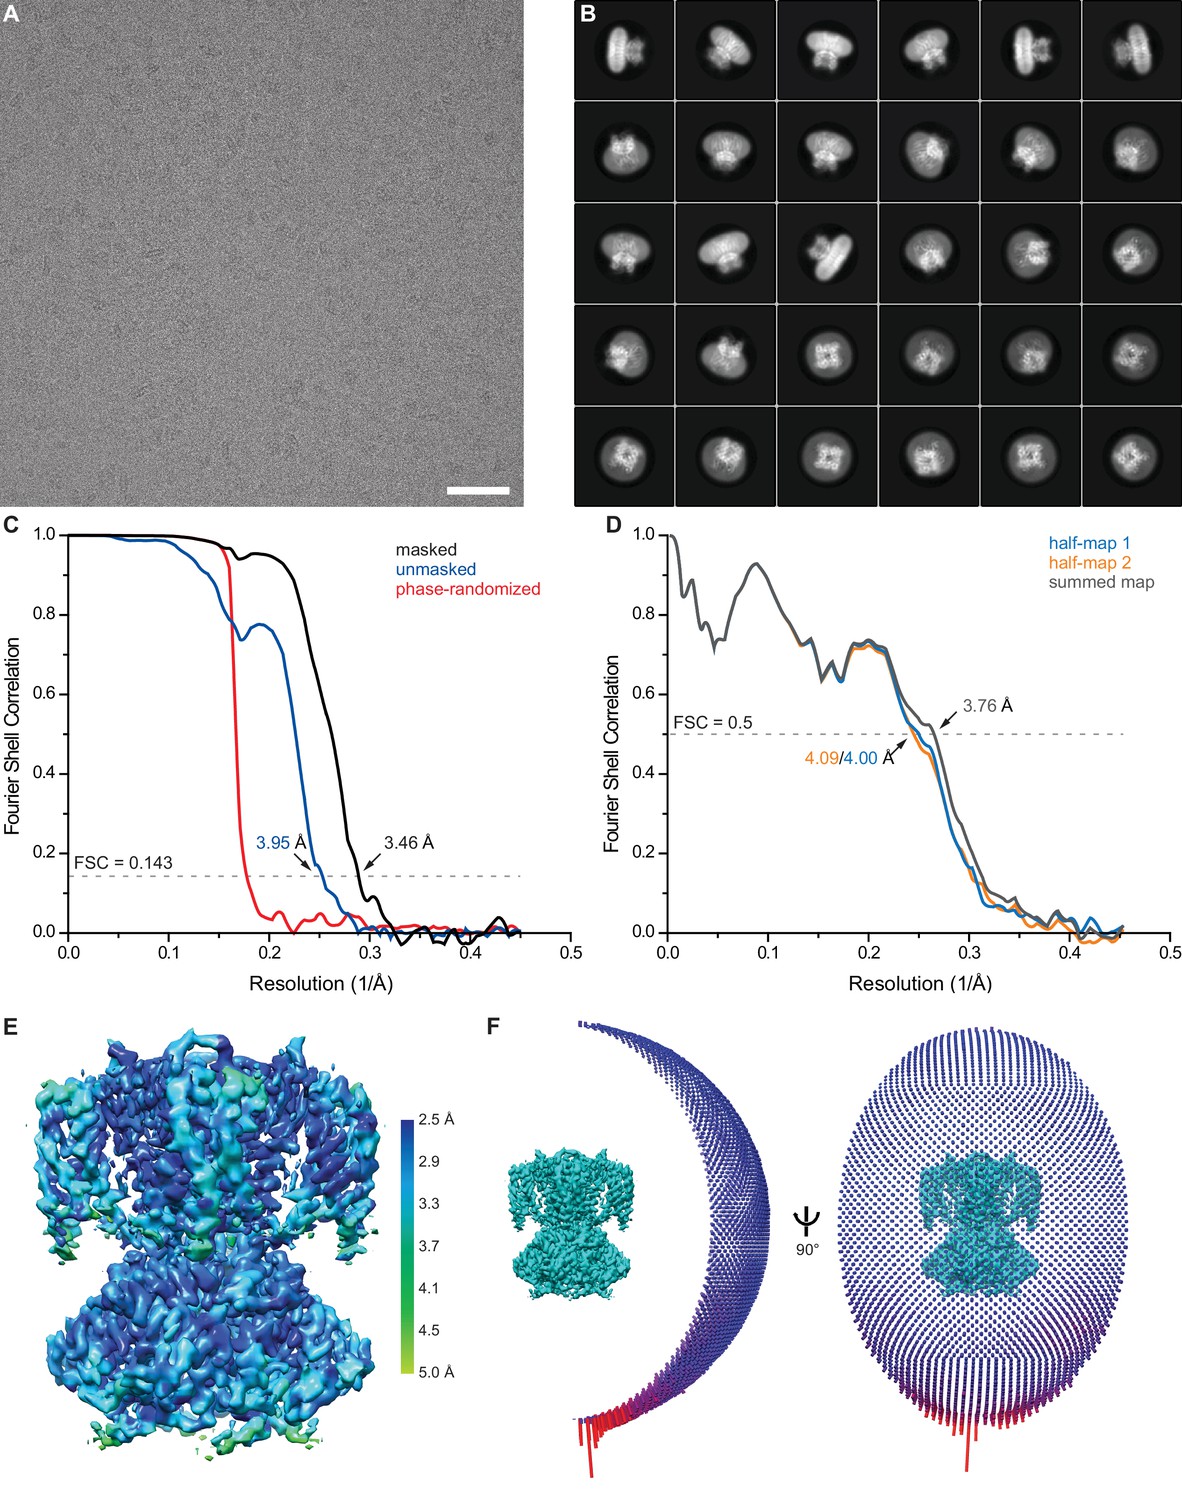
Single particle cryo-EM of SthK in the precence of 7 mM cGMP.
(A) Representative motion-corrected and dose-weighted micrograph of cGMP SthK in nanodiscs. (B) Selected 2D class averages. (C) Fourier shell correlation (FSC) curves between two independently refined half maps before (blue) and after (black) masking. Phase randomization was used to avoid effects from masking (red). (D) FSC curve from cross validation between the atomic model refined against half map 1 and half map 1 (blue), half map 2 (orange), and the summed map (grey). (E) Final map after Relion post-processing colored according to local resolution estimation using blocres. (F) Angular distribution of particles contributing to the final reconstitution. Scale bar is 50 nm and the box size is 281 Å.
Figure 1—figure supplement 5
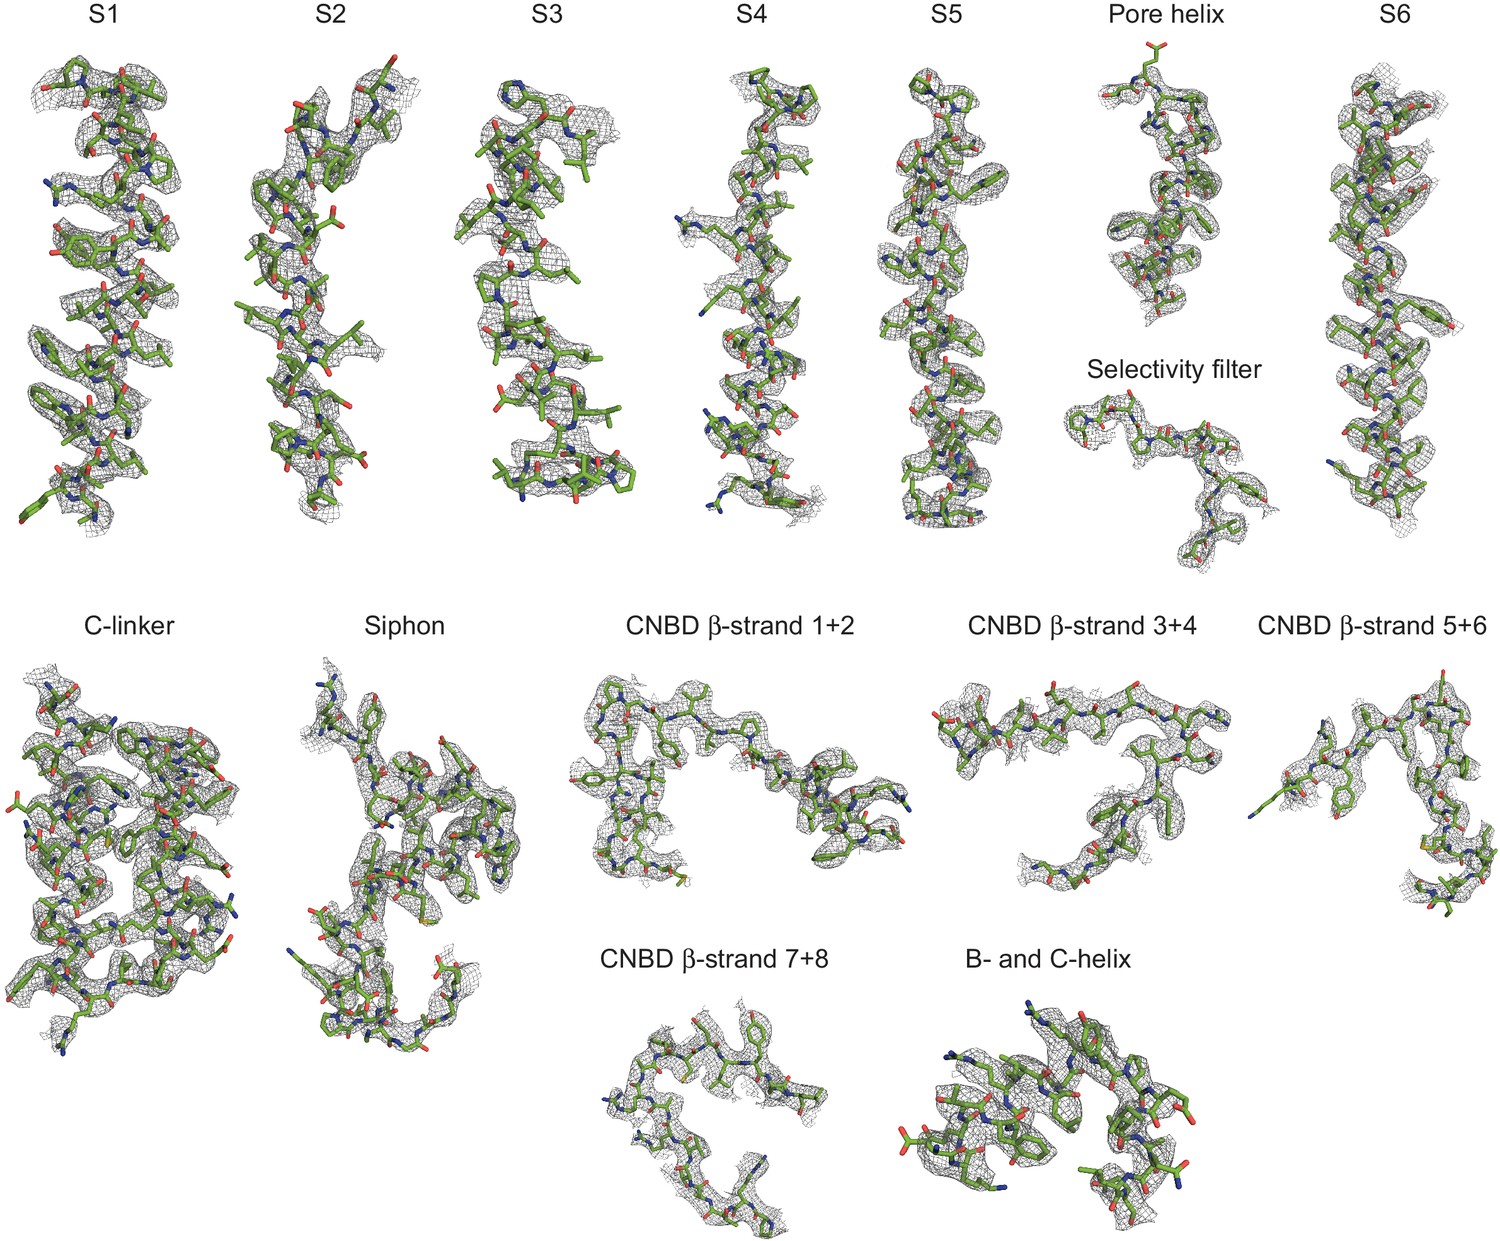
Segmented density map of SthK-cAMP.
Density map (grey mesh) determined from cAMP SthK shown together with the final atomic model (green). Densities shown are at a contour level of 5.5 σ.
Figure 1—figure supplement 6
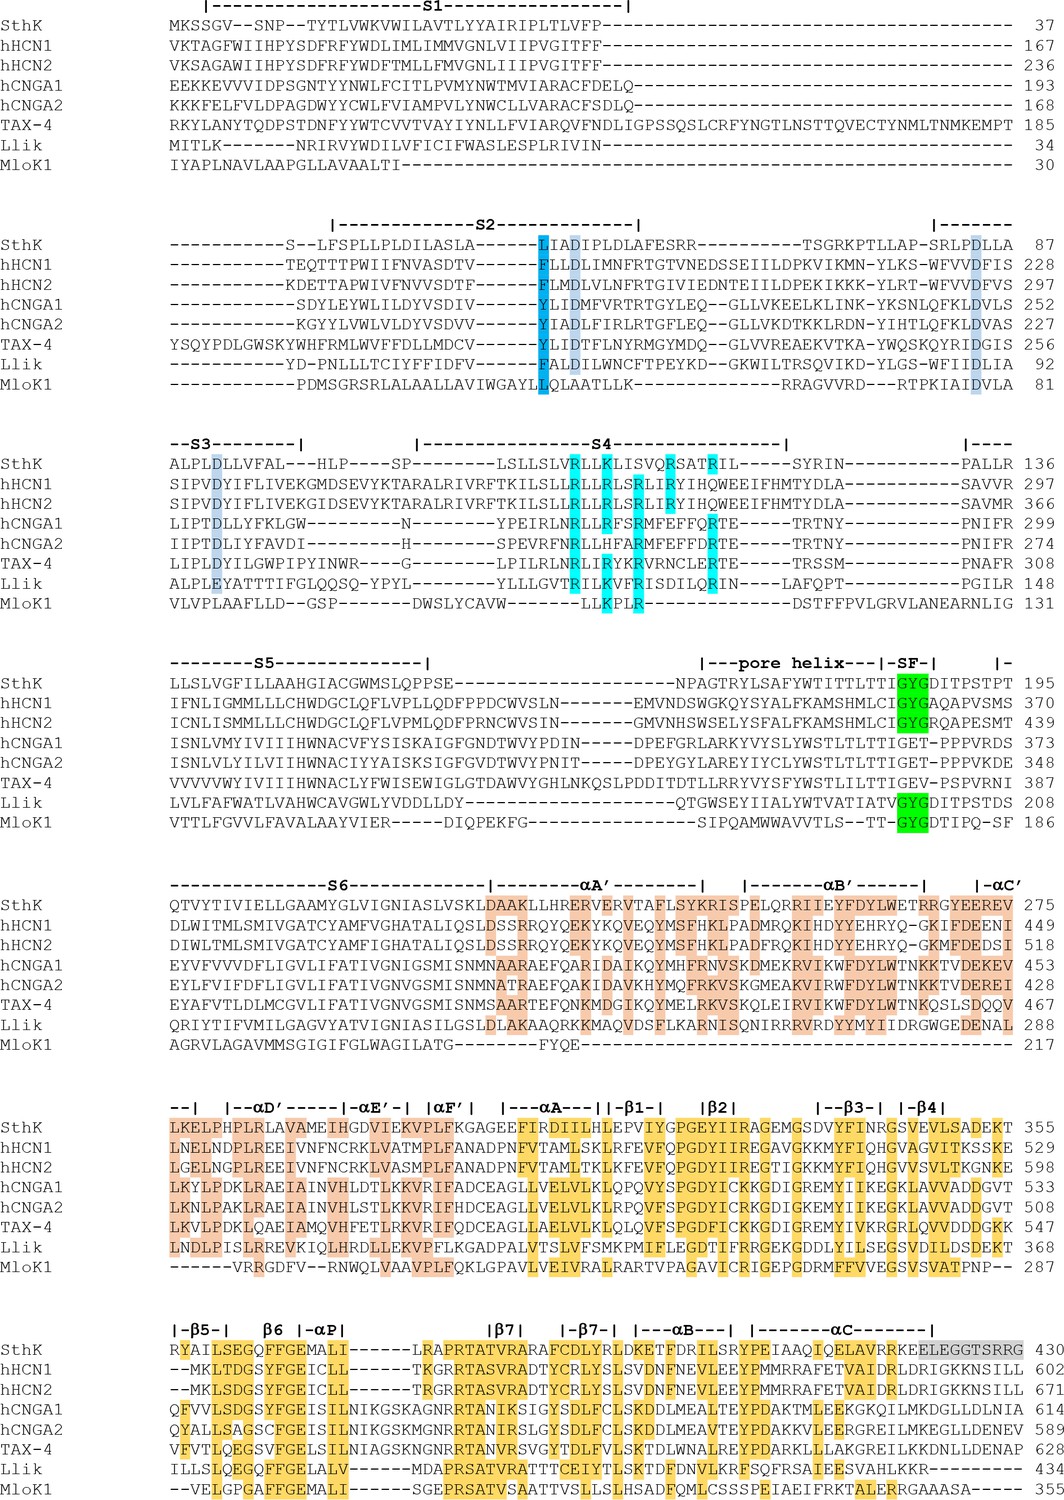
Sequence alignment of members from the cyclic nucleotide modulated channel family.
SthK (UniProtKB – G0GA88), human HCN1 (O60741), human HCN2 (Q9UL51), human CNGA1(P29973), human CNGA2(Q16280), TAX-4(Q03611), LliK(I0XVQ9), MloK1(Q98GN8). Secondary structure details labeled on top. Green: GYG signature sequence of potassium channel selectivity filter, cyan: charged residues in S4, light blue: counter charges, navy blue: charge transfer center, orange and yellow: conserved residues in C-linker and CNBD, respectively, grey: sequence not present and replaced by LESSGLVPRGSVKHHHH.
Figure 2
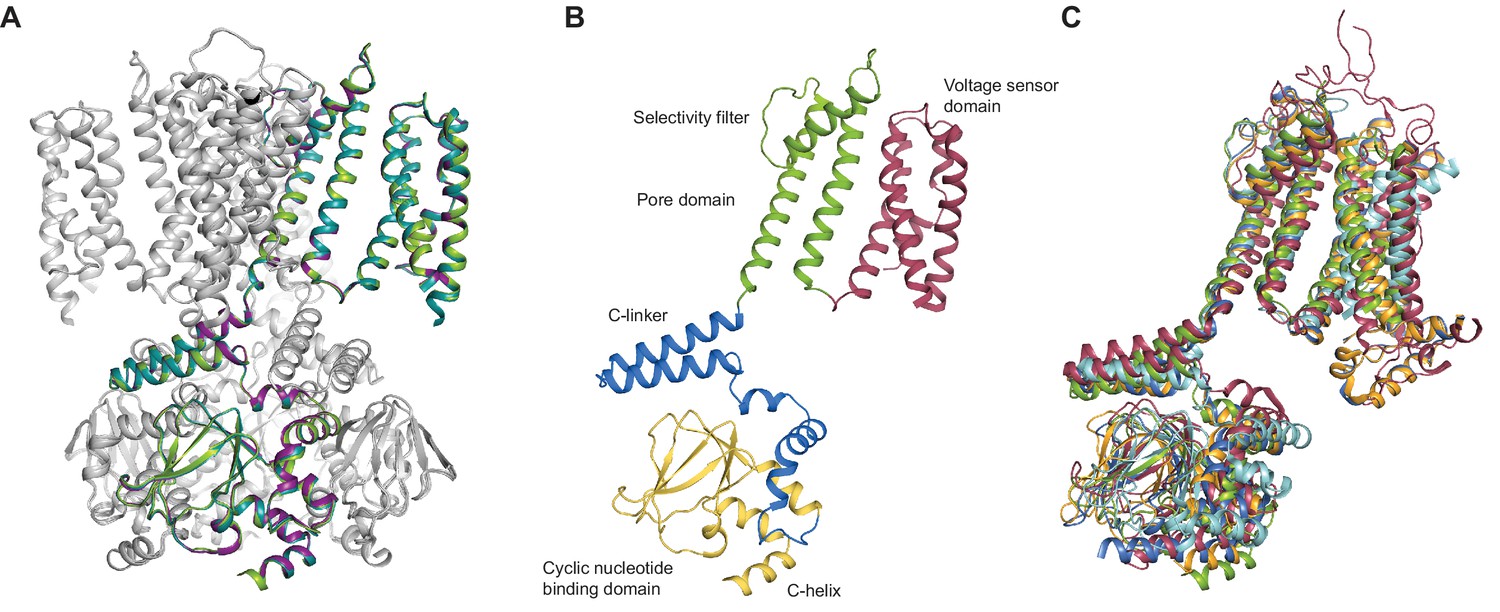
SthK channel domain architecture and structure overlays.
(A) Overlay between the cryo-EM structures of apo (green), cAMP-bound (magenta), and cGMP-bound (cyan) SthK in cartoon representation, which shows that the three structures are nearly identical. Only one of the subunits in the tetramer is colored, the other three are in grey. (B) Atomic model of a single SthK subunit in cartoon representation. Red: voltage sensor, green: pore, blue: C-linker, yellow: CNBD. (C) Overlay between apo SthK (green), cAMP HCN1 (blue), apo HCN1 (orange), TAX-4 (red), and LliK (cyan) shows similarities in domain architecture of cyclic nucleotide-modulated ion channels. PDB codes: apo SthKEM (6CJQ), cAMP SthKEM (6CJU), cGMP SthKEM (6CJT), apo HCN1 (5U6O), cAMP HCN1 (5U6P), TAX-4 (5H3O), LliK (5V4S).
Figure 3
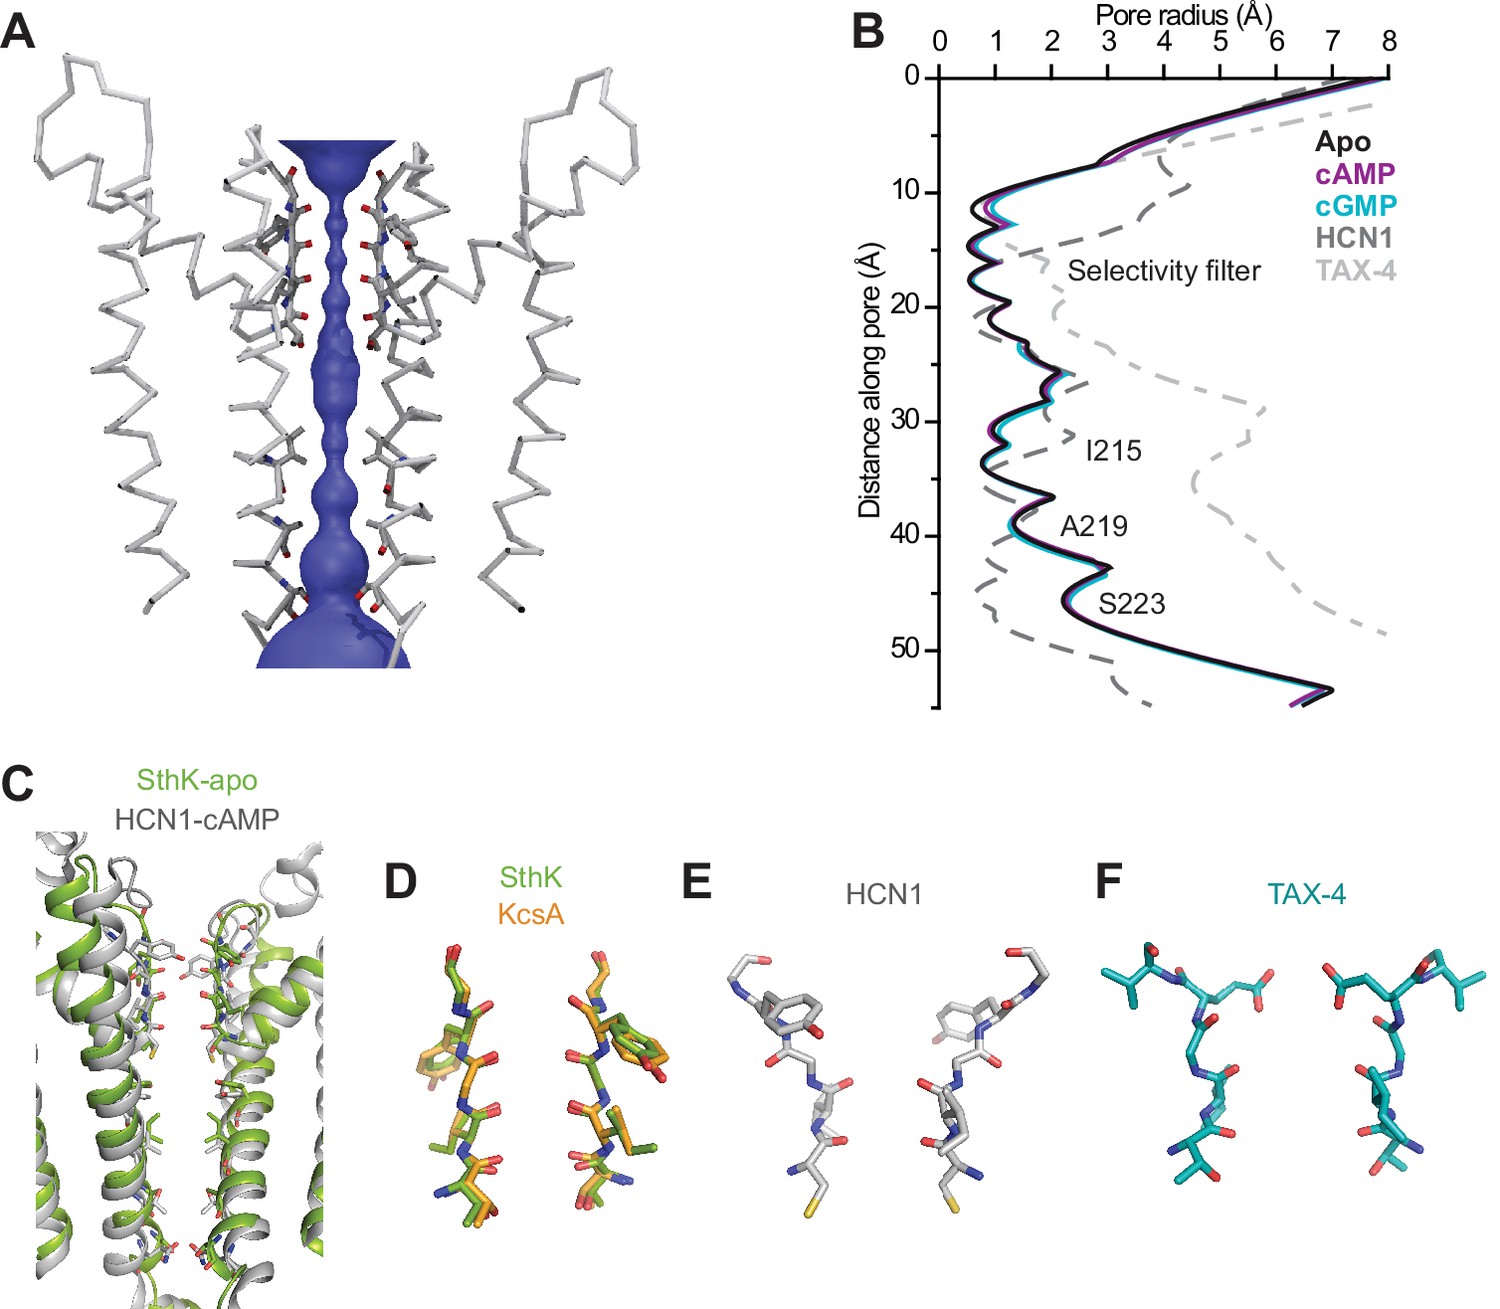
SthK channel pore and selectivity filter.
(A) SthK pore domain with selectivity filter carbonyls highlighted in red. Only two opposing subunits are shown to highlight the size of the water-filled pore, purple. (B) Pore radius as a function of the distance along the pore calculated with the program HOLE for all three SthK structures and compared to those for HCN1 and TAX-4. Lines colors and types as indicated in the figure. (C) Overlay of SthK (green) and HCN1 (grey) pore region. Side chains facing towards the pore axis are displayed as sticks. Selectivity filter of SthK-KcsA overlay (D), HCN1 (E) and TAX-4 (F) in stick representations.
Figure 4 with 2 supplements
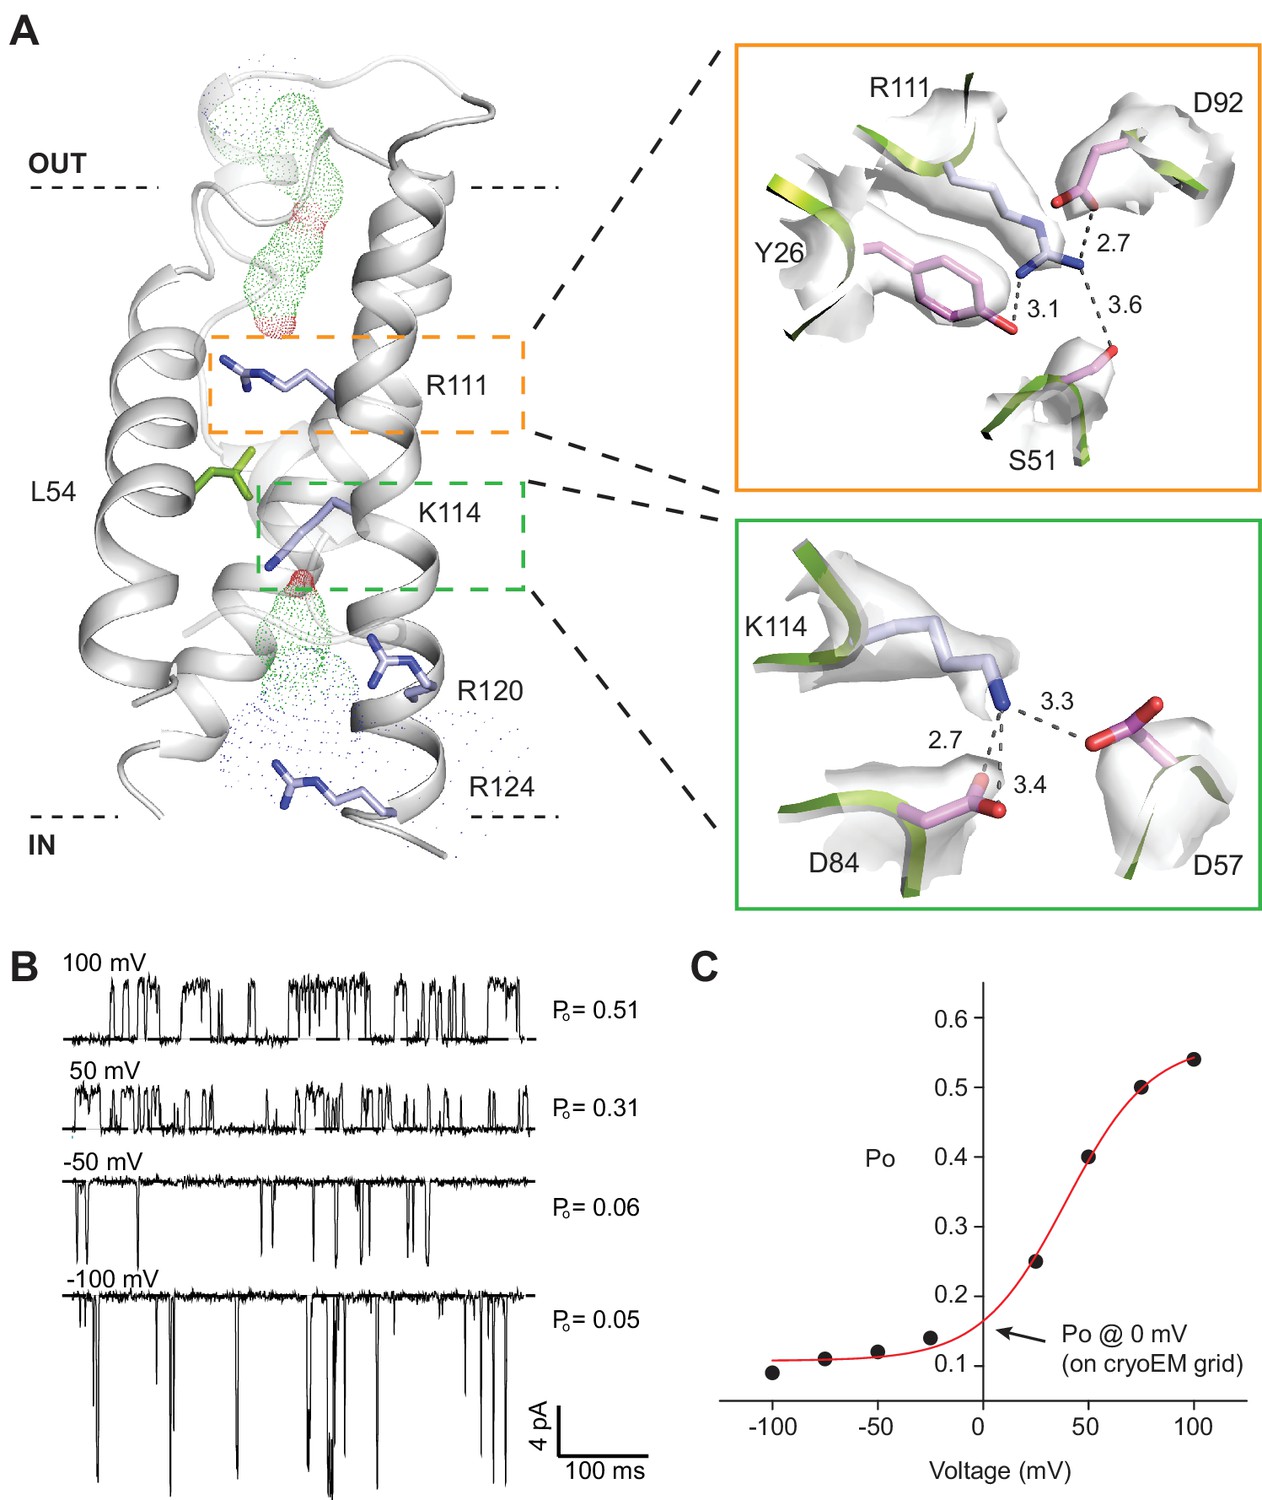
SthK channel voltage dependence.
(A) SthK voltage sensor domain (grey) with the 4 positively-charged residues in S4 in blue and L54 in S2 in green. The boxes zoom into the coordination between R111 and countercharges in S3 and S2 (orange) and between K114 and countercharges in S3 and S2 (green). Experimental density shown in light grey at 6 σ (top) and 4 σ (bottom). Dot representation displays water accessible cavities in the voltage sensor calculated with the program HOLE (red: pore radius <1.15 Å; green: pore radius 1.15–2.30 Å; blue: pore radius >2.30 Å). (B) Representative single-channel recording traces from SthK at different voltages (indicated, top of traces) displaying different open probabilities (indicated, right). The dashed line indicates the closed channel level. The traces were filtered online at 1 kHz and additionally filtered offline at 500 Hz. The ligand concentration was 1 mM cAMP. (C) Open probability as a function of voltage for the SthK channel for which selected traces are displayed in (B). Arrow indicates the open probability value at 0 mV, which is the voltage the channels experience on the cryo-EM grid. This experiment was performed for at least 7 different bilayers containing single SthK channels in saturating cAMP concentrations, and a plot showing an average Po vs. voltage curve is shown in ref. Schmidpeter et al. (2018).
Figure 4—figure supplement 1
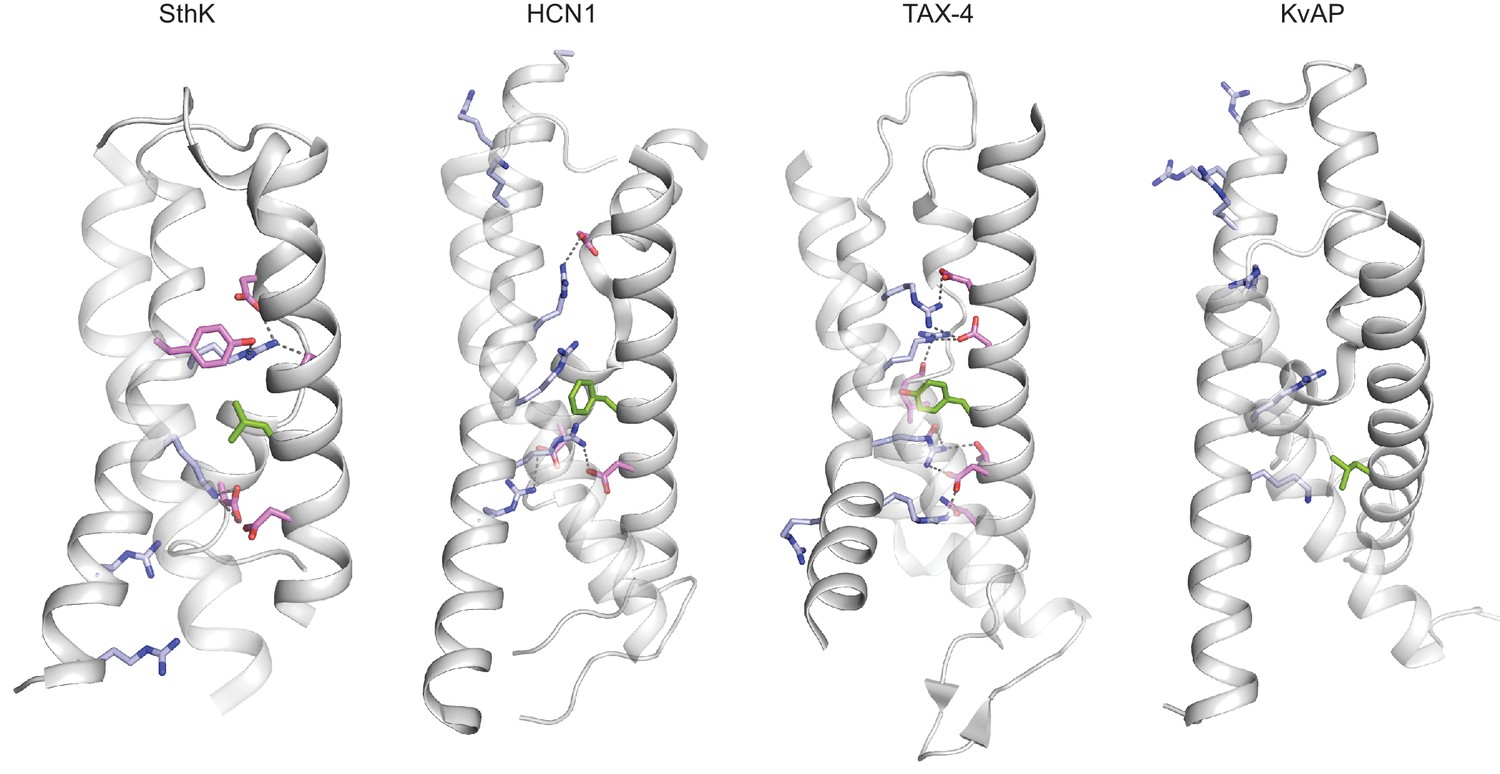
Voltage sensor domains in SthK and related channels.
Voltage sensor domains of SthK, HCN1, TAX-4 and KvAP (left to right) highlighting distribution of the charged residues (light blue) along S4 and selected countercharges (pink) in S2 and S3, and the charge transfer center (green) in S2. The protein is grey. PDB codes: apo SthK (6CJQ), cAMP HCN1 (5U6P), TAX-4 (5H3O), KvAP (1ORS).
Figure 4—figure supplement 2
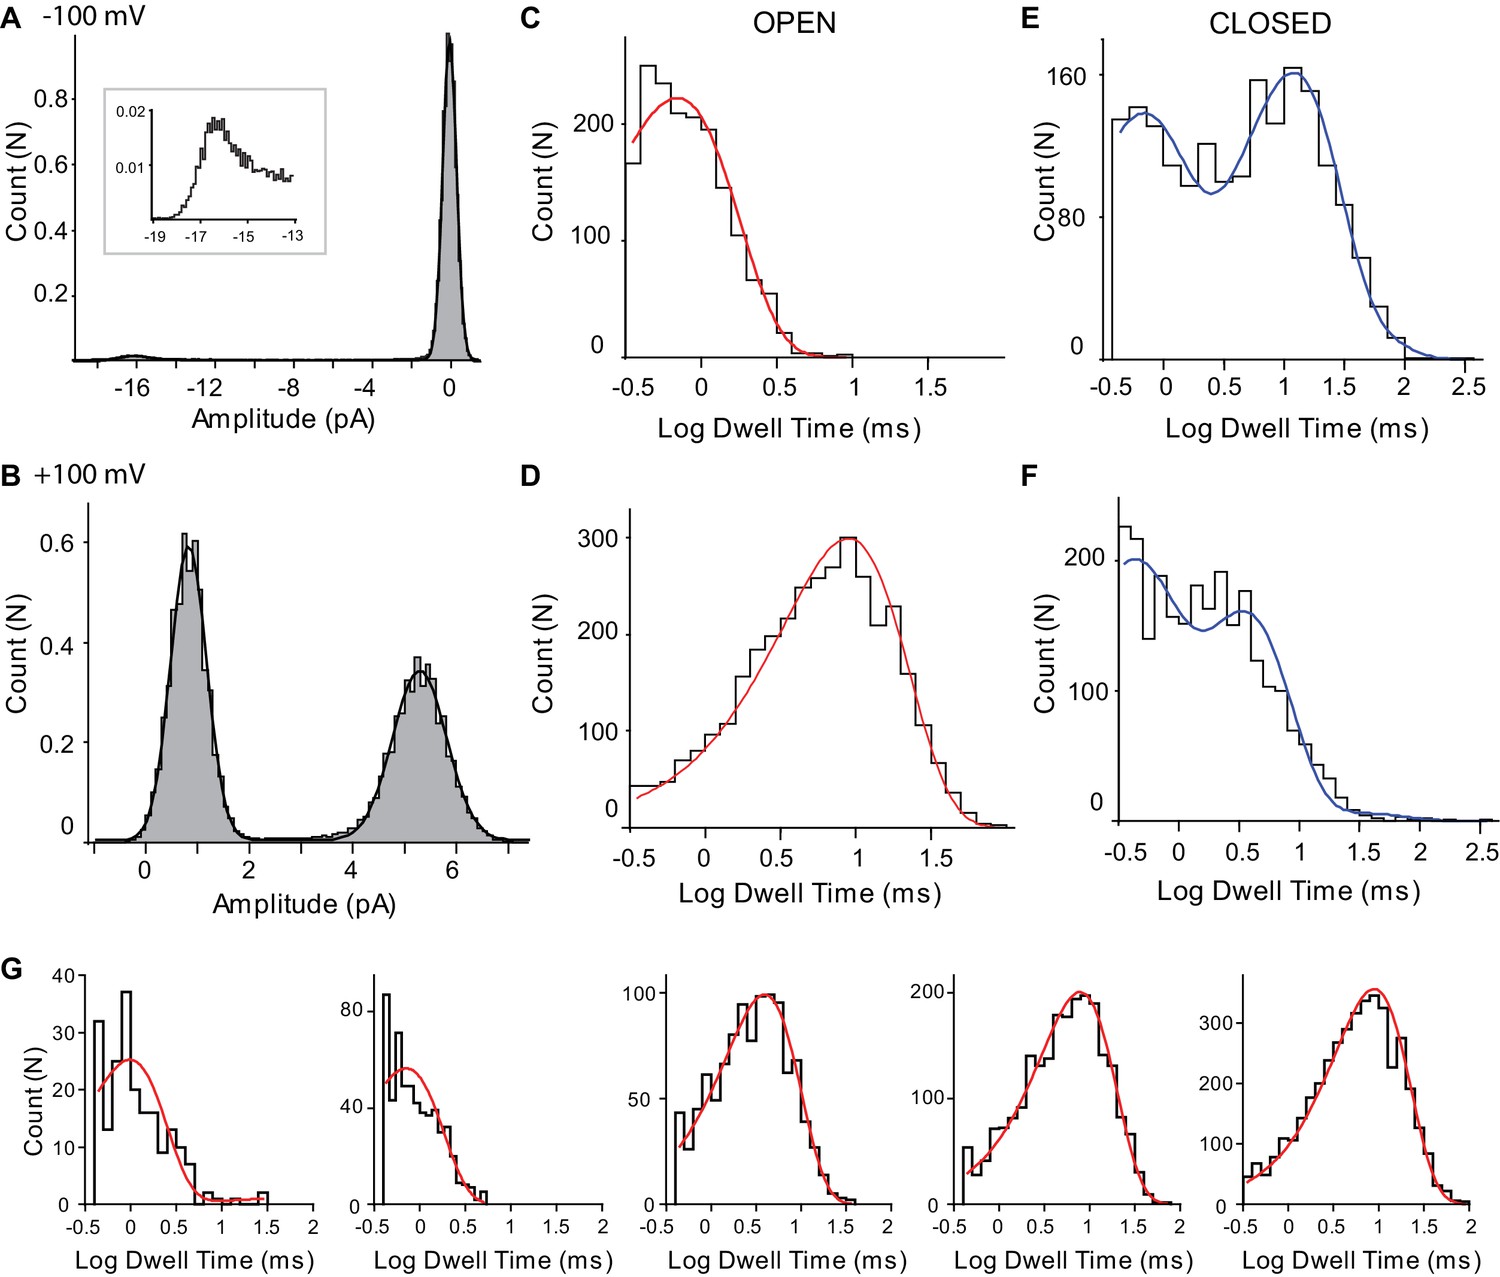
SthK single-channel analysis.
All-amplitude histograms of representative current traces from SthK in 1 mM cAMP and −100 mV (A) and +100 mV (B). Inset in A shows the peak at 16 pA on a different scale, for better visualization. Dwell-time histograms of open (C, D) and closed (E, F) time intervals for the same traces analyzed in A and B. Voltage is −100 mV for C and E, and +100 mV for D and F. The open dwell times were fit with one exponential component (red) and the closed dwell times were fit with 3 exponential components (blue). The dead time was 180 µs and only intervals longer than two dead times were included in the analysis. The few intervals longer than 500 ms were removed before the exponential fitting of the closed dwell times histogram. (G) Open dwell time histograms for single-SthK recordings for increasing concentrations of cAMP. From left to right: 1, 5, 10, 20, and 1000 µM cAMP. All histograms were fit with one exponential component whose time constant increases overall with increasing concentrations of cAMP (from left to right τ = 0.9, 0.7, 4, 7, 9 ms, respectively). The open probabilities corresponding to the recordings from which these dwell-time distributions were extracted are, from left to right, 0.002, 0.01, 0.16, 0.32, 0.36. Voltage was +100 mV and traces were filtered at 1 kHz.
Figure 5
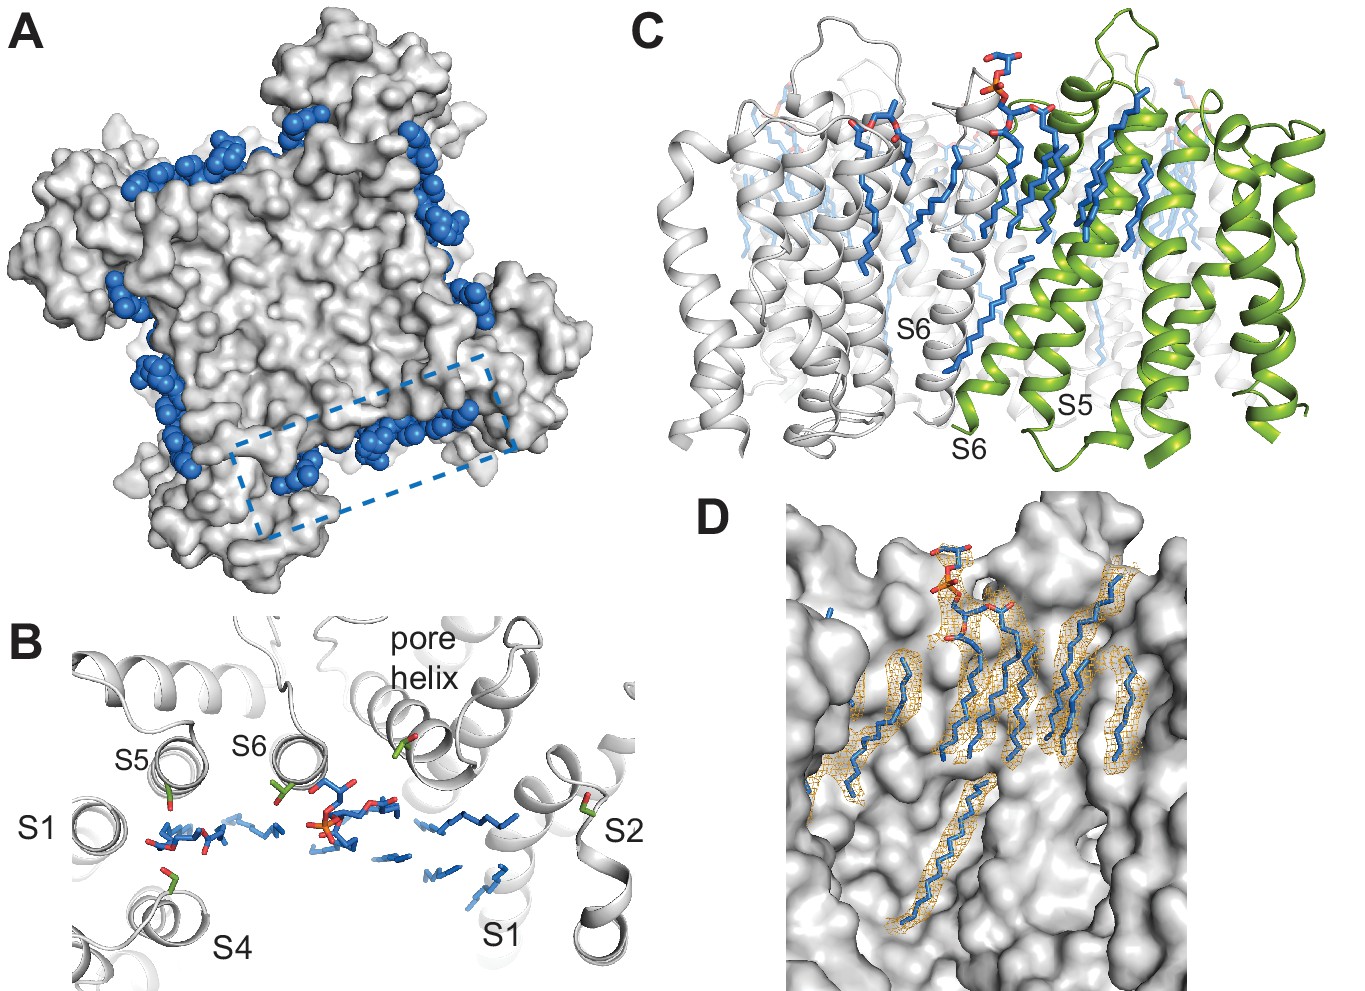
Specific lipid-protein interactions in SthK.
(A) View from the extracellular side showing a surface representation of SthK (grey) with the annular lipids (blue) located along the protein periphery. Dashed blue box indicates the region shown in B. (B) Detailed representation of location and possible interactions of the lipids (blue) with amino acid side chains (green) along the extracellular side. Transmembrane helices (grey) are labeled as S1-S6. (C) Side view of the transmembrane domain with all resolved lipids. One subunit was colored green for better visualization. (D) Same view, zoomed-in, of the transmembrane domain, showing the lipid density (in orange mesh) and the modeled lipids (blue). Protein surface representation (grey). Densities shown are at a contour level of 5 σ.
Figure 6 with 2 supplements
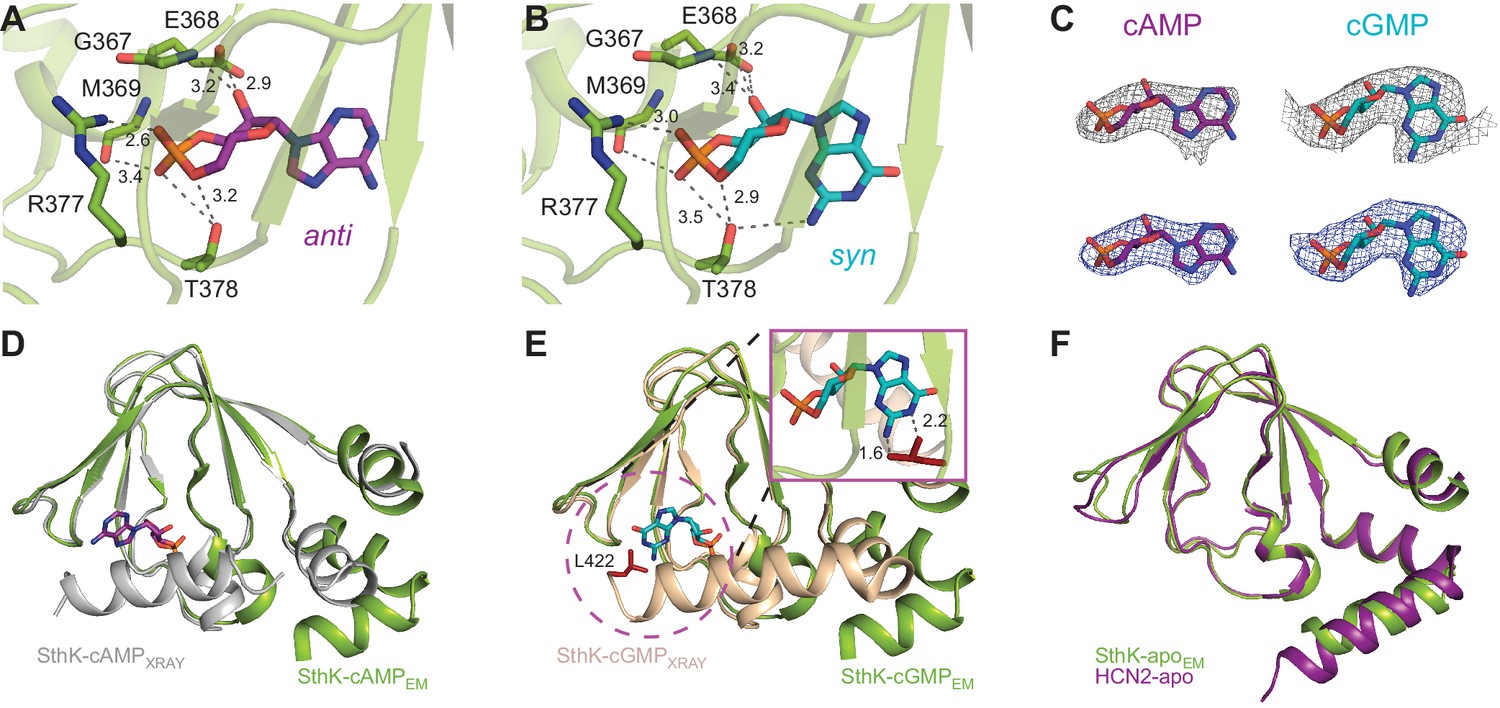
Ligand binding in the SthK CNBDs.
(A) cAMP bound in anti configuration to the binding pocket. (B) cGMP bound in the syn configuration having similar interaction with SthK. (C) Density maps (grey mesh) for cAMP (purple, anti) and cGMP (cyan, syn) showing the ligand fit. The corresponding difference maps (blue mesh) between ligand-bound and apo experimental density maps confirmed ligand binding. Densities shown are at a contour level of 5.5 σ. (D) Overlay between the cAMP-bound SthK CNBD from cryo-EM (green) and from crystallography (grey, PDB:4D7T). (E) Overlay between cGMP-bound SthK CNBD from cryo-EM (green) and from crystallography (wheat, PDB:4D7S). Insert shows potential clash of the C-helix (L422, highlighted in red) from the crystal structure with the cGMP in the syn configuration. (F) Overlay between apo SthK (green) and apo HCN2 (purple) CNBDs showing identical conformations.
Figure 6—figure supplement 1
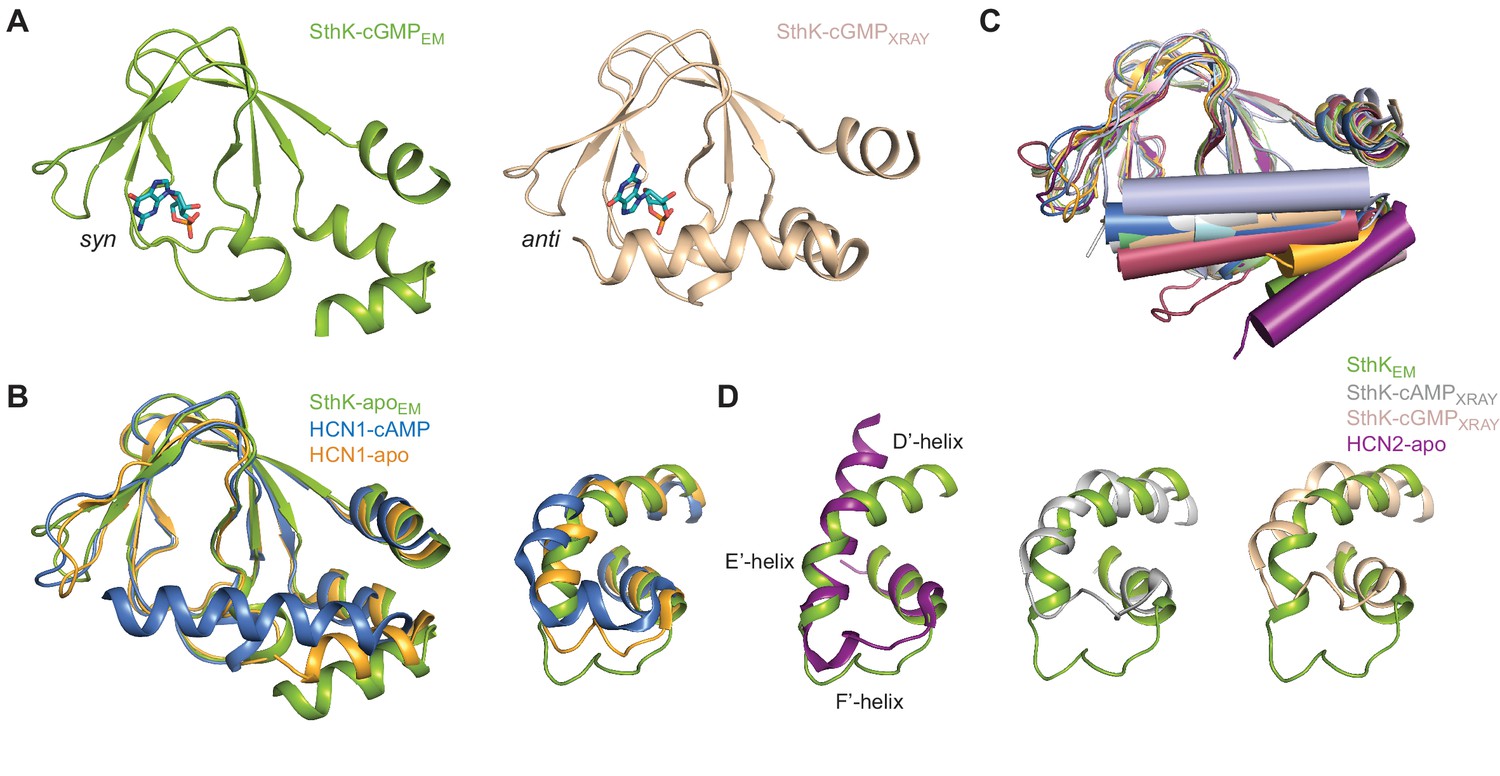
Comparisons between CNBDs of SthK and related channels.
(A) Side-by-side comparison of cGMP-bound SthK CNBD from cryo-EM (green) and X-ray crystallography for the isolated domain (wheat). The green is in the resting and the wheat is in the activated conformation as shown by the C-helix position. cGMP configuration is in syn (green) and anti (wheat). (B) Overlays between apo SthK (green), apo HCN1 (yellow), and cAMP HCN1 (blue) CNBDs (left) and siphon regions (right). The C-helices are visible in lower, intermediate and upper position, respectively and the siphon loops are visible correspondingly in a lower, intermediate, and upper position. (C) Overlay between CNBDs of cyclic nucleotide-modulated ion channels shows two major conformational states of the C-helix (depicted as a cylinder), either in lower (resting) conformation or upper (activated) conformation. C-helix of apo HCN1 (yellow) is in an intermediate conformation, but closer to the upper (activated) conformation. (E) Overlays between siphon regions of apo SthK (green, left) and apo HCN2 (purple), showing close to identical conformations. The overlays between cryo-EM SthK (green; cAMP (middle) and cGMP (right)) and the crystal structure SthK (grey and wheat, cAMP and cGMP, respectively) siphons show big differences, corresponding to the large differences between resting and activated CNBDs. PDB codes: apo SthKEM (6CJQ), cAMP SthKEM (6CJU), cGMP SthKEM (6CJT), cAMP SthKXRAY (4D7T), cGMP-SthKXRAY (4D7S), apo HCN1 (5U6O), cAMP HCN1 (5U6P), TAX-4 (5H3O), LliK (5V4S), apo HCN2 (5JON), cAMP HCN2 (1Q43), cGMP HCN2 (1Q3E), MolK1 (6EO1).
Figure 6—figure supplement 2
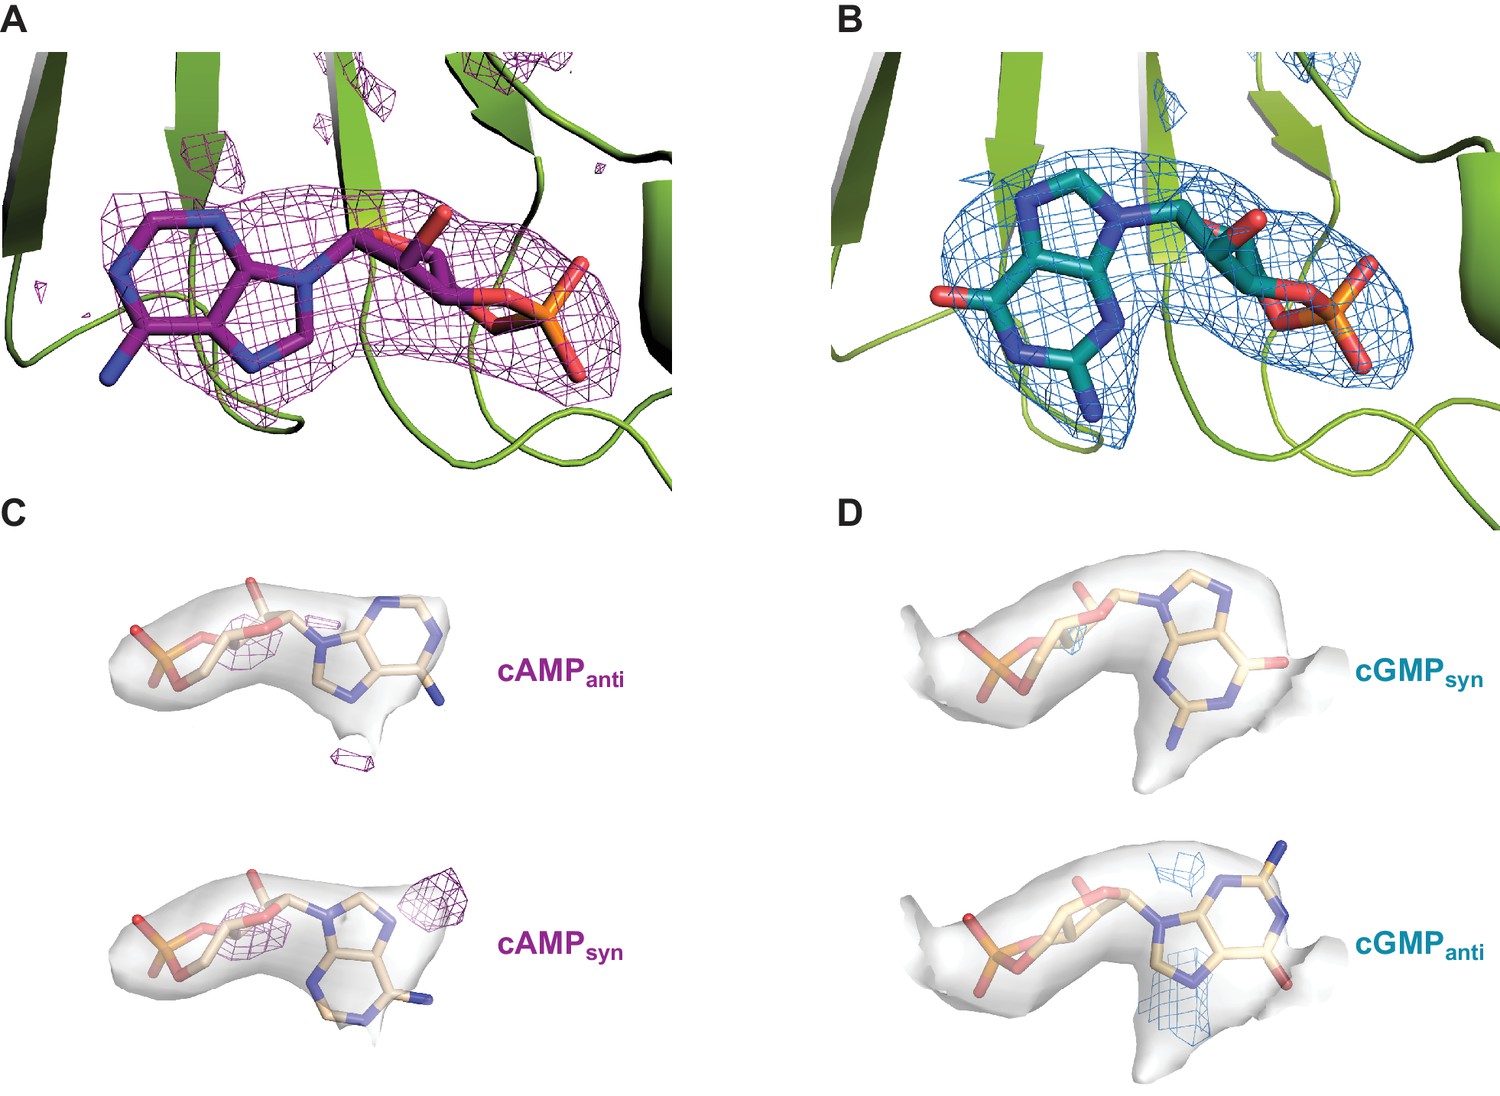
Difference density maps for cyclic nucleotides in the CNBDs of SthK.
(A) ‘Omit’ difference map (magenta mesh) between the experimental density maps for cAMP-bound SthK and a theoretical map built from the atomic model from which the ligand was deleted (pdb 6CJU). (B) ‘Omit’ difference map (cyan mesh) between the experimental density maps for cGMP-bound SthK and a theoretical map built from the atomic model from which the ligand was deleted (pdb 6CJT). In both cases, only the region of the binding pocket is shown for clarity. cAMP and cGMP are shown in magenta and cyan sticks, respectively, and part of the binding site in green cartoon (C) Difference maps (magenta mesh) between the experimental density map for cAMP-bound SthK and a theoretical map built from the atomic model where cAMP is in anti configuration (top), or syn configuration (bottom). Positive density in each case in a different location suggests that the experimental cAMP density is a mix of both syn and anti configurations. (D) Difference maps (cyan mesh) between the experimental density map for cGMP-bound SthK and a theoretical map built from the atomic model where cGMP is in syn configuration (top), or anti configuration (bottom). Positive density in only the anti case suggests that the experimental cGMP density is composed of only the syn configuration. Experimental ligand density is shown in grey surface and the ligands are shown in stick representation. Densities are shown at a contour level of 5.5 σ (panel C and D). Difference map densities are shown at a contour level of 8 σ (panel A and B) and 5 σ (panel C and D). The difference density disappears at 29 σ (panel A) and 27 σ (panel B).
Figure 7
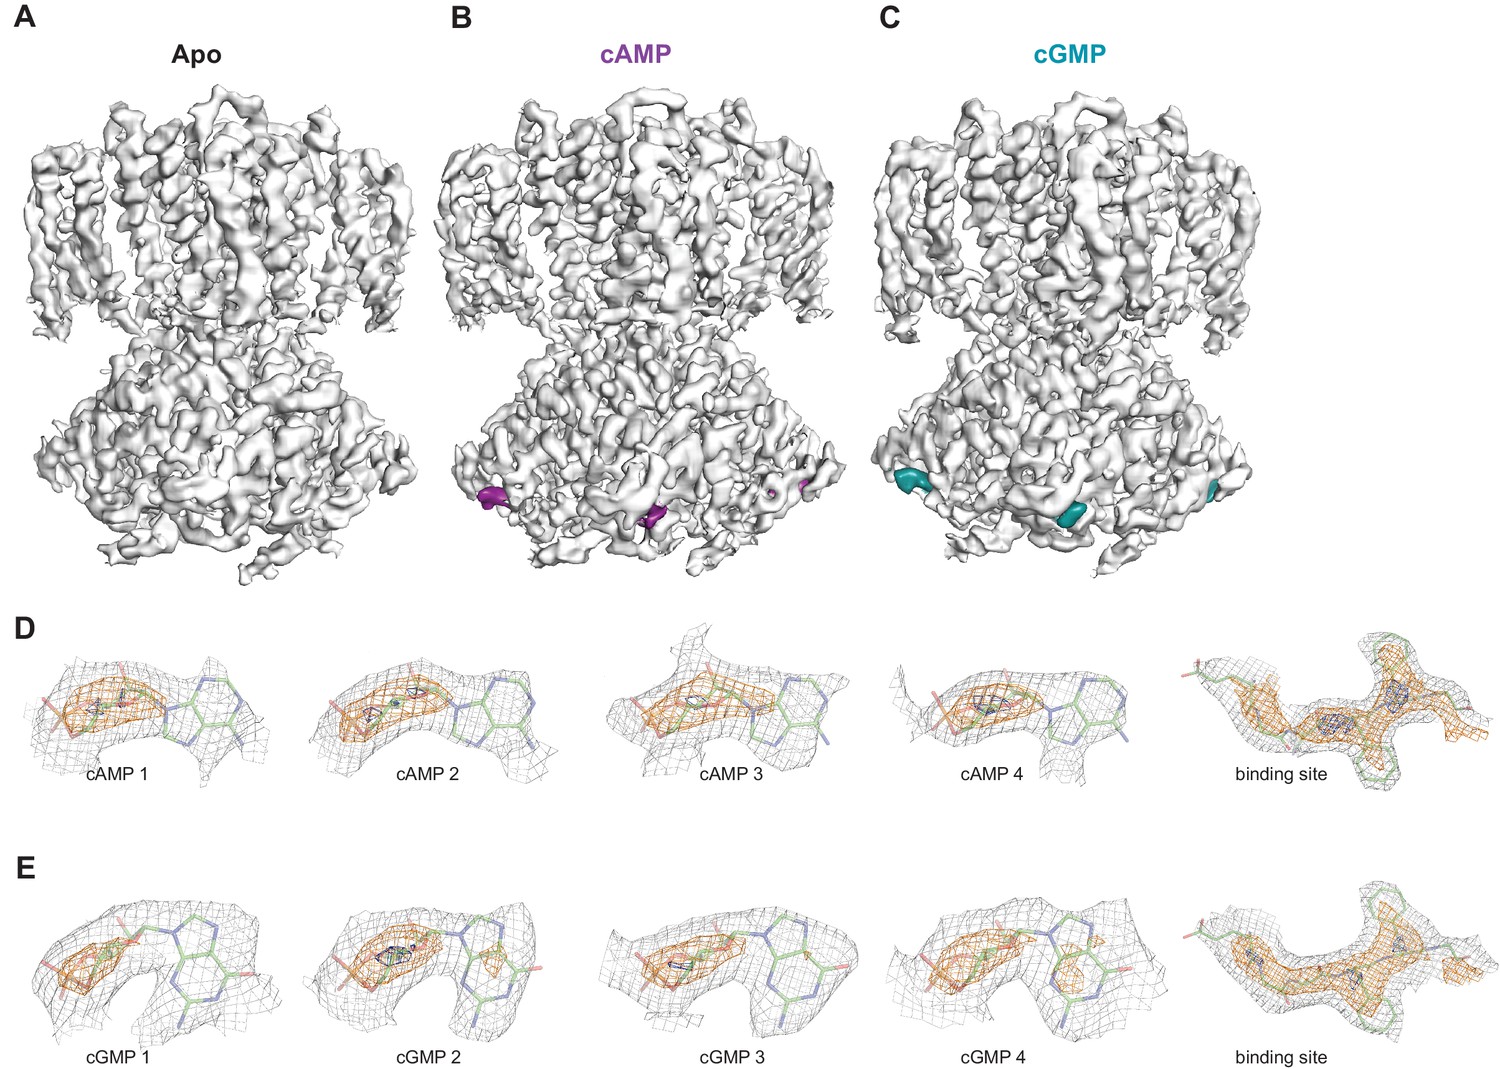
Ligand density in non-symmetrized SthK maps.
Full-length, non-symmetrized C1 density maps for apo (A), cAMP-bound (B), and cGMP-bound (C) SthK. Overall protein density is in grey surface, cAMP density is in magenta (B), and cGMP density is in cyan (C). cAMP (D) and cGMP (E) density for each binding site in the four subunits of the tetramer, contoured at 6 σ (grey mesh), 11 σ (orange mesh), and 15 σ (dark blue mesh). All four ligand densities (for cAMP and cGMP) decrease at the same rate as the contour levels increase, and disappear at ~15 σ, and at the same rate as the protein density in a nearby region (rightmost panels in D, E), suggesting that all binding sites are occupied with ligand and the occupancy is close to 1 in each of the sites. Ligands and protein are drawn in stick representation.
Figure 8
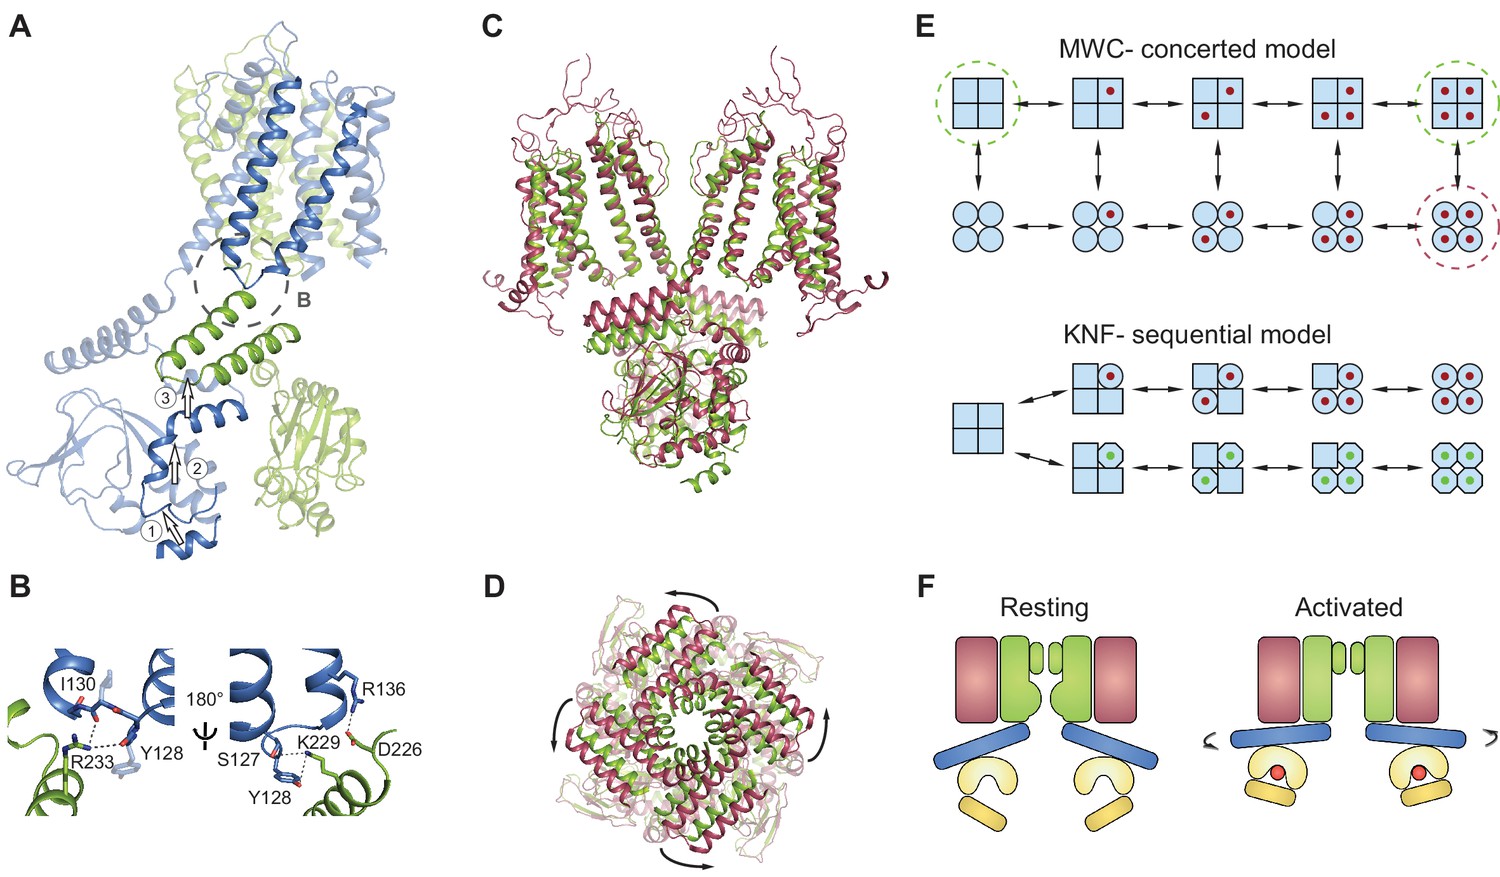
Gating model for SthK channels.
(A) Two adjacent subunits of SthK (green and blue) illustrating the molecular motions needed to transition from the resting to the ‘activated’ CNBD conformation seen in the crystal structure. The numbers and arrows are used to describe the motions and directionality. (B) Specific interactions between the C-linker and the S4-S5-linker from the adjacent subunit indicated in the dashed circle in A. Left: same orientation as in A; right: rotated by 180°. Potential interactions between protein regions are shown with dotted lines. (C) Overlay between apo SthK (green) and the open TAX-4 (red) structures showing the upward displacement of the C-linker and the CNBD (especially the C-helix) during channel activation. Only two opposite subunits are shown for clarity. (D) The overlay of the same two structures viewed from the extracellular side showing only the C-linker/CNBD and two helical turns of S6 reveals an additional counterclockwise rotation of the C-linker that pulls on the ends of the S6 helices resulting in enlargement of the base of the pore. (E) Cartoon of two gating models. Blue squares represent the resting and blue circles the activated states. The MWC-model (top) proposes concerted conformational changes from closed to open states (all squares become all circles). The red dot is the ligand. Dashed green circles highlight the resting, closed SthK states solved with cryo-EM and presented here. Dashed red circle indicates the open, activated TAX-4-like state. The KNF model (bottom) proposes sequential changes in individual subunits as ligands bind on the path towards open states (one square becomes a circle when red ligand binds and an octagon when green ligand binds). (F) Cartoon of activation depicting domain rearrangements from the resting/closed state (left) to the activated/open state (right). Colors as in Figure 2B. Curved arrows indicate the C-linker rotation shown in D.
Videos
Video 1
Agonist-induced movement of the C-linker/CNBD of SthK by interpolating the structures of SthK apo with that of the isolated SthK CNBD crystal structure.
https://doi.org/10.7554/eLife.39775.021Tables
Key resources table
| Reagent type (species) or resource | Designation | Source or reference | Identifiers | Additional information |
|---|---|---|---|---|
| Gene (Spirochaeta thermophila) | SthK | NA | UniProtKB G0GA88 | |
| Cell line (Escherichia coli) | C41 (DE3) | Lucigen | 60442–1 | |
| Peptide, recombinant protein | SthK | doi: 10.1085/jgp.201812023 | ||
| Chemical compound, drug | cAMP | VWR | AAJ62174-03 | |
| Chemical compound, drug | cGMP | Sigma | G6129-100MG | |
| Software, algorithm | Relion 2.1 | doi: 10.7554/eLife.18722 | ||
| Software, algorithm | MotionCor2 | doi: 10.1038/nmeth.4193 | ||
| Software, algorithm | CTFFind4 | doi: 10.1016/j.jsb.2015.08.008 |
Additional files
-
Supplementary file 1
Table Summary of imaging conditions, data processing and model statistics.
- https://doi.org/10.7554/eLife.39775.022
-
Transparent reporting form
- https://doi.org/10.7554/eLife.39775.023
Download links
A two-part list of links to download the article, or parts of the article, in various formats.
Downloads (link to download the article as PDF)
Open citations (links to open the citations from this article in various online reference manager services)
Cite this article (links to download the citations from this article in formats compatible with various reference manager tools)
Ligand discrimination and gating in cyclic nucleotide-gated ion channels from apo and partial agonist-bound cryo-EM structures
eLife 7:e39775.
https://doi.org/10.7554/eLife.39775


