The novel lncRNA lnc-NR2F1 is pro-neurogenic and mutated in human neurodevelopmental disorders
- Stanford University, United States
- Greenwood Genetic Center, United States
- Howard Hughes Medical Institute, University of Washington, United States
- Clemson University, United States
- Vienna Biocenter, Austria
Figures
Figure 1 with 4 supplements
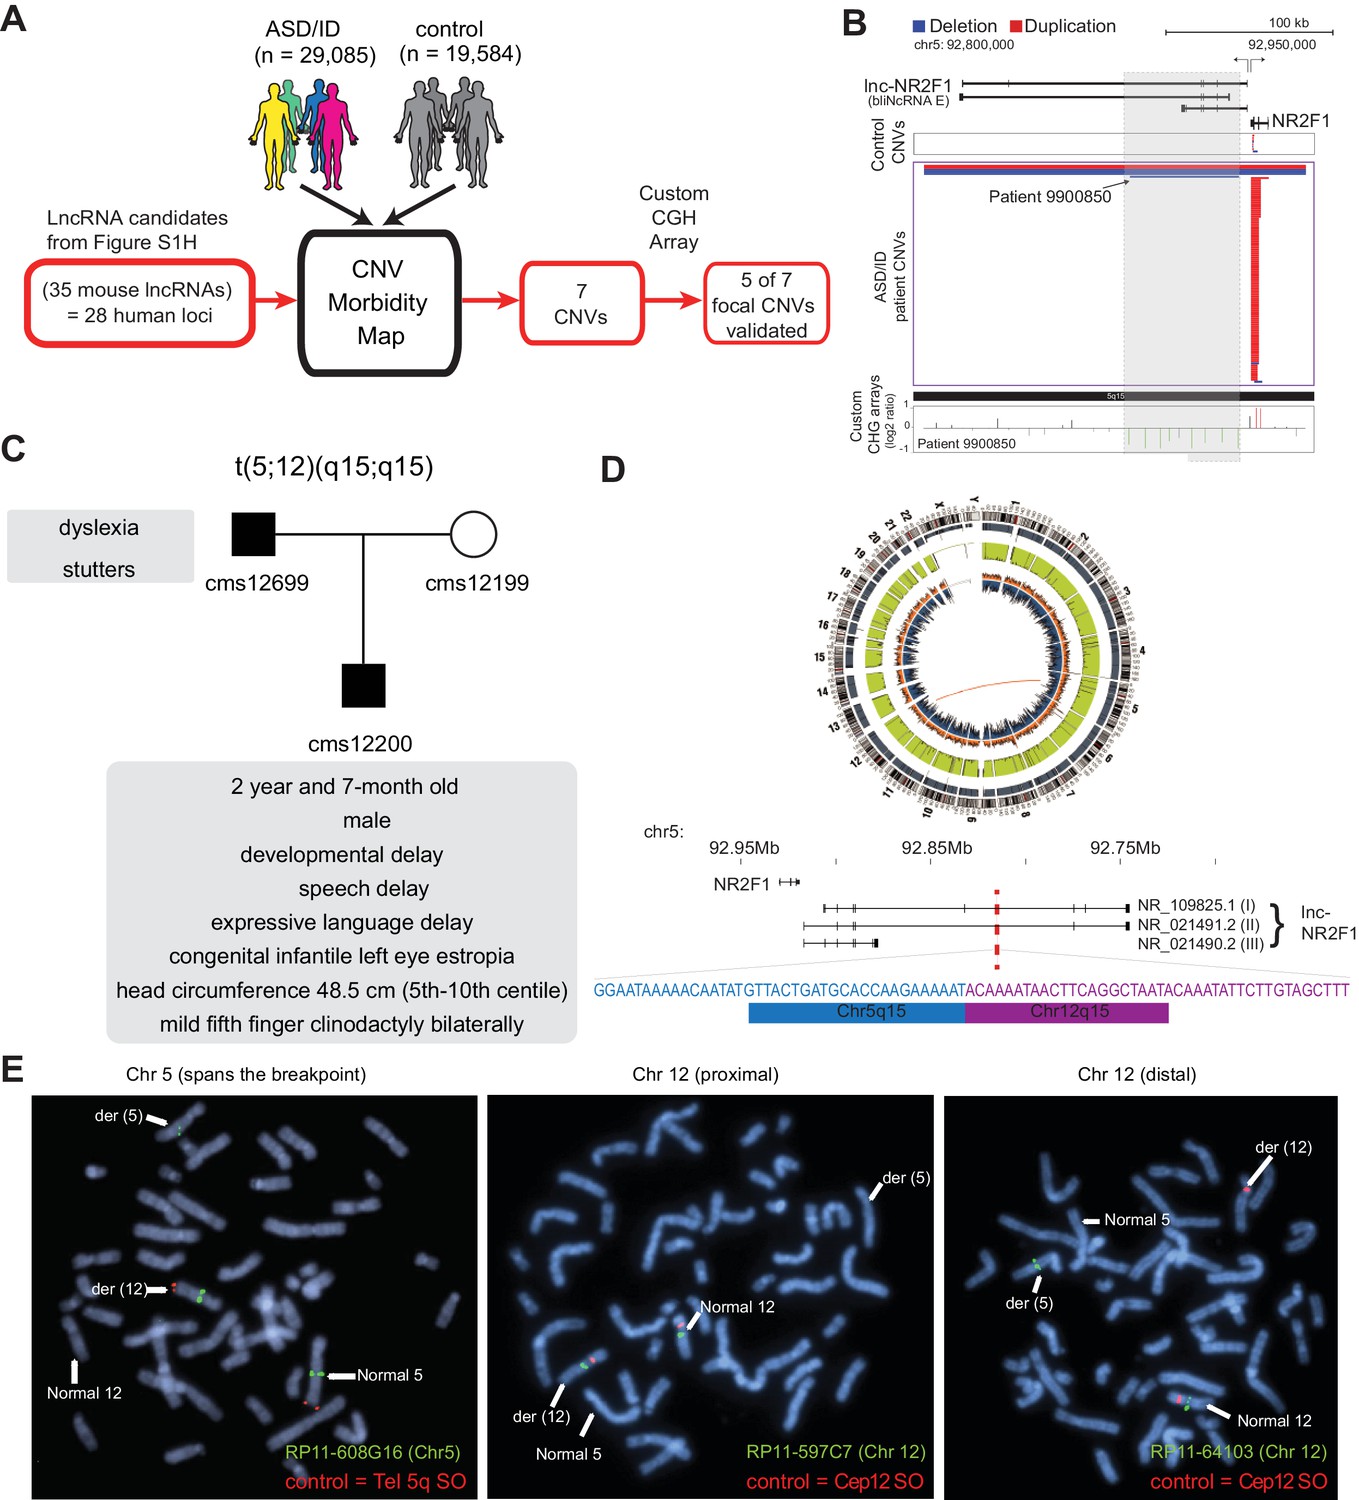
lncRNA loci are recurrently mutated in patients with neurodevelopmental disorders.
(A) Schematic representation of CNV morbidity map analysis for candidate lncRNAs and all other iN lncRNAs loci. The 35 mouse lncRNA candidates (28 human loci) is from Figure 1—figure supplement 1H. (B) Top: Representative tracks for lncRNA E locus, also known as lnc-NR2F1. Depicted in blue are deletions and in red duplications. Arrow points to patient with focal deletion affecting the lnc-NR2F1 locus only. Bottom: Custom CGH arrays used to validate chromosomal aberration in patient 9900850 harboring focal deletion represented in green signal. (C) Genetic pedigree analysis for family with paternally inherited balanced chromosomal translocation (5;12) (q15;q15), including a summary of clinical features for patient CMS12200 and father. The mother has a normal karyotype. Listed in the box are the symptoms of the patients. (D) Top: Circa plot representing the pathogenic chromosomal event for patient CMS12200 involving chromosomes 5 and 12. Bottom: Representative chromosome ideogram and track of the balanced chromosomal break affecting patient CMS12200. Below the ideoplot is the schematic representation of predominant human isoforms for lnc-NR2F1 and the site of the break site disrupting the long isoforms. (E) The locations of the probes are in Figure 1—figure supplement 4C. Left: Metaphase spread from patient CMS12200 with the t(5;12) translocation showing FISH signals obtained with the clone RP11-608G16 (green) spanning Chromosome five breakpoint, and a Chromosome five telomere-specific probe (red). Middle: Metaphase spread from patient CMS12200 with the t(5;12) translocation showing FISH signals obtained with the clone RP11-597C7(green) proximal to Chromosome 12 breakpoint, and a Chromosome 12 centromere-specific probe (red). Right: Metaphase spread from patient CMS12200 with the t(5;12) translocation showing FISH signals obtained with the clone RP11-641O3 (green) distal to Chromosome 12 breakpoint, and a Chromosome 12 centromere-specific probe (red).
Figure 1—figure supplement 1
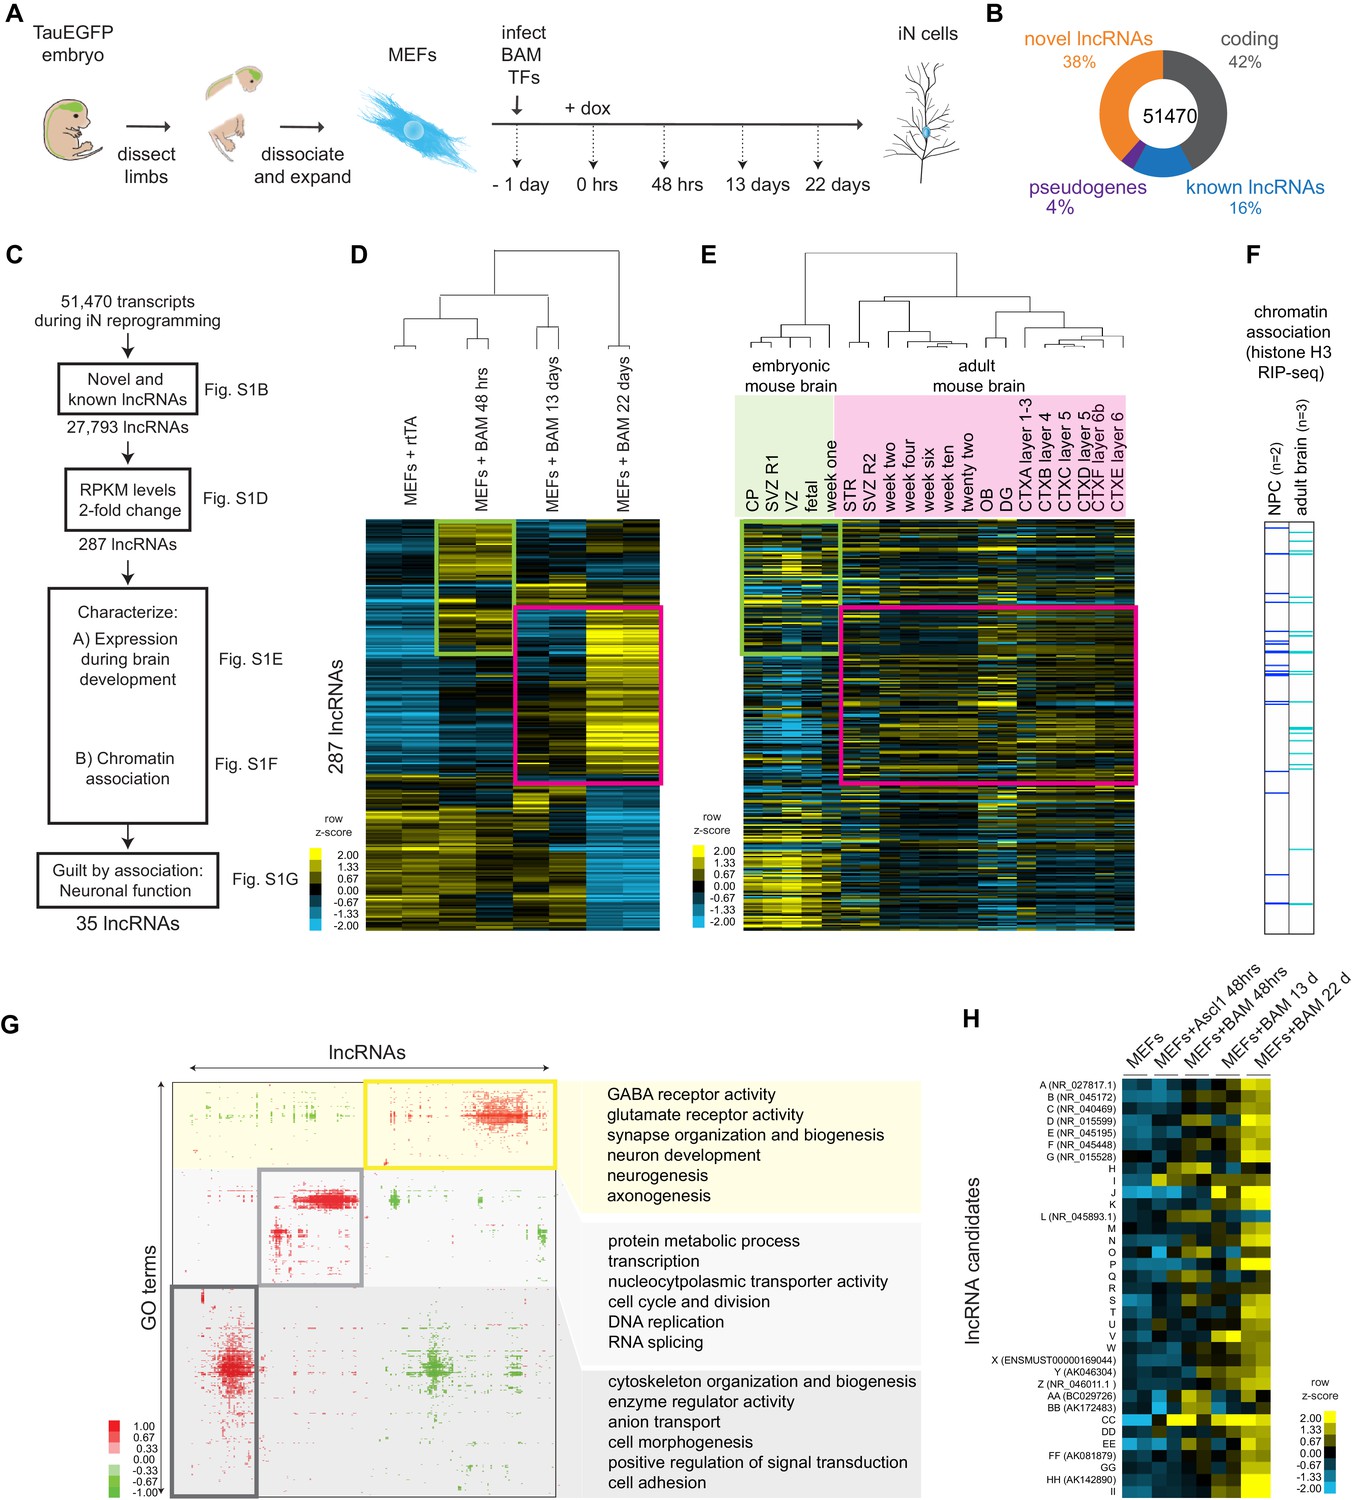
Molecular profiling of direct fibroblast to iN cell reprogramming nominates functional lncRNAs involved in neurogenesis.
(A) Schematic representation of experimental time points generated for this study. (B) Classification of the iN cell transcriptome consisting of 51,470 transcripts based on coding genes and non-coding RNAs. (C) Diagram depicting pipeline derived in this study to enrich for candidate lncRNAs with strong neuronal association. (D) Hierarchical clustering heatmap of lncRNA expression during iN cell reprogramming by RNA-seq across indicated time points (n = 2 biological replicates). Shown are 287 lncRNAs that changed expression at least two-fold at any time point (p<0.05). Fold change is represented in logarithmic scale normalized to the mean expression value of a gene across all samples. The green box highlights the genes which are upregulated in the MEF +BAM 48 hr. The same set of genes are upregulated in embryonic mouse brain (see Figure 1—figure supplement 1E). The pink box highlights the genes which are upregulated in the MEF +BAM 22 hr. The same set of genes are upregulated in adult mouse brain (see Figure 1—figure supplement 1E). (E) Hierarchical clustering heatmap of iN lncRNAs from Figure 1—figure supplement 1D across mouse brain tissues from publicly available data. Expression levels are represented in logarithmic scale normalized to the mean expression value of a gene across all samples. (F) Chromatin association of iN lncRNAs determined by histone H3-RIP-seq in Neuronal Progenitor Cells (NPCs) and total adult brain (n = 2 biological replicates for NPCs and n = 3 for mouse brain) presented in binary format. Shown are lncRNAs that have significant enrichment over background (>2 fold, p<0.05) and consistent enriched in the chromatin among biological replicates. (G) Co-expression analysis using Genomica between iN lncRNAs and mRNAs associated with Gene ontology (GO) terms. Highlighted in the yellow box are lncRNA candidates which are associated with neuronal GO terms. (H) RNA-seq heatmap of 35 filtered candidate lncRNAs across MEF-to-iN cell reprogramming. In brackets are the Refseq ID for the annotated lncRNAs. See the supplementary documents for the sequences and coordinates of the 35 candidates.
Figure 1—figure supplement 2
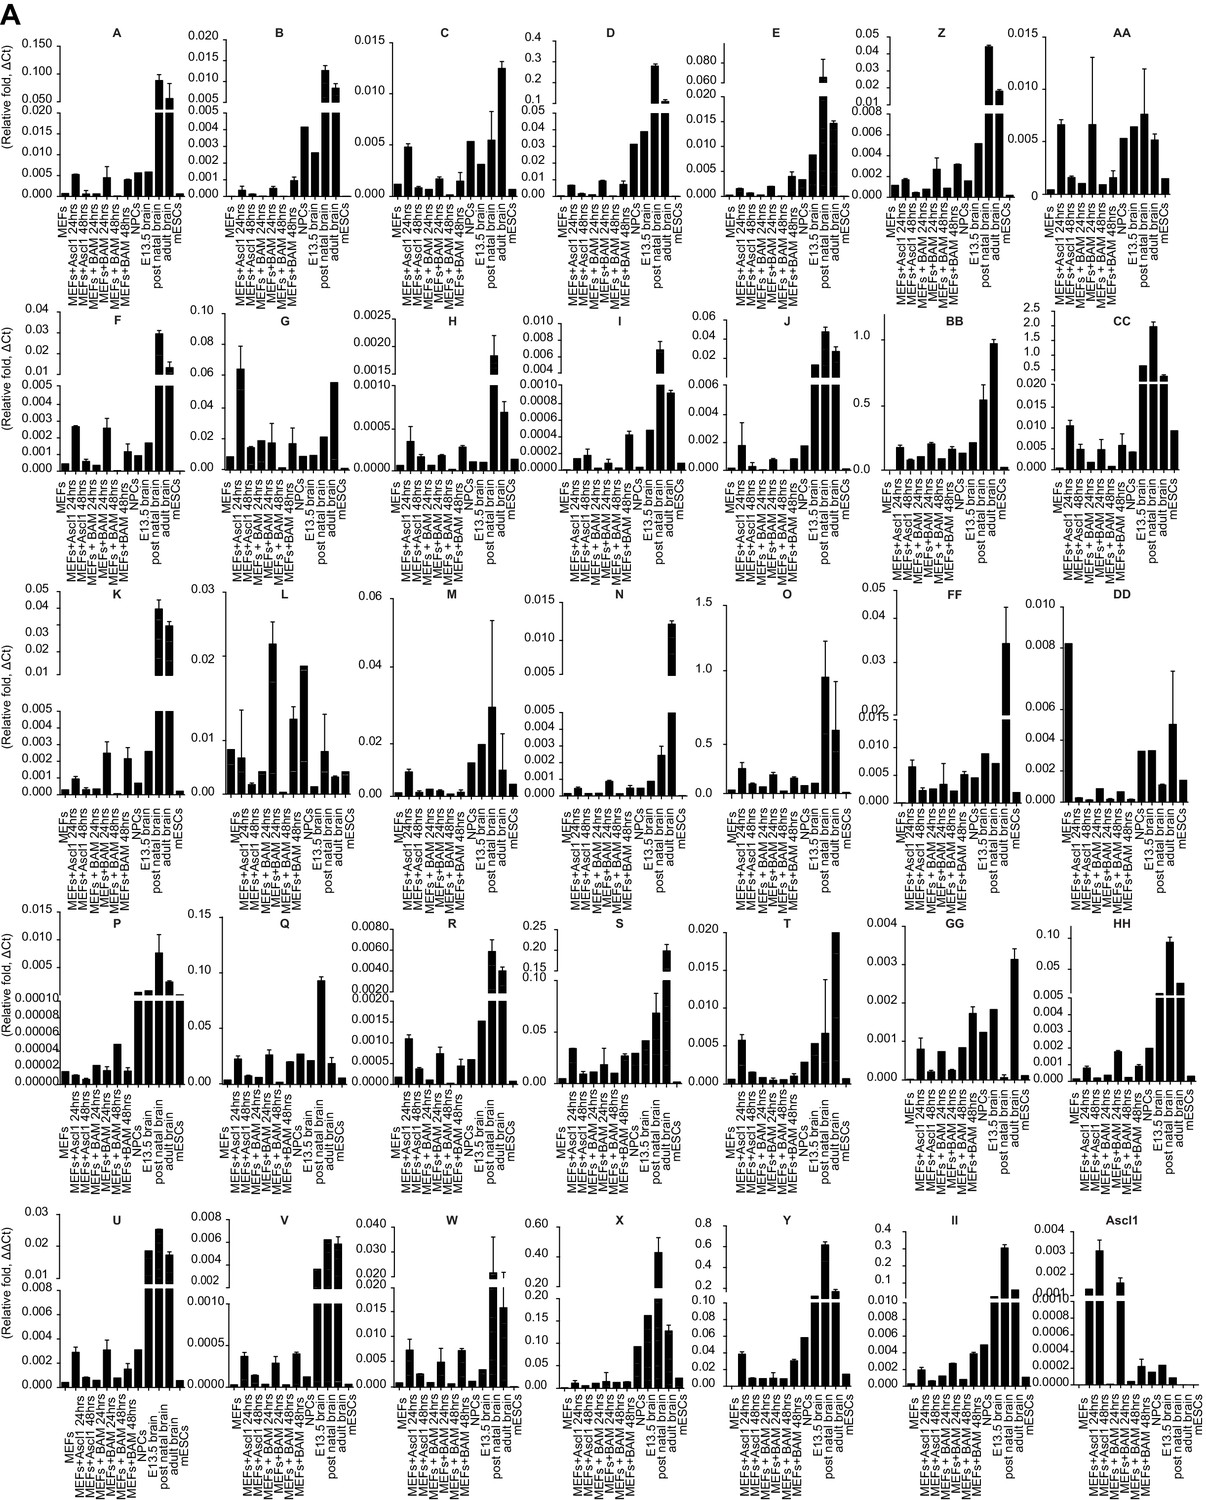
QRT-PCR validation of candidate lncRNAs expression.
(A) Expression detection of candidate lncRNAs by qRT-PCR across early stages of iN cell reprogramming and mouse brain development.
Figure 1—figure supplement 3

Conserved lncRNAs have distinct pattern of expression across different stages of the human brain.
(A) Heatmap of annotated syntenic lncRNAs across human brain development detected by RNA-seq. Expression is represented in logarithmic scale normalized to the mean RPKM value of a gene across all samples. See Supplementary documents for the lncRNA sequences.
Figure 1—figure supplement 4
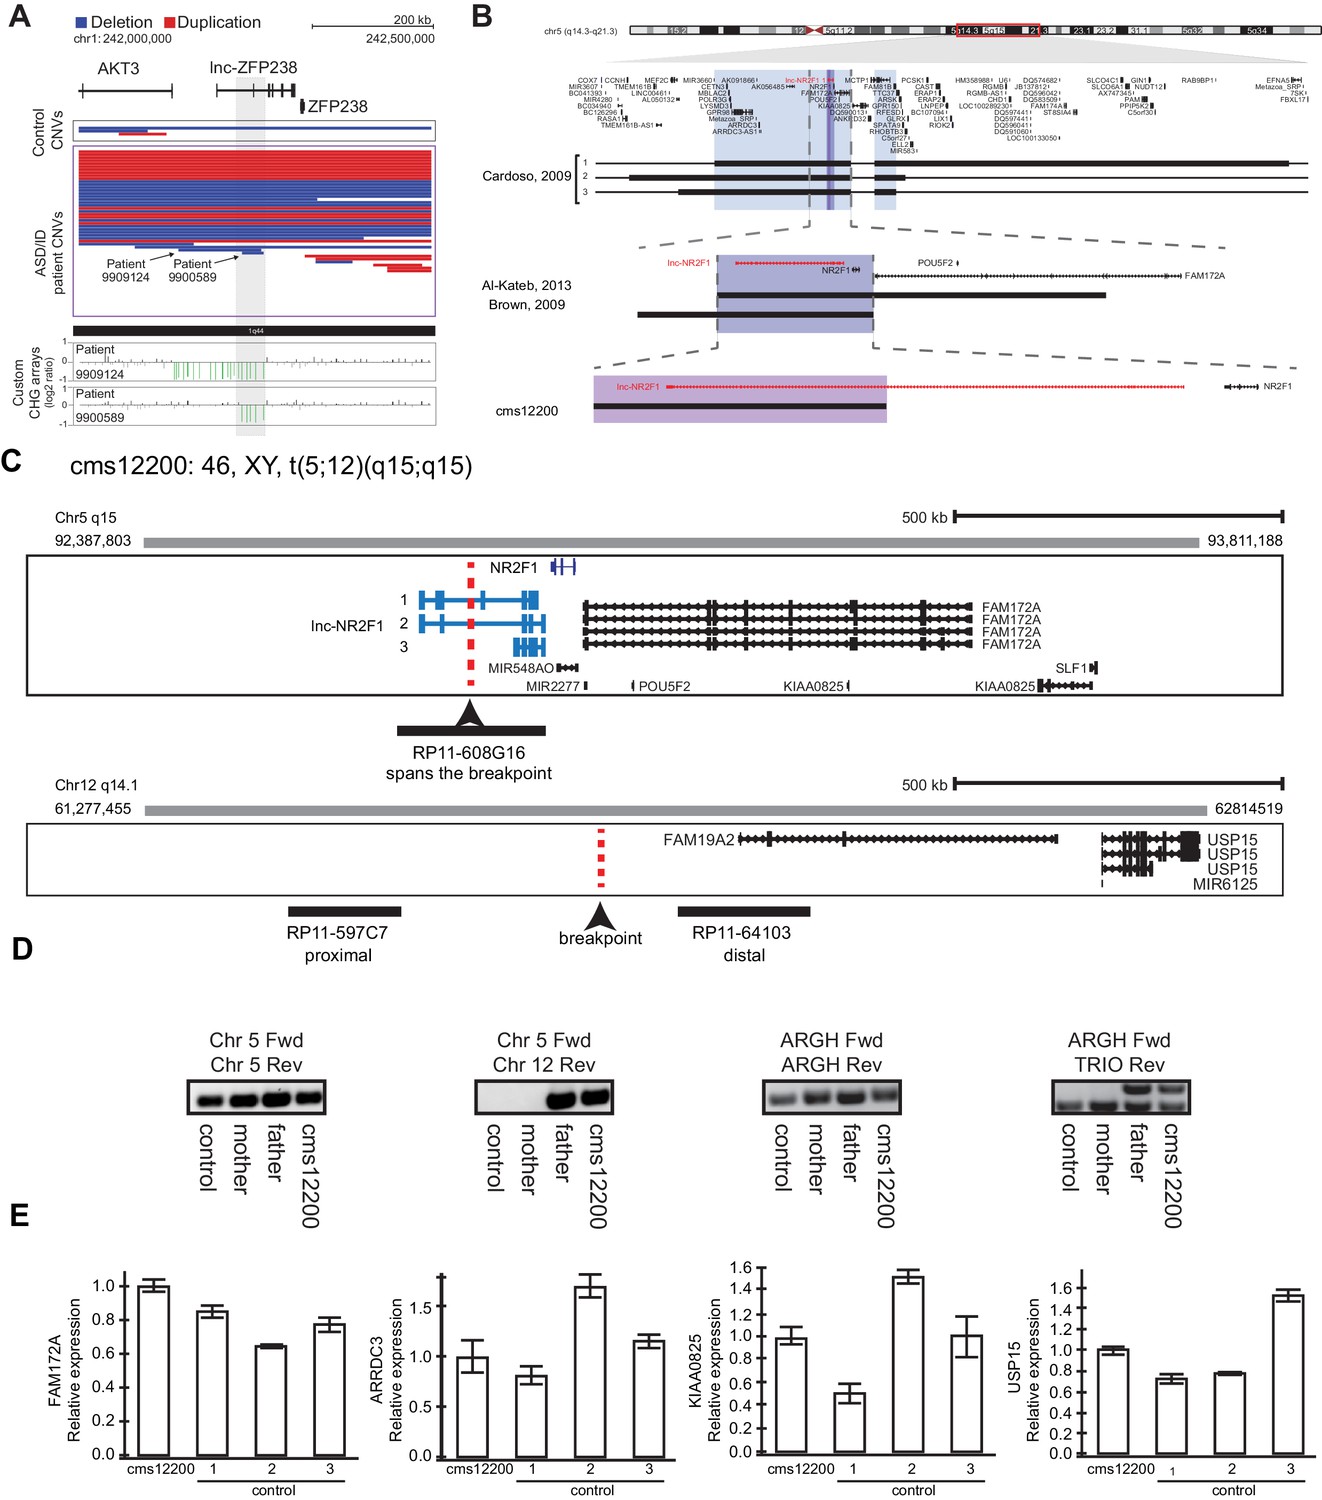
Other reports of CNVs affecting lnc-NR2F1 and an example of focal deletion affecting lnc-ZFP238 and characterization fo patient CMS12200.
(A) Top: Representative tracks for lncRNA H locus, also known as lnc-ZFP238. Depicted in blue are deletions and in red duplications. Arrow points to two significant focal deletions in two distinct patients. Bottom: Custom CGH arrays used to validate chromosomal aberration in patients 9909124 and 9900589 harboring focal deletions represented in green signal. (B) Representative tracks of previously reported deletions affecting chromosome region 5q15 in patients with neurodevelopmental and neuropsychiatric disorders. The black rectangle represents affected genomic region corresponding to the patient described in a previous publication to the left. Top panel: light blue box represents minimal common region amongst three patients in Cardoso et al, 2009 report. There are multiple genes affected in the locus. Middle panel: purple box depicts common deleted region reported amongst two patients from Brown, et al 2009, and Al-Kateb, et al 2013 studies. The region encompasses only two genes: NR2F1 and lnc-NR2F1. Bottom panel: Patient CMS 12200 described in this study harboring a balanced chromosomal translocation disrupting lnc-NR2F1 only as depicted by the pink box. In red, lnc-NR2F1 is highlighted. (C) Schematic representation of breakpoint region between chromosome 5 and 12 for patient CMS12200. Illustrated is also the probe design to confirm event. Probe RP11-608G16 spans the breakpoint in chromosome 5. Probe RP11-597C7 is proximal to the breakpoint on chromosome 12. Probe RP11-64103 is distal to the breakpoint on chromosome 12. (D) Genomic PCR to confirm t(5;12) translocation using primers spanning control region in chromosome 5 (left), translocation between chromosome 5 and 12 (middle left), unaffected region in ARGH gene (middle right), and non-pathological gene duplication for TRIO exon in ARGH intronic loci (right). Samples from control (GM12878), mother (does not harbor translocation), father (t(5;12)), and CMS12200 patient (t(5;12)). (E) Expression of genes proximal to breakpoint is unaffected as measured by RT-qPCR in CMS12200 patient lymphocytes and three distinct control samples.
Figure 2 with 2 supplements

Molecular characterization of mouse lnc-Nr2f1.
(A) Schematic showing the different isoforms reported by Refseq of the human lnc-NR2F1 and mouse lnc-Nr2f1. Exons highlighted in red are conserved among human and mouse. The table at the bottom right corner shows the sequence similarity as reported by T-COFFEE. The sequence alignment is available as Supplementary file 6. (B) Lnc-Nr2f1 expression measured by qRT-PCR across stages of mouse brain development and early stages of iN cell reprogramming. Results show early detection in E13.5 brain, peak expression at postnatal stages, and continued expression through adulthood. (C) In situ hybridization for Nr2f1 and lnc-Nr2f1 shows similar expression pattern in E13.5 mouse brain. Highlighted by arrows are neocortex (NCX) and ganglionic eminences (GE) with high expression levels. (D) Cellular localization of lnc-Nr2f1 by single molecule RNA-FISH in MEFs ectopically expressing the lncRNA 48 hr after dox induction reveals nuclear and cytoplasmic localization, with slight nuclear enrichment. Green arrow points at lnc-Nr2f1 in the nucleus and red arrows point at the uninfected nuclei. (E) Cellular fractionation of primary neurons derived from E13.5 caudal cortex dissection shows nuclear and cytoplasmic localization of lnc-Nr2f1. (F) Chromatin enrichment of lnc-Nr2f1 by histone H3 RIP-qRT-PCR in brain derived neuronal precursor cells (NPCs), postnatal and adult mouse brain.
Figure 2—figure supplement 1
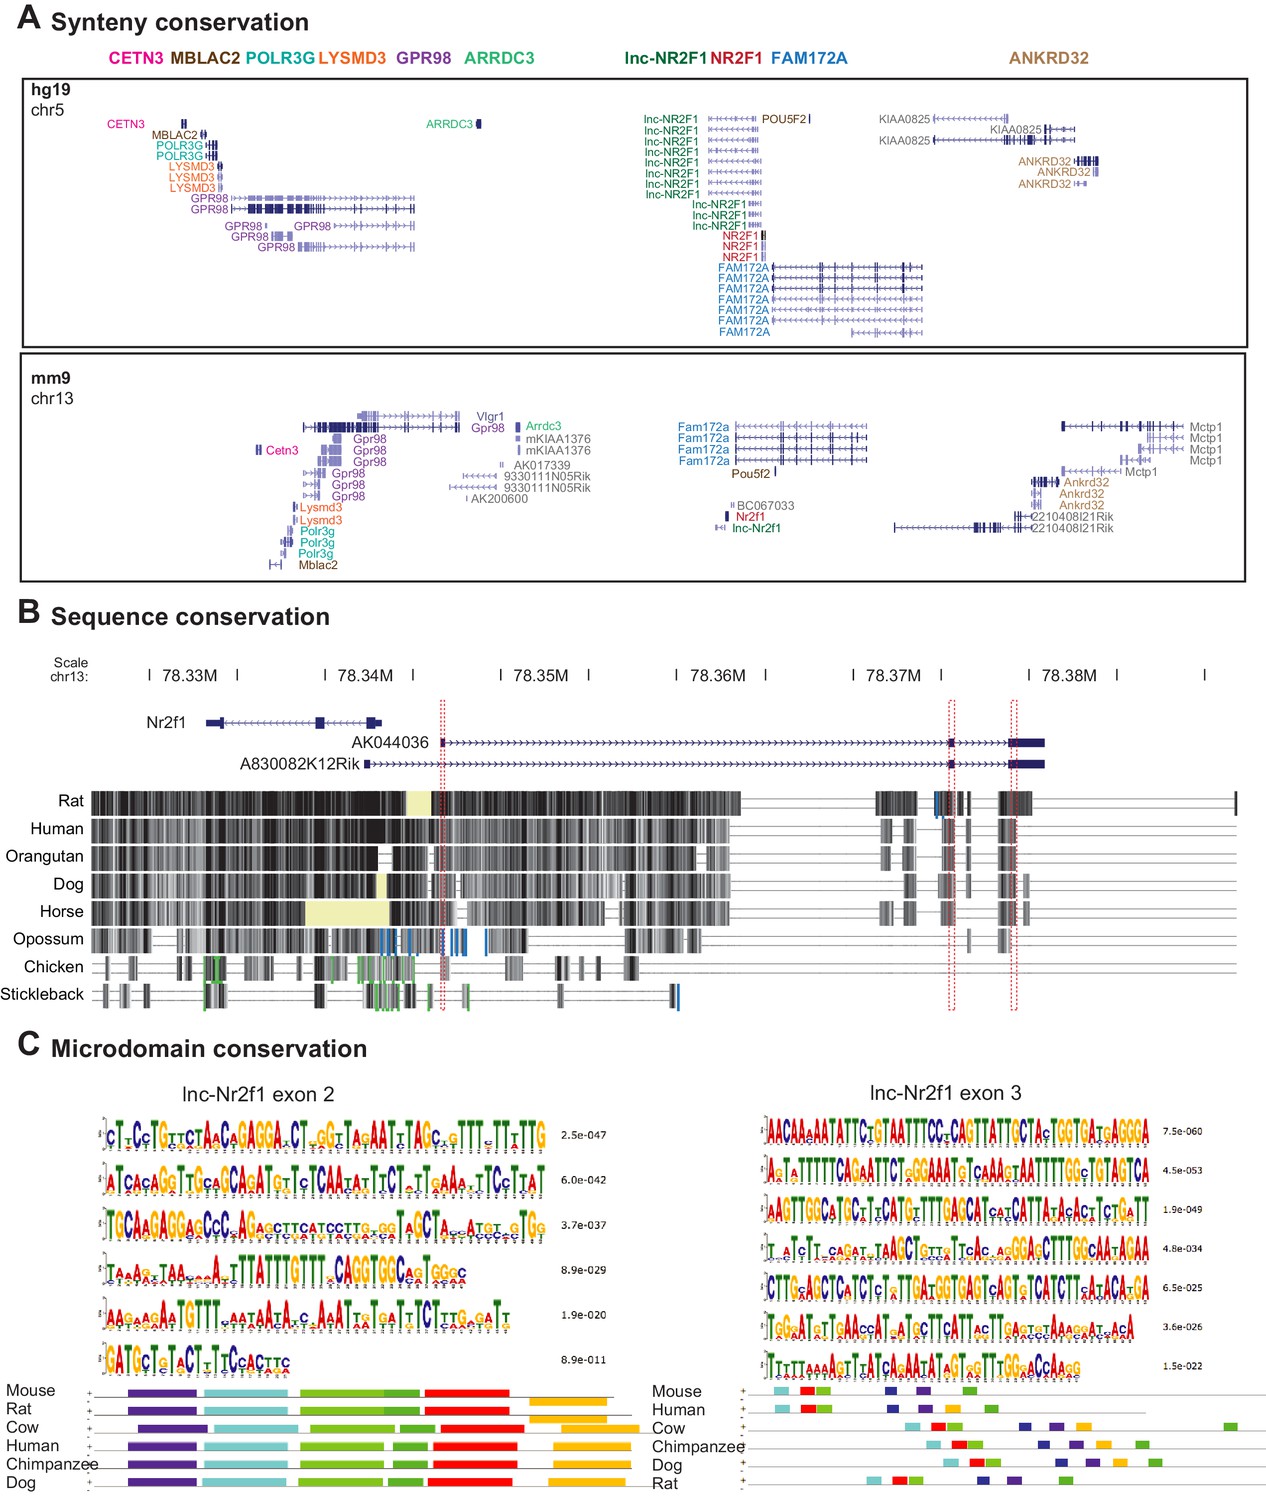
Synteny, sequence and microdomain conservation of lnc-NR2F1.
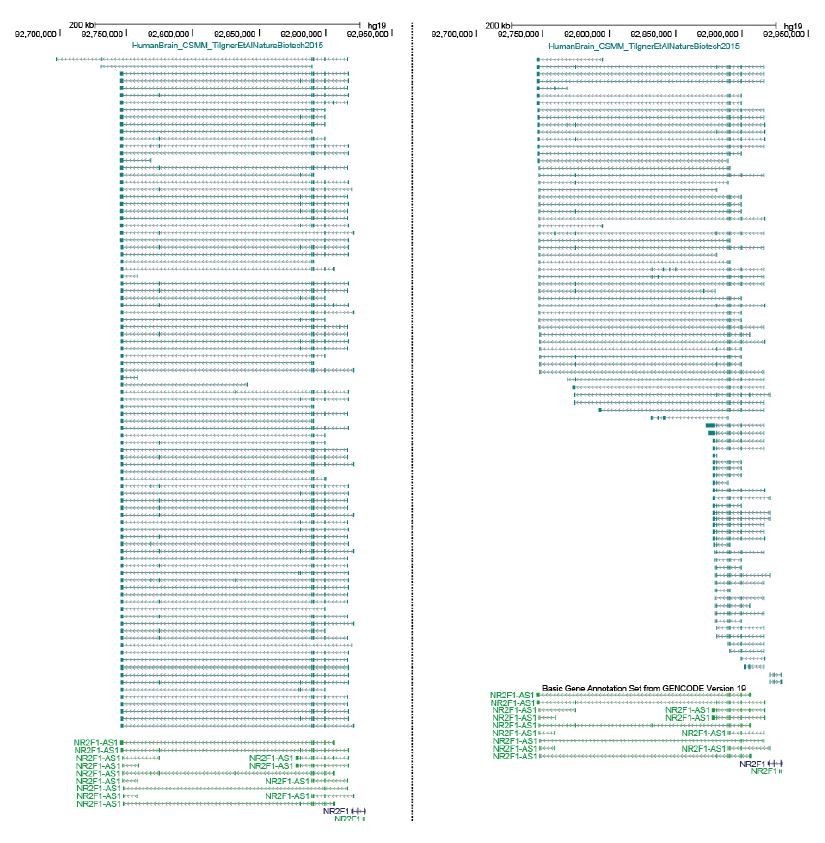
(A) UCSC browser track for human (top) and mouse (bottom) showing synteny conservation around the lnc-Nr2f1 – Nr2f1 locus. The same gene between the two species is color-coded (B) UCSC browser track showing the sequence conservation of the three exons (highlighted in red) across different species. (C) Sequences around the conserved exons show short sequence homology from different species. MEME (http://meme-suite.org/tools/meme) is used to discover motif homology. See Supplementary documents for the sequences used.
Figure 2—figure supplement 2

Characterization of lnc-Nr2f1 localization.
(A) RPKM counts for lnc-Nr2f1 during MEF-to-iN-reprogramming and across different stages and tissues of mouse brain development. (B) Control in situ hybridization for NR2F1 and lnc-Nr2f1 using sense probe. (C) Control single molecule RNA-FISH in MEFs infected with rtTA alone in order to determine background signal.
Figure 3 with 2 supplements
Mouse Lnc-Nr2f1KO reveals lnc-Nr2f1 regulates neuronal genes.
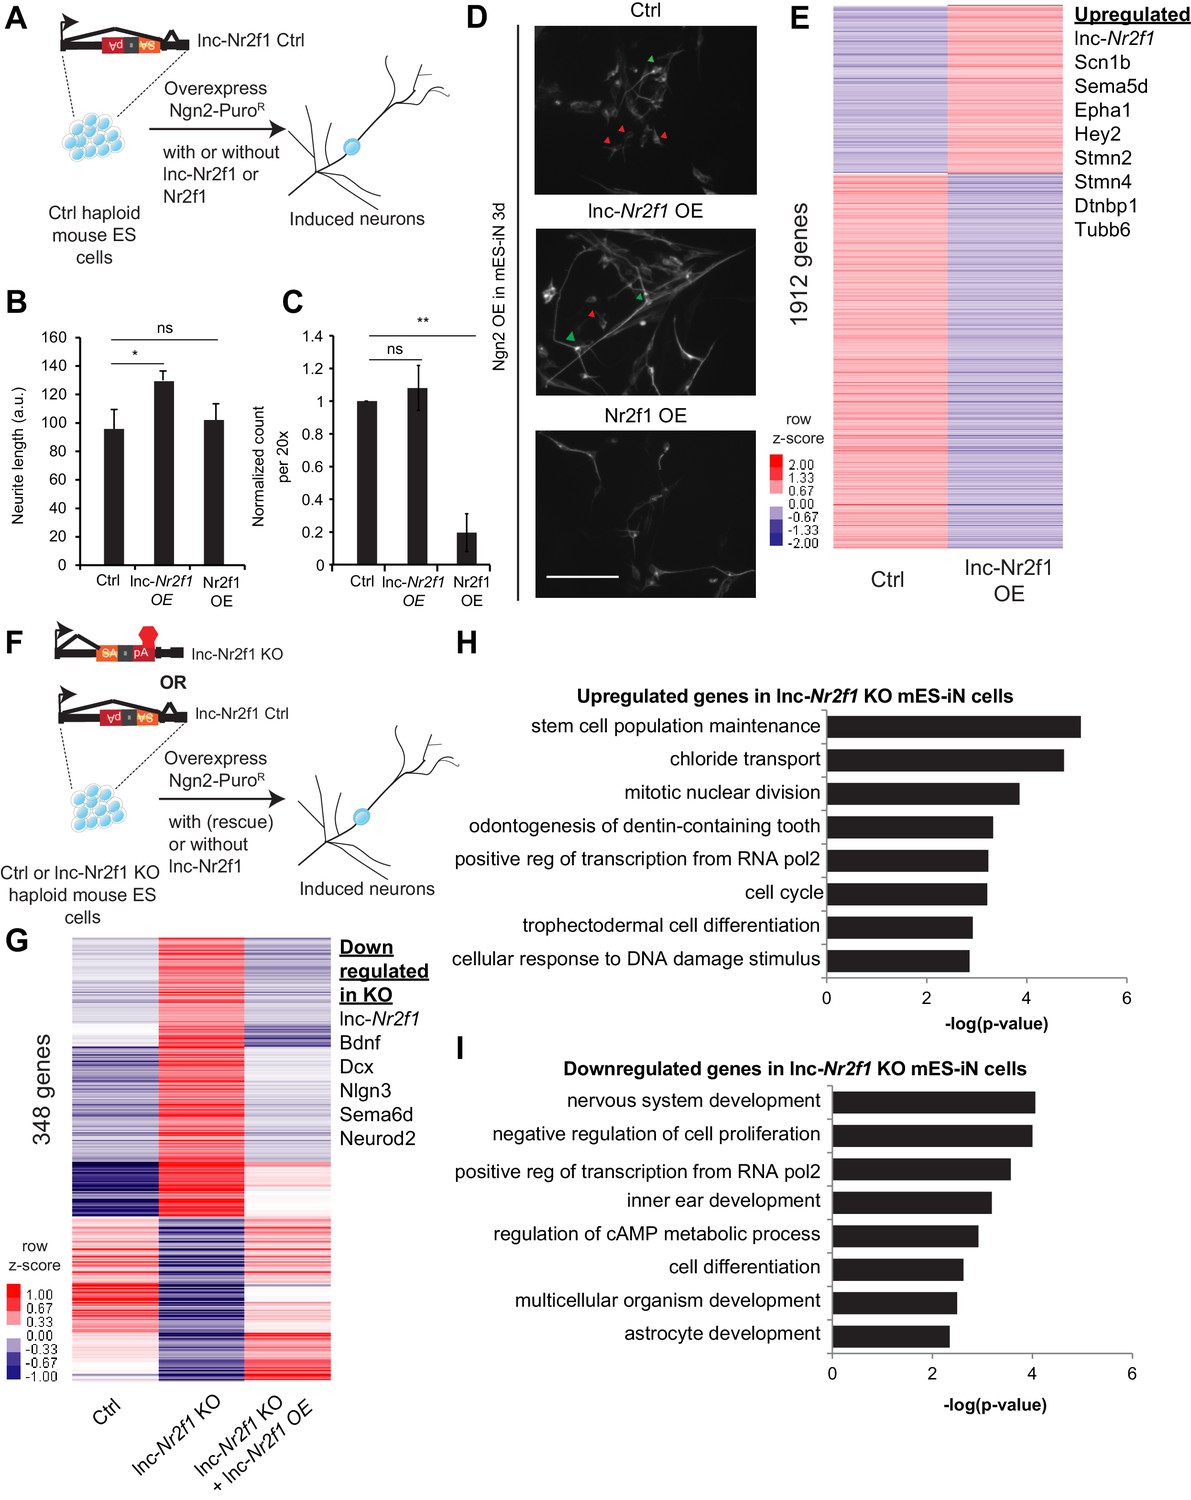
(A) Schematic showing the experimental strategy for lnc-Nr2f1 overexpression. In control mouse ES cells, an inverted construct with a splice acceptor (marked in yellow) and a polyadenylation signal (marked in red) are added after the first exon of the lnc-Nr2f1. The mouse ES were infected with rtTA and Ngn2-T2A-puro and mES derived induced neurons (mES-iN) were assayed after 3 or 4 days after dox induction. (B) Graph showing that overexpression of lnc-Nr2f1 increased the neurite length in day 3 Ngn2 mouse ES derived iN cells relative to the Ctrl. The same effect was not seen with Nr2f1 overexpression. For each replicate, the individual neurite length for all neurons in each of the five 20x field was manually traced in Fiji. The sequence used for mouse lnc-Nr2f1 overexpression is available in the supplementary document (n = 3, Student t-test, Two-tailed, * indicates p=0.048 < 0.05). Error bars show s.e.m. (C) Graph showing that overexpression of Nr2f1 decreased the neurite number in day 3 Ngn2 mouse ES-iN cells relative to the Ctrl. The same effect was not seen with lnc-Nr2f1 overexpression. (n = 3, 10 field per replicate, Student t-test, Two-tailed, ** indicates p=0.0022 < 0.01). Error bars show s.e.m. (D) β-III-tubulin staining of the day 3 Ngn2 mouse ES derived iN cells for Ctrl, lnc-Nr2f1 overexpression and Nr2f1 overexpression. Scale bar = 50 µm. Red arrow pointed at immature induced neuronal cells with short projection. Green arrow pointed at mature induced neuronal cells with longer projection. Note that the lnc-Nr2f1 overexpression condition have more mature induced neuronal cells. (E) Hierarchical clustering heatmap of day 4 Ngn2 ES-iN cells between control and lnc-Nr2f1 overexpression (OE). There are 1912 genes differentially expressed (n = 2, FDR corrected p<0.10, Fold change >1.5 fold). Listed to the right are genes which are upregulated upon lnc-Nr2f1 overexpression. (F) Schematic showing the knocking out strategy for lnc-Nr2f1. The lnc-Nr2f1 knockout mouse ES cells are generated after Cre recombinase introduction to the Ctrl line in Figure 3A. The mouse ES were infected with rtTA and Ngn2-T2A-puro and mES derived induced neurons were assayed after 3 or 4 days after dox induction. (G) Hierarchical clustering heatmap of day 4 Ngn2 ES-iN cells between wild type, lnc-Nr2f1 knockout (KO) and lnc-Nr2f1 knockout with lnc-Nr2f1 overexpression (OE). There are 348 genes differentially expressed and can be subsequently rescued with lnc-Nr2f1 overexpression (n = 2, FDR corrected p<0.10). Listed to the right are genes which are upregulated upon lnc-Nr2f1 KO. (H) Gene ontology of the upregulated genes in lnc-Nr2f1 knockout day 4 Ngn2 mouse ES- iN cells as compared to the Ctrl. (I) Gene ontology of the downregulated genes in lnc-Nr2f1 knockout day 4 Ngn2 mouse ES- iN cells as compared to the Ctrl.
Figure 3—figure supplement 1
Characterization of the roles of lnc-Nr2f1 during iN reprogramming.
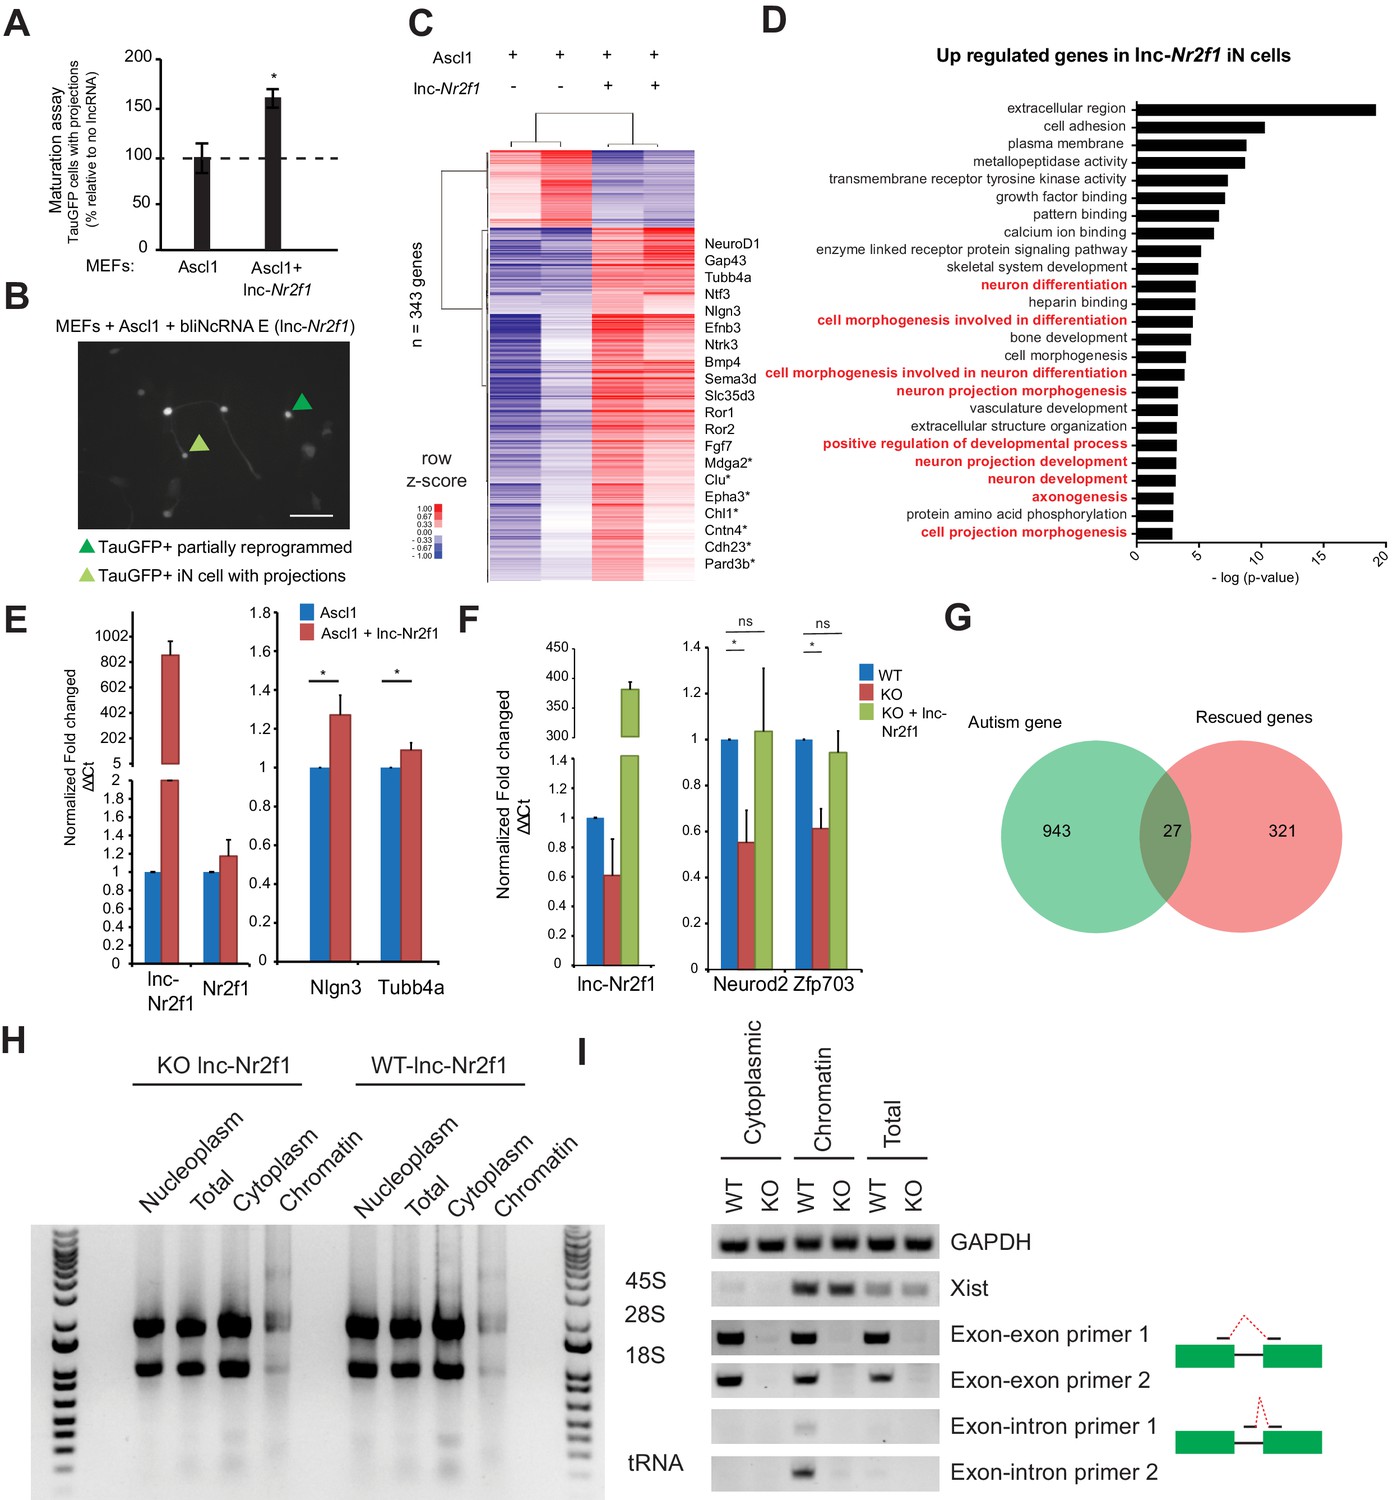
(A) Percentage of TauGFP positive cells with projections normalized to number of TauGFP cells. TauGFP cells with projections longer than three times the diameter of the cell body were counted and normalized to the total number of TauGFP positive cells. The sequence for mouse lnc-Nr2f1 is available in the supplementary documents (n = 4, Student t-test, Two tailed, Error bars show s.e.m). (B) Immunofluorescence staining depicting how a TauGFP positive cell with projections (example highlighted in light green) is differentiated from a TauGFP positive partially reprogrammed iN cell (example highlighted in dark green) at 7 days. Scale bar = 50 µm. (C) Hierarchical clustering heatmap of differentially expressed genes detected by RNA-seq in MEFs expressing Ascl1 alone compared to Ascl1 and lnc-Nr2f1 after 7 days (n = 2 biological replicates, FDR corrected p<0.001). Shown are 343 genes. 311 genes are upregulated and 32 genes are downregulated. Fold change is represented in logarithmic scale normalized to the mean expression value of a gene across all samples. Representative gene names are included. Those with (*) have been linked to neurological disorders curated by Basu et al. (D) Gene ontology of the upregulated genes upon lnc-Nr2f1 overexpression in Ascl1 MEF-iN 7 days. Highlighted in red are neuronal GO terms. (E) qRT-PCR validation downstream neuronal genes of the RNA-sequencing results in Figure 1—figure supplement 3C. Ectopic expression of lnc-Nr2f1 led to upregulation of several downstream neuronal genes. (n = 3, * indicates p<0.05). Error bars show s.e.m (F) qRT-PCR validation of several target genes in Figure 3G that go down when lnc-Nr2f1 is knocked out which can be subsequently rescued with lnc-Nr2f1. (n = 4, * indicates p<0.05). Error bars show s.e.m. (G) Venn diagram representing the overlap between autism related genes and rescued genes fromFigure 3G. (p=0.0015, χ2 = 10.097, DF = 1, Chi square test) (H) Non-denaturing TAE agarose gel showing the different species of RNA in different fractions. Note the presence of 45S in the chromatin fraction and tRNA and 5S in the cytoplasmic fraction. (I) RT-PCR performed on day4 mES iN using different primers targeting GAPDH (positive control), Xist (nuclear control), two independent exon-exon/exon-intron primers. WT and KO represent lnc-Nr2f1 wild-type and knock-out mES-iN respectively.
Figure 3—figure supplement 2
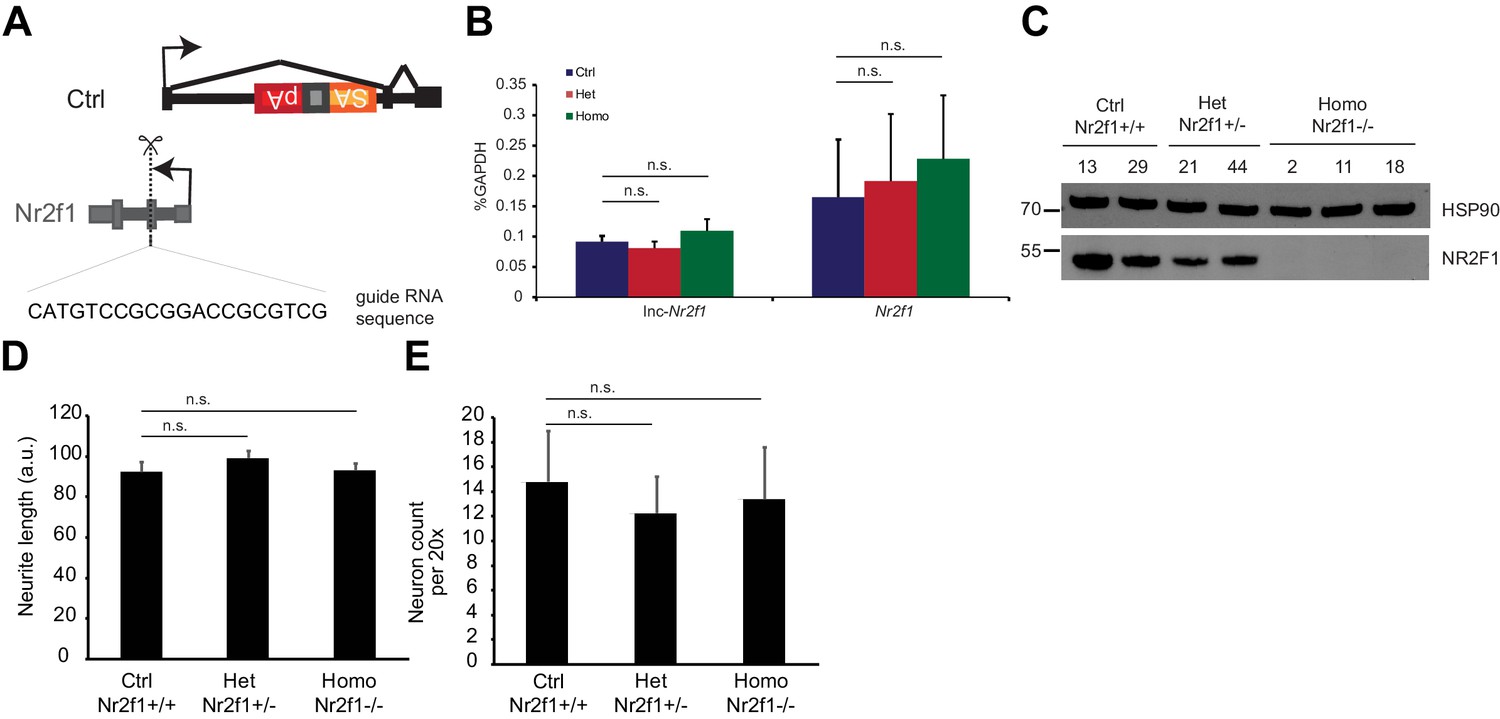
Characterization of the epistasis relationship between mouse Nr2f1 and lnc-Nr2f1.
(A) CRISPR knock out strategy to generate Nr2f1 knockout (Homo) and heterozygous null lines (Het) from the control mES cells (Ctrl). (B) qRT-PCR results for lnc-Nr2f1 and Nr2f1 in the Ctrl, Nr2f1 heterozygous null and Nr2f1 knock out day 4 Ngn2 mES-iN. (n = 4 for Ctrl and Homo, n = 6 for Het; n.s. denotes not significant by two tailed t test) (C) Western blot showing the level of NR2F1 for individual clones of Ctrl, Het and Homo for day 4 Ngn2 mES-iN. (D) Neurite length measurement of the Ngn2 day 3 mES iN cells generated from the Nr2f1 Ctrl, Het or Homo lines. (n = 4 for Ctrl and Homo, n = 6 for Het) (n.s. indicates p<0.05). (E) Number of neurons per 20x the Ngn2 day 3 mES iN cells generated from the Nr2f1 Ctrl, Het or Homo lines. (n = 4 for Ctrl and Homo, n = 6 for Het) (n.s. indicates p<0.05).
Figure 4 with 1 supplement
lnc-Nr2f1 binds to distinct genomic loci regulating neuronal genes.
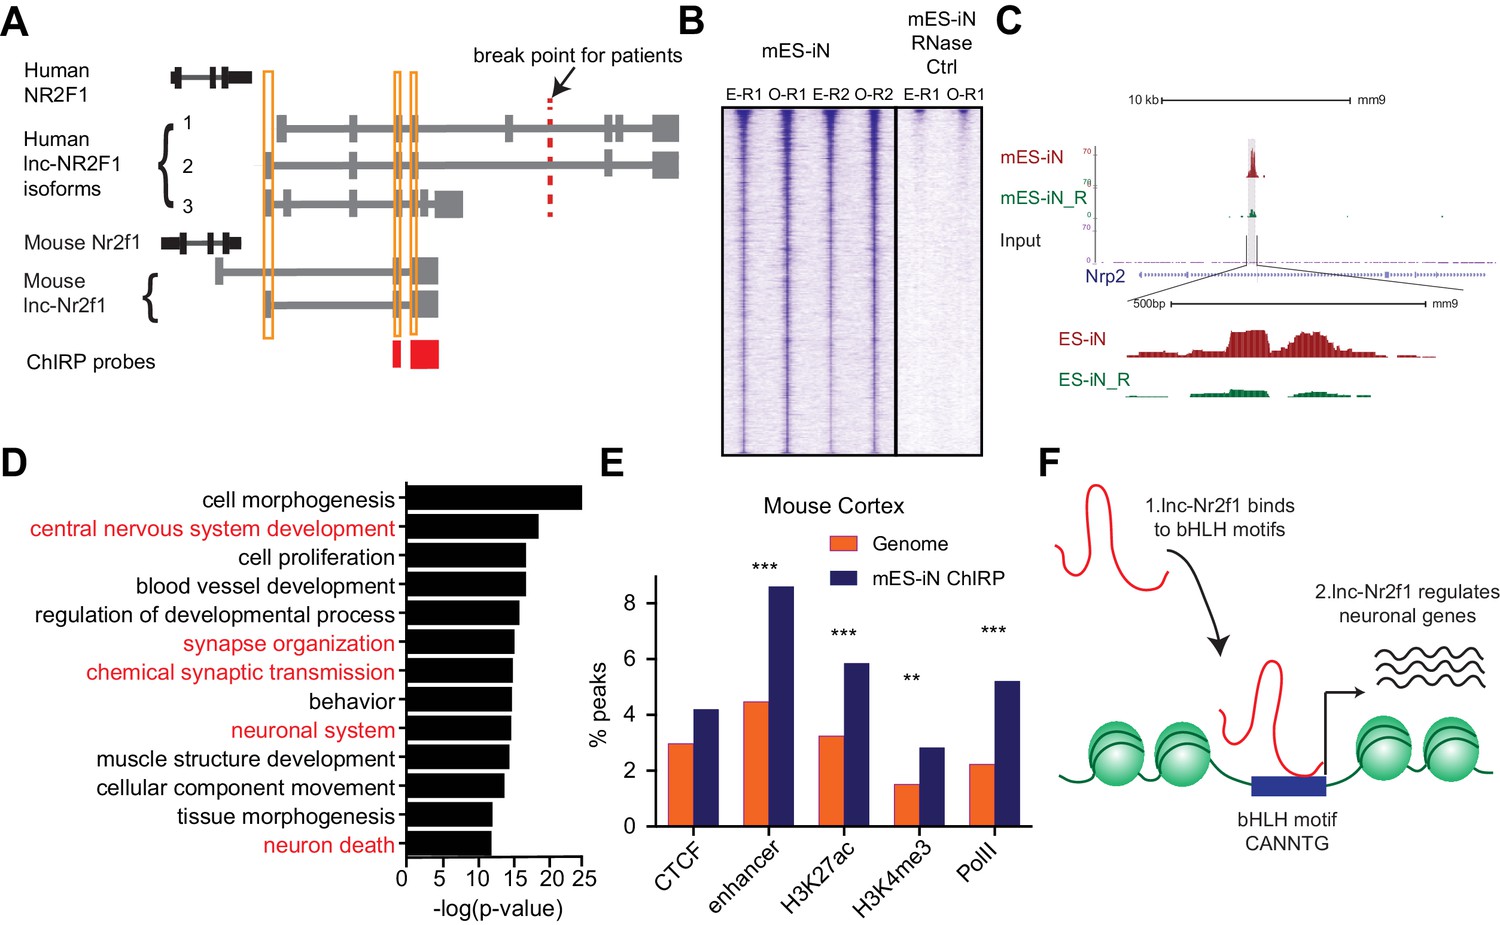
(A) Schematic showing the location of ChIRP probe for mouse lnc-Nr2f1 (highlighted in red). Yellow lines represent the conserved exons between mouse and human lnc-Nr2f1. (B) Heatmaps representing genome-wide occupancy profile for mouse lnc-Nr2f1 in day 4 Ngn2 mouse ES- iN cells and the RNase control obtained by ChIRP. There are 14975 significant peaks called with respect to the RNase treated control. E and O represents even and odd probes respectively. (C) UCSC browser track showing the binding site within the intronic region of Nrp2. The ‘R’ represents the RNase treated control. (D) Gene ontology terms associated with genes adjacent to the high confident mES-iN ChIRP-seq peaks. Terms highlighted in red are terms related to nervous system development. (E) Percentage of mES-iN ChIRP-seq peaks which overlap with CTCF, enhancer, H3K27ac, H3K4Me3 and PolII defined in mouse cortex relative to the control. (*** represents p<0.0001, ** represents p<0.01, Chi-square test) (F) Proposal mechanism of lnc-Nr2f1 action. lnc-Nr2f1 binds to the genomic region enriched with bHLH motif and regulates the downstream neuronal genes.
Figure 4—figure supplement 1
Identification of lnc-NR2F1 role in transcriptional regulation.
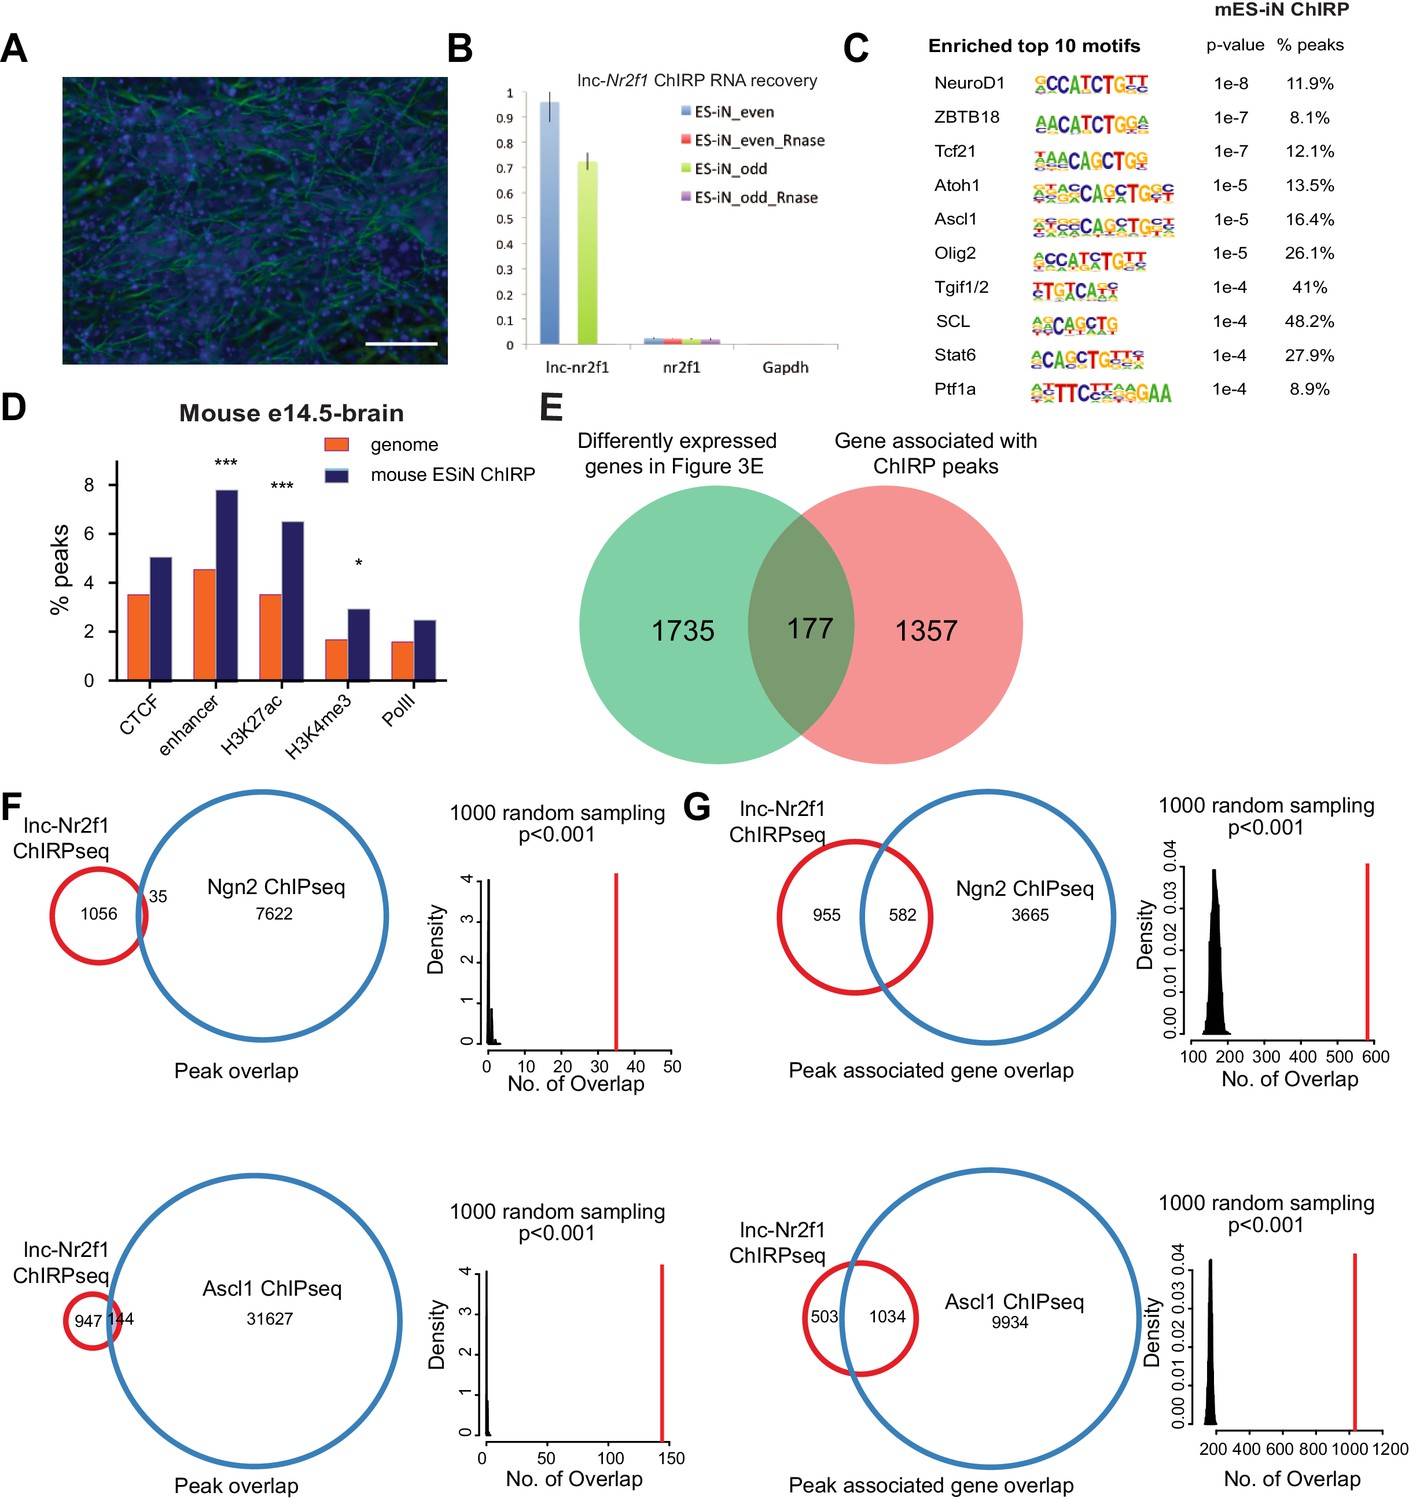
(A) Immunofluorescence staining for the day four mouse embryonic stem cell derived induced neurons (mES-iN) used in the lnc-Nr2f1 ChIRP. (Green=β-III-tubulin, Blue = DAPI) (Scale bar = 50 µm) (B) Lnc-Nr2f1 RNA pull down efficiency for both even and odd probes (C) The enriched motifs with their corresponding p-value and the percentage of peaks with the given motifs. (D) Percentage of mES-iN ChIRP-seq peaks which overlap with CTCF, enhancer, H3K27ac, H3K4Me3 and PolII defined in mouse E14.5 brain relative to the control. (*** represents p<0.0001, * represents p<0.05, Chi-square test) (E) Venn diagram showing the overlap between 1912 genes from Figure 3E, and the 1534 genes adjacent to the 1092 high confident mES-iN ChIRP peaks. (p<0.0001, χ2 = 21.983, DF = 1, Chi square test) (F) Venn diagram and statistical analysis of the overlapped peaks between lnc-Nr2f1 ChIRP-seq peaks and Ngn2 (top) or Ascl1 (bottom) ChIP-seq peaks. Right panels are the null distribution of overlapped peaks constructed by 1000 random sampling. The number of overlap peaks in the observed data is marked in solid red line. (G) Venn diagram and statistical analysis of the overlapped peak-associated-genes between lnc-Nr2f1 ChIRP-seq and Ngn2 (top) or Ascl1 (bottom) ChIP-seq. Right panels are the null distribution of overlapped genes constructed by 1000 random sampling. The number of overlap genes in the observed data is marked in solid red line.
Figure 5 with 1 supplement
Human lnc-NR2F1 shows isoform-specific chromatin binding.
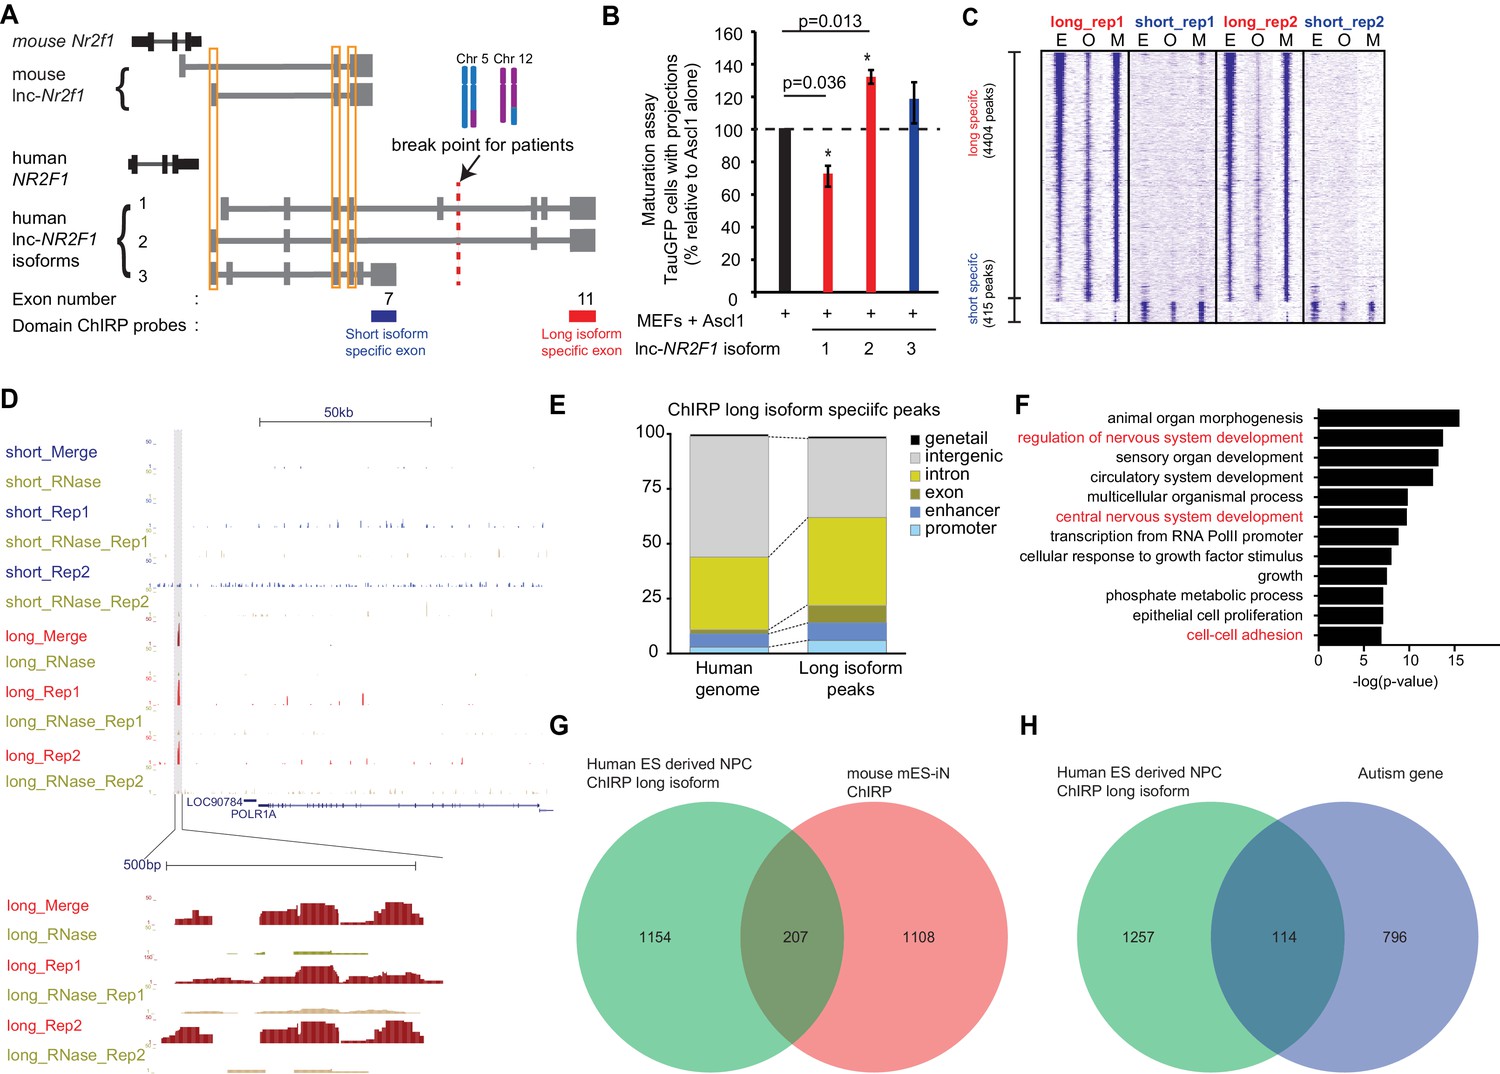
(A) Schematic showing the location of the ChIRP probes target the short isoform-specific exon (exon 7) and long isoform-specific exon (exon 11). The red line denotes the break point for the patient. (B) Overexpression of human lnc-NR2F1 isoforms in combination with Ascl1 relative to MEFs expressing Ascl1 alone. The graph quantifies the proportion of TauGFP positive cells with projections normalized to number of TauGFP cells. TauGFP cells with projections longer than three times the diameter of the cell body were counted and normalized to the total number of TauGFP positive cells. The sequences for human lnc-Nr2f1 isoforms is available in the supplementary documents (n = 3, Student t-test, two tailed, scale bar= * represents p<0.05, ** represents p<0.01). Error bars show s.e.m. (C) Heatmap representing genome-wide occupancy profile for domain ChIRP performed using probes specific to the long and short isoform-specific exon of lnc-NR2F1 in human ES derived neural progenitor cells (NPC). There are 4404 and 415 significant peaks called relative to the RNase control for the long and short isoform respectively. E, O and M represents even, odd and merge track respectively. (D) UCSC browser track showing the site within the promoter region of LOC90784 bound by the long isoform-specific exon (exon 11) but not the short isoform-specific exon (exon 7) (E) Bar graph showing the distribution of the 913 high confident long isoform-specific peaks. The long isoform-specific peaks are enriched in the introns, exons, promoters and enhancers but depleted in the intergenic regions. (F) Gene ontology terms associated with genes adjacent to the human ES derived NPC ChIRP-seq high confident peaks. Terms highlighted in red are terms related to nervous system development. (G) Venn diagram representing the peak associated gene overlap between the domain ChIRP of the long isoform-specific exon (exon 11) from human ES derived NPC and mouse mES-iN ChIRP. (p<0.0001, χ2 = 239.921, DF = 1, Chi square test) (H) Venn diagram representing overlap between genes involved in the autism risk and genes identified by the domain ChIRP of the long isoform-specific exon (exon 11) from human ES derived NPC. (p<0.0001, χ2 = 71.670, DF = 1, Chi square test).
Figure 5—figure supplement 1

Identification of lnc-NR2F1 role in transcriptional regulation.
(A) Immunofluorescence staining for day 12 human neural progenitor cells (hNPC) differentiated from H9 cells using dual SMAD protocol. (Green = human NESTIN, Red = human SOX1, Blue = DAPI) (Scale bar = 50 µm) (B) qRT-PCT using primers specific to the common, long or short exon in day 12 hNPC. (n = 3). (C) Lnc-NR2F1 RNA pull down efficiency for the long and short isoform-specific exons of for both even and odd probes. The pull down is specific to lnc-NR2F1 since there is very little NR2F1 or GAPDH. (D) ChromHMM model ran on the peaks from the high confident long isoform-specific exon (exon 11) ChIRP peaks performed in hNPC. The peaks are enriched in the promoters and TSSs, active enhancers and quiescent chromatin regions. (E) The enriched transcription factor motifs for the long isoform-specific domain ChIRP experiments in hNPC. (F) Heatmap showing the gene expression changes in a human neuroblastoma cell line (SK-N-SH) upon overexpression of human lnc-NR2F1 isoform 1, 2 and 3 respectively normalized to the control (>2 fold, p<0.05, FDR < 0.05). The box below the heatmap shows the number of genes significantly upregulated or downregulated.
Author response image 1
Author response image 2
Author response image 3
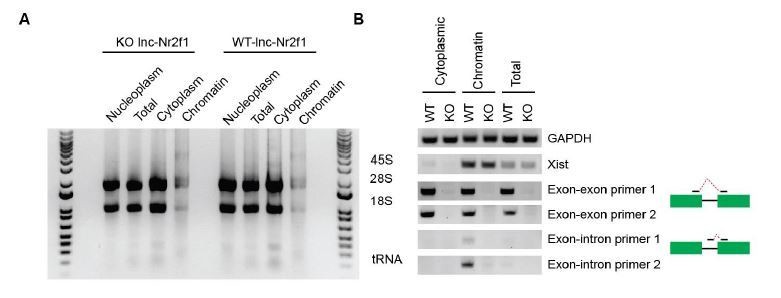
(A) Gel showing the different RNA species in different cellular fractions.
The protocol reported by Conrad et al., 2017 was used. (B) Gel showing the RT-PCR using cytoplasmic or chromatin fractions using GAPDH (positive control), Xist (nuclear localized), two independent exon-exon and exon-intron primers.
Tables
Key resources table
| Reagent type (species) or resource | Designation | Source | Identifier | Additional information |
|---|---|---|---|---|
| Antibody | Rabbit polyclonal anti-H3 | Abcam | ab1791 (RRID:AB_302613) | |
| Antibody | Goat polyclonal anti-Sox1 | R and D | AF3369 (RRID:AB_2239879) | IHC (1:50) |
| Antibody | Rabbit polyclonal anti-β-III-tubulin | Covance | Discontinued | IHC (1:1000) |
| Antibody | Mouse monoclonal anti-Nestin | R and D | MAB1259 (RRID:AB_2251304) | IHC (1:1000) |
| Antibody | Rabbit monoclonal anti-HSP90 | Cell Signalling | 4877 (RRID:AB_2233307) | WB (1:2500) |
| Antibody | Rabbit monoclonal anti-Nr2f1 | Cell Signalling | 6364 (RRID:AB_11220432) | WB (1:1000) |
| Chemical compound, drug | SB431542 | Tocris | 1614 | |
| Chemical compound, drug | LDN198189 | MiliporeSigma | 5.09882.0001 | |
| Chemical compound, drug | CHIR99021 | StemGent | 04–0004 | |
| Chemical compound, drug | PD0325901 | Axon | 1408 | |
| Chemical compound, drug | Leukemia Inhibitory Factor | Generated in the lab | ||
| Cell line (H. Sapiens) | Human: 293T | ATCC | CRL-3216 (RRID:CVCL_0063) | |
| Cell line (H. Sapiens) | Human: H9 hESC line | UWisconsin | H9 (RRID:CVCL_9773) | |
| Cell line (H. Sapiens) | Human: SK-N-SH | ATCC | HTB-11 (RRID:CVCL_0531) | |
| Cell line (Mus musculus) | Tau: EGFP Mouse embyronic fibroblasts | Generated in the lab | ||
| Cell line (Mus musculus) | Mouse: Haploid ES cells | Obtained from Penninger lab (Elling et al. 2011) | ||
| Genetic reagent (M. musculus) | B6.129S4(Cg)-Mapttm1(EGFP)Klt/J | Jackson | 29219 (RRID:IMSR_JAX:004779) | |
| Recombinant DNA reagent | TetO-lnc-Nr2f1 (Mouse) | This paper | ||
| Recombinant DNA reagent | TetO-lnc-NR2F1-I PGK blast (Human) | This paper | ||
| Recombinant DNA reagent | TetO-lnc-NR2F1-II PGK blast (Mouse) | This paper | ||
| Recombinant DNA reagent | TetO-lnc-NR2fF1-III PGK blast (Mouse) | This paper | ||
| Recombinant DNA reagent | TetO-NR2F1 (Mouse) | This paper |
Additional files
-
Supplementary file 1
Diagnostic comparison between studies of patients with affected lnc-NR2F1 locus.
Related to Figure 2 (A) Summary of diagnosis for previously reported patients, including patient CMS12200 described in this study. Highlighted in grey are the shared diagnostic features across patients. Adapted figure (Al-Kateb et al., 2013).
- https://doi.org/10.7554/eLife.41770.017
-
Supplementary file 2
CHIRP sequencing probes used in the study
- https://doi.org/10.7554/eLife.41770.018
-
Supplementary file 3
Public datasets used in the study
- https://doi.org/10.7554/eLife.41770.019
-
Supplementary file 4
qRT-PCR primers used in the study
- https://doi.org/10.7554/eLife.41770.020
-
Supplementary file 5
RNA FISH primers used in the study
- https://doi.org/10.7554/eLife.41770.021
-
Supplementary file 6
Sequence conservation used in the study
- https://doi.org/10.7554/eLife.41770.022
-
Supplementary file 7
A list of human lncRNAs reported in the study
- https://doi.org/10.7554/eLife.41770.023
-
Supplementary file 8
A list of mouse lncRNAs reported used in the study
- https://doi.org/10.7554/eLife.41770.024
-
Transparent reporting form
- https://doi.org/10.7554/eLife.41770.025
Download links
A two-part list of links to download the article, or parts of the article, in various formats.
Downloads (link to download the article as PDF)
Open citations (links to open the citations from this article in various online reference manager services)
Cite this article (links to download the citations from this article in formats compatible with various reference manager tools)
The novel lncRNA lnc-NR2F1 is pro-neurogenic and mutated in human neurodevelopmental disorders
eLife 8:e41770.
https://doi.org/10.7554/eLife.41770


