Developmental 'awakening' of primary motor cortex to the sensory consequences of movement
- University of Iowa, United States
Figures
Figure 1 with 2 supplements
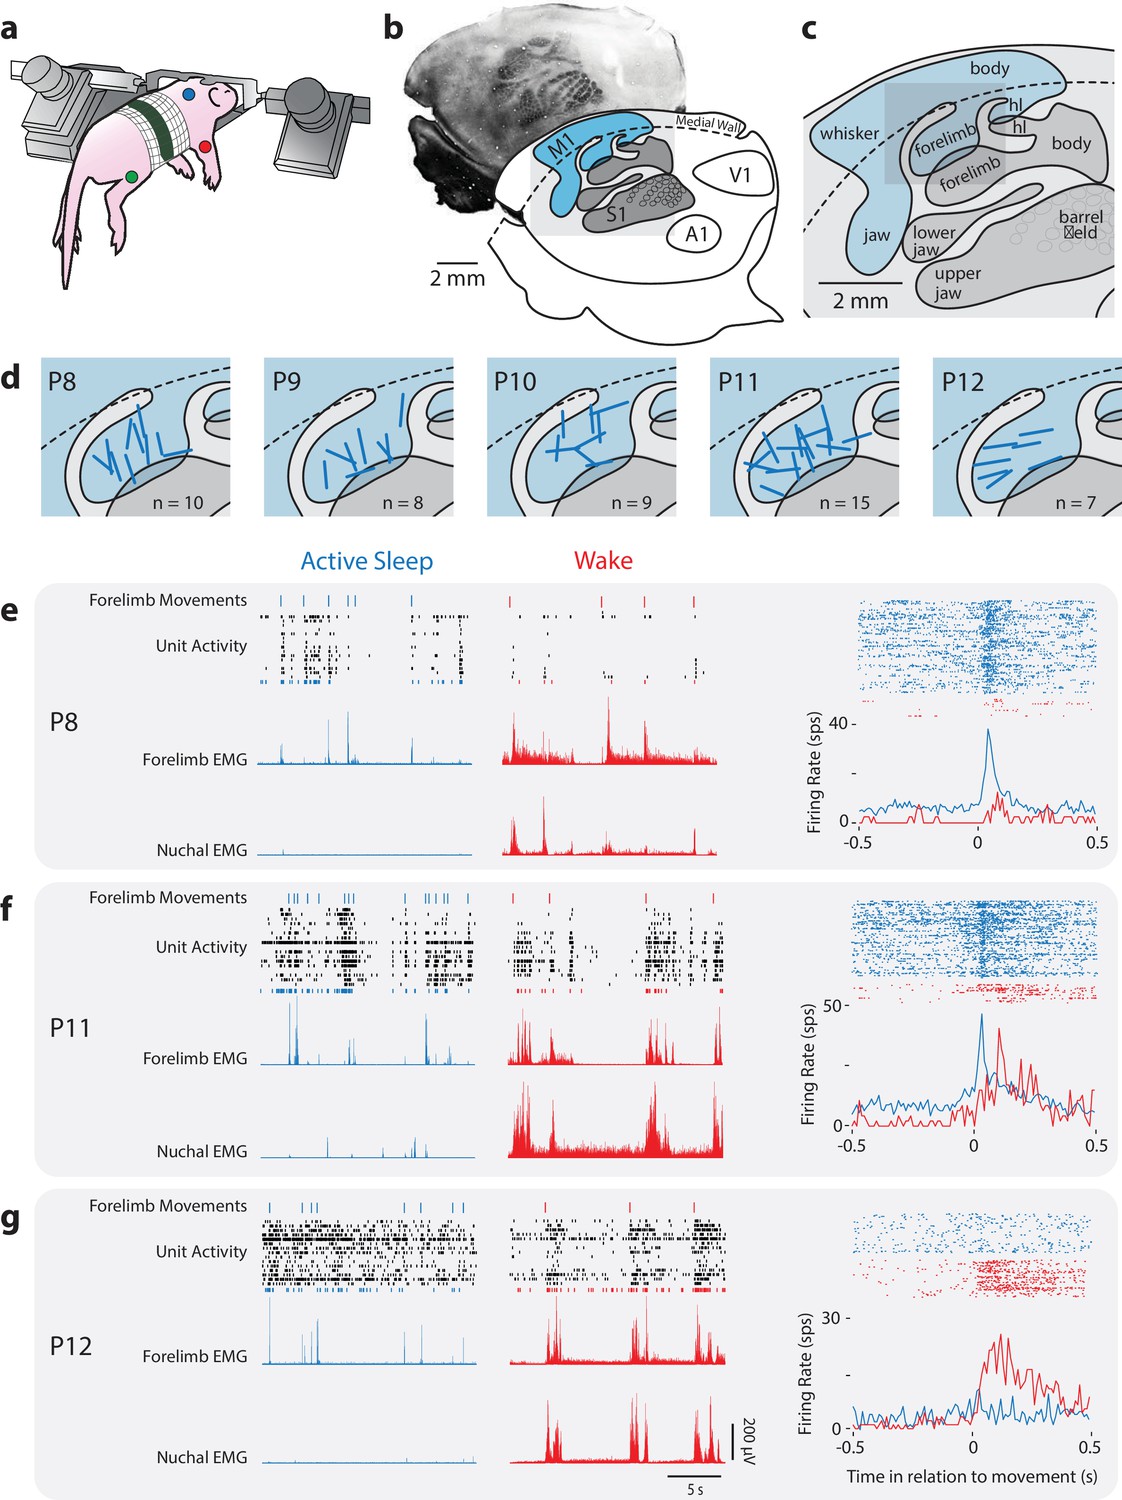
Rapid developmental transition in M1 sensory responsiveness.
(a) The method used to record electrophysiologically from a head-fixed pup. Dots denote locations of the EMGs (forelimb, red; hindlimb, green; nuchal muscle, blue). (b) Top: Flattened cortex sectioned tangentially to the surface and stained for cytochrome oxidase (CO); primary somatosensory cortex (S1) appears darker than the surrounding tissue. Bottom: Boundaries of primary sensory areas from CO-stained tissue, illustrating S1 and primary motor cortex (M1), as well as primary auditory (A1) and visual (V1) cortex. (c) Enlargement of gray box in (b) showing the somatotopic organization within S1 and M1. hl: hindlimb. (d) Enlargement of gray box in (c) showing the locations of recording sites (blue bars) within the forelimb representation of M1. (e) Left: Representative data at P8 depicting 20 s periods of active sleep (blue) and wake (red), showing forelimb movements (twitches: blue ticks; wake movements: red ticks), unit activity within the forelimb representation of M1, and rectified EMGs from contralateral forelimb and nuchal muscles. Each row of depicts unit activity for a different neuron. The bottom-most neuron (blue or red), is represented further at right. Right, top: Raster sweeps for an individual M1 neuron triggered on twitches (blue) and wake movements (red), with each row representing a different movement. Right, bottom: Perievent histograms (bin size = 10 ms) showing the unit’s mean firing rate triggered on twitches (blue) or wake movements (red). (f) Same as in (e) except at P11. (g) Same as in (e) except at P12.
Figure 1—figure supplement 1
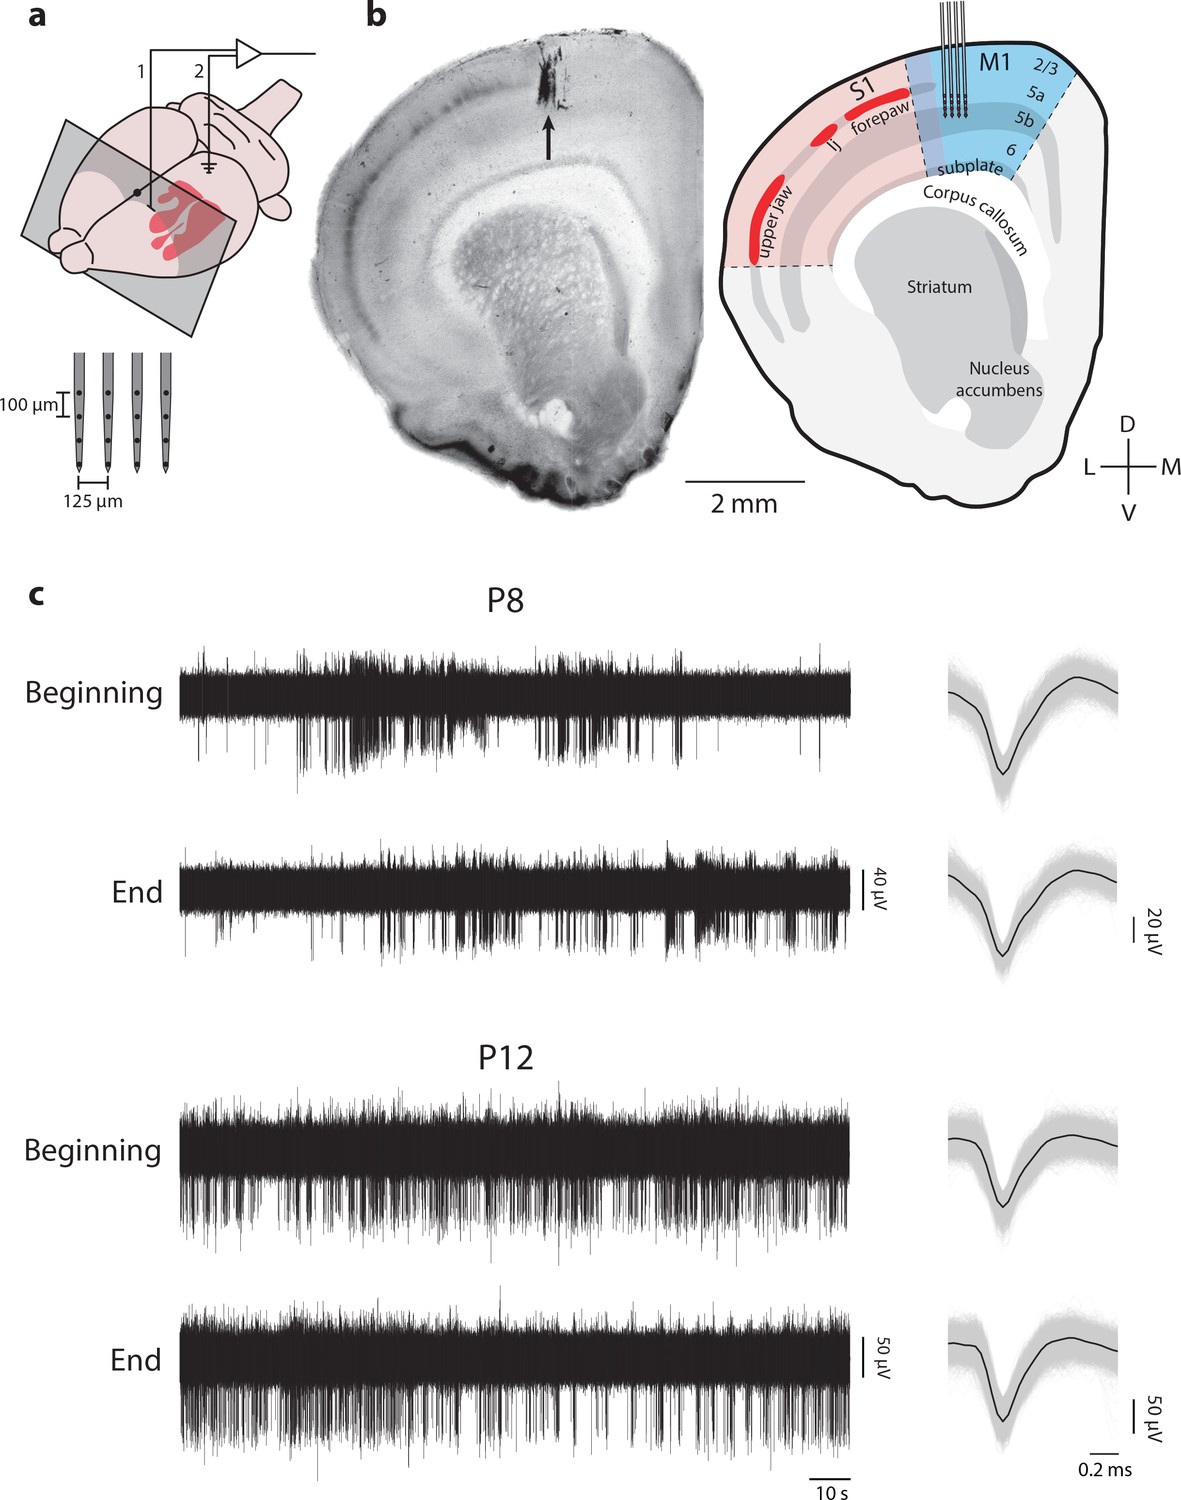
M1 recording locations in coronal perspective.
(a) Upper: Illustration of an infant rat brain showing the location of primary somatosensory cortex (S1; red), the recording location in the forelimb representation of M1 (1), and the location of the ground electrode in occipital cortex (2). Grey box shows the rostrocaudal location of the coronal sections in (b). Lower: Diagram of the 4-shank electrode used for M1 recordings. (b) Left: Coronal section stained for CO showing the electrode location (black arrow). Right: Illustration of the somatotopic representations in S1 and the laminar structures of S1 and M1. Recordings with shank electrodes were performed at a depth of 700–1200 µm, with the recording sites targeted at layer 5. lj: lower jaw. (c) Left: Representative raw MUA trace at the beginning (first 120 s) and end (last 120 s) of data collection for a P8 (top) and P12 (bottom) rat. Right: Mean waveform (black line) overlaid on all individual waveforms for the records shown at left.
Figure 1—figure supplement 2
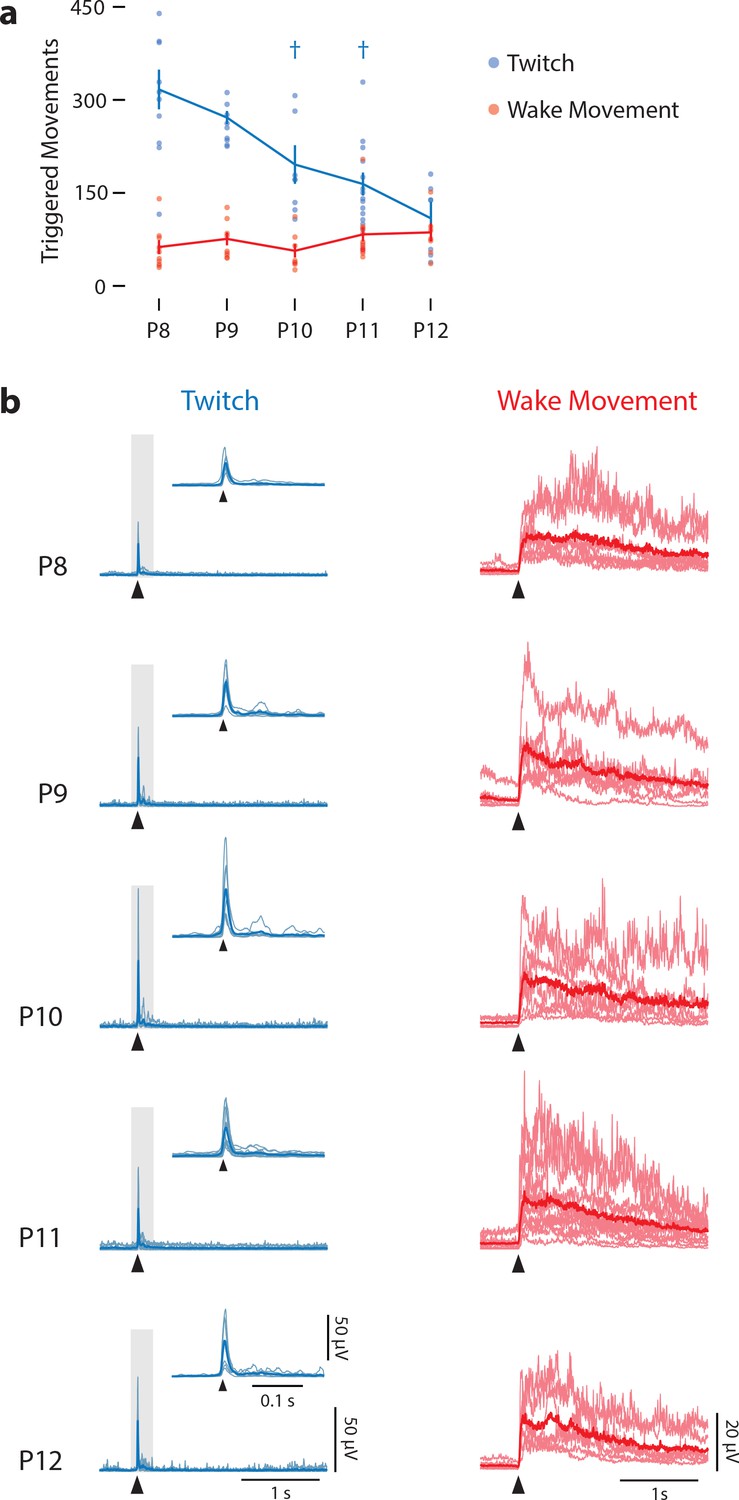
Frequency and kinematics of twitches and wake movements across age.
(a) Mean (±SEM) number of triggered twitches (blue) and wake movements (red) across all pups over 30 min of recording at each age. Dots indicate values for each individual pup. There was no effect of age on the number of wake movements, but there was for twitches. † Significant difference from two days prior (p<0.005). (b) Mean rectified EMGs for twitch (light-blue lines) and wake movements (light-red lines) for each pup at each age. Heavy blue and red lines represent median values. Arrowheads denote movement onset. For EMG records of twitches, insets are enlargements of the data in the gray rectangles.
Figure 2

Modeling reafferent responses of M1 neurons to twitches and wake movements.
(a) Gaussian function used to model M1 neural responses to twitches. Based on the model fits for twitch-triggered perievent histograms, we derived estimates of each neuron’s baseline firing rate (BL), maximum response (Rmax), peak time (Tmax), and half-width at half-height (HWHH). (b) Gaussian-exponential function used to model M1 neural responses to wake movements. The function’s rising phase is a Gaussian function, identical to that in (a). The falling phase is an exponential decay function. Parameters defined as in (a). (c) Representative perievent histograms and model fits illustrating all four neuron classifications: Twitch-responsive, unresponsive, twitch- and wake-responsive, and wake-responsive. Also shown is each neuron’s Gaussian fit (blue lines) and Gaussian-exponential fit (red lines). Fits with adjusted r2 values less than 0.35 are shown with a dotted line and fits with an adjusted r2 value greater than 0.35 are shown with a solid line. Inset in the top left corner of is each neuron’s mean waveform (black line) ±standard deviation. Vertical scale bar = 20 μV, Horizontal scale bar = 0.2 ms.
Figure 3 with 2 supplements
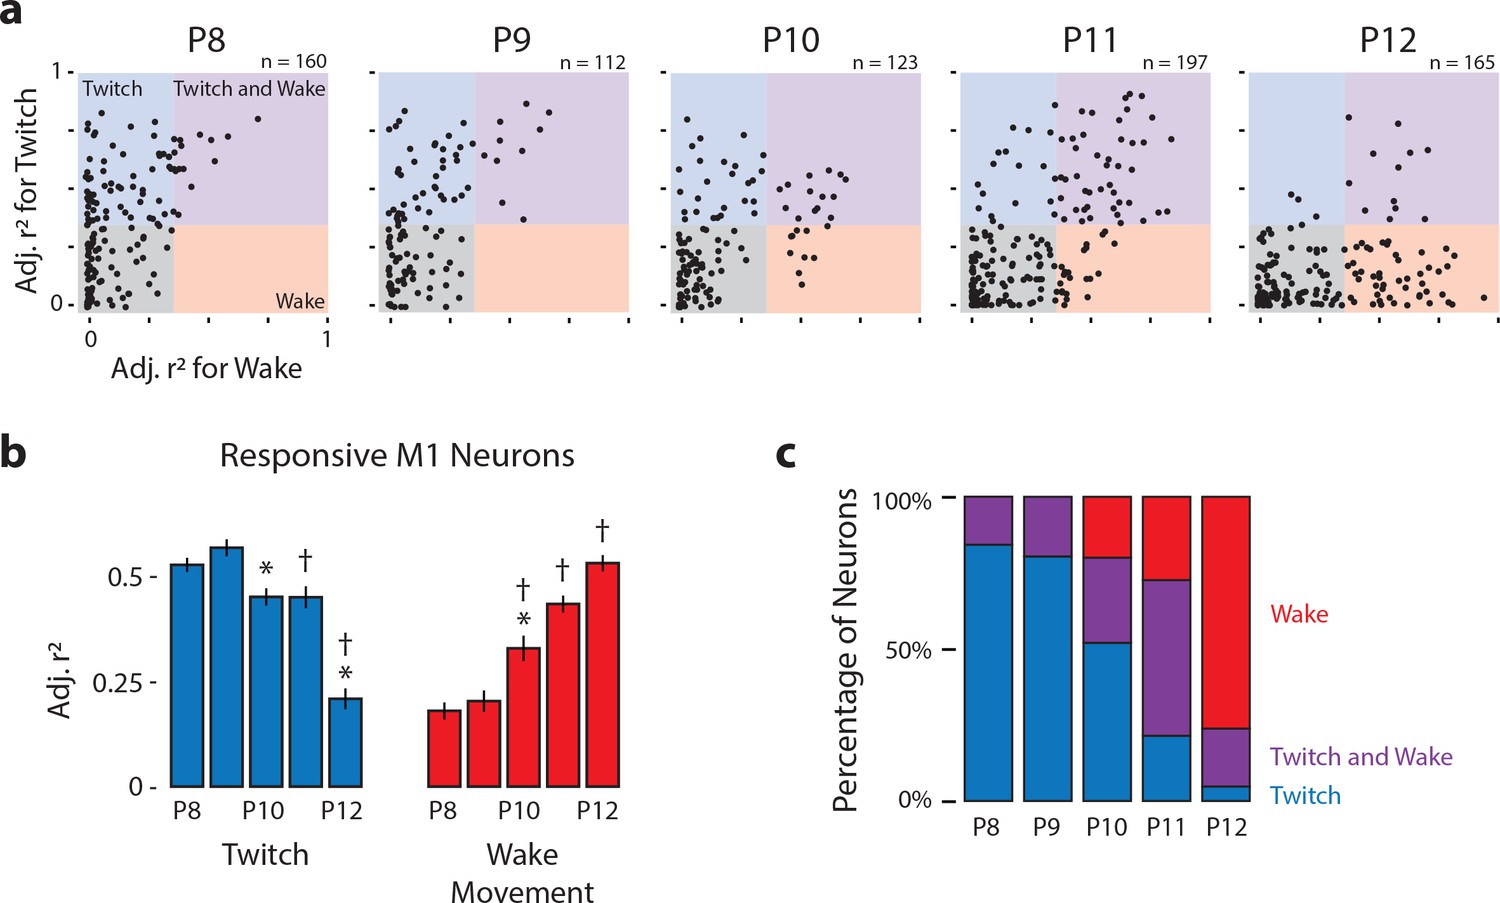
Developmental shift in the population characteristics of sensory responses of M1 neurons.
(a) Scatterplot of each M1 neuron’s adjusted r2 value for twitches (y-axis) and wake movements (x-axis) across age. Background color illustrates the classification of neurons within that region of the scatterplot. (b) Mean (±SEM) adjusted r2 values for twitches (blue) and wake movements (red) for responsive M1 neurons at each age. * Significant difference from previous day (p<0.005). † Significant difference from 2 days prior (p<0.005). (c) Percentage of neurons classified as wake-responsive (red), twitch- and wake-responsive (purple), and twitch-responsive (blue) at each age.
Figure 3—figure supplement 1
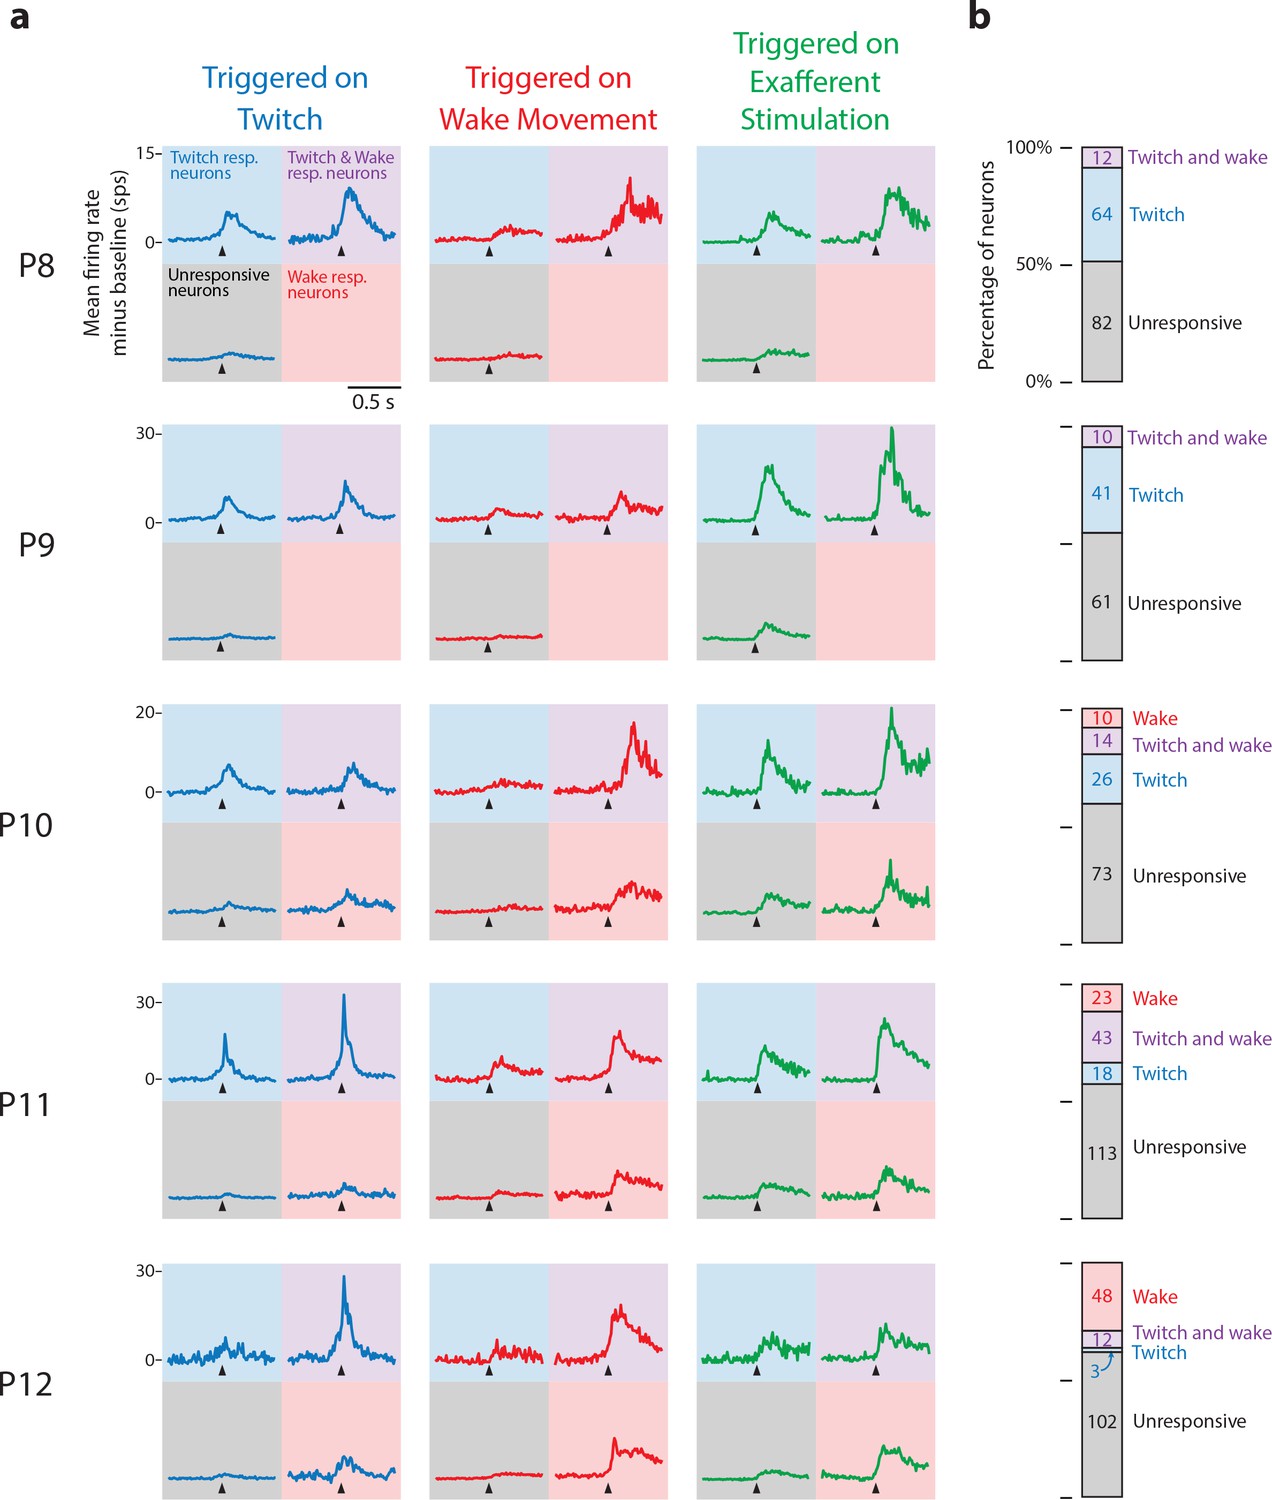
Mean perievent histograms by age, neuron response classification, and triggered event.
(a) Mean perievent histograms (in spikes per s, sps) for all neurons at each age, for each response classification, and for each type of triggered event category. Baseline firing rates were subtracted from individual responses before calculating means. Each column identifies the type of triggered event (twitch, blue; wake movement, red; exafferent stimulation, green) denoted by the black arrows. For each colored grid, the color of the background indicates the response classification of the neurons being averaged (twitch, blue; twitch and wake, purple, wake, red; unresponsive, gray). Thus, a blue line against a blue background represents the mean twitch response (blue line) of all twitch-responsive neurons (blue background) at that age, and a blue line against a gray background represents the mean twitch response (blue line) of all unresponsive neurons (gray background) at that age. (b) Stacked bar plot of the percentage of neurons at each age classified as unresponsive (gray), twitch-responsive (blue), twitch- and wake-responsive (purple) and wake-responsive (red). Numbers within the stacked bar plots indicate the number of neurons identified for that response type at that age.
Figure 3—figure supplement 2
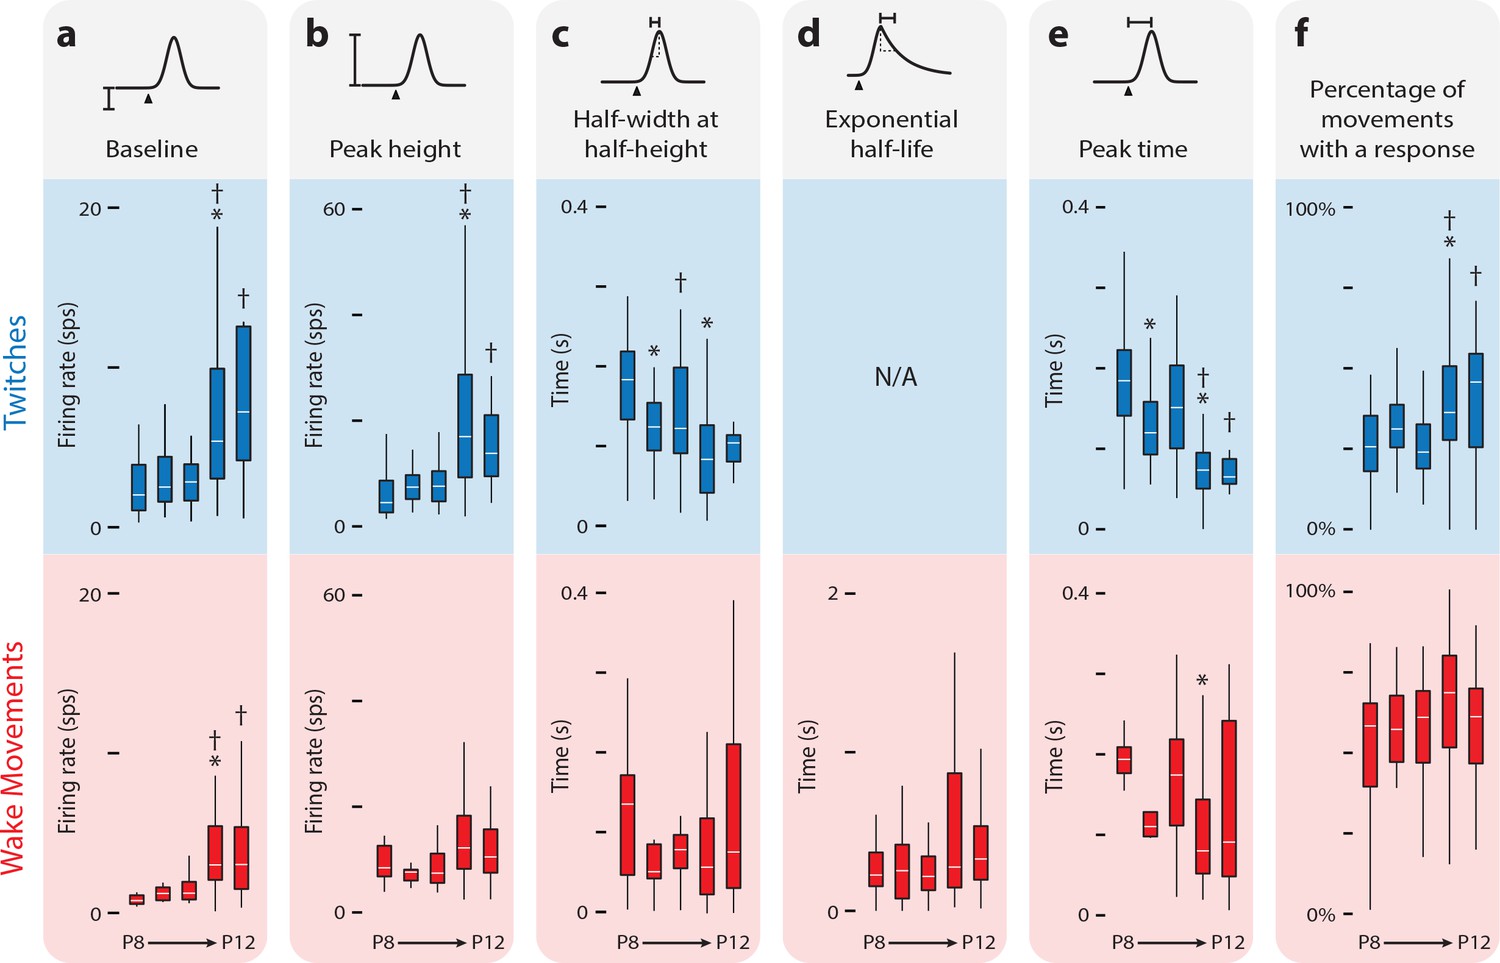
Developmental refinement of twitch-responsive neurons.
(a) Box plots of baseline activity for twitch-responsive (upper, blue) and wake-responsive (lower, red) neurons. A significant Kruskal-Wallis for twitch-responsive neurons (H(4,238) = 50.3, p<0.0001) and wake-responsive neurons (H(4,169) = 34.0, p<0.0001) permitted pairwise comparisons. Alpha was set to 0.05, with the Bonferroni adjustment used to correct for multiple comparisons. * Significant difference from previous day (p<0.005). † Significant difference from 2 days prior (p<0.005). (b) Same as in (a), but for peak height. Twitch-responsive neurons showed a significant effect of age (H(4,238) = 78.5, p<0.0001). (c) Same as in (a), but for half-width at half-height. For wake-responsive neurons, half-width at half-height refers only to the rising (Gaussian) part of the function. Twitch-responsive neurons showed a significant effect of age (H(4,238) = 55.4, p<0.0001). (d) Same as in (a), but for exponential half-life (only applicable to wake-responsive neurons). (e) Same as in (a), but for peak response time. Both twitch-responsive neurons (H(4,238) = 108.6, p<0.0001) and wake-responsive neurons (H(4,169) = 16.4, p=0.0025) showed a significant effect of age. (f) Percentage of twitches and wake movements that resulted in increased neural activity in relation to the activity expected during baseline. The percentage of twitches that produced a neural response showed a significant effect of age (H(4,238) = 33.66, p<0.0001).
Figure 4
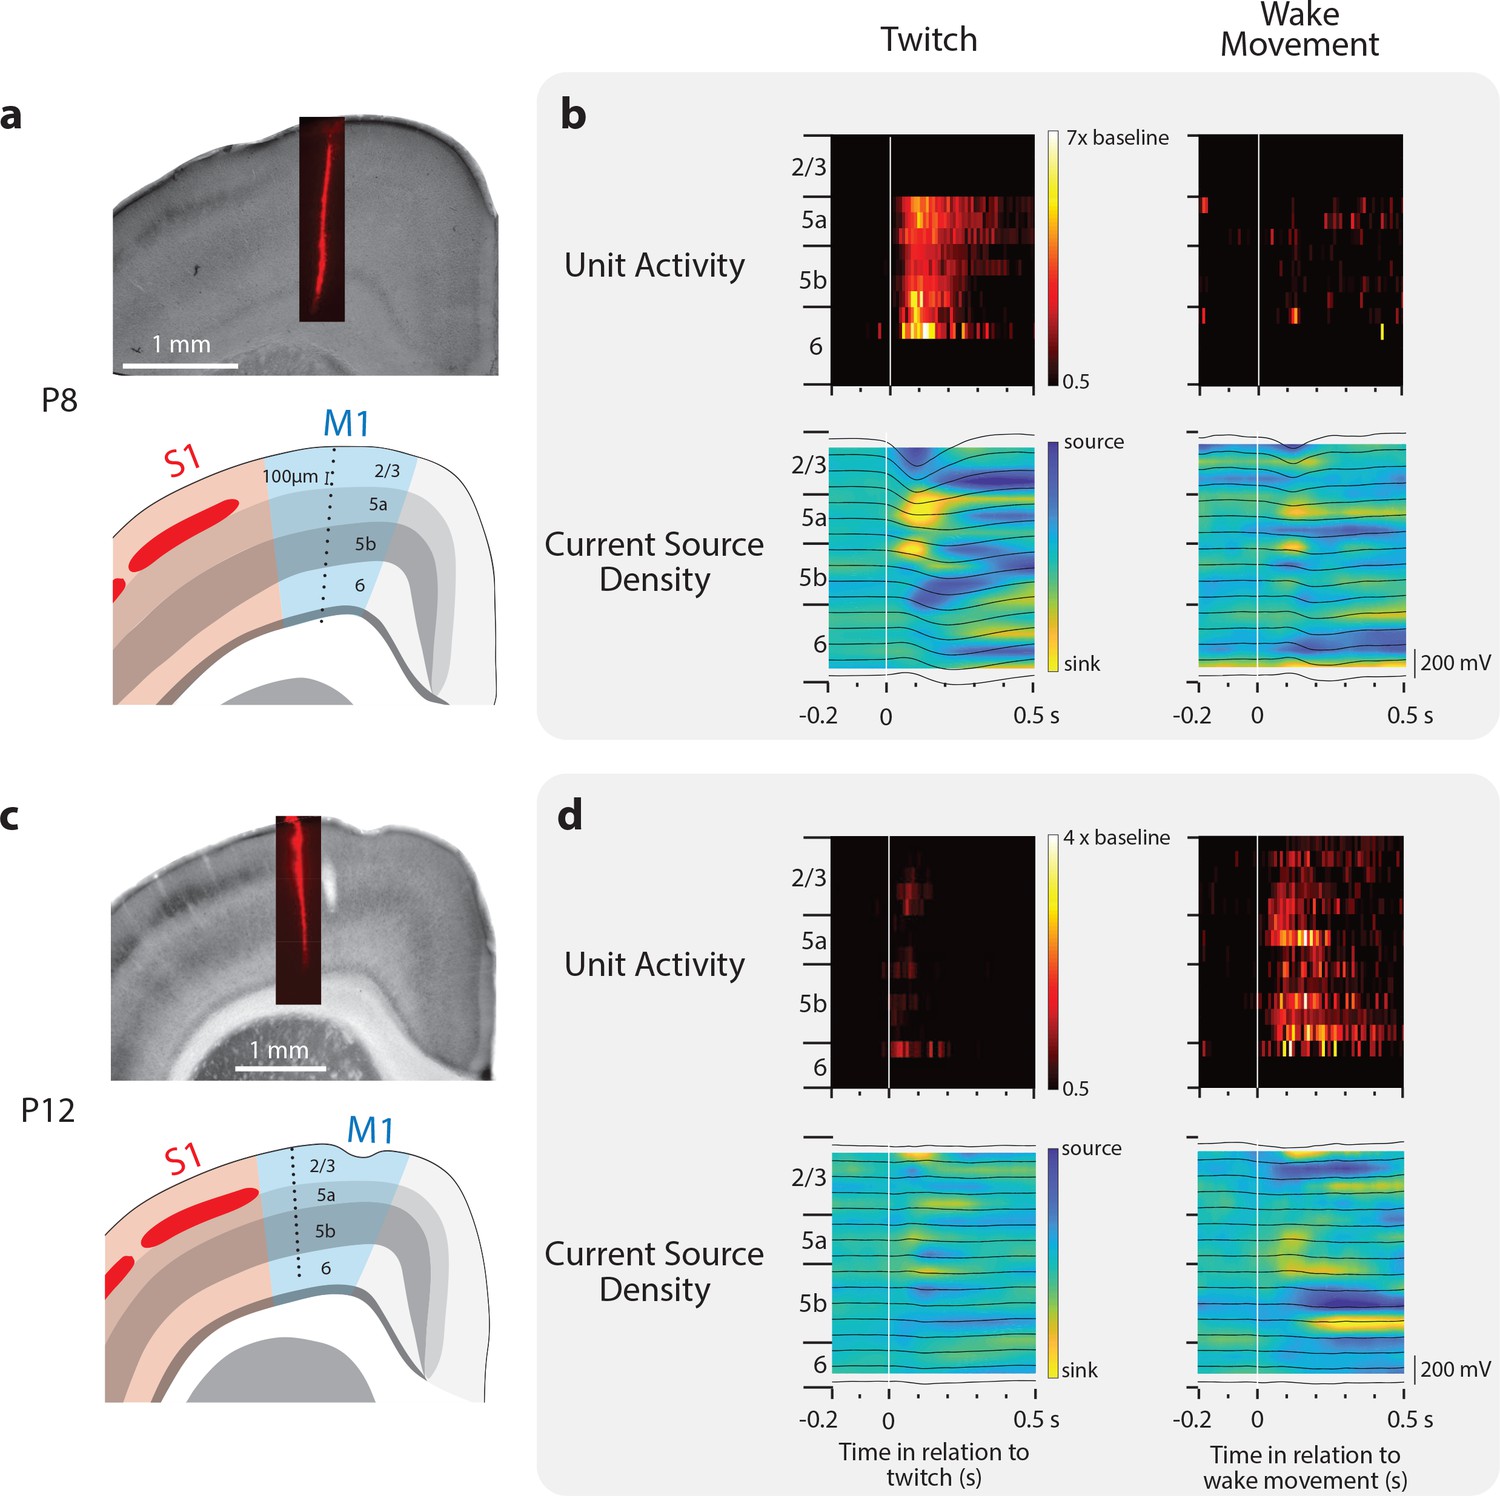
Layer-specific reafferent activity in M1.
(a) Top: Location of laminar electrode in CO-stained sensorimotor cortex in a P8 rat. Bottom: Identification of the cortical layers of M1 along with the location of the 16 recording sites (black dots) along the electrode (site separation = 100 μm). (b) Top row: Neural responses (relative to baseline firing rate) for all neurons isolated at each electrode site triggered on twitches (left) and wake movements (right). Bottom: Current source density plots triggered on twitches (left) and wake movements (right). Local field potentials are superimposed (black lines). (c) Same as in (a) except at P12. (d) Same as in (b) except at P12.
Figure 5

Dual recordings in M1 and S1.
(a) Left: CO-stained tissue of the M1 and S1 forelimb representation of a P8 rat showing the location of electrodes. Right: Location of M1-S1 dual recordings for all P8 rats. M1 is shown in blue, S1 in red. Recording sites from stained tissue (left panels) are designated with yellow highlights in the right panels. (b) Same as in (a) except at P12. (c) Mean normalized perievent histograms (bin size = 10 ms) of neural activity of responsive neurons in M1 and S1 of P8 rats triggered on twitches (blue), wake movements (red), and exafferent stimulation (green). Blue plots include all twitch-responsive neurons (M1: N = 50, S1: N = 31), red plots include all wake-responsive neurons (M1: N = 21, S1: N = 18), and green plots include all twitch- or wake-responsive neurons (M1: N = 55, S1: N = 38). (d) Same as in (c) except at P12. Blue plots include all twitch-responsive neurons (M1: N = 15, S1: N = 15), red plots include all wake-responsive neurons (M1: N = 60, S1: N = 56), and green plots include all twitch- or wake-responsive neurons (M1: N = 63, S1: N = 65). (e) Cross-correlation (bin size = 1 ms) of all available pairs of responsive M1-S1 neurons, minus the shift predictor, for twitches (top row, blue) and wake movements (bottom row, red). These plots significant peaks of S1 activity at lags of 0 ms in relation to M1 activity. Gray regions denote confidence bands (p=0.01). (f) Same as in (e) except at P12.
Figure 6 with 1 supplement
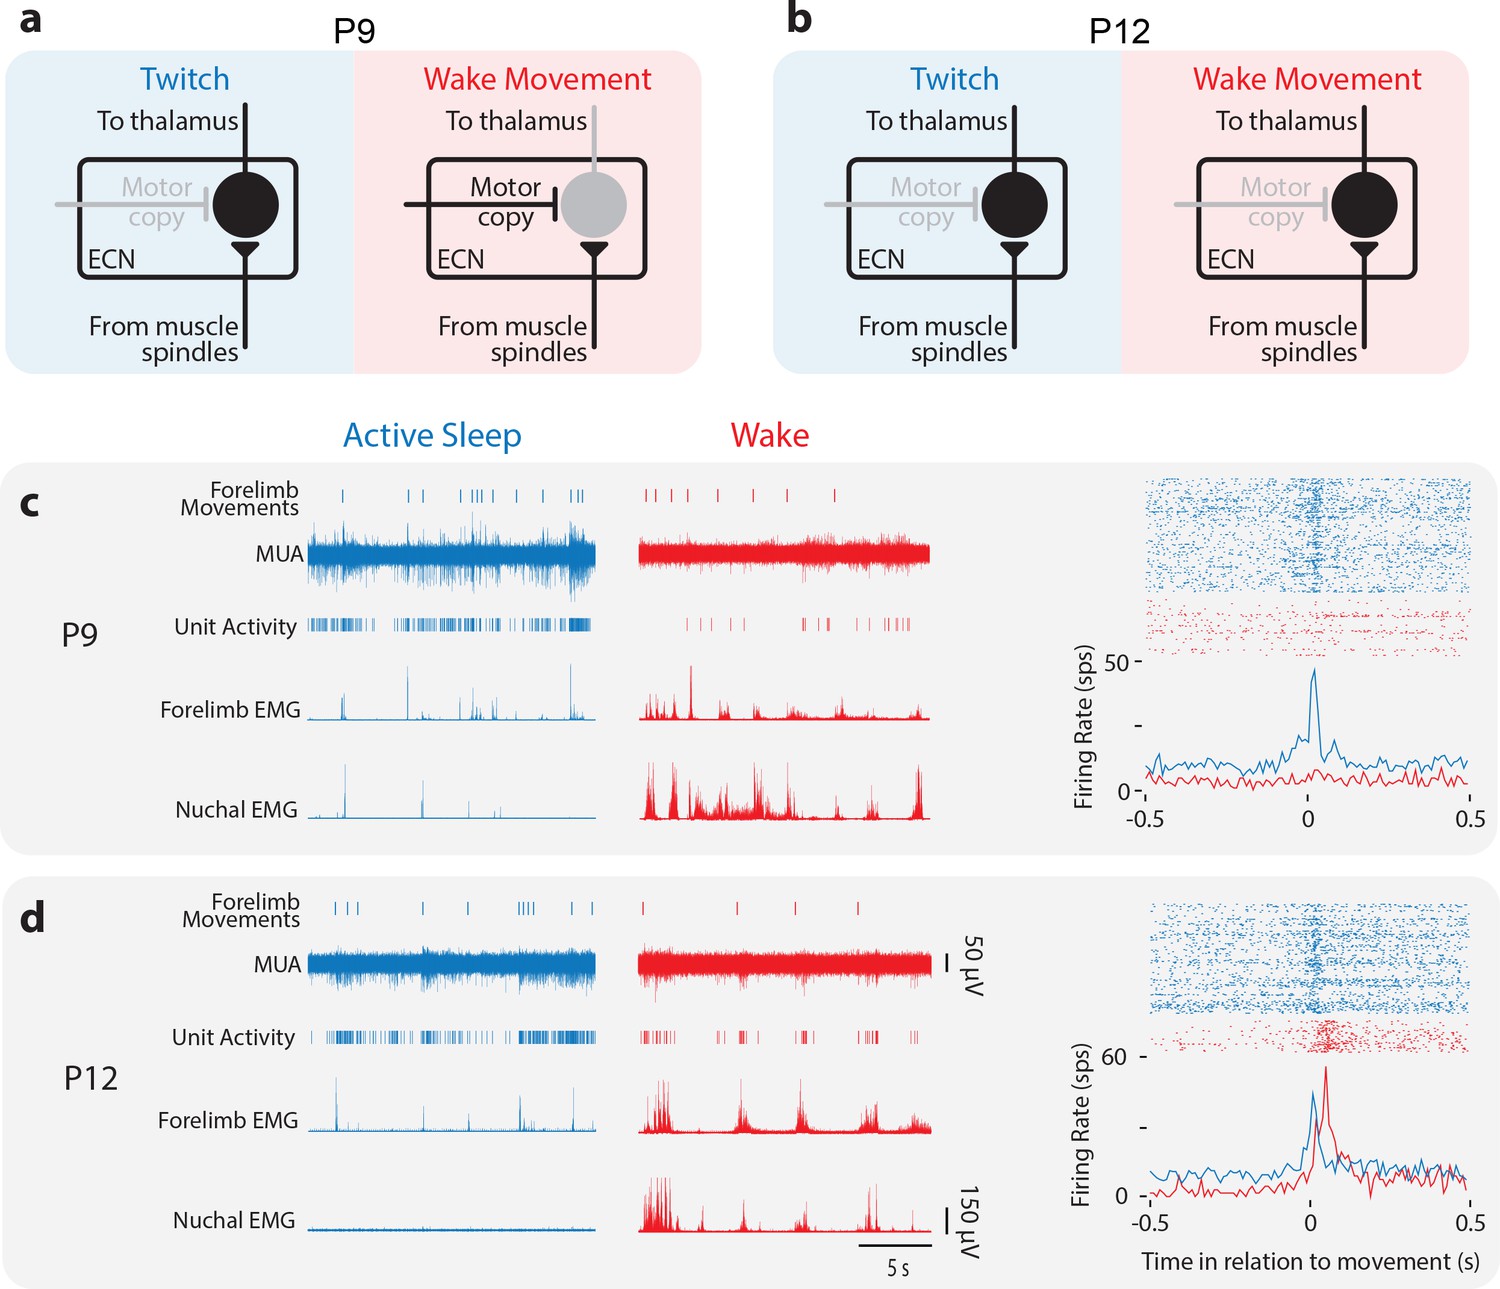
Developmental change in state-dependent ECN activity.
(a) Model of ECN neuronal activity in response to twitches and wake movements at P9, as proposed previously (Tiriac and Blumberg, 2016). Neurons in the ECN convey twitch-related reafference to downstream structures, including thalamus and, ultimately, M1. For wake movements, a motor copy inhibits the ECN neuron, preventing the conveyance of reafference to downstream structures. (b) Proposed model of ECN neuronal activity in response to twitches and wake movements at P12. The ECN’s gating of twitch-related reafference is identical to that at P9. However, at P12, we propose that wake-related reafference ceases to be gated in the ECN, permitting this reafference to be conveyed to downstream structures. (c) Left: At P9, representative data depicting 20 s periods of active sleep (blue) and wake (red), showing forelimb movements, multi-unit activity (MUA), sorted unit activity from the forelimb representation of M1, and rectified EMGs from ipsilateral forelimb and nuchal muscles. Right, top: Raster sweeps for an individual ECN neuron triggered on twitches (blue) and wake movements (red), with each row showing the unit activity surrounding a single movement. Right, bottom: Perievent histogram (bin size = 10 ms) showing mean firing rate for this neuron triggered on twitches (blue) and wake movements (red). (d) Same is in (c) except for a P12 rat.
Figure 6—figure supplement 1
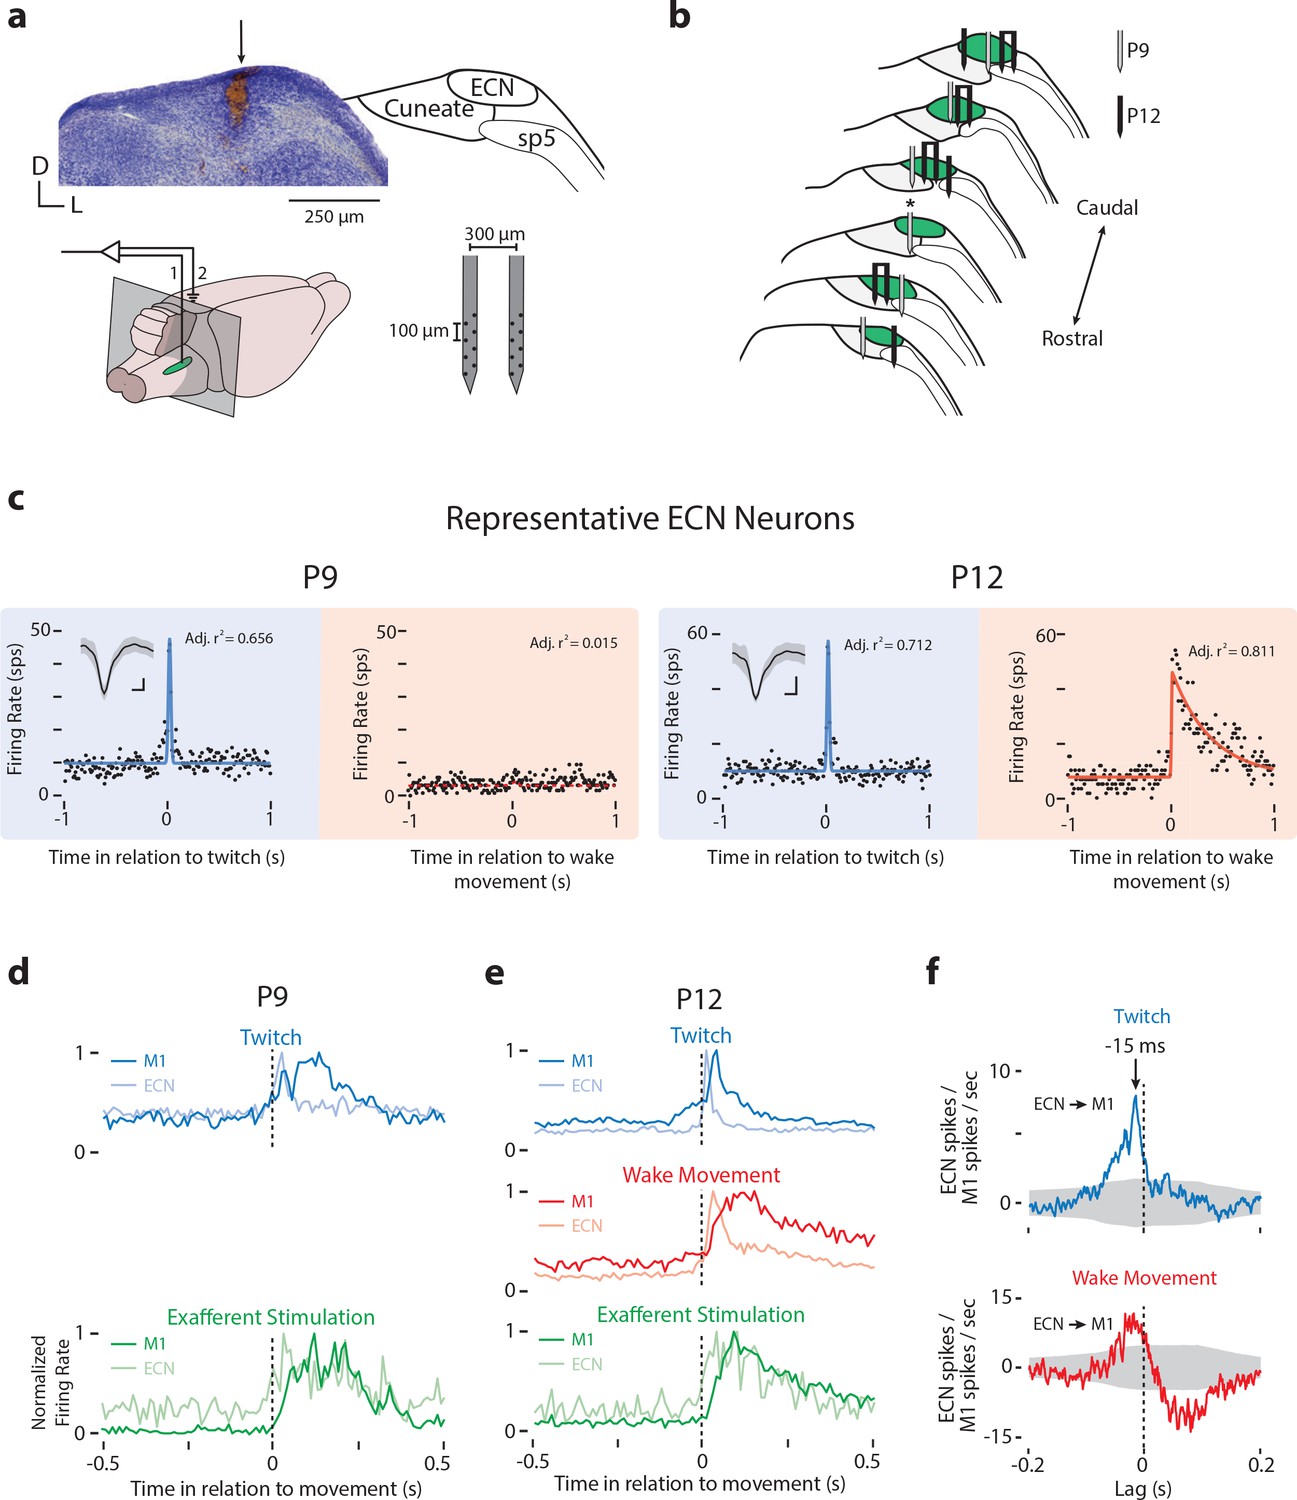
ECN recording locations and representative neural activity.
(a) Left, Top: Nissl-stained coronal section showing electrode locations in the ECN (arrow). Right, Top: Nuclear boundaries of ECN, cuneate nucleus, and spinal trigeminal tract (sp5) in relation to the section at left. Left, Bottom: Locations of the recording (1) and ground (2) electrodes; gray box indicates the plane of the coronal section above. Green oval is the approximate extent of the ECN. Right, Bottom: Electrode used to record ECN neural activity. (b) Electrode locations for ECN recordings at P9 (gray) and P12 (black). Asterisk denotes recording site shown in (a). Single electrodes represent electrode locations for cases where ECN units were isolated on a single electrode shank; two electrodes bound together with a line are cases where ECN units were isolated on both electrode shanks. (c) Perievent histograms of firing rate (spikes per s, sps) for representative ECN neurons at P9 (left) and P12 (right) triggered on twitches (blue) and wake movements (red). Conventions as in Figure 2c. Insets in the top left corner show each neuron’s mean waveform (black line) ±standard deviation. Vertical scale bar = 20 μV; horizontal scale bar = 0.2 ms. (d) Normalized perievent histograms (bin size = 10 ms) of neural activity triggered on twitches (top, blue) and exafferent stimulation (bottom, green) in P9 rats with dual recordings in M1 and ECN. Blue plots include all twitch-responsive neurons, red plots include all wake-responsive neurons, and green plots include all twitch- or wake-responsive neurons. (e) Same as in (d) except for P12 rats. Also shown is neural activity triggered on wake movements (middle, red). (f) Cross-correlations (bin size = 1 ms) for all pairs of units recorded simultaneously in M1 and ECN, minus the shift predictor, for twitches (top, blue) and wake movements (bottom, red). Gray regions denote confidence bands (p=0.01).
Figure 7
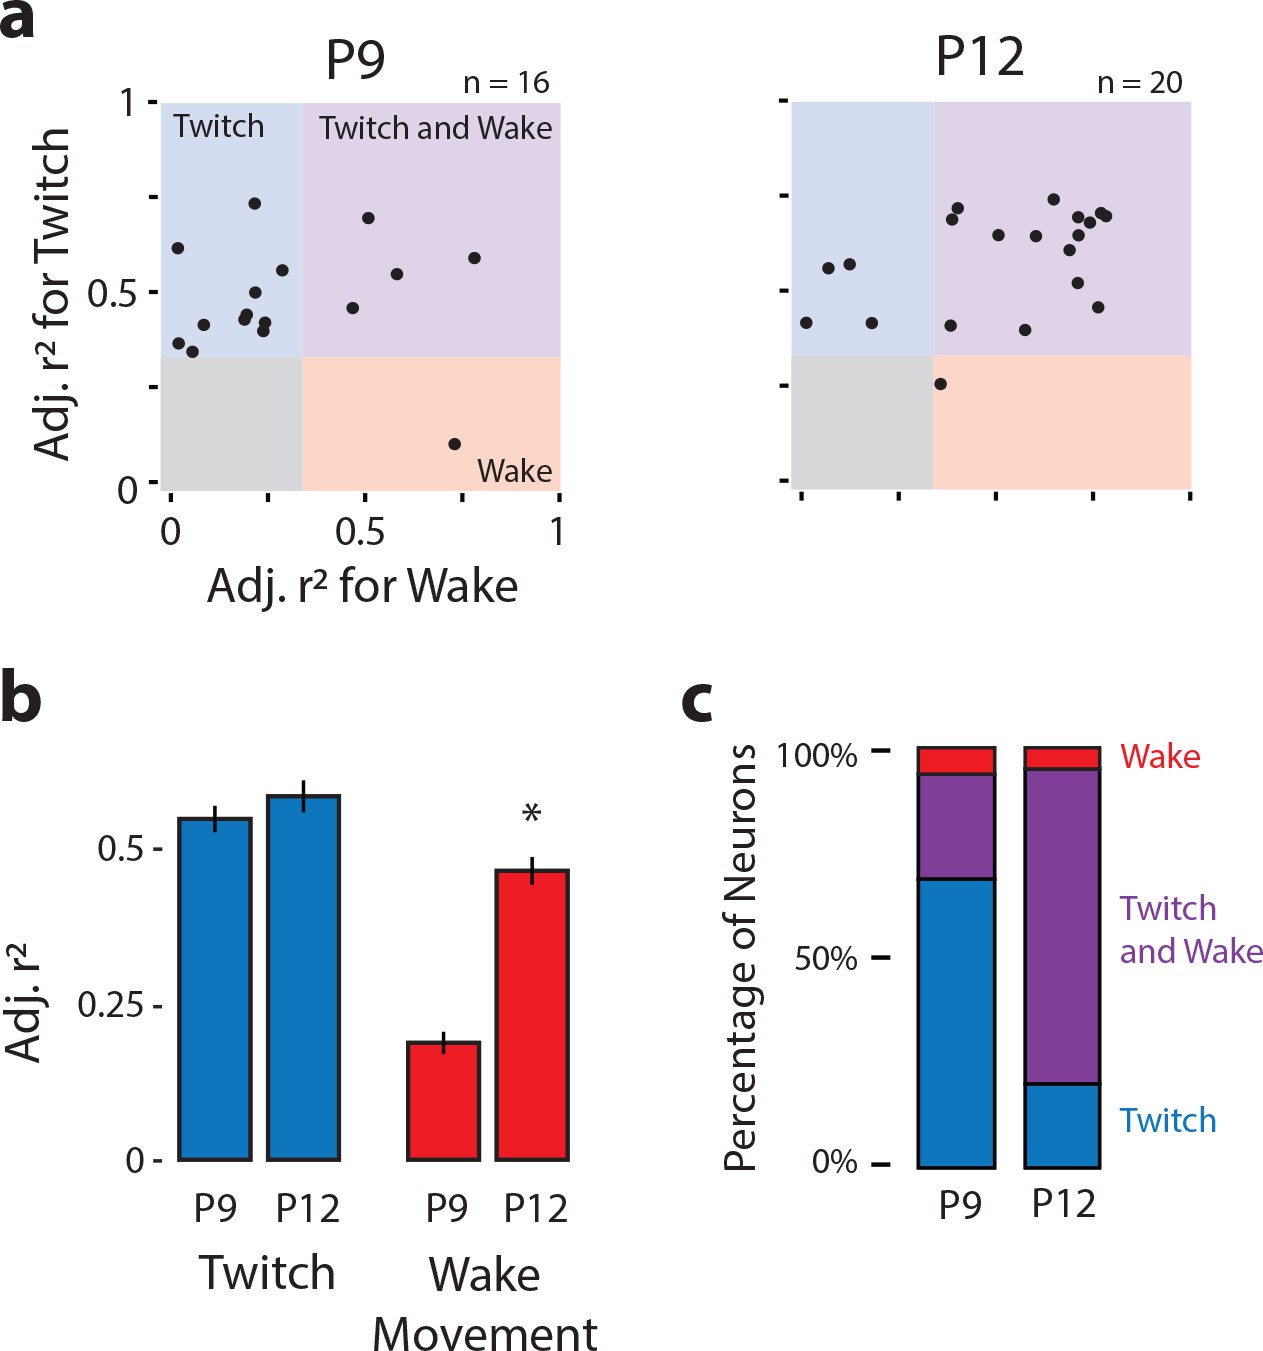
Developmental onset of wake-related reafference in the ECN.
(a) Scatterplot of each ECN neuron’s adjusted r2 value for twitches (y-axis) and wake movements (x-axis) at P9 (left) and P12 (right). Background color illustrates the classification of neurons within that region of the scatterplot. (b) Mean (±SEM) adjusted r2 values for twitches (blue) and wake movements (red) for ECN neurons recorded at P9 and P12. * Significant difference from P9 (p<0.025). (c) Percentage of ECN neurons at P9 and P12 that were wake-responsive (red), twitch- and wake-responsive (purple), and twitch-responsive (blue).
Figure 8 with 1 supplement
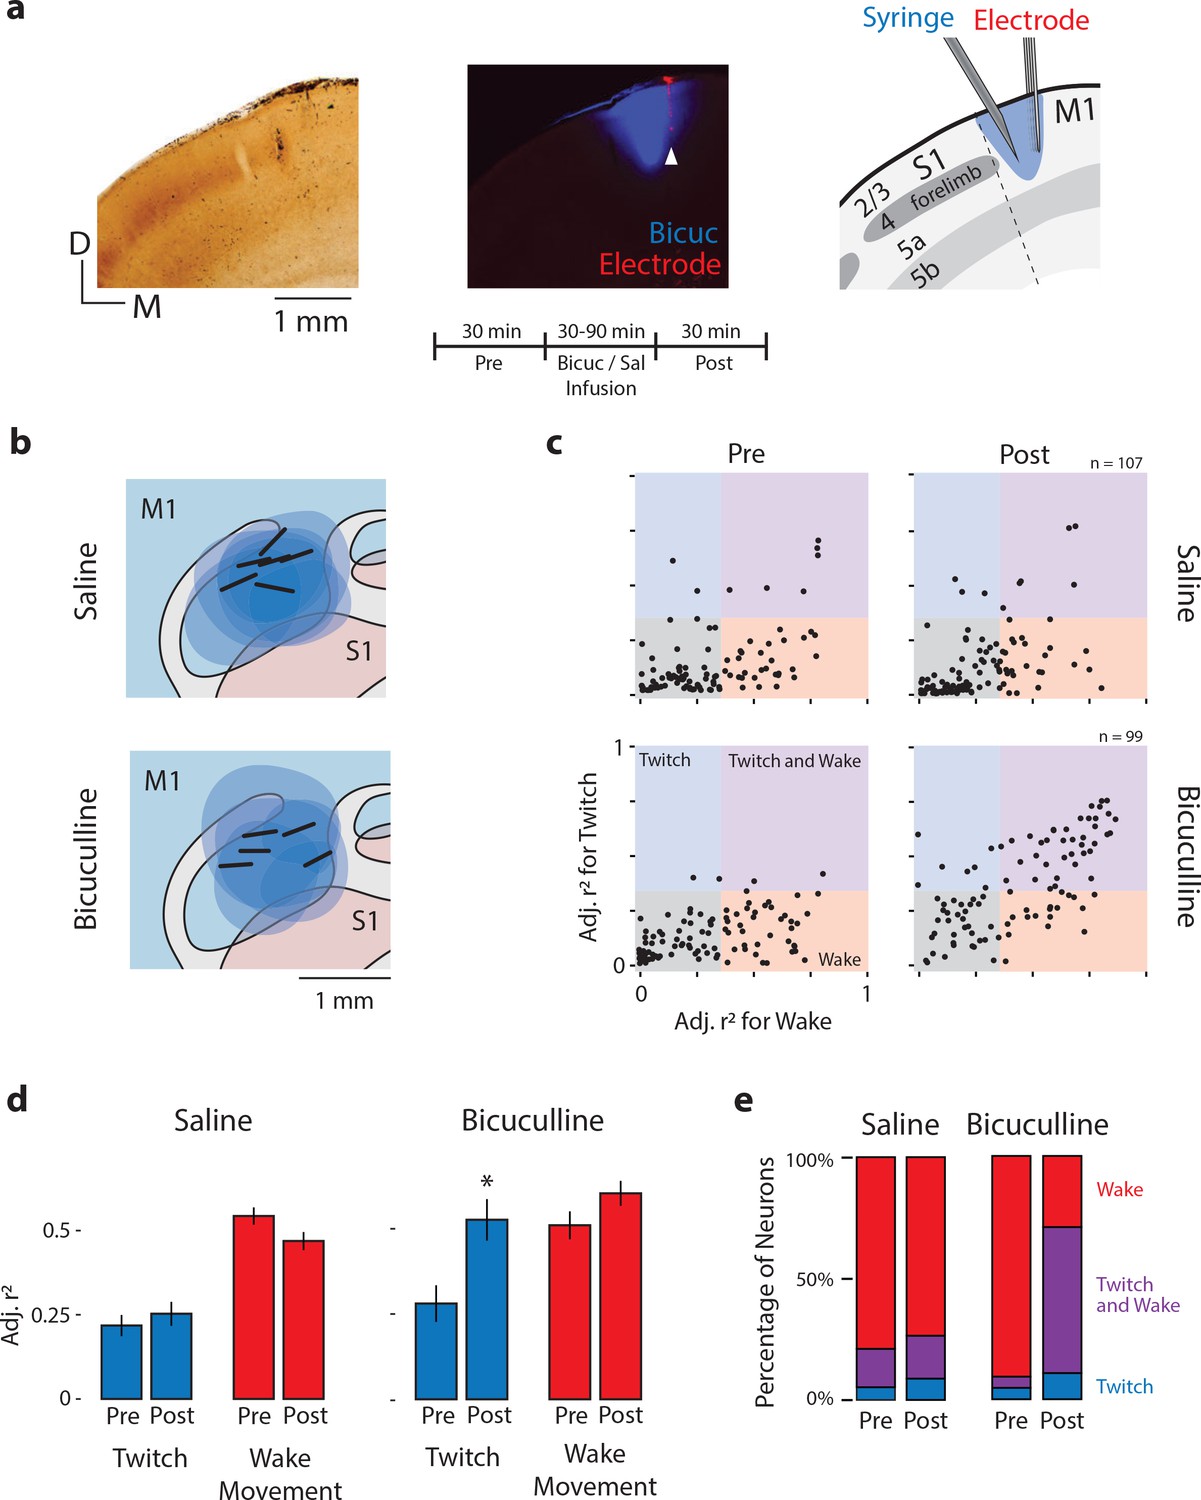
Local disinhibition of M1 neurons at P12 unmasks twitch-related activity.
(a) Left: Coronal section showing CO staining around the S1/M1 boundary. Middle: Fluorescent image of the same section showing the spatial extent of bicuculline diffusion (blue). White arrow indicates the location of an electrode shank in M1 (red). Right: Illustration of the histological sections at left to show the boundaries of S1 and M1, the laminar structure of each area, and a reconstruction of the location of the microsyringe needle immediately lateral to the recording electrode. Middle, bottom: Experimental timeline. (b) Recording sites (black bars) and diffusion boundaries (blue ovals) for all six saline injections (top) and five bicuculline injections (bottom) depicted in the horizontal plane. The 6th bicuculine injection is shown in the coronal section in (a). All recording sites were within the forelimb representation of M1; diffusion boundaries were largely restricted to M1. (c) Top: Adjusted r2 values for twitches (y-axis) and wake movements (x-axis) for each isolated M1 unit before (Pre) and after (Post) injection of saline. Bottom: Same as above, but for bicuculline group. (d) Mean (±SEM) adjusted r2 values for twitches (blue) and wake movements (red) before (Pre) and after (Post) injections of saline or bicuculline. * significant difference from Pre (p<0.0125). (e) Percentage of M1 neurons that were wake-responsive (red), twitch- and wake-responsive (purple), and twitch-responsive (blue) during the Pre and Post periods in the saline and bicuculline groups.
Figure 8—figure supplement 1
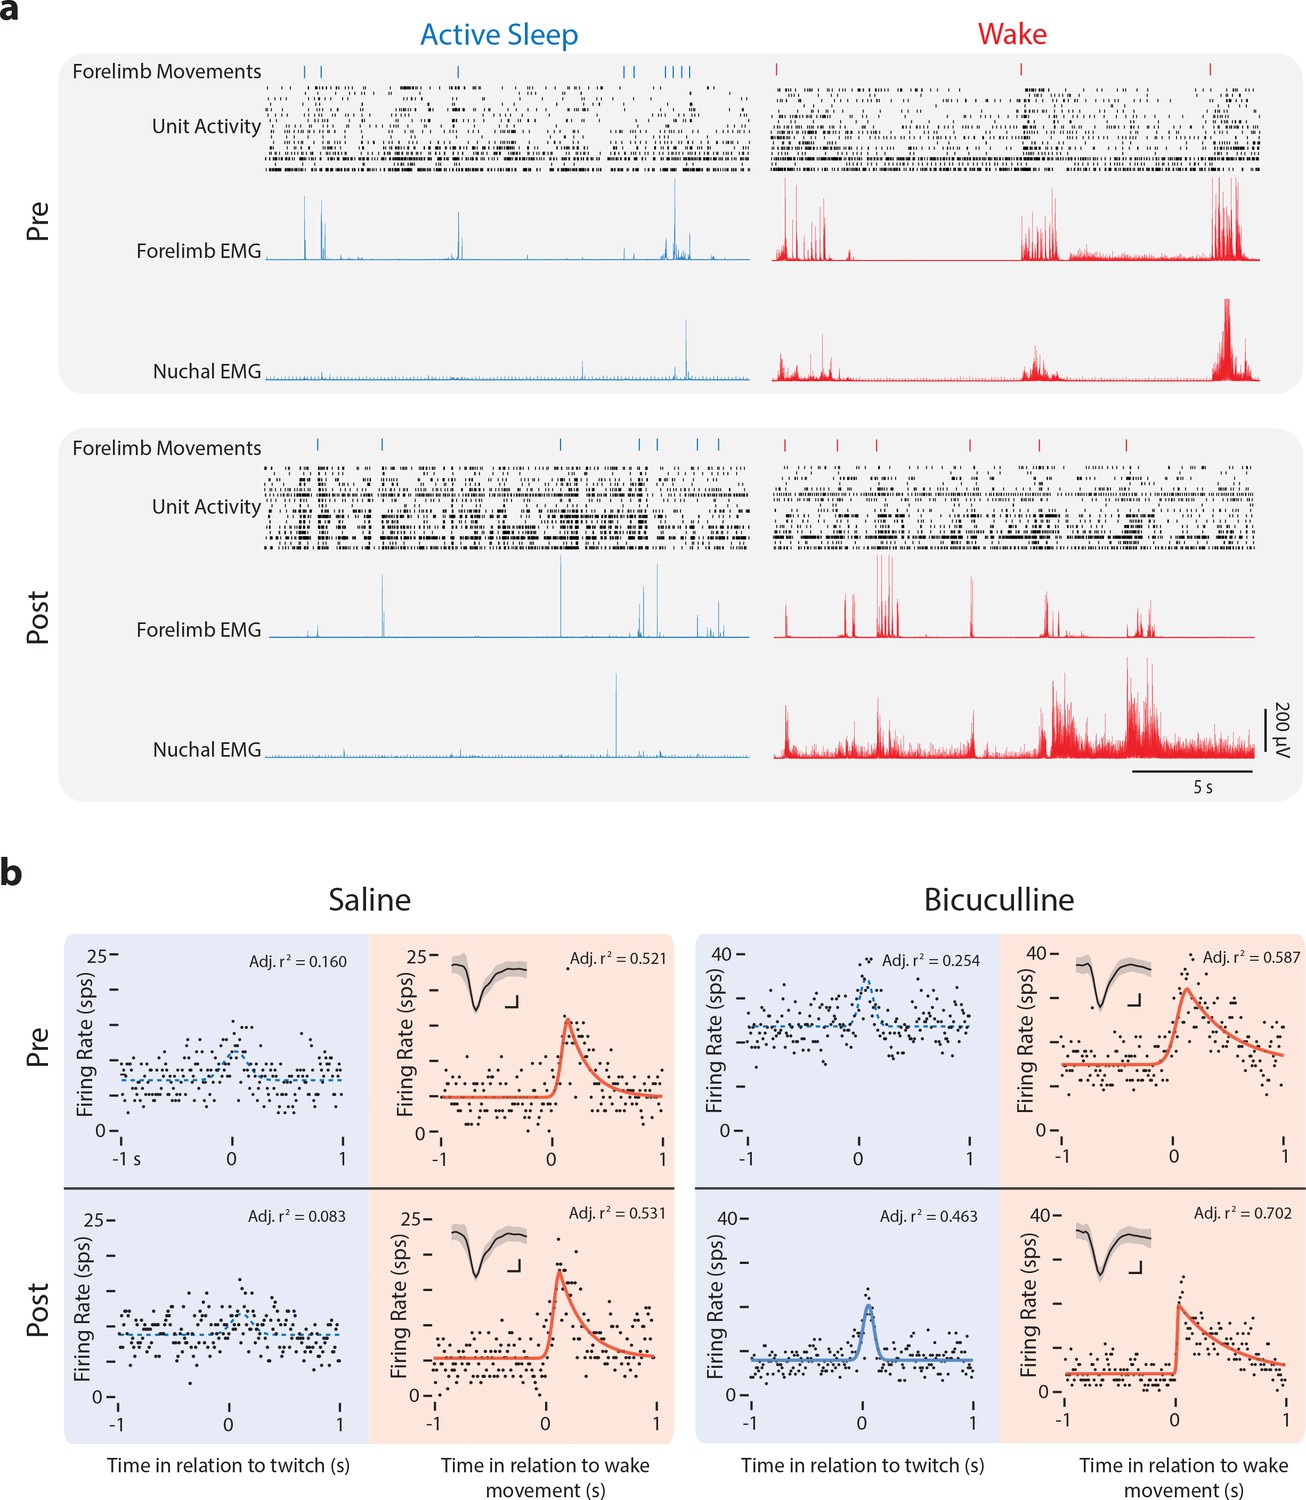
Representative M1 neural activity before and after injection of saline or bicuculline at P12.
(a) Representative data depicting 20 s periods of active sleep (blue) and wake (red) before (Pre, top) and after (Post, bottom) injection of bicuculline into M1. The data depicted are forelimb movements (twitches: blue ticks; wake movements: red ticks), unit activity within the forelimb representation of M1, and rectified EMGs from contralateral forelimb and nuchal muscles. Each row of depicts unit activity for a different neuron. (b) Perievent histograms of firing rate (spikes per s, sps) for representative M1 neurons triggered on twitches (blue) and wake movements (red) before (Pre) and after (Post) injections of saline (left) or bicuculline (right). Conventions as in Figure 2c. Insets in the top left corner show each neuron’s mean waveform (black line) ±standard deviation. Vertical scale bar = 20 μV; horizontal scale bar = 0.2 ms.
Figure 9
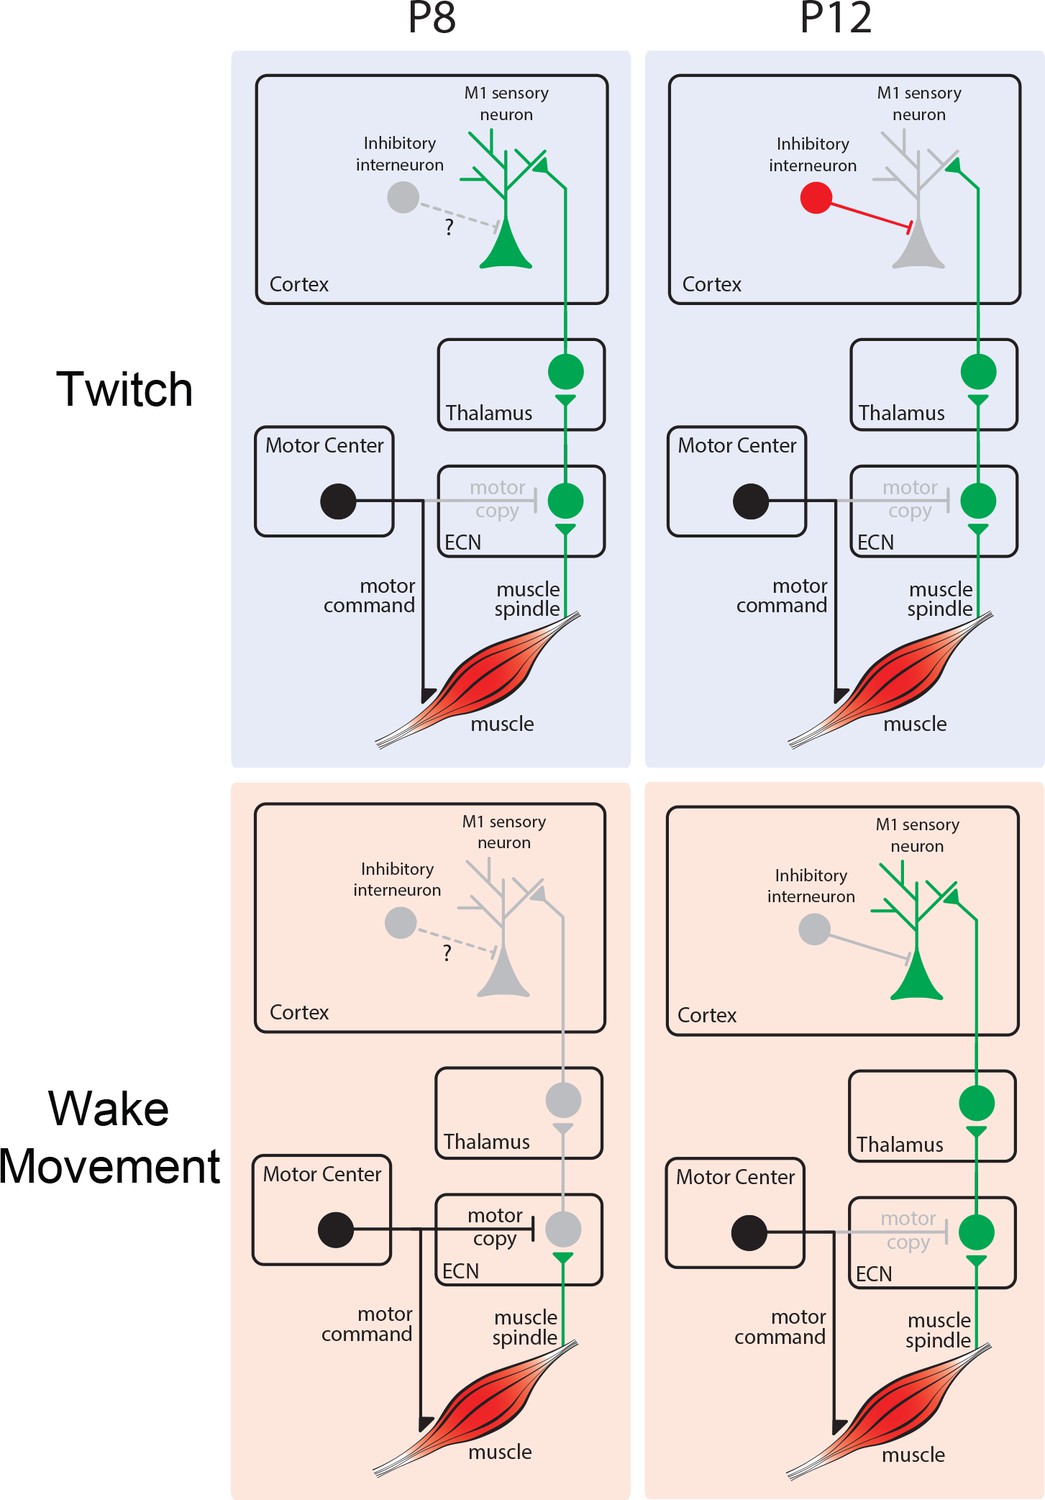
Developmental changes in reafferent processing.
Top left: At P8, twitch-related reafference (green) is conveyed from ECN to downstream structures, including M1. Top right: At P12, twitch-related reafference reaches cortex, but activity is masked due to local inhibition. Bottom left: At P8, inhibition at the ECN masks wake-related reafference (green) and prevents its conveyance to M1. Bottom right: At P12, the ECN no longer selectively inhibits reafference from wake movements, permitting its conveyance to M1.
Tables
Table 1
Details for all groups of infant subjects in this study.
https://doi.org/10.7554/eLife.41841.002| Expt. | Age | # of Animals | Mean Weight (g) | # of Neurons | Neuronal Classification | Mean # of Twitches | Mean # of Wake Movements | |||||
|---|---|---|---|---|---|---|---|---|---|---|---|---|
| Unresp. | Resp. | Wake | Twitch | Both | ||||||||
| M1 | 8 | 10 | 19.0 ± 0.40 | 160 | 84 | 76 | 0 | 64 | 12 | 302 ± 31 | 60 ± 11 | |
| 9 | 9 | 21.8 ± 0.60 | 112 | 61 | 51 | 0 | 41 | 10 | 259 ± 10 | 72 ± 10 | ||
| 10 | 8 | 24.8 ± 0.27 | 123 | 73 | 50 | 10 | 26 | 14 | 187 ± 26 | 54 ± 10 | ||
| 11 | 15 | 27.4 ± 0.34 | 197 | 113 | 84 | 23 | 18 | 43 | 157 ± 18 | 79 ± 10 | ||
| 12 | 7 | 30.2 ± 0.74 | 165 | 102 | 63 | 48 | 3 | 12 | 104 ± 22 | 82 ± 14 | ||
| ECN | 9 | 6 | 20.3 ± 1.18 | 16 | 0 | 16 | 1 | 11 | 4 | 253 ± 20 | 84 ± 15 | |
| 12 | 7 | 28.1 ± 1.20 | 20 | 0 | 20 | 1 | 4 | 15 | 226 ± 27 | 70 ± 8 | ||
| Saline Pre | 12 | 6 | 31.1 ± 1.27 | 107 | 73 | 38 | 30 | 2 | 6 | 177 ± 43 | 113 ± 8 | |
| Saline Post | 69 | 34 | 25 | 3 | 6 | 186 ± 29 | 97 ± 14 | |||||
| Bicuc. Pre | 12 | 6 | 30.0 ± 1.23 | 99 | 56 | 43 | 39 | 2 | 2 | 112 ± 19 | 80 ± 13 | |
| Bicuc. Post | 34 | 65 | 19 | 7 | 39 | 131 ± 37 | 91 ± 19 | |||||
-
The number of animals, weight (mean ± s.d.), neuronal classification, and number of triggered twitches and wake movements (mean ± s.d.) for the M1, ECN, and disinhibition experiments.
Table 2
Model-fit parameters for M1 and ECN neurons.
https://doi.org/10.7554/eLife.41841.010| M1 Twitch-Responsive Neurons | |||||||
|---|---|---|---|---|---|---|---|
| Age | BL (sps) | Rmax (sps) | Tmax (s) | HWHH (s) | % Responding | ||
| P8 | 2.12 (1.05, 3.66) | 3.86 (2.57, 7.65) | 0.194 (0.141, 0.252) | 0.186 (0.137, 0.220) | 25.7 (18.1, 35.3) | ||
| P9 | 2.52 (1.67, 4.45) | 7.14 (4.72, 9.62) | 0.119 (0.095, 0.158) | 0.122 (0.086, 0.154) | 31.5 (25.5, 38.8) | ||
| P10 | 2.87 (1.68, 3.86) | 5.18 (3.71, 9.94) | 0.172 (0.111, 0.229) | 0.124 (0.102, 0.192) | 24.1 (19.0, 32.7) | ||
| P11 | 5.20 (3.18, 10.00) | 14.95 (9.13, 27.22) | 0.075 (0.054, 0.094) | 0.085 (0.053, 0.132) | 36.4 (27.8, 50.7) | ||
| P12 | 6.45 (4.11, 12.37) | 12.82 (9.10, 20.10) | 0.068 (0.056, 0.095) | 0.105 (0.084, 0.115) | 45.8 (25.6, 54.6) | ||
| M1 Wake-Responsive Neurons | |||||||
| Age | BL (sps) | Rmax (sps) | Tmax (s) | HWHH (s) | λ (s) | % Responding | |
| P8 | 0.63 (0.39, 0.96) | 6.70 (3.89, 8.93) | 0.199 (0.185, 0.265) | 0.178 (0.115, 0.229) | 0.231 (0.154, 0.352) | 57.7 (38.9, 64.7) | |
| P9 | 1.04 (0.68, 1.55) | 7.33 (5.59, 9.25) | 0.109 (0.097, 0.120) | 0.065 (0.059, 0.086) | 0.298 (0.087, 0.364) | 56.6 (46.5, 67.1) | |
| P10 | 1.23 (0.52, 1.53) | 9.62 (6.83, 13.14) | 0.214 (0.166, 0.235) | 0.091 (0.067, 0.116) | 0.213 (0.114, 0.368) | 60.4 (42.3, 68.5) | |
| P11 | 2.63 (1.37, 5.35) | 10.14 (6.63, 15.85) | 0.095 (0.061, 0.165) | 0.079 (0.028, 0.137) | 0.401 (0.182, 1.319) | 68.0 (51.0, 79.5) | |
| P12 | 2.31 (0.99, 4.64) | 9.05 (5.00, 14.10) | 0.126 (0.052, 0.260) | 0.089 (0.033, 0.239) | 0.323 (0.181, 0.539) | 60.6 (46.1, 69.3) | |
| ECN Twitch-Responsive Neurons | |||||||
| Age | BL (sps) | Rmax (sps) | Tmax (s) | HWHH (s) | % Responding | ||
| P9 | 5.97 (3.19, 9.73) | 14.59 (7.33, 24.79) | 0.043 (0.036, 0.051) | 0.063 (0.026, 0.085) | 31.0 (17.1, 43.1) | ||
| P12 | 3.39 (2.33, 6.01) | 23.42 (8.22, 34.07) | 0.032 (0.027, 0.044) | 0.031 (0.023, 0.036) | 41.7 (23.3, 52.4) | ||
| ECN Wake-Responsive Neurons | |||||||
| Age | BL (sps) | Rmax (sps) | Tmax (s) | HWHH (s) | λ (s) | % Responding | |
| P12 | 3.66 (1.61, 6.13) | 19.94 (11.13, 35.38) | 0.054 (0.038, 0.074) | 0.058 (0.037, 0.079) | 0.166 (0.034, 0.428) | 74.1 (59.4, 85.9) | |
-
The median values (along with the 25th and 75th percentiles) for all twitch-responsive and wake-responsive neurons in M1 and the ECN at each age. M1 data are the numerical values for Figure 3—figure supplement 2.
Additional files
-
Transparent reporting form
- https://doi.org/10.7554/eLife.41841.019
Download links
A two-part list of links to download the article, or parts of the article, in various formats.
Downloads (link to download the article as PDF)
Open citations (links to open the citations from this article in various online reference manager services)
Cite this article (links to download the citations from this article in formats compatible with various reference manager tools)
Developmental 'awakening' of primary motor cortex to the sensory consequences of movement
eLife 7:e41841.
https://doi.org/10.7554/eLife.41841


