The proteasome biogenesis regulator Rpn4 cooperates with the unfolded protein response to promote ER stress resistance
- DKFZ-ZMBH Alliance and CellNetworks Cluster of Excellence, Germany
- Max Planck Institute of Biochemistry, Germany
Abstract
Misfolded proteins in the endoplasmic reticulum (ER) activate the unfolded protein response (UPR), which enhances protein folding to restore homeostasis. Additional pathways respond to ER stress, but how they help counteract protein misfolding is incompletely understood. Here, we develop a titratable system for the induction of ER stress in yeast to enable a genetic screen for factors that augment stress resistance independently of the UPR. We identify the proteasome biogenesis regulator Rpn4 and show that it cooperates with the UPR. Rpn4 abundance increases during ER stress, first by a post-transcriptional, then by a transcriptional mechanism. Induction of RPN4 transcription is triggered by cytosolic mislocalization of secretory proteins, is mediated by multiple signaling pathways and accelerates clearance of misfolded proteins from the cytosol. Thus, Rpn4 and the UPR are complementary elements of a modular cross-compartment response to ER stress.
https://doi.org/10.7554/eLife.43244.001Introduction
Cells continuously produce a large variety of proteins. To fulfill their functions, these proteins need to be properly folded, post-translationally modified, assembled into complexes and delivered to their final subcellular destinations. If errors occur in these maturation steps, compartment-specific quality control machineries clear the resulting misfolded or mislocalized proteins through refolding or degradation. These machineries are regulated by specialized adaptive responses, which adjust the folding and degradation capacity of particular organelles to ensure efficient elimination of aberrant proteins. If unresolved, protein misfolding in one compartment can disrupt overall cell homeostasis and threaten survival.
Protein maturation in the endoplasmic reticulum (ER), particularly in budding yeast, has served as a powerful paradigm to elaborate these general principles (Patil and Walter, 2001; Barlowe and Miller, 2013; Berner et al., 2018). Newly synthesized polypeptides containing ER sorting information, for example N-terminal signal sequences, are recognized by targeting factors such as signal recognition particle (SRP) and inserted into the ER (Aviram and Schuldiner, 2017). The process of protein insertion into the ER, termed translocation, is mediated by channel-forming translocon complexes (Rapoport, 2007). Translocation additionally requires ER-lumenal chaperones such as the highly abundant Kar2, which therefore have dual roles in protein import and folding (Gething, 1999; Young et al., 2001). Other components of the ER-resident folding machinery include oxidoreductases and glycosyltransferases (Braakman and Hebert, 2013). Proteins that have attained their native conformation are sorted into ER-to-Golgi transport carriers. Proteins that fail to fold properly become subject to ER-associated degradation (ERAD). Key steps in ERAD are protein retrotranslocation into the cytosol with the help of the AAA ATPase Cdc48, followed by degradation by the proteasome (Berner et al., 2018). If these mechanisms are insufficient, misfolded proteins accumulate. This condition constitutes ER stress and activates an adaptive response called the unfolded protein response (UPR) (Walter and Ron, 2011). The UPR is triggered when misfolded proteins are sensed by the ER transmembrane protein Ire1. Activated Ire1 initiates non-conventional cytosolic splicing of the HAC1 mRNA, enabling production of the transcription factor Hac1. In turn, Hac1 induces numerous genes involved in ER function (Travers et al., 2000). The resulting increase in ER protein folding capacity resolves ER stress, closing a homeostatic feedback loop. The physiological significance of the UPR is demonstrated by yeast mutants lacking Ire1 or Hac1. When challenged by ER stress, these mutants exhibit a variety of defects in translocation, glycosylation, ERAD and ER-to-Golgi transport, and rapidly lose viability (Cox et al., 1993; Spear and Ng, 2003).
A number of UPR-independent pathways respond to, and help mitigate, ER stress. These pathways include MAP kinase signaling through Slt2/Mpk1 and Hog1, the Hsf1-dependent heat shock response and protein kinase A (PKA) signaling (Bonilla and Cunningham, 2003; Chen et al., 2005; Liu and Chang, 2008; Bicknell et al., 2010; Hou et al., 2014; Pincus et al., 2014). However, exactly how they counteract ER stress has been difficult to determine. For instance, ER stress is alleviated by augmented ER-to-Golgi transport and enhanced elimination of reactive oxygen species downstream of the heat shock response and also by reduced protein synthesis downstream of PKA signaling (Liu and Chang, 2008; Hou et al., 2014; Pincus et al., 2014). Yet, these mechanisms only partially explain the beneficial effects of the signaling pathways controlling them. Finally, the UPR can, by unknown means, be amplified by Ire1-independent induction of HAC1 transcription (Leber et al., 2004). Therefore, it remains to be fully defined which pathways cooperate with the UPR and how they contribute to ER stress resistance.
Here, we identify the proteasome biogenesis regulator Rpn4 as an important UPR-independent factor that promotes resistance to ER stress in yeast. We show that protein misfolding induces Rpn4 activity by post-transcriptional and transcriptional mechanisms, and provide evidence that Rpn4 complements the UPR by enhancing protein quality control in the cytosol.
Results
A titratable system for the induction of ER stress
To identify pathways cooperating with the UPR, we searched for genes that can augment resistance to ER stress in UPR-deficient cells. Mutants lacking Ire1 or Hac1 grow normally under optimal conditions but cannot proliferate under even mild ER stress (Cox et al., 1993; Spear and Ng, 2003; Schuck et al., 2009). We hypothesized that UPR mutants can be protected against ER stress by overexpression of genes that complement the UPR. If so, such genes should be identifiable through a screen based on cell growth phenotypes.
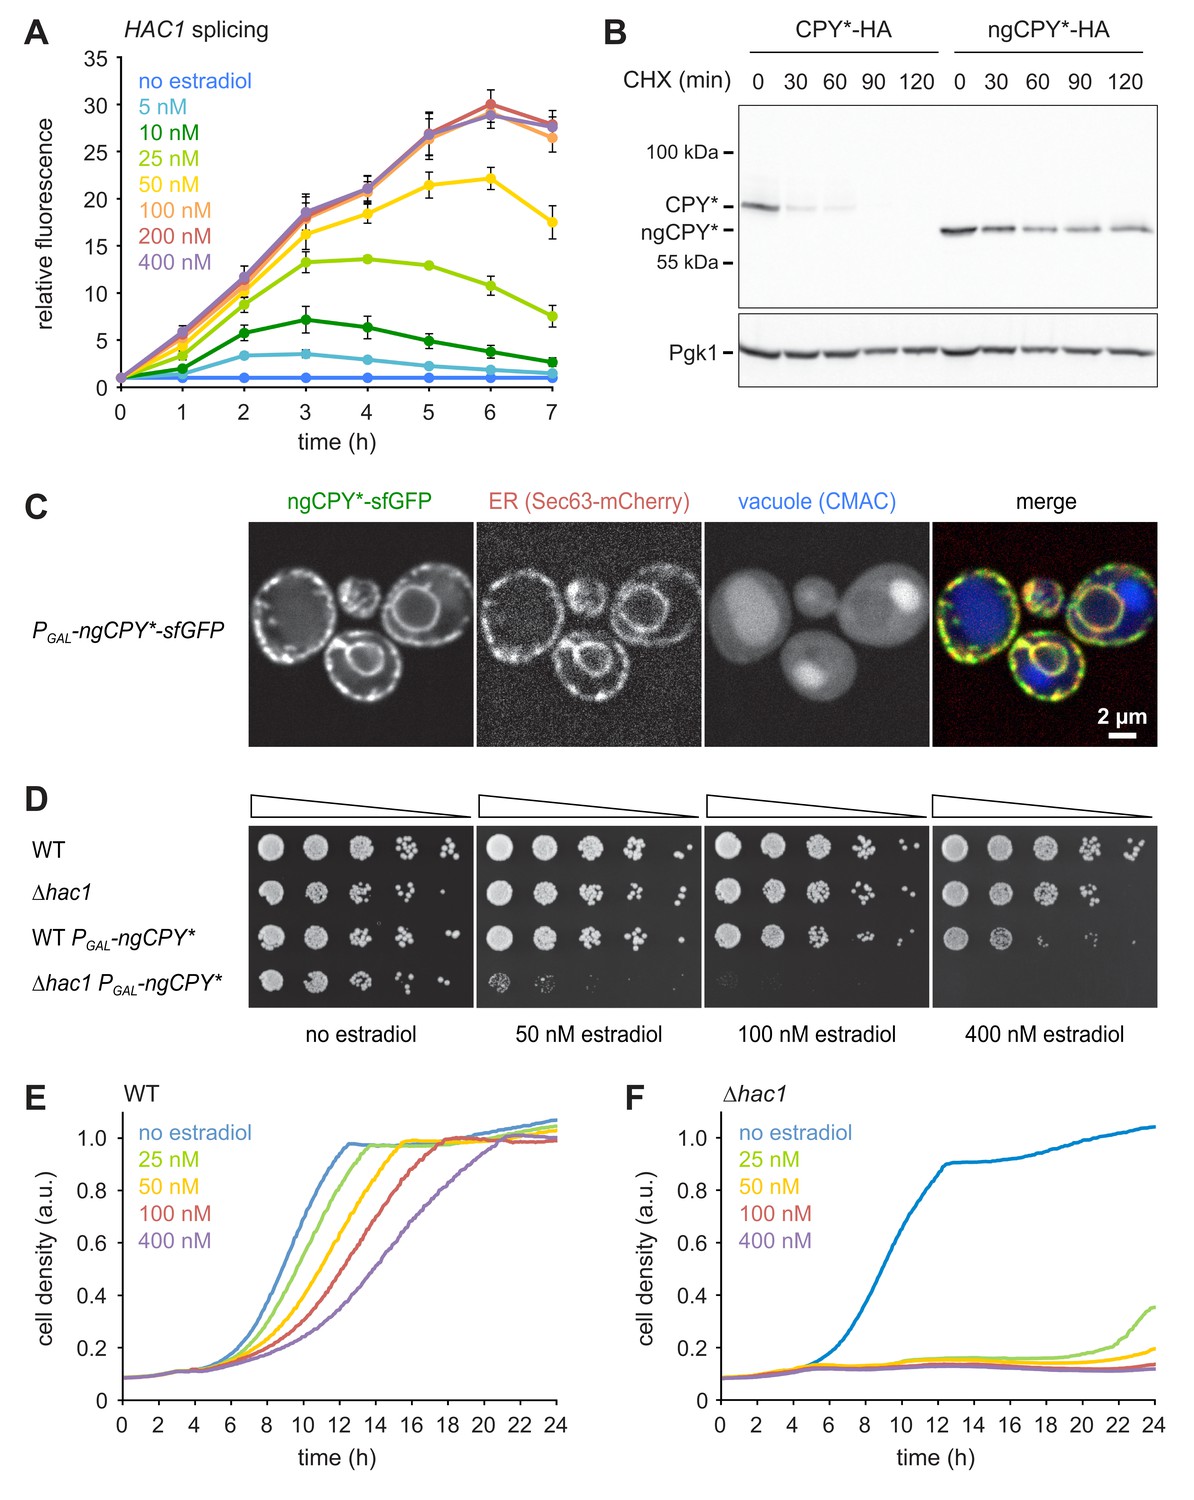
To implement this idea, we established a titratable system for the induction of ER stress. We used CPY*, a folding-defective variant of the soluble vacuolar carboxypeptidase Y (Finger et al., 1993). We chose an HA-tagged mutant variant of CPY* that lacks all of its four N-glycosylation sites and is here referred to as non-glycosylatable (ng) CPY*. After translocation into the ER, this variant is unable to fold properly and is neither efficiently cleared by ERAD nor exported to the Golgi complex (Knop et al., 1996; Spear and Ng, 2005; Kostova and Wolf, 2005). As a result, ngCPY* accumulates in the ER lumen and burdens the ER protein folding machinery. We placed ngCPY* under the control of the GAL promoter and the artificial transcription factor Gal4-ER-Msn2 (GEM). This system allows regulation of gene expression with the exogenous steroid β-estradiol (Pincus et al., 2014). Estradiol-driven expression of ngCPY* caused dose-dependent activation of the UPR as measured with a HAC1 splicing reporter (Figure 1A; Pincus et al., 2010). HAC1 splicing obtained with ≥100 nM estradiol was similar to that elicited by 0.5 µg/ml of the general ER stressor tunicamycin (Figure 1—figure supplement 1A). For all estradiol concentrations tested, HAC1 splicing declined at later time points, suggesting that cells adapted to the stress and inactivated the UPR. Estradiol-induced expression of glycosylatable CPY*, which is degraded through ERAD and can be exported from the ER, yielded much weaker and more transient UPR activation (Figure 1—figure supplement 1B). Cycloheximide chase experiments confirmed that ngCPY* was substantially more resistant to degradation than glycosylatable CPY*, as reported (Figure 1B; Knop et al., 1996). Furthermore, ngCPY* tagged with superfolder GFP (sfGFP) was largely retained in the ER (Figure 1C). In contrast, CPY*(N479Q)-sfGFP, which lacks the glycosylation site required for efficient ERAD but contains the three glycosylation sites needed for ER export, escaped to the vacuole (Figure 1—figure supplement 1C; Kawaguchi et al., 2010).
Figure 1 with 1 supplement see all
A titratable system for the induction of ER stress.
(A) Flow cytometric measurement of GFP levels in cells harboring the HAC1 splicing reporter and expressing ngCPY* under the control of the estradiol-inducible GAL promoter system. For each time point, data are normalized to untreated cells. Mean ±SEM, n = 3. (B) Western blot of HA and Pgk1 from cells expressing CPY*-HA or ngCPY*-HA. Cells were treated with cycloheximide (CHX) for the times indicated. Pgk1 served as a loading control. (C) Images of cells expressing ngCPY*-sfGFP and the general ER marker Sec63-mCherry. Expression of ngCPY*-sfGFP was induced with 25 nM estradiol for 4 hr and cells were stained with the vacuole dye CMAC. (D) Growth assay on solid media of wild-type (WT) and ∆hac1 cells expressing the estradiol-inducible artificial transcription factor GEM and, where indicated, ngCPY* under the control of the GAL promoter. For each strain, series represent fivefold dilution steps. (E) Growth assay in liquid media of WT cells expressing ngCPY* under the control of the estradiol-inducible GAL promoter system. a.u., arbitrary units. (F) As in panel E, but with ∆hac1 cells.
Estradiol did not affect growth of wild-type or ∆hac1 cells expressing only the artificial transcription factor GEM (Figure 1D). Furthermore, estradiol-induced expression of ngCPY* in wild-type cells caused only modest growth defects on solid media, even at the highest estradiol concentration tested. In ∆hac1 cells, however, induction of ngCPY* expression with increasing concentrations of estradiol strongly retarded and eventually prevented cell proliferation. Growth assays in liquid media yielded similar results (Figure 1E and F). To determine whether the lack of proliferation of ∆hac1 cells reflected a growth arrest or cell death, we assayed cell viability after expression of ngCPY*. No loss of viability of ∆hac1 cells occurred, even with estradiol concentrations that completely blocked proliferation (Figure 1—figure supplement 1D). Hence, expression of ngCPY* merely caused a growth arrest. In summary, this estradiol-controlled system can be titrated to induce defined levels of ER stress and can be used to prevent growth of UPR-deficient cells.
A screen for genes promoting ER stress resistance in UPR mutants
We exploited the ngCPY*-induced growth arrest in UPR mutants to conduct a multicopy suppression screen. Cells lacking HAC1 and containing the titratable ER stress system were transformed with a genomic library in a high-copy vector. Transformants were first allowed to form colonies on estradiol-free solid medium and then replicated onto media containing a range of estradiol concentrations sufficient to block growth of the parental strain. Plasmids were retrieved from transformants able to grow on estradiol-containing plates and their inserts were sequenced. The obtained candidate genes were individually subcloned into the same high-copy vector and tested for their ability to suppress the toxicity of ngCPY* in ∆hac1 cells.
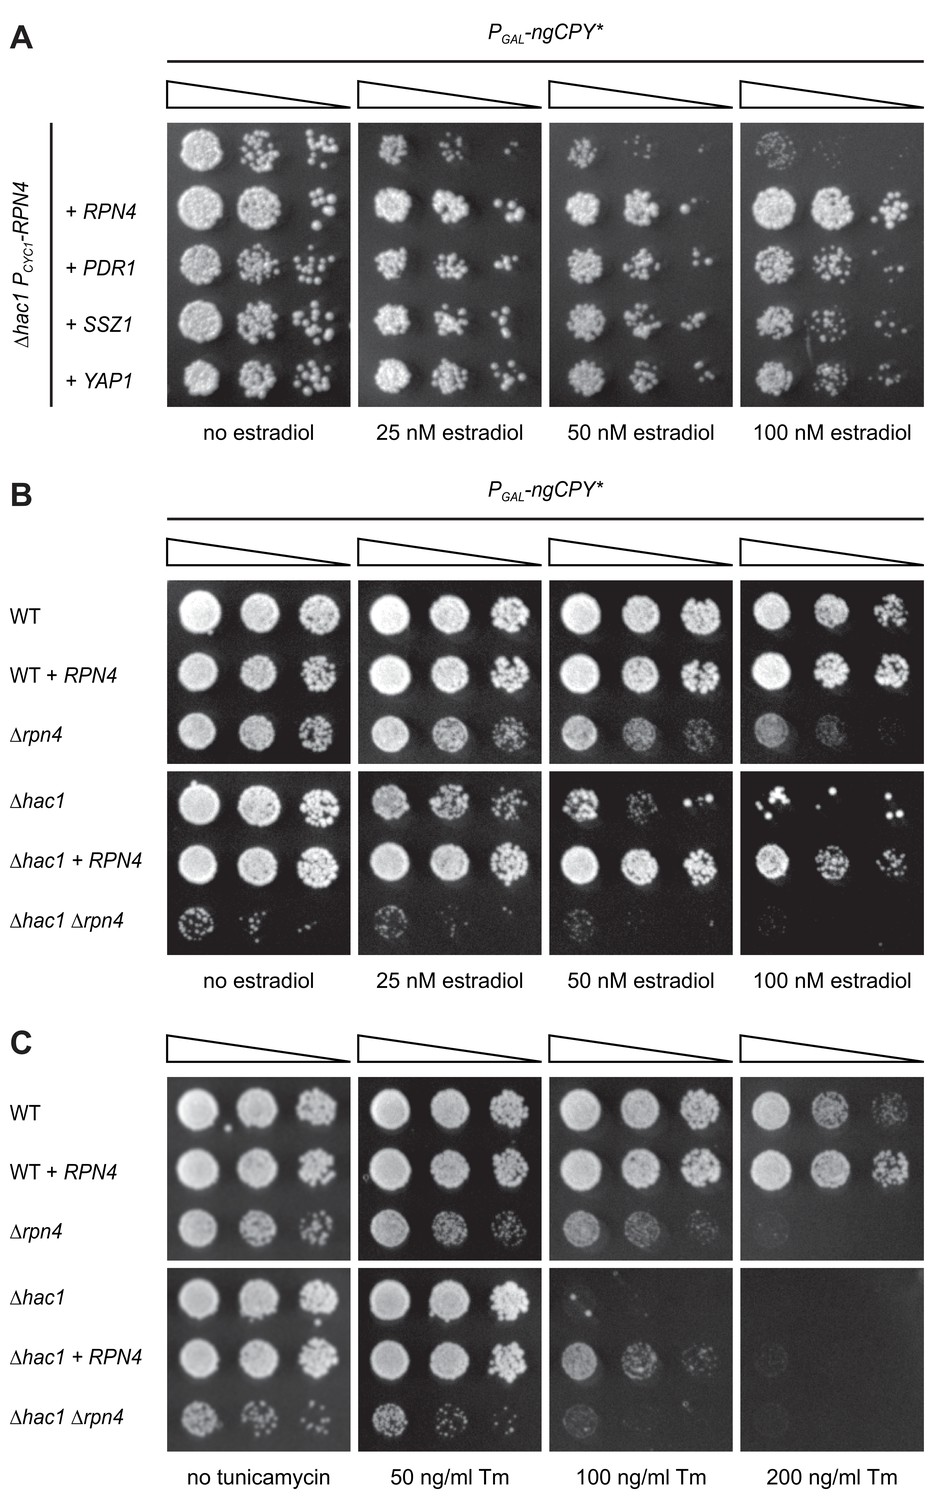
As expected, the strongest suppressor was HAC1, which complemented the HAC1 deletion in the parental strain. The next strongest suppressors as judged by growth assays on solid and in liquid media were RPN4, PDR1 and SSZ1. Additional, but weaker, suppressors were YAP1, CAD1, SAF1, MUM2 and NOP56 (Table 1 and Figure 2). Rpn4 is a transcription factor that localizes to the cytosol and the nucleus (Tkach et al., 2012). Its primary function is the induction of genes encoding proteasome subunits (Dohmen et al., 2007). Pdr1 is another transcription factor, controls genes involved in multidrug resistance and induces RPN4 transcription (Owsianik et al., 2002; Prasad and Goffeau, 2012). Ssz1 is part of the ribosome-associated chaperone complex and its overproduction activates Pdr1 (Hallstrom et al., 1998; Conz et al., 2007). Yap1 is a third transcription factor, mediates the oxidative stress response and also induces RPN4 transcription (Owsianik et al., 2002). Considering these links, we tested whether Pdr1, Ssz1 and Yap1 enhanced ER stress resistance by raising Rpn4 levels. We generated ∆hac1 cells in which the RPN4 gene was controlled by the constitutive CYC1 promoter and thus uncoupled from its normal regulation. We then overexpressed RPN4, PDR1, SSZ1 or YAP1 and assayed growth in the presence ngCPY*. Overexpression of all four genes promoted growth under these conditions (Figure 3A). Hence, Pdr1, Ssz1 and Yap1 can enhance ER stress resistance also when they are unable to activate the RPN4 promoter. It therefore appears likely that Pdr1 and Yap1 relieve ER stress in our system by inducing target genes other than RPN4. In the case of Pdr1, candidates include genes for multidrug transporters such as PDR5, PDR10 and PDR15, which may export estradiol from cells and thereby lower the levels of ngCPY*.
Figure 2
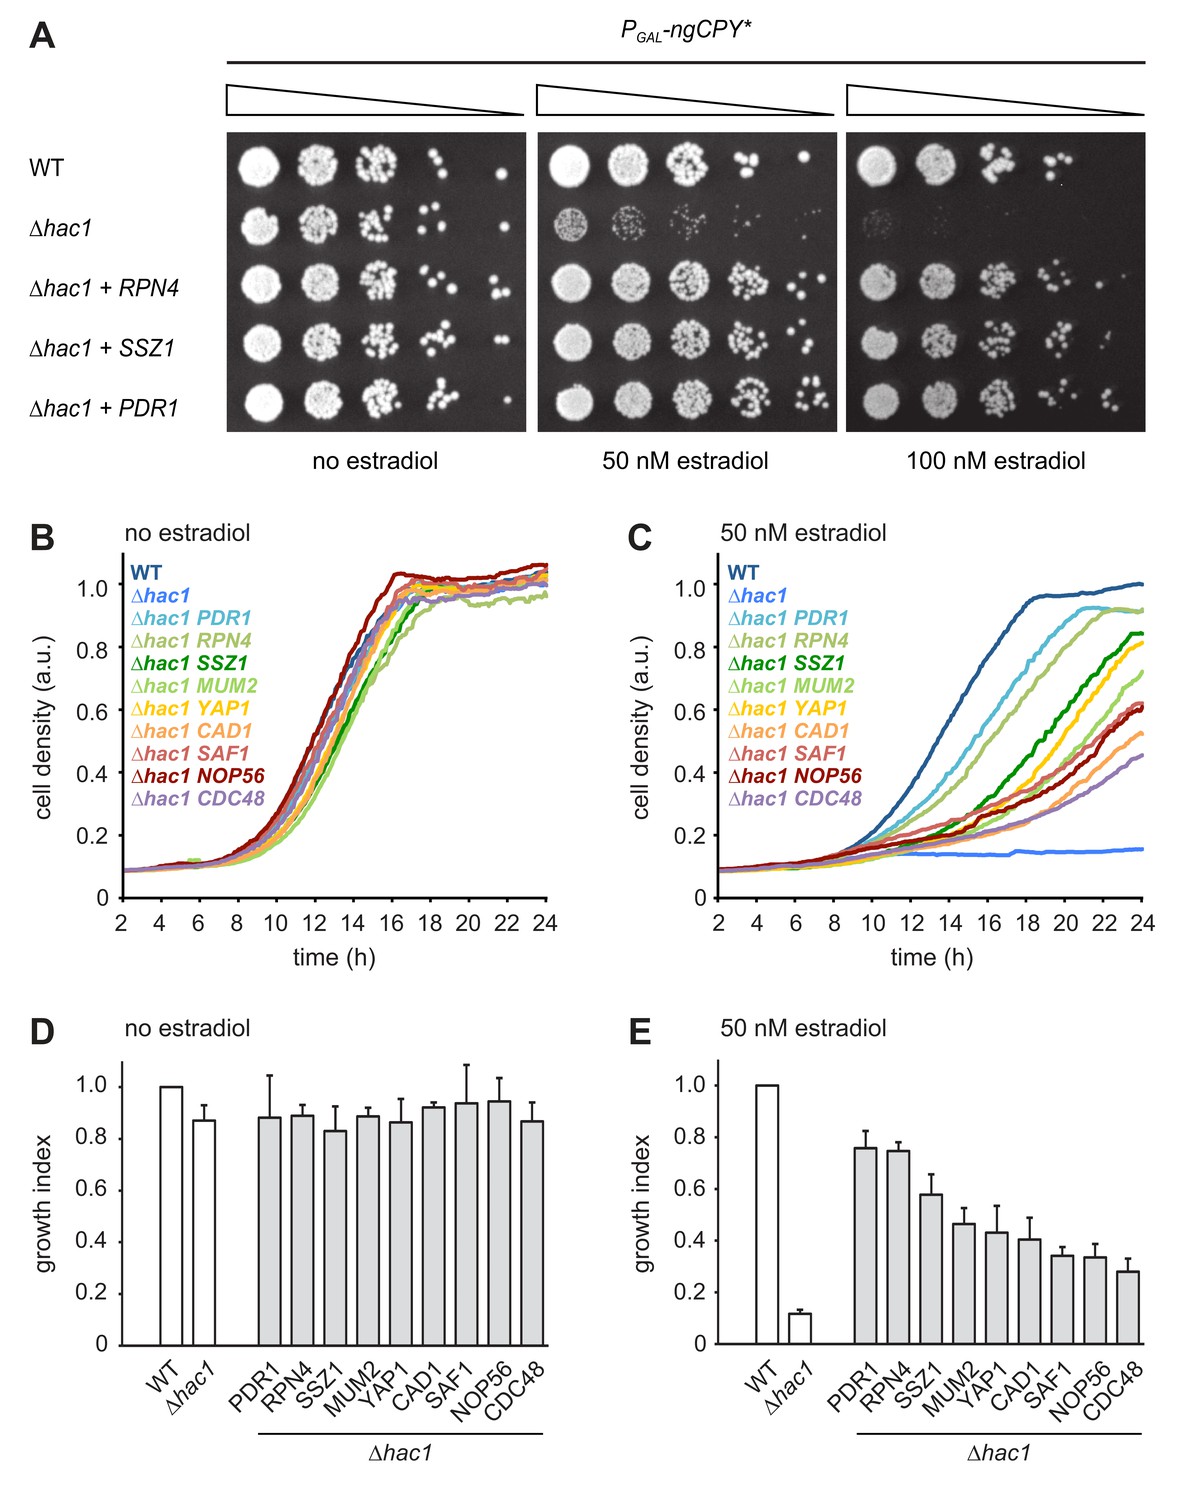
Multicopy suppression of ngCPY* toxicity in ∆hac1 cells.
(A) Growth assay on solid media of wild-type (WT) and ∆hac1 cells expressing ngCPY* under the control of the estradiol-inducible GAL promoter system and overexpressing RPN4, SSZ1 or PDR1 from extrachromosomal plasmids where indicated. (B) Growth assay in liquid medium of WT and ∆hac1 cells expressing ngCPY* under the control of the estradiol-inducible GAL promoter system. ∆hac1 cells additionally overexpressed the indicated genes. Cells were grown without estradiol. a.u., arbitrary units. (C) As in panel B, but in the presence of 50 nM estradiol. (D) Quantification of growth assays as shown in panel B. Data are normalized to WT cells. Mean ±SEM, n = 4. (E) Quantification of growth assays as shown in panel C. Data are normalized to WT cells. Mean ±SEM, n = 4.
Figure 3
Rpn4 and the UPR are functionally linked.
(A) Growth assay on solid media of ∆hac1 cells containing the constitutive CYC1 promoter in place of the endogenous RPN4 promoter, expressing ngCPY* under the control of the estradiol-inducible GAL promoter system and overexpressing RPN4, SSZ1, PDR1 or YAP1 where indicated. (B) Growth assay on solid media of wild-type (WT), ∆rpn4, ∆hac1 and ∆hac1 ∆rpn4 cells expressing ngCPY* under the control of the estradiol-inducible GAL promoter system and overexpressing RPN4 where indicated. (C) As in panel B, but on media containing different concentrations of tunicamycin (Tm).
Table 1
Genes identified in the screen.
https://doi.org/10.7554/eLife.43244.006| Gene | Description |
|---|---|
| HAC1 | transcription factor, regulates the unfolded protein response |
| RPN4 | transcription factor, stimulates expression of proteasome genes |
| PDR1 | transcription factor, regulates the pleiotropic drug response, induces RPN4 transcription |
| SSZ1 | Hsp70 chaperone, part of ribosome-associated complex, overexpression activates Pdr1 |
| MUM2 | protein essential for meiotic DNA replication and sporulation |
| YAP1 | transcription factor, regulates response to oxidative stress, induces RPN4 transcription |
| CAD1 | transcription factor, involved in stress responses, paralog of YAP1 |
| SAF1 | F-box protein, subunit of SCF ubiquitin ligase complexes |
| NOP56 | essential nucleolar protein |
The identification of Rpn4 suggests that enhanced proteasome biogenesis promotes ER stress resistance. However, the entirety of genes controlled by Rpn4, here referred to as the Rpn4 regulon, encompasses many genes beyond those encoding proteasome subunits (Mannhaupt et al., 1999; Jelinsky et al., 2000). Rpn4 may therefore counteract ER stress by more than one mechanism. Indeed, the RPN4 regulator Yap1 is itself activated by Rpn4 (Mannhaupt et al., 1999) and may aid stress resistance by preventing oxidative damage. Furthermore, we directly tested the Rpn4 target gene CDC48 (Bosis et al., 2010), even though it was not found in the screen. Overexpression of CDC48 also restored growth of ∆hac1 cells expressing ngCPY*, although weakly compared to overexpression of RPN4 (Figure 2B-E). Overall, the outcome of the screen suggests that Rpn4 activity becomes limiting for cell proliferation during ER stress, at least in UPR mutants.
Rpn4 and the UPR cooperate to counteract ER stress
RPN4 is not controlled by Hac1 and hence not a UPR target gene (Travers et al., 2000; Pincus et al., 2014). This lack of a direct link suggests that Rpn4 acts in parallel to, rather than downstream of, the UPR (Ng et al., 2000). To better understand the interplay between Rpn4 and the UPR, we manipulated Rpn4 levels in wild-type and ∆hac1 cells and challenged these cells with ngCPY* or tunicamycin (Figure 3B and C). Overexpression of RPN4 in wild-type cells increased resistance to both stressors. This observation indicates that Rpn4 activity becomes limiting for cell proliferation during ER stress also when the UPR is intact. Conversely, deletion of RPN4 caused a general growth defect and sensitized cells to ngCPY* and tunicamycin, consistent with previous reports (Wang et al., 2008; Hou et al., 2014; Rousseau and Bertolotti, 2016). As expected, ∆hac1 cells were highly vulnerable to either ER stressor, and RPN4 overexpression provided a measure of protection. ∆hac1 ∆rpn4 cells grew very poorly already in the absence of ngCPY* or tunicamycin, and not at all in their presence. The synthetic sickness phenotype of ∆hac1 ∆rpn4 cells agrees with earlier reports and shows that Rpn4 and the UPR are functionally linked (Ng et al., 2000; Hou et al., 2014).
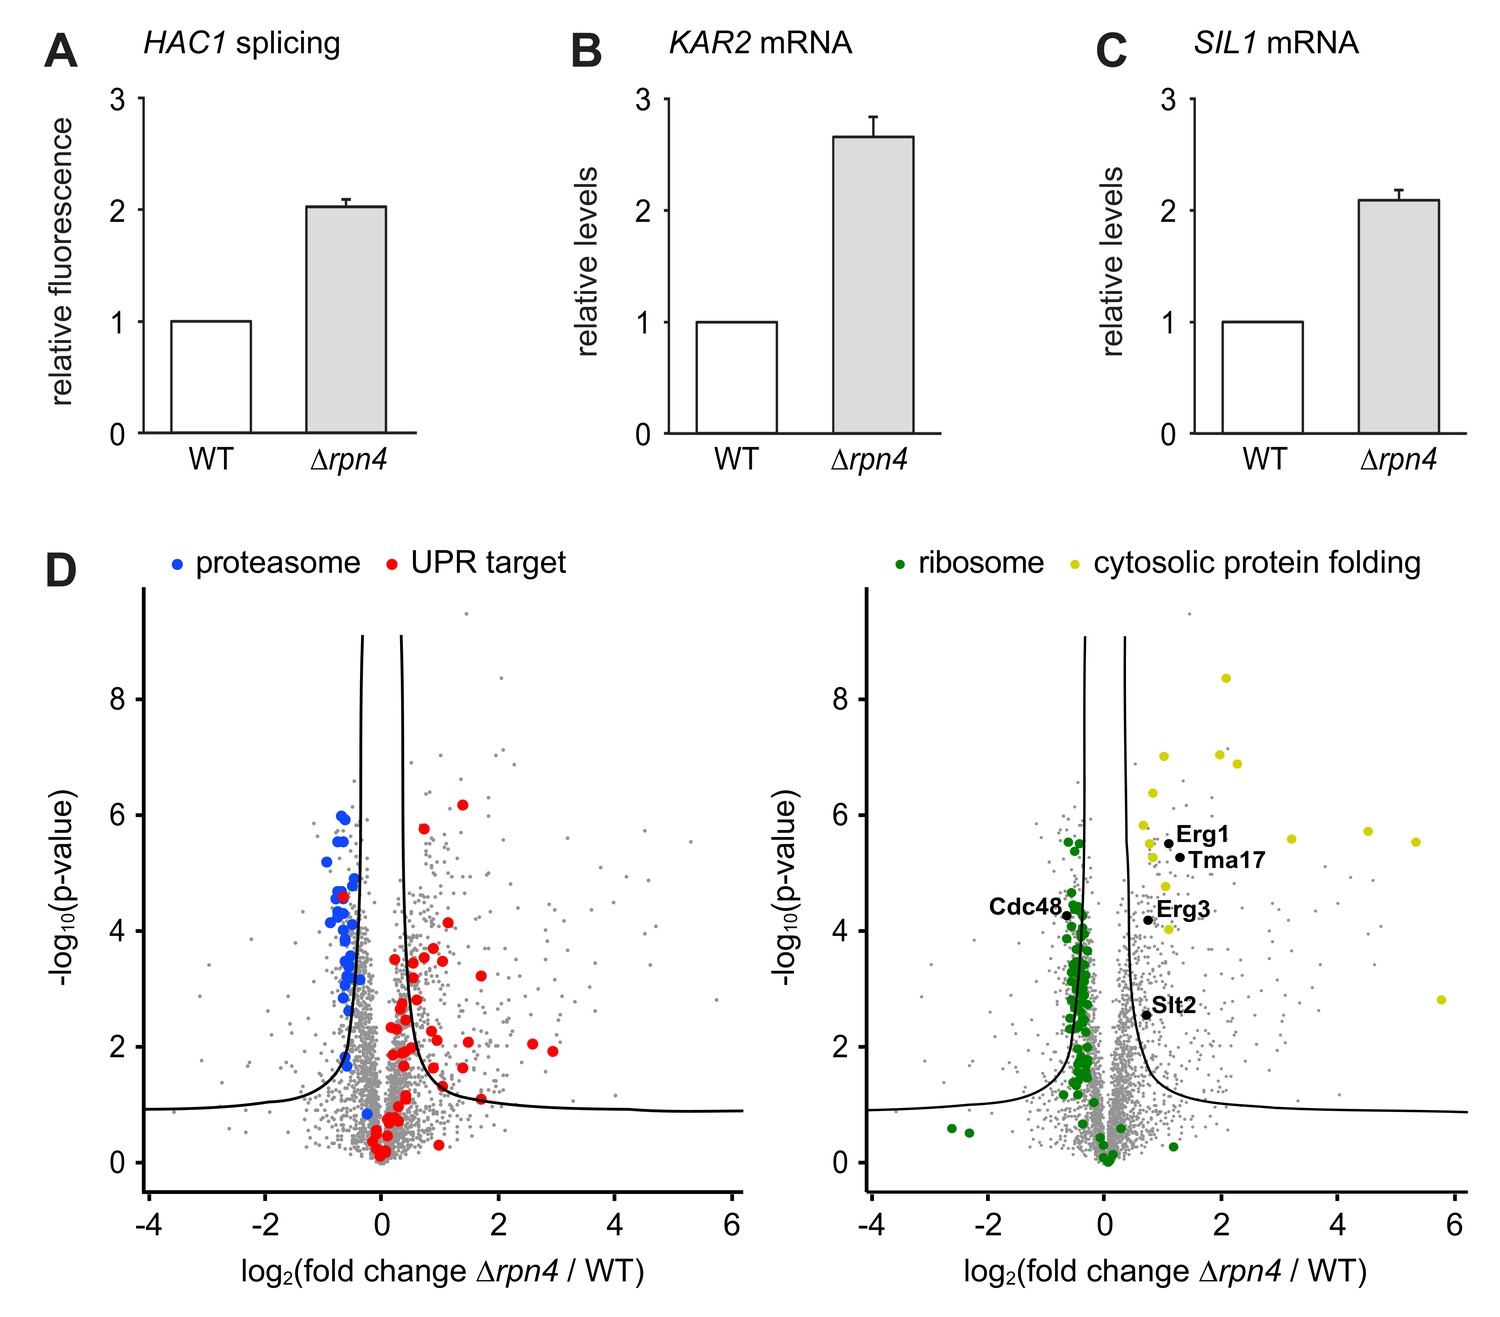
The slow growth of ∆hac1 ∆rpn4 double mutants compared with ∆rpn4 single mutants implies that the UPR is constitutively active and physiologically important in Rpn4-deficient cells. Indeed, HAC1 splicing was elevated in untreated ∆rpn4 cells, consistent with high throughput data (Figure 4A; Jonikas et al., 2009). Accordingly, quantitative real-time PCR showed that mRNA levels of the UPR target genes KAR2 and SIL1 were higher in ∆rpn4 mutants than in wild-type cells (Figure 4B and C). To further characterize the effect of RPN4 deletion, we compared the proteomes of wild-type and ∆rpn4 cells by quantitative mass spectrometry. As expected, the abundance of proteasome subunits was reduced in cells lacking Rpn4, while the abundance of proteins encoded by UPR target genes was increased (Figure 4D and Figure 4—source data 1). Many other proteins were changed significantly, illustrating the profound impact of loss of Rpn4. First, Cdc48 levels were lower in ∆rpn4 cells. Second, the levels of the stress-inducible proteasome assembly chaperone Tma17 and its activator Slt2/Mpk1 were elevated (Hanssum et al., 2014; Rousseau and Bertolotti, 2016). Third, cytosolic protein folding machinery was upregulated and the abundance of many ribosomal proteins was suppressed, indicating a broad stress response (Gasch et al., 2000). Fourth, many proteins that are involved in sterol synthesis and constitutively turned over by different ERAD pathways were more abundant in ∆rpn4 cells. These proteins included Erg1, 3, 5, 9, 11, 25, 27, 28 and Hmg2, although only Erg1 and Erg3 met our stringent criteria for significance (Hampton et al., 1996; Foresti et al., 2013; Foresti et al., 2014; Hitchcock et al., 2003; Khmelinskii et al., 2014; Christiano et al., 2014). Their accumulation implies generally impaired ERAD in ∆rpn4 cells. Importantly, neither Erg1 nor Erg3 are regulated by the UPR (Travers et al., 2000; Pincus et al., 2014), arguing against the possibility that their increased abundance can be explained by the constitutive activation of the UPR in ∆rpn4 cells. In sum, cells lacking Rpn4 suffer from chronic ER stress, likely because inefficient ERAD leads to an accumulation of misfolded and redundant proteins in the ER. In response, they activate the UPR, augment proteasome assembly capacity, enhance cytosolic protein folding and attenuate protein synthesis.
Figure 4
Loss of Rpn4 activates the UPR and triggers a broad adaptive response.
(A) Flow cytometric measurement of GFP levels relative to cytosolic BFP in wild-type (WT) and ∆rpn4 cells harboring the HAC1 splicing reporter. Data are normalized to WT cells. Mean ±SEM, n = 3. (B) KAR2 mRNA levels in WT and ∆rpn4 cells as measured by quantitative real-time PCR. Data are normalized to WT cells. Mean ±SEM, n = 3. (C) As in panel B, but for SIL1. (D) Global effects of RPN4 deletion on protein expression. For each protein, the x axis shows the average log2 fold change between WT and ∆rpn4 cells (proteins increased in the ∆rpn4 strain have positive values); the y axis shows the result of a t test for that difference (two-tailed; n = 4). The ‘‘volcano’’ lines indicate thresholds of significance. Proteins falling above the volcano lines are significantly changed. The left and right panels show the same plot but with different proteins highlighted. See Figure 4—source data 1 for the data used to generate the plot. In ∆rnp4 cells, proteasome subunits are downregulated (blue dots, p=1.1×10⁻¹⁷, n = 32), UPR targets are upregulated (red dots, p=1.8×10⁻⁹, n = 50), ribosomal proteins are downregulated (green dots, p=7.5×10⁻²⁹, n = 89) and proteins involved in cytosolic protein folding are upregulated (yellow dots, p=3.8×10⁻⁹, n = 14).
-
Figure 4—source data 1
Proteomics data.
- https://doi.org/10.7554/eLife.43244.008
The above results show that cells attempt to compensate the lack of Rpn4 by activating the UPR. To test whether the inverse is true and cells compensate the lack of a functionally sufficient UPR by activating the Rpn4 regulon, we monitored Rpn4 abundance. Rpn4 is a short-lived protein that is rapidly turned over by the proteasome (Xie and Varshavsky, 2001). When proteasome capacity becomes limiting, Rpn4 accumulates and promotes proteasome biogenesis until its degradation is restored. This negative feedback loop homeostatically adjusts proteasome activity (Dohmen et al., 2007). The levels of chromosomally tagged Rpn4-HA in wild-type and ∆hac1 cells were similar at steady state (Figure 5A and B). Upon treatment with 2 µg/ml tunicamycin, they increased two-fold within 15 min. Subsequently, Rpn4 abundance continued to climb but did so more quickly in ∆hac1 cells, reaching more than four-fold basal levels after 60 min. To determine whether this rise involved an upregulation of RPN4 transcription, we analyzed RPN4 mRNA by quantitative real-time PCR. In wild-type cells, tunicamycin treatment for up to 60 min induced the UPR target genes KAR2 and SIL1 (Figure 5C and Figure 5—figure supplement 1), but not RPN4 (Figure 5D). Therefore, under these conditions, Rpn4 accumulates through a post-transcriptional mechanism, presumably by slowed degradation. In ∆hac1 cells, tunicamycin treatment induced KAR2 and SIL1 less strongly than in wild-type cells but increased RPN4 mRNA levels. While we cannot rule out changes in mRNA stability, we assume that this rise reflects enhanced transcription. This response likely contributes to the more pronounced stress-induced upregulation of Rpn4 abundance in ∆hac1 cells. Importantly, prolonged ER stress upon treatment with 5 µg/ml tunicamycin raised RPN4 mRNA levels also in wild-type cells (Figure 5E). Accordingly, the protein abundance of proteasome subunits and all detectable proteasome assembly chaperones was elevated (Figure 5F and Figure 4—source data 1). Hence, during ER stress, cells augment the UPR by enhancing Rpn4 activity and promoting proteasome biogenesis. Interestingly, proteasome subunit abundance still increased during ER stress in ∆rpn4 cells (Figure 5—figure supplement 2), possibly reflecting a recently suggested post-transcriptional mechanism mediated by Slt2/Mpk1 (Rousseau and Bertolotti, 2016). Nevertheless, the levels of proteasome subunits in ER-stressed ∆rpn4 cells remained below even those of untreated wild-type cells. Collectively, these results show that activation of the UPR and the Rpn4 regulon are two cooperating elements of the cellular response to ER stress.
Figure 5 with 2 supplements see all
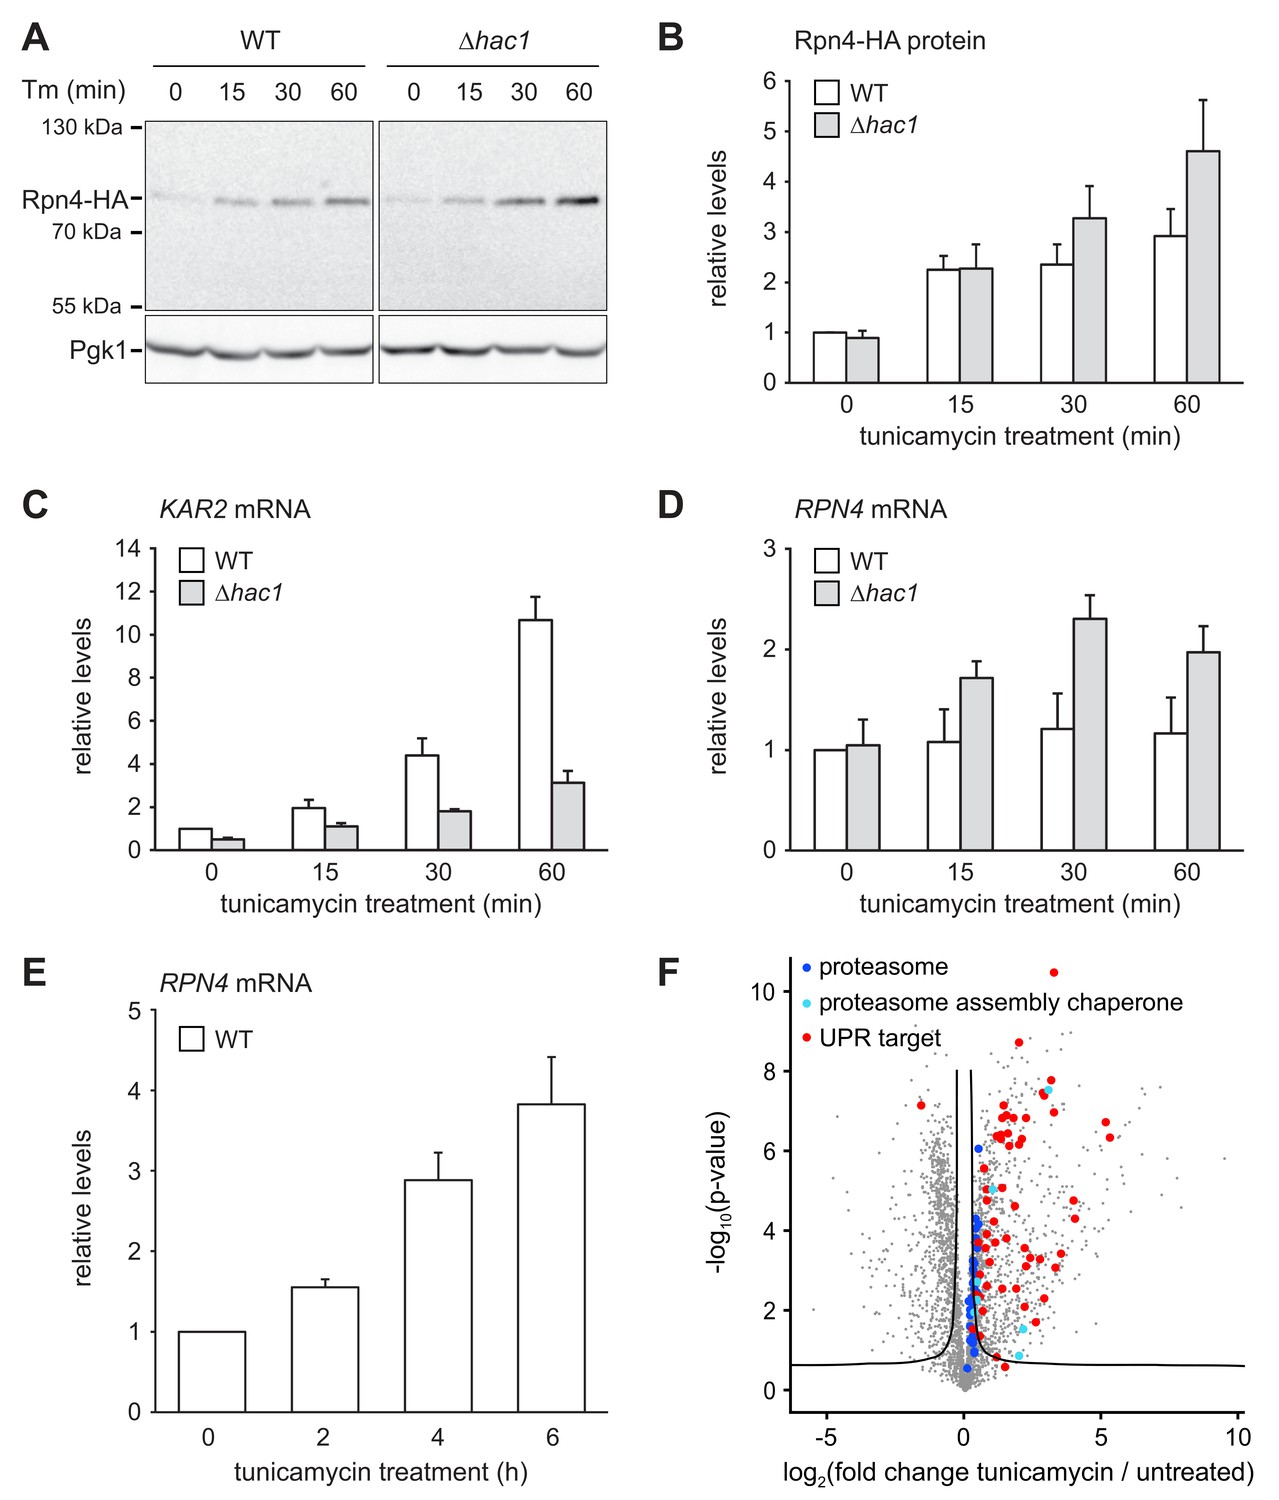
ER stress increases Rpn4 abundance, induces RPN4 transcription and promotes proteasome biogenesis.
(A) Western blot of HA and Pgk1 from wild-type (WT) and ∆hac1 cells expressing Rpn4-HA and treated with 2 µg/ml tunicamycin (Tm) for the times indicated. (B) Quantification of Rpn4-HA protein levels relative to Pgk1 from western blots as shown in panel A. Data are normalized to WT cells at t = 0. Mean ±SEM, n = 5. (C) KAR2 mRNA levels in WT and ∆hac1 cells treated with 2 µg/ml tunicamycin for the times indicated. Data are normalized to WT cells at t = 0. Mean ±SEM, n = 3. (D) As in panel C, but for RPN4. (E) As in panel C, but for RPN4 after treatment with 5 µg/ml tunicamycin for the times indicated. (F) Global effects of tunicamycin treatment on protein expression. For each protein, the x axis shows the average log2 fold change between untreated WT cells and WT cells treated with 5 µg/ml tunicamycin for 4 hr (proteins upregulated by the treatment have positive values); the y axis shows the result of a t test for that difference (two-tailed; n = 4). The ‘‘volcano’’ lines indicate thresholds of significance. Proteins falling above the volcano lines are significantly changed. See Figure 4—source data 1 for the data used to generate the plot. Treatment with tunicamycin causes upregulation of proteasome subunits (dark blue dots, p=7.6×10⁻³, n = 32), proteasome assembly chaperones (light blue dots, p=3.3×10⁻³, n = 8), and UPR targets (red dots, p=3.3×10⁻²², n = 58).
Rpn4 is upregulated by and protects against mislocalized secretory proteins
We next asked how ER stress upregulates Rpn4. The stronger increase in Rpn4 abundance and the more sensitive RPN4 transcriptional response in ∆hac1 cells may reflect more severe ER stress in these mutants. To test this assumption, we used protein translocation as readout for ER function. When the capacity of ER chaperones is exhausted, they can no longer assist protein import. As a result, translocation is compromised, including that of Kar2 itself (Vogel et al., 1990). Western blotting showed a single band for Kar2 in untreated wild-type and ∆hac1 cells (Figure 6A). Treatment with 2 µg/ml tunicamycin for up to 60 min did not change Kar2 levels. However, a second Kar2 band of slightly higher molecular weight appeared in ∆hac1 cells, starting at 30 min. Since Kar2 is not glycosylated, this upshift indicates retention of its cleavable signal sequence (ss) and suggests that the slower migrating form corresponds to untranslocated ss-Kar2 (Ng et al., 1996). Hence, under these conditions, ∆hac1 cells show signs of overwhelmed chaperone capacity. Treatment with 5 µg/ml tunicamycin increased Kar2 abundance in wild-type cells and caused the appearance of ss-Kar2 in both strains (Figure 6B). Therefore, strong ER stress impairs translocation also in wild-type cells. These results confirm that ER stress is initially buffered by the UPR in wild-type cells but rapidly disrupts ER function in ∆hac1 cells.
Figure 6 with 1 supplement see all
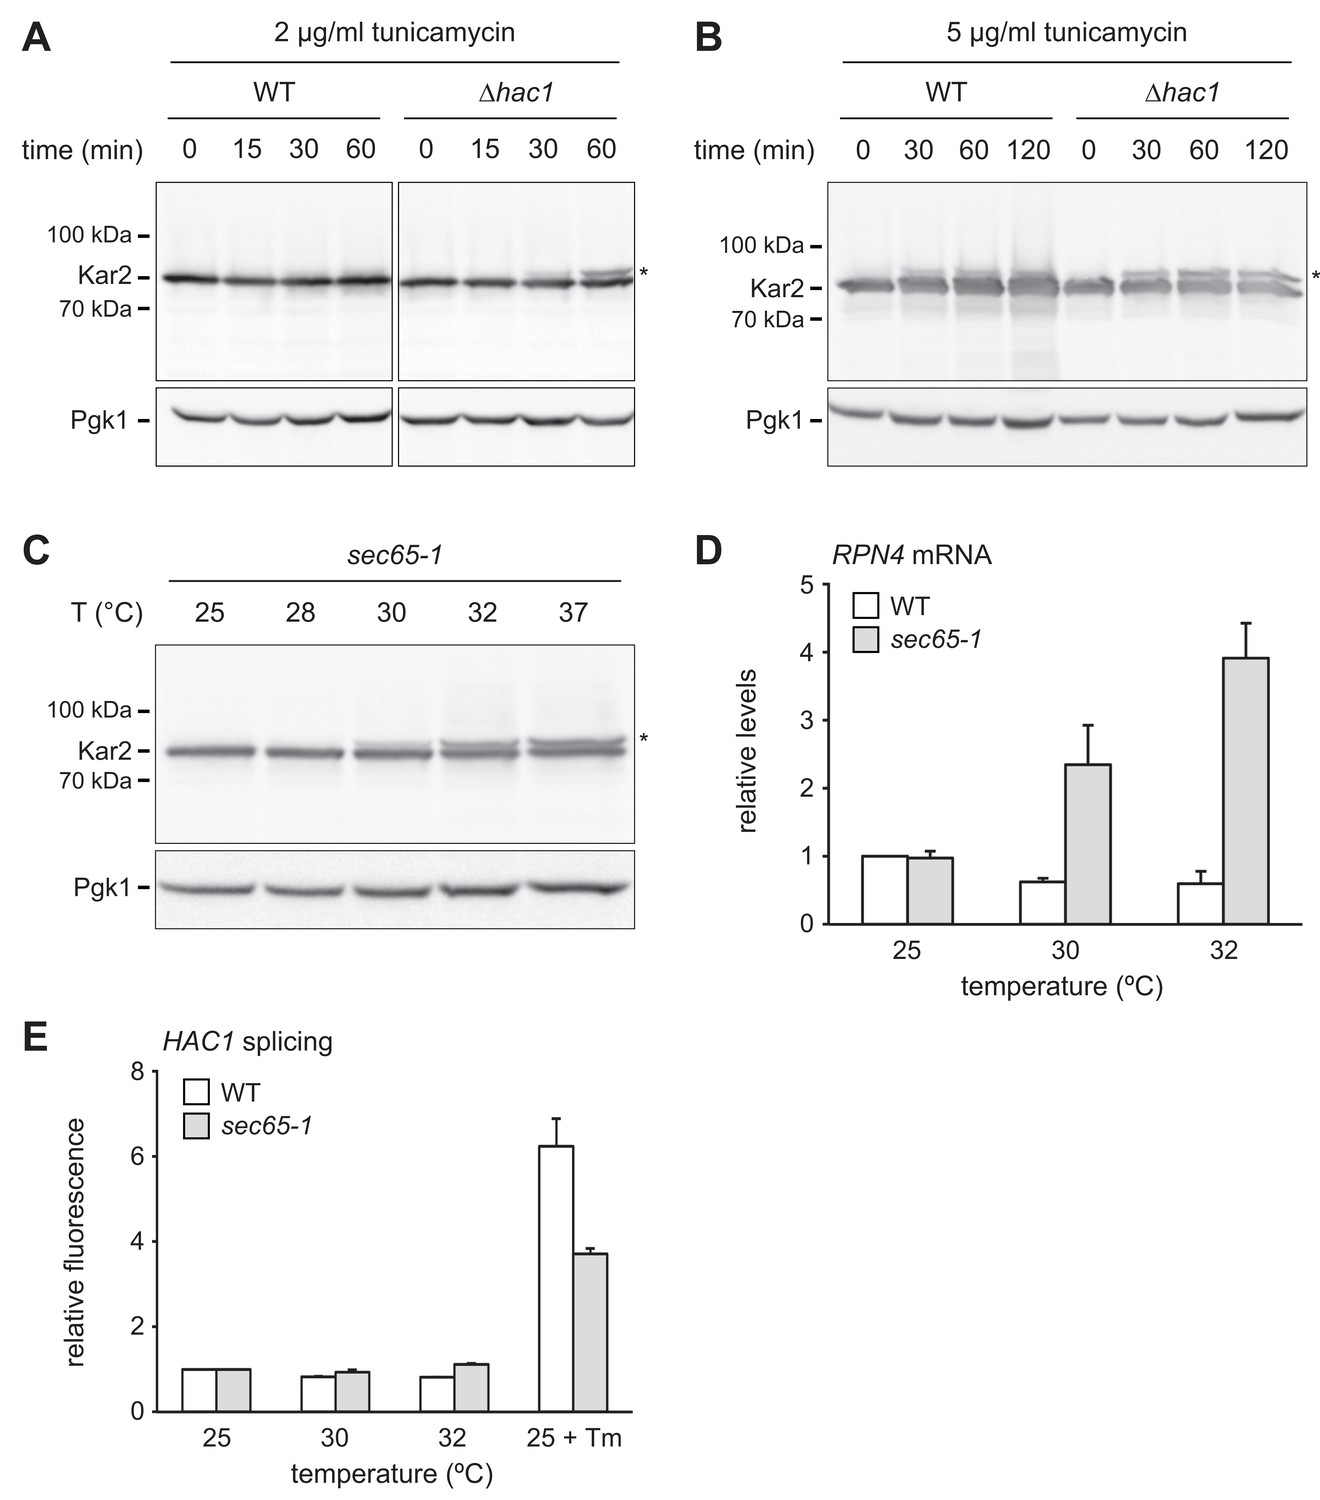
RPN4 is upregulated by cytosolic mislocalization of secretory proteins.
(A) Western blot of Kar2 and Pgk1 from wild-type (WT) and ∆hac1 cells treated with 2 µg/ml tunicamycin for the times indicated. The asterisk indicates untranslocated ss-Kar2. (B) As in panel A, but with 5 µg/ml tunicamycin. (C) Western blot of Kar2 and Pgk1 from sec65-1 cells grown at 25°C and shifted to the indicated temperatures for 90 min. The asterisk indicates untranslocated ss-Kar2. (D) RPN4 mRNA levels in WT and sec65-1 cells grown at 25°C and shifted to the indicated temperatures for 90 min. Data are normalized to WT cells at 25°C. Mean ±SEM, n = 3. (E) Flow cytometric measurement of GFP levels in WT and sec65-1 cells harboring the HAC1 splicing reporter. Cells grown at 25°C were shifted to the indicated temperatures or treated with 2 µg/ml tunicamycin (Tm) for 90 min. For each strain, data are normalized to 25°C. Mean ±SEM, n = 3.
The above results reveal a conspicuous correlation between impaired translocation and elevated RPN4 mRNA levels. Both phenomena occur in ∆hac1 cells exposed to 2 µg/ml tunicamycin, whereas 5 µg/ml are required in wild-type cells. Impaired translocation and increased RPN4 mRNA levels could be unrelated consequences of ER stress. Alternatively, their correlation could reflect a causal relationship, with translocation defects activating RPN4 transcription. To distinguish between these possibilities, we employed sec65-1 cells, which express a temperature-sensitive variant of the SRP subunit Sec65 (Stirling et al., 1992). Disruption of SRP function rapidly inhibits translocation and causes accumulation of secretory proteins in the cytosol, where they are unable to fold properly. As expected, Kar2 translocation was intact in sec65-1 cells at the permissive temperature of 25°C but impaired upon a shift to 30°C or above (Figure 6C; Ng et al., 1996). RPN4 mRNA levels did not change when wild-type or sec65-1 cells were shifted from 25°C to 28°C (Figure 6—figure supplement 1). However, shifts to temperatures of 30°C or above raised RPN4 mRNA levels specifically in sec65-1 cells (Figure 6D and Figure 6—figure supplement 1). Importantly, HAC1 splicing was not activated under these conditions (Figure 6E). Therefore, disrupted translocation induces the RPN4 gene even in the absence of ER stress. This finding indicates that stress-induced translocation defects activate RPN4 transcription.
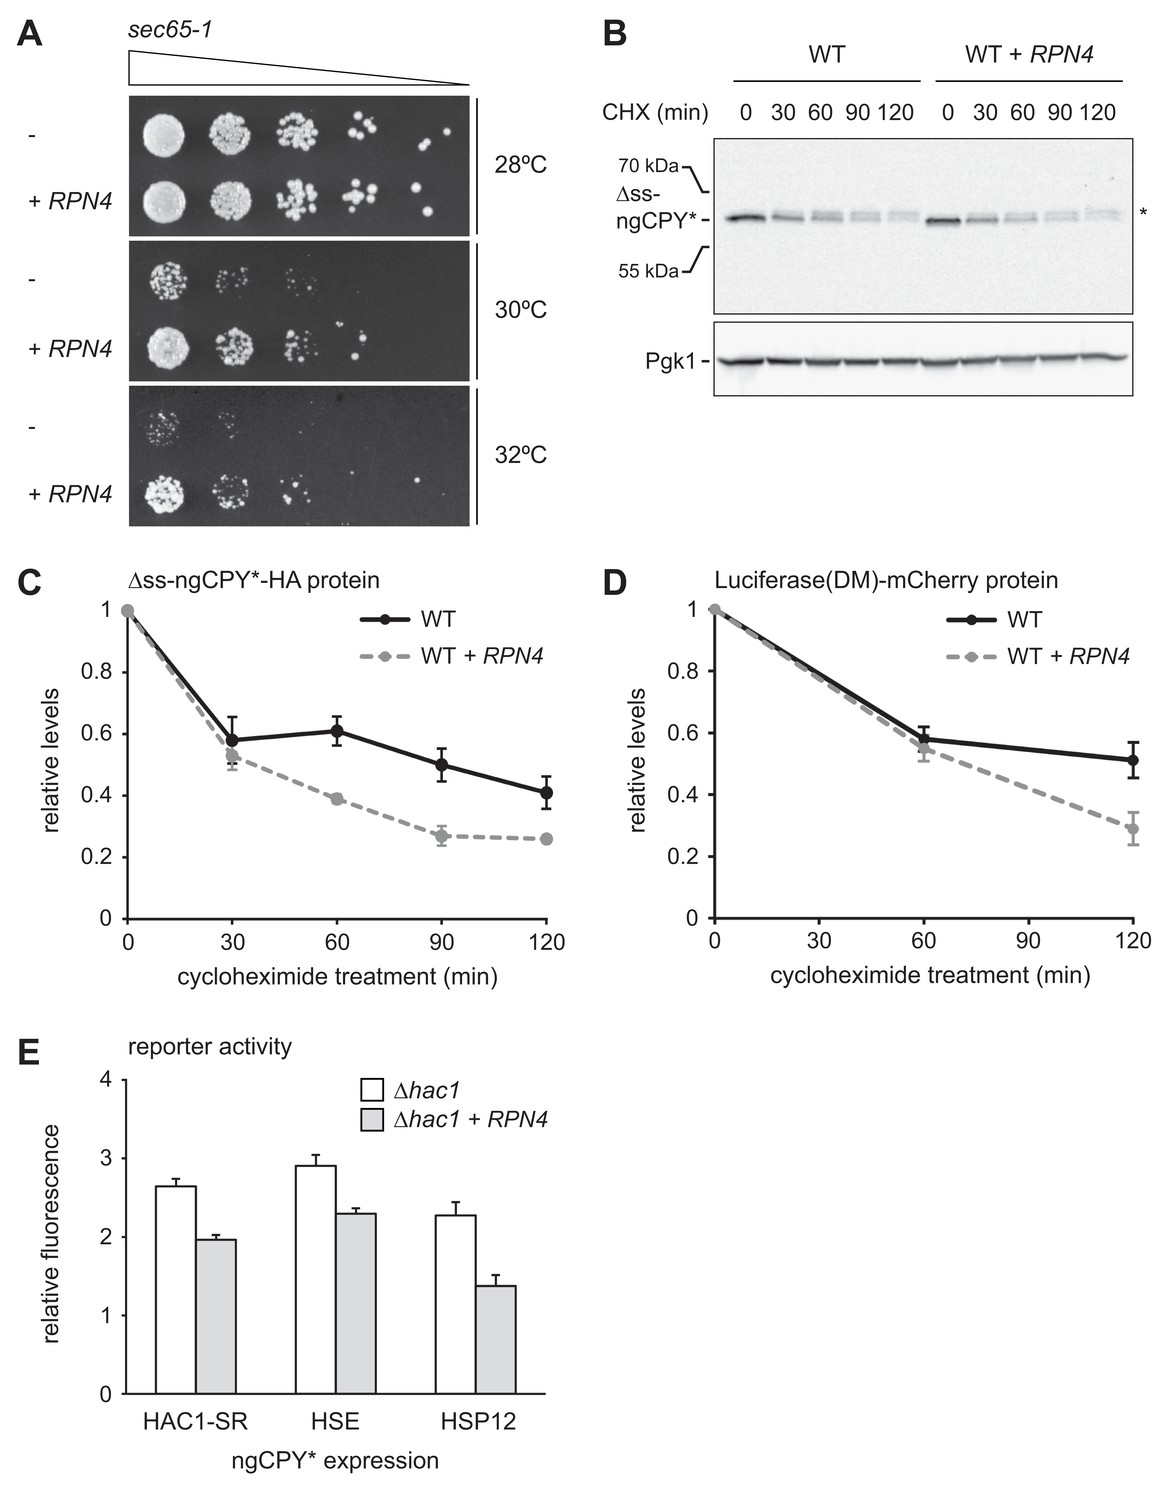
To examine the physiological significance of RPN4 expression in cells suffering from translocation defects, we analyzed growth of sec65-1 cells at different temperatures. Cells grew normally at up to 28°C but showed almost no growth at 30°C or above (Figure 7A). These observations are consistent with the described tight temperature sensitivity of the sec65-1 allele (Stirling et al., 1992). RPN4 overexpression restored some growth at 30°C and 32°C, showing that the levels of Rpn4 were physiologically important under these conditions. Next, we tested whether elevated Rpn4 abundance promoted the degradation of misfolded cytosolic proteins. Cycloheximide chase experiments showed that RPN4 overexpression accelerated the degradation of ∆ss-ngCPY*-HA, which mislocalizes to the cytosol due to deletion of its signal sequence (Figure 7B and C). The same was true for Luciferase(DM)-mCherry, another misfolded cytosolic model protein (Figure 7D). Collectively, these experiments indicate that the Rpn4 regulon is activated by and protects against cytosolic mislocalization of secretory proteins.
Figure 7
Rpn4 protects against cytosolic protein misfolding.
(A) Growth assay on solid medium of sec65-1 cells grown at different temperatures and overexpressing RPN4 where indicated. (B) Western blot of HA and Pgk1 from cycloheximide-treated wild-type (WT) cells expressing ∆ss-ngCPY*-HA and additionally overexpressing RPN4 where indicated. Expression of ∆ss-ngCPY*-HA was induced with 100 nM estradiol for 4 hr. The asterisk indicates a slower-migrating, post-translationally modified form of ∆ss-ngCPY*-HA. CHX, cycloheximide. (C) Quantification of ∆ss-ngCPY*-HA levels relative to Pgk1 from western blots as shown in panel B. For each strain, data are normalized to t = 0. Mean ±SEM, n = 3. (D) Luciferase(DM)-mCherry levels relative to Pgk1 and normalized to t = 0. Quantification is based on western blots of mCherry and Pgk1 from cycloheximide-treated cells expressing Luciferase(DM)-mCherry and additionally overexpressing RPN4 where indicated. Mean ±SEM, n = 3. (E) Flow cytometric measurement of GFP levels in ∆hac1 cells harboring the HAC1 splicing reporter (HAC1-SR), HSE reporter or HSP12 reporter, expressing ngCPY* under the control of the estradiol-inducible GAL promoter system, and overexpressing RPN4 where indicated. Expression of ngCPY* was induced with 100 nM estradiol for 5 hr. Data are normalized to cells not treated with estradiol. Mean ±SEM, n = 3.
Our results show that RPN4 overexpression protects against ER stressors and cytosolically mislocalized secretory proteins, suggesting that it counteracts folding stress in the ER and the cytosol. To test this notion, we used reporters for three different stress response pathways: the HAC1 splicing reporter for the UPR, a heat shock element (HSE) reporter for the Hsf1-dependent heat shock response (Zheng et al., 2016) and an HSP12 reporter for the Msn2/4-dependent general stress response (Pincus et al., 2014). The transcription factors Msn2 and Msn4 are kept inactive by PKA (Görner et al., 1998). Stress conditions inhibit PKA, resulting in derepression of Msn2/4 and induction of genes such as HSP12 (Pincus et al., 2014). Although Hsf1 and the PKA-Msn2/4 pathway respond to prolonged ER stress (Liu and Chang, 2008; Pincus et al., 2014), they monitor the folding environment in the cytosol, and we employed the HSE and HSP12 reporters to read out cytosolic protein homeostasis. We introduced the reporters into ∆hac1 cells that did or did not overexpress RPN4, induced ER stress by ngCPY* expression and determined reporter activity. Expression of ngCPY* activated all three reporters, which was attenuated by RPN4 overexpression (Figure 7E). This result shows that Rpn4 can indeed improve protein homeostasis in both the ER and the cytosol.
Multiple signaling pathways mediate RPN4 induction by ER stress
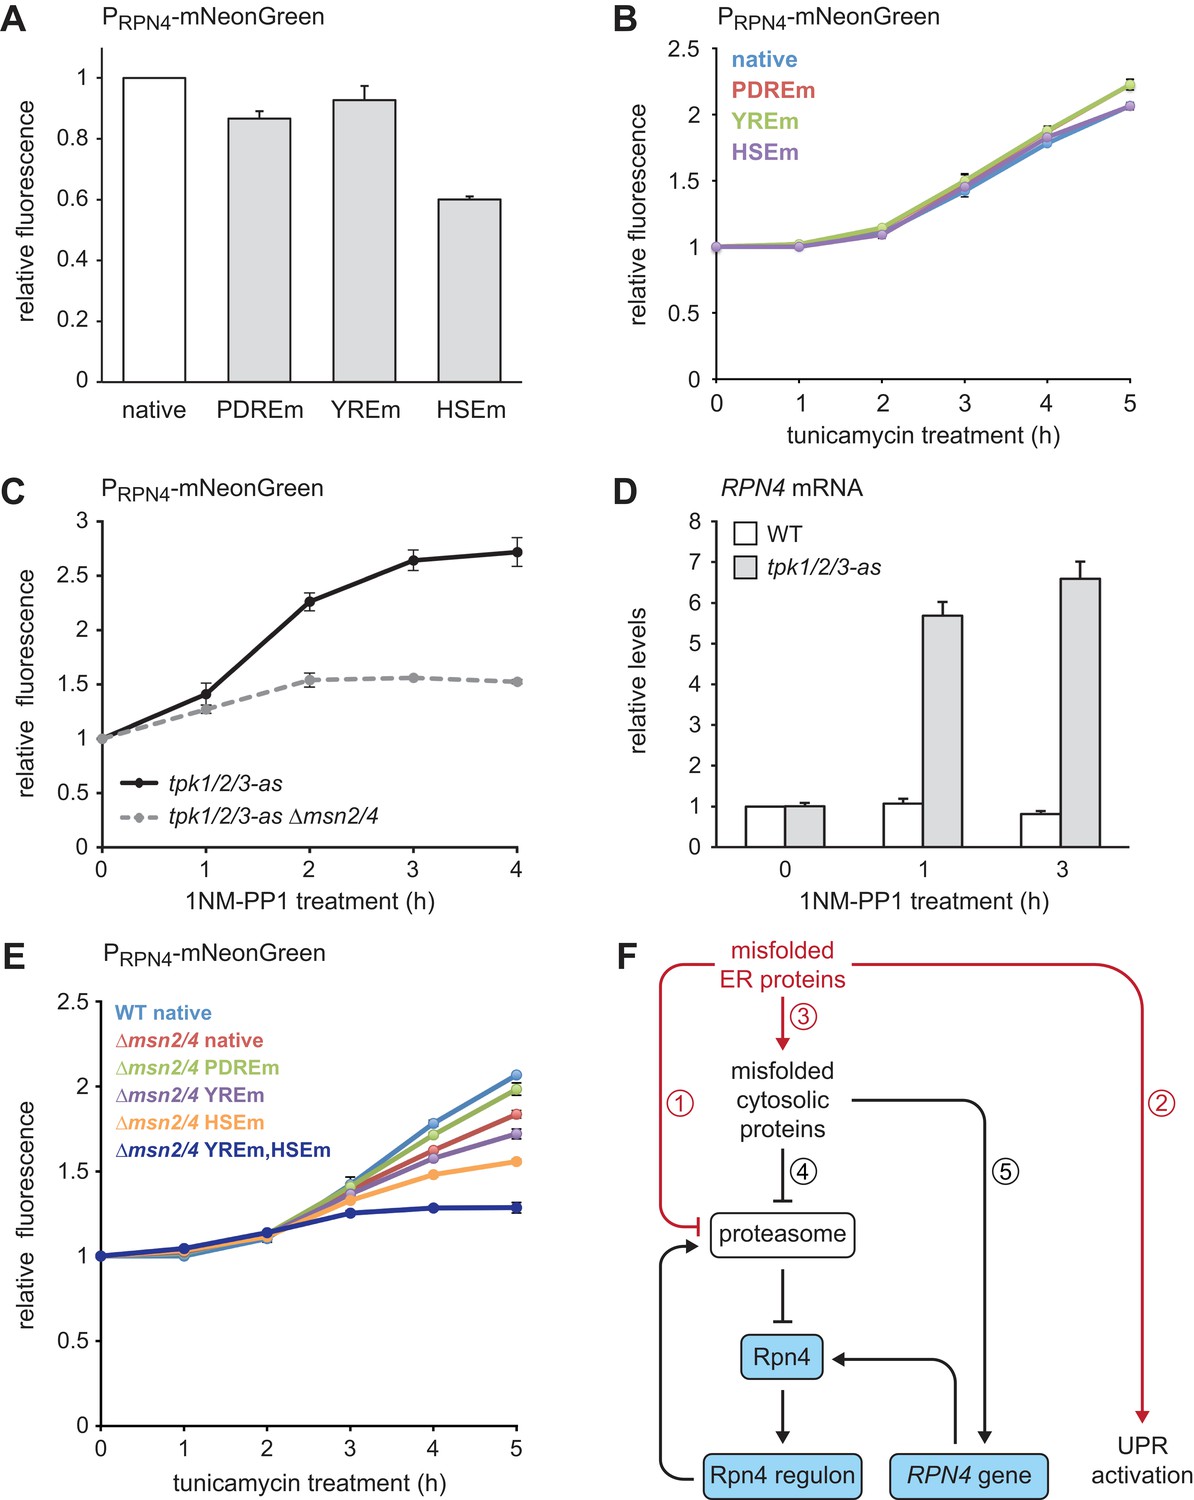
Finally, we investigated through which signaling pathways ER stress induces the RPN4 gene. The RPN4 promoter contains well-characterized binding sites for Pdr1/3, Yap1 and Hsf1, called the Pdr1/3 response element (PDRE), Yap1 response element (YRE) and heat shock element (HSE), respectively (Owsianik et al., 2002; Hahn et al., 2006). To test the relevance of these binding sites, we generated RPN4 reporters in which different RPN4 promoter variants controlled expression of the fast-maturing fluorescent protein mNeonGreen and measured mNeonGreen levels by flow cytometry. Steady-state activity of the RPN4 reporter was essentially unchanged by mutation of the two PDREs or the YRE but was reduced by 40% upon mutation of the HSE (Figure 8A). Tunicamycin treatment activated the RPN4 reporter, which was unaffected by mutation of any of the above promoter elements (Figure 8B). Hence, Hsf1 regulates basal RPN4 activity, but Pdr1/3, Yap1 and Hsf1 appear to be individually dispensable for RPN4 induction by ER stress.
Figure 8
Multiple signaling pathways mediate RPN4 induction by ER stress.
(A) Flow cytometric measurement of the activity of RPN4 reporter variants in untreated cells. Data are normalized to the reporter containing the native RPN4 promoter. The other reporters contain mutations in the two Pdr1/3 response elements (PDREm), the Yap1 response element (YREm) or the heat shock element (HSEm). Mean ±SEM, n = 4. (B) As in panel A, but after treatment with 5 µg/ml tunicamycin for the times indicated. Mean ±SEM, n = 3. (C) Flow cytometric measurement of the activity of the native RPN4 reporter in tpk1/2/3-as and tpk1/2/3 ∆msn2/4 cells treated with the ATP analog 1NM-PP1 for the times indicated. The analog-sensitive tpk1/2/3-as alleles enable specific inhibition of protein kinase A with 1NM-PP1. Mean ±SEM, n = 3. (D) RPN4 mRNA levels in wild-type (WT) and tpk1/2/3-as cells treated with 1NM-PP1 for the times indicated. Data are normalized to WT cells at t = 0. Mean ±SEM, n = 3. (E) Flow cytometric measurement of the activity of RPN4 reporter variants in WT and ∆msn2/4 cells treated with 5 µg/ml tunicamycin. Data are normalized to WT cells containing the reporter with the native RPN4 promoter. Mean ±SEM, n = 3. (F) Model for the cooperation of Rpn4 and the UPR. ER protein misfolding causes increased flux through the ERAD pathway, which strains proteasome capacity and inhibits efficient protein degradation (1). In addition, the UPR is activated (2). Severe ER stress leads to translocation defects, causing mislocalization of secretory proteins to the cytosol, where they cannot fold properly (3). These cytosolic misfolded proteins further burden the proteasome (4). As a result, Rpn4 is stabilized, the Rpn4 regulon is activated and proteasome biogenesis is enhanced. If cytosolic misfolded proteins persist, the RPN4 gene is induced (5), providing a second mechanism to increase Rpn4 abundance and augment proteasome biogenesis.
Given that ER stress triggers the general stress response (Pincus et al., 2014), we asked whether Msn2/4 downstream of PKA can activate the RPN4 gene. We used a strain in which the PKA isoforms Tpk1/2/3 had been modified such that their enlarged ATP binding pockets allowed specific inhibition of these kinases with the bulky ATP analog 1NM-PP1 (Hao and O'Shea, 2012). 1NM-PP1 treatment of cells harboring the analog-sensitive tpk1/2/3-as alleles induced both the RPN4 reporter and the endogenous RPN4 gene (Figure 8C and D). As expected, deletion of MSN2/4 strongly reduced activation of the RPN4 reporter upon PKA inhibition (Figure 8C). Activation of the RPN4 reporter by tunicamycin was blunted in ∆msn2/4 cells but not blocked (Figure 8E), suggesting that prolonged ER stress activates partially redundant mechanisms to induce RPN4. Accordingly, combined deletion of MSN2/4 and mutation of the YRE or the HSE additively reduced activation of the RPN4 reporter. Mutation of both the YRE and the HSE almost completely abolished reporter activation in a ∆msn2/4 background. These results show that multiple signaling pathways contribute to the induction of RPN4 transcription by ER stress.
Discussion
We have shown that Rpn4 and the UPR cooperate to counteract ER stress. Based on our findings, we propose the following model (Figure 8F). Protein misfolding in the ER burdens the proteasome by increased flux through the ERAD pathway, activates the UPR and eventually impairs protein translocation into the ER. As a result, secretory proteins mislocalize to the cytosol, where they are unable to fold properly and further strain proteasome capacity. Inefficient proteasomal degradation leads to an increase in Rpn4 abundance and activation of the Rpn4 regulon, which enhances proteasome biogenesis to clear misfolded ER and cytosolic proteins. Furthermore, persistent cytosolic protein misfolding induces the RPN4 gene through the transcription factors Msn2/4, Yap1 and Hsf1. The resulting rise in Rpn4 protein levels reinforces activation of the Rpn4 regulon.
Rpn4 abundance is controlled by rapid proteasomal turnover (Xie and Varshavsky, 2001) and by RPN4 gene activity. ER stress initially increases Rpn4 protein levels. Persistent ER stress, however, additionally raises RPN4 mRNA levels. These observations suggest a biphasic Rpn4 response. First, when misfolded proteins occupy the proteasome, Rpn4 is spared from degradation and activates its target genes, but RPN4 transcription remains unchanged. This scenario likely applies to early phases of ER stress and cases of mild stress. For instance, expression of the misfolded ER membrane protein Ste6* activates the Rpn4 regulon but not RPN4 transcription (Metzger and Michaelis, 2009). If slowed Rpn4 degradation is insufficient to resolve the stress, RPN4 transcription is upregulated in a second phase of the response, which provides another boost in Rpn4 target gene induction. Msn2/4, Yap1 and Hsf1 contribute to the stress-induced upregulation of RPN4, indicating that parallel pathways communicate protein misfolding to the RPN4 promoter. This situation is distinct from RPN4 induction after glucose starvation or heat shock, which requires Hsf1 but not Msn2/4 (Hahn and Thiele, 2004a). Interestingly, the RPN4 promoter does not contain a canonical stress response element as binding site for Msn2/4 (Martínez-Pastor et al., 1996). Therefore, it is not clear whether Msn2/4 bind to the RPN4 promoter directly, although high throughput data hint at this possibility (Harbison et al., 2004; Huebert et al., 2012). Furthermore, it remains to be determined exactly how cytosolic misfolding is sensed by Msn2/4, Hsf1 and Yap1. While the detection of misfolded cytosolic proteins by Hsf1 has been studied extensively, it is unknown how protein kinase A, which controls Msn2/4 and possibly also Hsf1 (Verghese et al., 2012), may monitor protein folding. Finally, it is unclear whether Yap1 is directly activated by misfolded proteins. Alternatively, its contribution to RPN4 activation could reflect the fact that YAP1 is an Rpn4 target gene (Mannhaupt et al., 1999) and may reinforce RPN4 transcription as part of a positive feedback loop.
Rpn4 controls genes involved in many processes, including proteasome biogenesis, protein ubiquitination and DNA repair (Mannhaupt et al., 1999; Jelinsky et al., 2000). Hence, the Rpn4 regulon could increase ER stress resistance through a combination of functional outputs. However, it has been shown that the sensitivity of ∆rpn4 cells to various stresses, including ER stress, results from their impaired induction of proteasome genes (Wang et al., 2008). Enhanced proteasome biogenesis is therefore likely to be critical for the promotion of ER stress resistance by Rpn4. Accordingly, overexpression of the Rpn4 target genes YAP1 or CDC48 increases ER stress resistance of UPR mutants much more weakly than RPN4 overexpression. Therefore, the relevant functions of Rpn4 must extend beyond inducing Yap1-driven oxidative stress tolerance or Cdc48-dependent ERAD, and our data support the notion that enhancing degradation of cytosolically mislocalized secretory proteins is a major factor. Nevertheless, the relative contributions of different components of the Rpn4 regulon to ER stress resistance remain to be delineated.
An effective UPR requires sufficient proteasome capacity to remove misfolded proteins through ERAD. Yet, the UPR does not control genes encoding proteasome subunits (Travers et al., 2000). Furthermore, the only proteasome-related genes among the 102 genes we defined as core UPR targets were PBA1 and ADD66, which encode proteasome assembly chaperones. Conversely, the Rpn4 regulon comprises most genes for proteasome subunits but only a few genes involved in ER protein folding, such as PDI1 (Mannhaupt et al., 1999). Hence, the transcriptional programs activated by the UPR and Rpn4 are largely distinct. They are, however, functionally complementary and represent two cooperating modules. This functional complementarity explains the strong negative genetic interaction between HAC1 and RPN4. Remarkably, ER stress activates a second signaling pathway that promotes proteasome biogenesis. The Slt2/Mpk1 MAP kinase, which augments ER stress resistance, controls chaperones responsible for 19S regulatory particle assembly and increases the abundance of complete 26S proteasomes during stress (Bonilla and Cunningham, 2003; Chen et al., 2005; Rousseau and Bertolotti, 2016). Taken together, it is evident that proteasome biogenesis is an important UPR-independent process that enhances resistance to ER stress.
ER homeostasis and proteasome biogenesis are coupled also in higher eukaryotes, as shown by activation of the mammalian UPR upon proteasome inhibition (Nishitoh et al., 2002; Obeng et al., 2006). Furthermore, the mechanisms adjusting proteasome abundance in yeast and mammals share extensive similarities. Proteasome inhibition, which mimics proteasome overload, induces proteasome genes also in mammalian cells (Mitsiades et al., 2002; Meiners et al., 2003). This response is mediated by the transcription factor Nrf1 and the Slt2/Mpk1 homolog Erk5 (Radhakrishnan et al., 2010; Steffen et al., 2010; Rousseau and Bertolotti, 2016). Similar to Rpn4, Nrf1 is short-lived and activates many proteasome genes (Radhakrishnan et al., 2010; Steffen et al., 2010). Remarkably, Nrf1 is constitutively turned over by ERAD (Steffen et al., 2010). Hence, when ER stress overburdens ERAD, Nrf1 is stabilized and can promote proteasome biogenesis. Another intriguing parallel involves the mammalian proteasome assembly chaperones PAC1/2. As mentioned above, expression of their yeast counterparts PBA1 and ADD66 is induced by the UPR. PAC1/2 protein abundance also increases during ER stress, although this is achieved by iRhom1-mediated stabilization (Lee et al., 2015). Understanding the links between the UPR and proteasome biogenesis is relevant for human disease. Multiple myeloma cells suffer from chronic ER stress and are highly sensitive to proteasome inhibition, implying that proteasome capacity is limiting for survival of these cells. This insight has led to major improvements in the treatment of plasma cell cancer through the use of proteasome inhibitors (Goldberg, 2012).
A simple perspective on adaptive responses is that protein misfolding in a particular subcellular compartment triggers a dedicated program that enhances quality control specifically in the troubled organelle. Our work supports a more holistic view that emphasizes two additional concepts: functional modularity and cross-compartment coordination. Regulated proteasome biogenesis is a functional module that serves as part of the cellular response to ER stress. Interestingly, proteasome biogenesis is also activated by impaired mitochondrial protein import (Wrobel et al., 2015; Wang and Chen, 2015; Boos et al., 2019). It may therefore be a functional module that is commonly employed when stress necessitates clearance of mislocalized proteins from the cytosol. Autophagy and global attenuation of translation may be other such modules (Gasch et al., 2000). Furthermore, adaptive responses are not restricted to the compartment where stress initially arises. For example, as shown here, ER stress activates the UPR but also the Rpn4 regulon to safeguard against protein misfolding in the cytosol. Second, certain types of mitochondrial stress trigger the mitochondrial unfolded protein response but also activate the cytosolic heat shock response and promote proteasome biogenesis (Ho et al., 2006; Wrobel et al., 2015; Kim et al., 2016; Boos et al., 2019). Third, cytosolic folding stress activates the Hsf1-dependent heat shock response, which promotes protein folding in the cytosol but also controls the expression of major chaperones that function elsewhere, including Kar2 in the ER and Ssc1 in mitochondria (Yamamoto et al., 2005; Hahn et al., 2004b). Fourth, the UPR regulates genes that function in the entire secretory pathway (Travers et al., 2000). Many additional links between different organelle quality control systems exist in yeast and higher eukaryotes (Higuchi-Sanabria et al., 2018). A driving force for the evolution of these links may have been the need to prevent the spread of protein folding problems throughout the cell. Overall, it emerges that adaptive responses, although triggered by stress in one compartment, engage a combination of functional modules for comprehensive cell protection across compartment boundaries.
Materials and methods
Key resources table
| Reagent type (species) or resource | Designation | Source or reference | Identifiers | Additional information |
|---|---|---|---|---|
| Strain (S. cerevisiae) | W303 | other | see Supplementary file 3 | |
| Genetic reagent (E. coli) | S. cerevisiae genomic library in YEp13 E. coli | Nasmyth and Tatchell, 1980 | ATCC 37323 | |
| Antibody | rat monoclonal anti-HA (clone 3F10) | Roche | Cat#11867423001; RRID: AB_390918 | (1:5000) |
| Antibody | rabbit polyclonal anti-mCherry | Biovision | Cat#5993; RRID: AB_1975001 | (1:5000) |
| Antibody | rabbit polyclonal anti-Kar2 | Schuck et al., 2009 | (1:50000) | |
| Antibody | mouse monoclonal anti-Pgk1 (clone 22C5) | Abcam | Cat#Ab113687; RRID: AB_10861977 | (1:50000) |
| Antibody | goat anti-mouse HRP | Thermo Fisher Scientific Pierce | Cat#31432; RRID: AB_228302 | (1:10000) |
| Antibody | goat anti-rabbit HRP | Thermo Fisher Scientific Pierce | Cat#31462; RRID: AB_228338 | (1:10000) |
| Antibody | donkey anti-rat HRP | Jackson | Cat#712-035-153; RRID: AB_2340639 | (1:10000) |
| Recombinant DNA reagent | plasmids | other | doi:10.5061/dryad.n20d476 | see Supplementary file 1 |
| Commercial assay or kit | NEBuilder HiFi DNA assembly master mix | New England Biolabs | Cat#E2611L | |
| Commercial assay or kit | BCA assay kit | Thermo Fisher Scientific Pierce | Cat#23225 | |
| Commercial assay or kit | ProtoScript II cDNA Synthesis kit | New England Biolabs | Cat#E6560L | |
| Commercial assay or kit | SensiFAST SYBR No-ROX kit | Bioline | Cat#BIO-98050 | |
| Chemical compound, drug | ß-estradiol | Sigma-Aldrich | Cat#E8875; CAS: 50-28-2 | |
| Chemical compound, drug | 1NM-PP1 | Merck | Cat#529581–1 MG; CAS: 221244-14-0 | |
| Chemical compound, drug | tunicamycin | Merck | Cat#654380–50 MG; CAS: 11089-65-9 | |
| Chemical compound, drug | cycloheximide | Sigma-Aldrich | Cat#C7698; CAS: 66-81-9 | |
| Chemical compound, drug | complete protease inhibitor | Roche | Cat#04693116001 | |
| Software, algorithm | Growthcurver | Sprouffske and Wagner, 2016 | ||
| Software, algorithm | MaxQuant | Cox et al., 2014 | ||
| Software, algorithm | Perseus | Tyanova et al., 2016 | ||
| Other | CMAC stain | Thermo Fisher Scientific | Cat#C2110 | |
| Other | mass spectrometry proteomics data | this study | PRIDE database, PXD012867 |
Plasmids
Plasmids are listed in Supplementary file 1. Sequences of oligonucleotides for plasmid generation are given in Supplementary file 2. To generate plasmids for estradiol-inducible expression, PGAL1-TCYC was amplified from pRS416-PGAL1 (Mumberg et al., 1994) with primers up_SacI_GAL/CYC_KpnI_down and cloned into AgeI-linearized pRS306-PADH1-GEM or ApaI-linearized pNH605-PADH1-GEM (Pincus et al., 2014) by ligation with the NEBuilder HiFi DNA assembly master mix (New England Biolabs, Ipswitch, Massachusetts), yielding pRS306-PADH1-GEM-PGAL1 and pNH605-PADH1-GEM-PGAL1. Plasmids for expression of HA-tagged CPY* variants were subsequently generated by amplification of ngCPY*-HA or CPY*-HA from pRS315-PCPY-ngCPY*-HA or pRS315-PGAL1-CPY*-HA (Spear and Ng, 2003) with primers EDY*_F2/EDY*_R and ligation with SmaI-linearized pRS306-PADH1-GEM-PGAL1, yielding pRS306-PADH1-GEM-PGAL1-ngCPY*-HA and pRS306-PADH1-GEM-PGAL1-CPY*-HA. Plasmids for expression of sfGFP-tagged CPY* variants were generated as follows: FLAG-sfGFP was amplified from pRS305-PADH1-Rtn1-FLAG-sfGFP (Szoradi et al., 2018) with primers FLAG-sfGFP_F/FLAG-sfGFP_R and ligated with SmaI-linearized pNH605-PADH1-GEM-PGAL1, yielding pNH605-PADH1-GEM-PGAL1-FLAG-sfGFP. Next, ngCPY*-HA was amplified from pRS315-PCPY-ngCPY*-HA with primers EDY*_F2/EDY*_tag_R and ligated into pNH605-PADH1-GEM-PGAL1-FLAG-sfGFP linearized with primers FLAG for 1/FLAG-open_R, yielding pNH605-PADH1-GEM-PGAL1-ngCPY*-HA-sfGFP. Similarly, CPY*(N479Q)-HA was amplified from pRS305-PCPY-CPY*(N479Q)-HA with primers EDY*_F2/EDY*_tag_R and ligated into pNH605-PADH1-GEM-PGAL1-FLAG-sfGFP linearized with primers FLAG for 1/FLAG-open_R, yielding pNH605-PADH1-GEM-PGAL1-CPY*(N479Q)-HA-sfGFP. To subclone genes of interest into YEp13, their coding regions together with upstream and downstream sequences were amplified from yeast genomic DNA with primers providing homologous ends (Supplementary file 2). The upstream and downstream sequences encompassed the entire sequence between the coding region of interest and the next upstream and downstream coding region, or at least 400 bp of upstream and 200 bp of downstream sequence. The resulting PCR products were recombined with BamHI-linearized YEp13 through gap repair cloning in yeast. To generate pRS306-PADH1-GEM-PGAL1-∆ss-ngCPY*-HA, pRS306-PADH1-GEM-PGAL1-ngCPY*-HA was linearized by PCR with primers CPY deltaSS fw/CPY deltaSS rev and religated with the NEBuilder HiFi DNA assembly master mix, thereby eliminating the CPY signal sequence. To generate pRS304-HAC1-splicing-reporter, PHAC1-Hac1-splicing reporter was amplified from pRS305-HAC1-splicing-reporter with primers pRS304-Eco-Hac1-SR fw/pRS304-Eco-Hac1-SR rev II and ligated with EcoRI-linearized pRS304 (Sikorski and Hieter, 1989) using the NEBuilder HiFi DNA assembly master mix. To generate pNH604-PHSP12-GFP, PHSP12-GFP was excised from pNH605-PHSP12-GFP with PspOMI/SacII and cloned into the PspOMI/SacII site of pNH604-4xPHSE-YFP. To generate pNH605-PRPN4-mNeonGreen, mNeonGreen was amplified from pFA6a-mNeonGreen-kanMX4 with primers Xho-neon/neon-BamHI and cloned between the XhoI and BamHI sites of pNH605-PRPN4-YFP. Similarly, pNH605-PRPN4-(HSEm)-mNeonGreen and pNH605-PRPN4-(PDREm)-mNeonGreen were generated by replacing YFP in pNH605-PRPN4-(HSEm)-YFP and pNH605-PRPN4-(PDREm)-YFP with mNeonGreen. To generate pNH605-PRPN4-(YREm)-mNeonGreen and pNH605-PRPN4-(YREm,HSEm)-mNeonGreen, pNH605-PRPN4-mNeonGreen or pNH605-PRPN4-(HSEm)-mNeonGreen were linearized with primers NheI-YRE fw/NheI-YRE rev, digested with NheI and religated, thereby mutating the YRE to an NheI site.
Yeast strain generation
Request a detailed protocolStrains used in this study are listed in Supplementary file 3. Unless indicated otherwise, strains were derived from W303 mating type a (strain SSY122). Gene tagging, gene deletion and promoter replacement was done with PCR products with homologous ends (Longtine et al., 1998; Janke et al., 2004). For irreversible single-copy genomic integration of CPY* expression plasmids, the PADH1-GEM-PGAL1 expression cassette was amplified with primers knock-in URA3 fw/knock-in URA3 rev (Supplementary file 2) and integrated into the URA3 locus. For integration of TRP1-marked pRS304-HAC1-SR into the LEU2 locus, the HAC1-splicing-reporter-TRP1 expression cassette was amplified with primers knock-in LEU2 fw/knock-in LEU2 rev (Supplementary file 2). Other integrative plasmids were linearized by restriction digest before transformation.
Growth conditions
Request a detailed protocolStrains were cultured at 30°C in SCD medium consisting of 0.7% yeast nitrogen base, 2% glucose and amino acids, lacking leucine where appropriate to maintain plasmid selection. Sec65-1 cells were grown in the same medium at 25°C. For steady state analyses, cultures were grown to saturation, diluted and grown for at least 9 hr so that they reached mid log phase (OD600 = 0.5–1). For induction of CPY* expression, exponentially growing cells were diluted to early log phase (OD600 = 0.1–0.5) and treated with 50 nM β-estradiol (Sigma-Aldrich, St. Louis, Missouri) for 4 hr, unless indicated otherwise. For cycloheximide chase experiments, cells in mid log phase were treated with 50 µg/ml cycloheximide (Sigma-Aldrich). For tunicamycin treatment, exponentially growing cells were diluted to early log phase and treated with 2 or 5 µg/ml tunicamycin (Merck, Darmstadt, Germany) as indicated. For 1NM-PP1 treatment, exponentially growing cells were diluted to early log phase and treated with 3 µM 1NM-PP1 (Merck). For temperature shift experiments, cells grown to mid log phase at 25°C were diluted to OD600 = 0.2 and incubated at the indicated temperatures for 90 min.
HAC1 splicing, HSE, HSP12 and RPN4 reporter assays
Request a detailed protocolTo measure UPR activity, a HAC1 splicing reporter was used that translates Ire1 activity into the production of GFP (Pincus et al., 2010). To measure induction of the UPR, cells harboring this reporter were grown to mid log phase in 1 ml medium in 96 deep-well plates. Cells were diluted to early log phase, treated with estradiol or tunicamycin as described above, 100 µl aliquots were removed at each time point and GFP fluorescence after excitation with a 488 nm laser was measured with a FACS Canto flow cytometer (BD Biosciences, Franklin Lakes, New Jersey) equipped with a high-throughput sampler. In parallel, autofluorescence was determined with identically grown isogenic control strains not harboring the splicing reporter. Mean cellular GFP fluorescence was corrected for autofluorescence and normalized to the GFP fluorescence of untreated cells. To measure steady state UPR activity in different strains, cells expressing the HAC1 splicing reporter and cytosolic BFP under the control of the constitutive GPD promoter were grown to mid log phase as above and GFP and BFP fluorescence were measured after excitation with 488 nm or 405 nm lasers. GFP fluorescence was corrected for autofluorescence and divided by BFP fluorescence to account for differences in protein translation capacity. Data were expressed relative to the GFP/BFP fluorescence ratio in wild-type cells.
To measure Hsf1 and Msn2/4 activity, cells harboring the 4xHSE-YFP or the HSP12-GFP reporter and expressing ngCPY* under the control of the estradiol-inducible GAL promoter system were grown to mid log phase as above and diluted to early log phase. Cells were either left untreated or were treated with 100 nM estradiol for 5 hr, 100 µl aliquots were removed and GFP fluorescence was measured. GFP fluorescence was corrected for autofluorescence and corrected fluorescence of treated cells was normalized to that of corresponding untreated cells.
To measure Rpn4 activity, cells harboring an RPN4 reporter and expressing cytosolic BFP under the control of the constitutive GPD promoter were grown to mid log phase as above. To measure steady state RPN4 activity, 100 µl aliquots were removed and mNeonGreen and BFP fluorescence was measured after excitation with 488 nm or 405 nm lasers as above. Mean cellular mNeonGreen fluorescence was corrected for autofluorescence as above and divided by BFP fluorescence. Data were expressed relative to the mNeonGreen/BFP fluorescence ratio in cells harboring the wild-type RPN4 reporter. To measure induction of RPN4, cells were grown to mid log phase as above, diluted to early log phase and either left untreated or were treated with 5 µg/ml tunicamycin or 3 µM 1NM-PP1. At each time point, 100 µl aliquots were removed and mNeonGreen and BFP fluorescence was determined. For each time point, autofluorescence-corrected mNeonGreen/BFP ratios were calculated as above and ratios in treated cells were normalized to those in corresponding untreated cells.
Western blotting
Request a detailed protocolCell lysis and western blotting was done as described (Szoradi et al., 2018). In brief, cells were disrupted by bead beating, proteins were solubilized with SDS, protein determination was carried out with the BCA assay kit (Thermo Fisher Scientific Pierce, Waltham, Massachusetts), equal amounts of protein were resolved by SDS-PAGE and transferred onto nitrocellulose membranes. Membranes were probed with primary and HRP-coupled secondary antibodies, developed with homemade ECL, and chemiluminescence was detected with an ImageQuant LAS 4000 imaging system (GE Healthcare, Chalfont St Giles, UK). Images were quantified with ImageJ and processed with Adobe Photoshop. Primary antibodies were rat anti-HA 3F10 (Roche, Basel, Switzerland), rabbit anti-Kar2 (Peter Walter, UCSF), rabbit anti-mCherry (Biovision, Milpitas, California) and mouse anti-Pgk1 22C5 (Abcam, Cambridge, UK).
Light microscopy
Request a detailed protocolCPY* expression was induced with 25 nM estradiol for 4 hr. Ten µM CMAC (Thermo Fisher Scientific, Waltham, Massachusetts) was added during the last 2 hr of induction to stain the vacuole and cells were imaged live at room temperature. Images were acquired with a DMi8 inverted microscope (Leica, Wetzlar, Germany) equipped with a CSU-X1 spinning-disk confocal scanning unit (Yokogawa, Musashino, Japan), a ORCA-Flash 4.0 LT camera (Hamamatsu, Hamamatsu, Japan) and a HC PL APO 100x/1.4 NA CS2 oil objective lens (Leica). Background subtraction with a rolling ball algorithm was performed in ImageJ and images were processed in Adobe Photoshop.
Growth assays
Request a detailed protocolGrowth assays on agar plates and in liquid medium were done as described (Schuck et al., 2009; Szoradi et al., 2018). For growth assays on agar plates, dilution series with fivefold dilution steps were used. For quantification of growth in liquid medium, the cell density in arbitrary units was plotted against time and the area under the curve was calculated with the R package Growthcurver (Sprouffske and Wagner, 2016). Data were normalized to the wild-type control and expressed as a growth index, which was set to one for wild-type cells.
Viability assay
Request a detailed protocolExponentially growing cells were diluted to OD600 = 0.05 and grown in the presence of different concentrations of β-estradiol for 24 hr. Cultures were diluted to equal cell densities as judged by OD600 measurements, equal numbers of cells were plated on solid YPD medium (1% yeast extract, 2% peptone, 2% glucose) and grown for 48 hr. To determine cell viability, the number of colony-forming units of estradiol-treated samples was normalized that of the mock-treated sample.
Genetic screen
Request a detailed protocolStrain SSY1341 was transformed with a yeast genomic library in the YEp13 multicopy vector (Nasmyth and Tatchell, 1980; available from the American Type Culture Collection as ATCC 37323; kindly provided by Michael Knop, ZMBH). Transformants were plated onto SCD-Leu plates at approximately 200 colony-forming units per plate and grown at 30°C. After 26 hr, colonies were replicated onto SCD-Leu plates containing 50, 75 or 100 nM estradiol and grown for up to 36 hr. Colonies that clearly grew better than the general background were restreaked onto SCD-Leu plates and replicated onto SCD-inositol to identify transformants that grew due to re-expression of HAC1. For confirmation, plasmids were retrieved from six transformants that grew in the absence of inositol and sequenced with primers YEp13 fw/YEp13 rev (Supplementary file 2). All contained HAC1. Transformants that failed to grow without inositol and hence lacked HAC1 were re-tested by growth assays on SCD-Leu plates containing 50 nM estradiol. Suppressing plasmids were retrieved from well-growing transformants and their inserts were sequenced. Inserts contained between one and six genes. To determine which genes were responsible for suppression, candidates were individually subcloned into YEp13 from genomic DNA from SSY122 and tested for growth on SCD-Leu plates containing 50 nM estradiol. Genes identified only once were discarded, with the exception of PDR1 and YAP1.
Quantitative real-time PCR
Request a detailed protocolIsolation of mRNA, cDNA synthesis and quantitative real-time PCR were done as described (Szoradi et al., 2018). In brief, RNA from 5 ODs of cells was extracted with hot phenol, precipitated with ethanol and resuspended in 30 µl H2O. Synthesis of cDNA was done from 0.5 µg total RNA with the Protoscript II kit (New England Biolabs) using d(T)18 primers. PCRs containing 5 ng template DNA and 250 nM each of forward and reverse primers were prepared using the SensiFAST SYBR No-ROX kit (Bioline, Luckenwalde, Germany). Primer sequences are listed in Supplementary file 2. PCRs were run in triplicate on a LightCylcer II 480 (Roche) with an annealing temperature of 60°C and an extension time of 20 s. The TAF10 mRNA served as internal standard to determine relative mRNA levels of KAR2, SIL1 or RPN4. Data analysis was performed with the LightCylcer II 480 software using the 2nd derivative maximum method to determine Cp (crossing point) values.
Proteomics
Request a detailed protocolWild-type (SSY122) and ∆rpn4 (SSY784) cells were grown to mid-log phase in SCD medium. Cultures were diluted to OD 0.4, and 5 ODs of cells were harvested as untreated samples. Tunicamycin was added to the remainder of each culture at a final concentration of 5 µg/ml, cells were grown for 4 hr, and 5 ODs of cells were harvested as treated samples. Cells were collected by centrifugation and snap frozen in liquid nitrogen. Samples from four independent experiments were used for proteomic analysis. Cells were resuspended in ice-cold lysis buffer (50 mM Tris, pH 7.5, 0.5 mM EDTA, 1x Roche complete protease inhibitors) and disrupted by bead beating. Proteins were solubilized by adding SDS to a final concentration of 1.8% (w/v) and heating to 95°C for 10 min. Protein concentrations were determined with a BCA assay kit (Thermo Fisher Scientific). Per sample, 200 µg protein was precipitated with acetone and resuspended in digestion buffer (8 M Urea, 50 mM Tris pH 8.5, 1 mM DTT) to a concentration of 4 mg/ml. 40 µg protein was alkylated using 5 mM iodoacetamide for 1 hr, digested with LysC (enzyme to protein = 1:50 (w/w)) for 5.5 hr, diluted to 2 M Urea, and digested with Trypsin (1:50 (w/w)) for another 13 hr at room temperature. Digested peptides were acidified to 1% (v/v) trifluoroacetic acid, cleared of precipitates by brief centrifugation, desalted via SDB-RPS cleanup, and analyzed on a Q Exactive HF-X Hybrid Quadrupole-Orbitrap mass spectrometer (Thermo Fisher Scientific), essentially as described (Itzhak et al., 2016). Raw files were processed using MaxQuant (Cox and Mann, 2008) version 1.6, using the MaxLFQ algorithm (Cox et al., 2014) for label free-quantification. Downstream analysis was performed in Perseus version 1.6 (Tyanova et al., 2016). LFQ intensities based on fewer than 2 MS/MS counts were removed from the dataset. The remaining intensities were log-transformed. For the pairwise analyses in Figures 4D and 5F, further quality filtering was applied. Only proteins that were quantified in all four replicates of at least one of the compared conditions were retained. Missing values were then imputed from a normal distribution (width 0.3 SDs, down-shifted by 1.8 SDs). For statistical analysis, a two-sided student’s t-test with permutation based false discovery rate control (FDR = 1%) and an S0 parameter of 0.2 was performed. The category annotation enrichment was calculated with the 1D annotation enrichment tool in Perseus (Tyanova et al., 2016), using mean log2 expression differences. For the analysis in Figure 5—figure supplement 2, only proteins annotated as ‘proteasome subunit’ and with at least three quantified intensities in each condition were included. For each protein, the median value of the untreated wild-type sample was subtracted from the median intensities in all conditions, to achieve normalization. The resulting values correspond to log2 fold changes relative to the untreated wild-type (which has a value of 0). The mean and standard error of the mean were plotted. Proteasome subunits were defined as the 33 structural proteins of the 20S core particle and the 19S regulatory particle (Supplementary file 4). All were detected consistently, except for Sem1. Core UPR target genes were defined as those identified as UPR-regulated by both Travers et al. (2000) and Pincus et al. (2014) (Supplementary file 5). Of the corresponding 102 proteins, 69 were detected in total, and 50 and 58 passed the quality filters for the analyses in Figures 4D and 5F, respectively. See Figure 4—source data 1 for assignment of proteins to other functional groups.
Experimental design
Request a detailed protocolControl strains were isogenic to the experimental strains except for the relevant genetic modifications. For experiments with sec65-1 cells, strain SSY002 (W303 mating type alpha) rather than SSY122 was used as a control because it has the same mating type and also is an ade2 mutant. At least three biological replicates were done for experiments with quantitative read-outs to enable assessment of the variation between replicates. Exceptions were the experiments in Figure 1E, Figure 1F, Figure 1—figure supplement 1D and Figure 6—figure supplement 1, which were done only once. Repetitions were considered biological replicates if they were initiated from independently inoculated pre-cultures of the yeast strains used and were performed on different days. For each experiment, the number of biological replicates (n), the mean and the standard error of the mean (SEM) are reported in the figure legends.
Data availability
Request a detailed protocolThe mass spectrometry proteomics data associated with Figure 4D, Figure 5F and Figure 5—figure supplement 2 have been deposited to the ProteomeXchange Consortium via the PRIDE partner repository with the dataset identifier PXD012867.
Data availability
The mass spectrometry proteomics data associated with Figure 4D, Figure 5F and Figure 5 - figure supplement 2 have been deposited to the ProteomeXchange Consortium via the PRIDE partner repository with the dataset identifier PXD012867.
-
Dryad Digital RepositoryData from: The proteasome biogenesis regulator Rpn4 cooperates with the unfolded protein response to promote ER stress resistance.https://doi.org/10.5061/dryad.n20d476
-
PRIDE databaseID PXD012867. The proteasome biogenesis regulator Rpn4 cooperates with the unfolded protein response to promote ER stress resistance.
References
-
Targeting and translocation of proteins to the endoplasmic reticulum at a glanceJournal of Cell Science 130:4079–4085.https://doi.org/10.1242/jcs.204396
-
Late phase of the endoplasmic reticulum stress response pathway is regulated by Hog1 MAP kinaseJournal of Biological Chemistry 285:17545–17555.https://doi.org/10.1074/jbc.M109.084681
-
Protein folding in the endoplasmic reticulumCold Spring Harbor Perspectives in Biology 5:a013201.https://doi.org/10.1101/cshperspect.a013201
-
Functional characterization of the atypical Hsp70 subunit of yeast ribosome-associated complexJournal of Biological Chemistry 282:33977–33984.https://doi.org/10.1074/jbc.M706737200
-
Accurate proteome-wide label-free quantification by delayed normalization and maximal peptide ratio extraction, termed MaxLFQMolecular & Cellular Proteomics 13:2513–2526.https://doi.org/10.1074/mcp.M113.031591
-
Biting the hand that feeds: rpn4-dependent feedback regulation of proteasome functionBiochimica Et Biophysica Acta (BBA) - Molecular Cell Research 1773:1599–1604.https://doi.org/10.1016/j.bbamcr.2007.05.015
-
Genomic expression programs in the response of yeast cells to environmental changesMolecular Biology of the Cell 11:4241–4257.https://doi.org/10.1091/mbc.11.12.4241
-
Role and regulation of the ER chaperone BiPSeminars in Cell & Developmental Biology 10:465–472.https://doi.org/10.1006/scdb.1999.0318
-
Development of proteasome inhibitors as research tools and cancer drugsThe Journal of Cell Biology 199:583–588.https://doi.org/10.1083/jcb.201210077
-
Genome-wide analysis of the biology of stress responses through heat shock transcription factorMolecular and Cellular Biology 24:5249–5256.https://doi.org/10.1128/MCB.24.12.5249-5256.2004
-
Activation of the saccharomyces cerevisiae heat shock transcription factor under glucose starvation conditions by Snf1 protein kinaseJournal of Biological Chemistry 279:5169–5176.https://doi.org/10.1074/jbc.M311005200
-
Regulation of transcription factor Pdr1p function by an Hsp70 protein in saccharomyces cerevisiaeMolecular and Cellular Biology 18:1147–1155.https://doi.org/10.1128/MCB.18.3.1147
-
Signal-dependent dynamics of transcription factor translocation controls gene expressionNature Structural & Molecular Biology 19:31–39.https://doi.org/10.1038/nsmb.2192
-
A futile battle? protein quality control and the stress of agingDevelopmental Cell 44:139–163.https://doi.org/10.1016/j.devcel.2017.12.020
-
Importance of carbohydrate positioning in the recognition of mutated CPY for ER-associated degradationJournal of Cell Science 118:1485–1492.https://doi.org/10.1242/jcs.01740
-
iRhom1 regulates proteasome activity via PAC1/2 under ER stressScientific Reports 5:11559.https://doi.org/10.1038/srep11559
-
Heat shock response relieves ER stressThe EMBO Journal 27:1049–1059.https://doi.org/10.1038/emboj.2008.42
-
Inhibition of proteasome activity induces concerted expression of proteasome genes and de novo formation of mammalian proteasomesJournal of Biological Chemistry 278:21517–21525.https://doi.org/10.1074/jbc.M301032200
-
Signal sequences specify the targeting route to the endoplasmic reticulum membraneThe Journal of Cell Biology 134:269–278.https://doi.org/10.1083/jcb.134.2.269
-
Intracellular signaling from the endoplasmic reticulum to the nucleus: the unfolded protein response in yeast and mammalsCurrent Opinion in Cell Biology 13:349–355.https://doi.org/10.1016/S0955-0674(00)00219-2
-
Yeast ATP-binding cassette transporters conferring multidrug resistanceAnnual Review of Microbiology 66:39–63.https://doi.org/10.1146/annurev-micro-092611-150111
-
Membrane expansion alleviates endoplasmic reticulum stress independently of the unfolded protein responseThe Journal of Cell Biology 187:525–536.https://doi.org/10.1083/jcb.200907074
-
A system of shuttle vectors and yeast host strains designed for efficient manipulation of DNA in saccharomyces cerevisiaeGenetics 122:19–27.
-
Stress tolerance of misfolded carboxypeptidase Y requires maintenance of protein trafficking and degradative pathwaysMolecular Biology of the Cell 14:2756–2767.https://doi.org/10.1091/mbc.e02-11-0717
-
Single, context-specific glycans can target misfolded glycoproteins for ER-associated degradationThe Journal of Cell Biology 169:73–82.https://doi.org/10.1083/jcb.200411136
-
Protein translocation mutants defective in the insertion of integral membrane proteins into the endoplasmic reticulumMolecular Biology of the Cell 3:129–142.https://doi.org/10.1091/mbc.3.2.129
-
Biology of the Heat Shock Response and Protein Chaperones: Budding Yeast (Saccharomyces cerevisiae) as a Model SystemMicrobiology and Molecular Biology Reviews 76:115–158.https://doi.org/10.1128/MMBR.05018-11
-
Loss of BiP/GRP78 function blocks translocation of secretory proteins in yeastThe Journal of Cell Biology 110:1885–1895.https://doi.org/10.1083/jcb.110.6.1885
-
Identification of a novel class of target genes and a novel type of binding sequence of heat shock transcription factor in saccharomyces cerevisiaeJournal of Biological Chemistry 280:11911–11919.https://doi.org/10.1074/jbc.M411256200
Article and author information
Author details
Funding
Heidelberg Biosciences International Graduate School (Graduate Student Fellowship)
- Rolf M Schmidt
Deutsche Forschungsgemeinschaft (EXC 81)
- Rolf M Schmidt
- Sebastian Schuck
Max-Planck-Gesellschaft
- Julia P Schessner
- Georg HH Borner
Deutsche Forschungsgemeinschaft (MA 1764/2-1)
- Georg HH Borner
The funders had no role in study design, data collection and interpretation, or the decision to submit the work for publication.
Acknowledgements
We thank Felix Boos, Michael Knop, David Pincus and Peter Walter for reagents, the Flow Cytometry and FACS facility at the ZMBH for assistance, Dorottya Polos, Anja Klemmer and Jan Grosser for contributions to early stages of this study, and David Pincus, Davis Ng, Felix Boos, Anne-Lore Schlaitz and all members of the Schuck lab for comments on the manuscript. This work was funded by a PhD fellowship from the Heidelberg Biosciences International Graduate School (HBIGS) to RMS, the Max Planck Society for the Advancement of Sciences, and grants EXC 81 and MA 1764/2-1 from the Deutsche Forschungsgemeinschaft (DFG).
Version history
- Received: October 30, 2018
- Accepted: February 27, 2019
- Version of Record published: March 13, 2019 (version 1)
Copyright
© 2019, Schmidt et al.
This article is distributed under the terms of the Creative Commons Attribution License, which permits unrestricted use and redistribution provided that the original author and source are credited.
Metrics
-
- 3,263
- views
-
- 494
- downloads
-
- 38
- citations
Views, downloads and citations are aggregated across all versions of this paper published by eLife.
Download links
A two-part list of links to download the article, or parts of the article, in various formats.
Downloads (link to download the article as PDF)
Open citations (links to open the citations from this article in various online reference manager services)
Cite this article (links to download the citations from this article in formats compatible with various reference manager tools)
The proteasome biogenesis regulator Rpn4 cooperates with the unfolded protein response to promote ER stress resistance
eLife 8:e43244.
https://doi.org/10.7554/eLife.43244
Further reading
-
- Cell Biology
- Neuroscience
Alternative RNA splicing is an essential and dynamic process in neuronal differentiation and synapse maturation, and dysregulation of this process has been associated with neurodegenerative diseases. Recent studies have revealed the importance of RNA-binding proteins in the regulation of neuronal splicing programs. However, the molecular mechanisms involved in the control of these splicing regulators are still unclear. Here, we show that KIS, a kinase upregulated in the developmental brain, imposes a genome-wide alteration in exon usage during neuronal differentiation in mice. KIS contains a protein-recognition domain common to spliceosomal components and phosphorylates PTBP2, counteracting the role of this splicing factor in exon exclusion. At the molecular level, phosphorylation of unstructured domains within PTBP2 causes its dissociation from two co-regulators, Matrin3 and hnRNPM, and hinders the RNA-binding capability of the complex. Furthermore, KIS and PTBP2 display strong and opposing functional interactions in synaptic spine emergence and maturation. Taken together, our data uncover a post-translational control of splicing regulators that link transcriptional and alternative exon usage programs in neuronal development.
-
- Cell Biology
Amyotrophic lateral sclerosis (ALS) is a fatal neuromuscular disorder characterized by progressive weakness of almost all skeletal muscles, whereas extraocular muscles (EOMs) are comparatively spared. While hindlimb and diaphragm muscles of end-stage SOD1G93A (G93A) mice (a familial ALS mouse model) exhibit severe denervation and depletion of Pax7+satellite cells (SCs), we found that the pool of SCs and the integrity of neuromuscular junctions (NMJs) are maintained in EOMs. In cell sorting profiles, SCs derived from hindlimb and diaphragm muscles of G93A mice exhibit denervation-related activation, whereas SCs from EOMs of G93A mice display spontaneous (non-denervation-related) activation, similar to SCs from wild-type mice. Specifically, cultured EOM SCs contain more abundant transcripts of axon guidance molecules, including Cxcl12, along with more sustainable renewability than the diaphragm and hindlimb counterparts under differentiation pressure. In neuromuscular co-culture assays, AAV-delivery of Cxcl12 to G93A-hindlimb SC-derived myotubes enhances motor neuron axon extension and innervation, recapitulating the innervation capacity of EOM SC-derived myotubes. G93A mice fed with sodium butyrate (NaBu) supplementation exhibited less NMJ loss in hindlimb and diaphragm muscles. Additionally, SCs derived from G93A hindlimb and diaphragm muscles displayed elevated expression of Cxcl12 and improved renewability following NaBu treatment in vitro. Thus, the NaBu-induced transcriptomic changes resembling the patterns of EOM SCs may contribute to the beneficial effects observed in G93A mice. More broadly, the distinct transcriptomic profile of EOM SCs may offer novel therapeutic targets to slow progressive neuromuscular functional decay in ALS and provide possible ‘response biomarkers’ in pre-clinical and clinical studies.


