Computational 3D histological phenotyping of whole zebrafish by X-ray histotomography
- Penn State College of Medicine, United States
- Duke University, United States
- The University of Chicago, United States
- Omnivision Technologies, Inc., United States
- Brookhaven National Laboratory, United States
- Argonne National Laboratory, United States
Figures
Figure 1 with 3 supplements
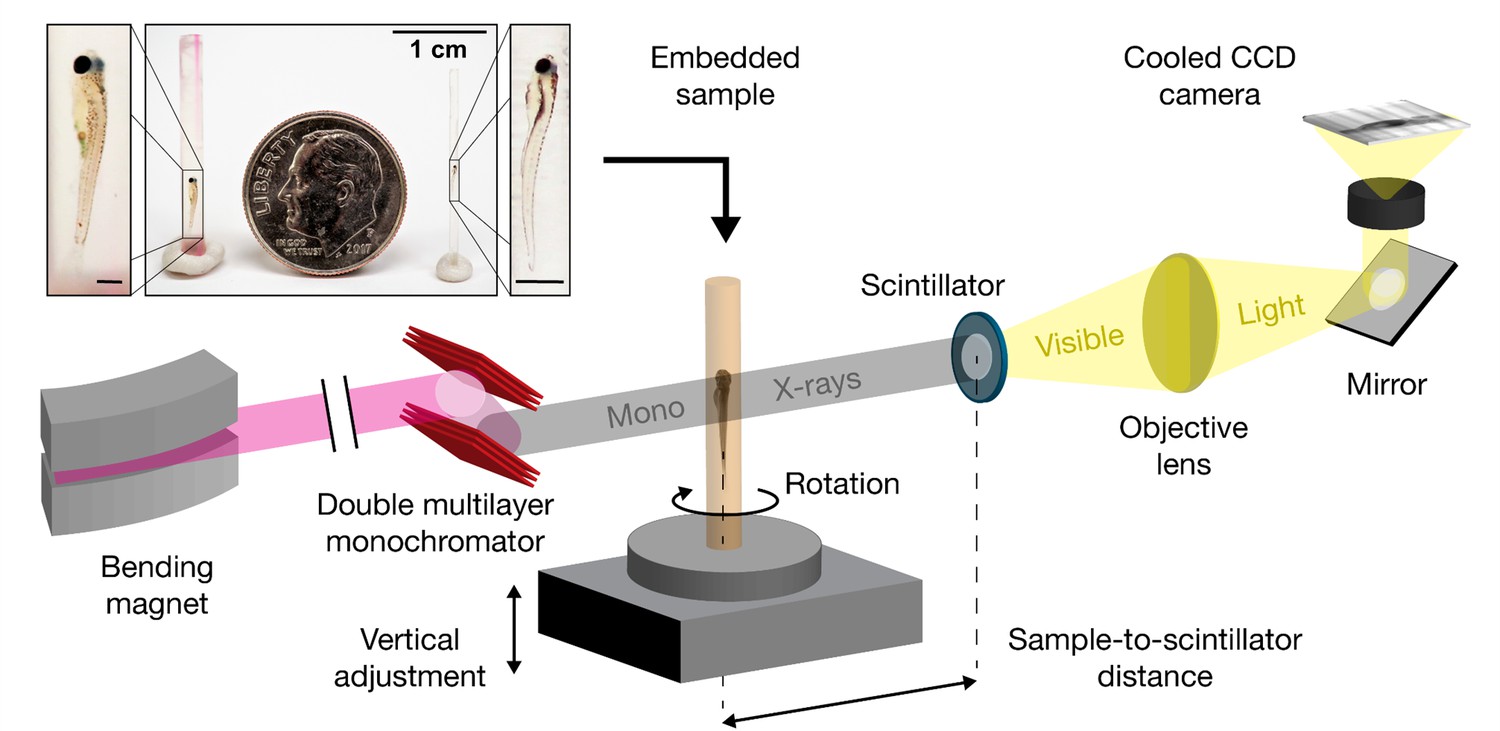
Schematic for synchrotron X-ray micro-tomography of whole zebrafish.
Quasi-parallel X-rays from beamline 2-BM-B are used to acquire projection images of an intact, fixed, and PTA-stained whole zebrafish. Total imaging time is ~20 min per monochromatic acquisition (sample-to-scintillator distance = 30 mm) and ~20 s per pink-beam acquisition (sample-to-scintillator distance = 25 mm). Each fish requires 3 to 5 acquisitions. The top inset shows the relative sizes of a juvenile (left), a larva (right), and a dime (diameter = 17.9 mm). Fish are shown embedded in acrylic resin with the polyimide tubing removed. Removal of the polyimide tubing is necessary for natural color light photography, but not for successful X-ray image acquisition. Scale bars in the specimen insets are 1 mm.
Figure 1—figure supplement 1
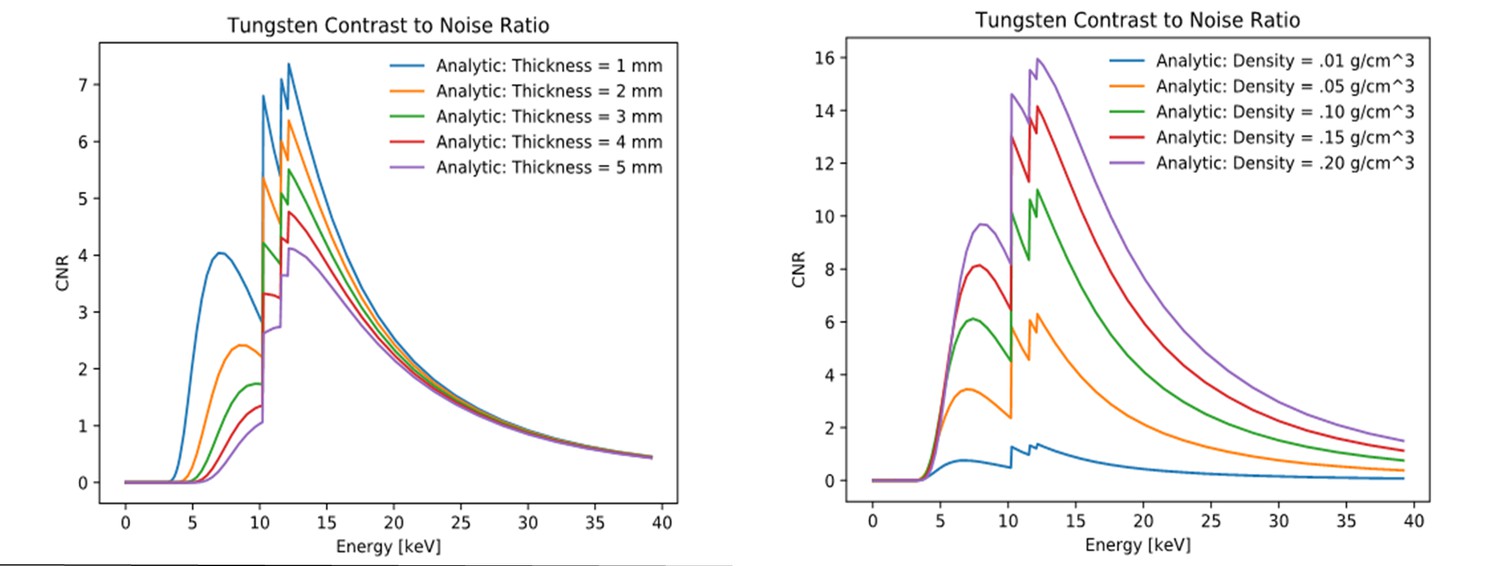
X-ray energy optimization for synchrotron micro-CT.
X-ray energy was modeled for different sample sizes and metal concentrations. (Left) Analytic contrast-to-noise ratio (CNR) for tungsten contrast detail in water background assuming ρW= 0.06 g/cm3, dW = 0.36 mm, ρH20= 1.0 g/cm3 and dH20 varying from 1 to 5 mm. (Right) Analytic contrast-to-noise ratio for tungsten for contrast detail in water background assuming ρW varying from 0.01 to 0.2 g/cm3, dW = 0.36 mm, ρH20 = 1.0 g/cm3 and dH20 = 1 mm. The plots indicate that over a wide range of sample sizes and metal concentrations, an optimal energy range is ~12 to 16 keV.
Figure 1—figure supplement 2
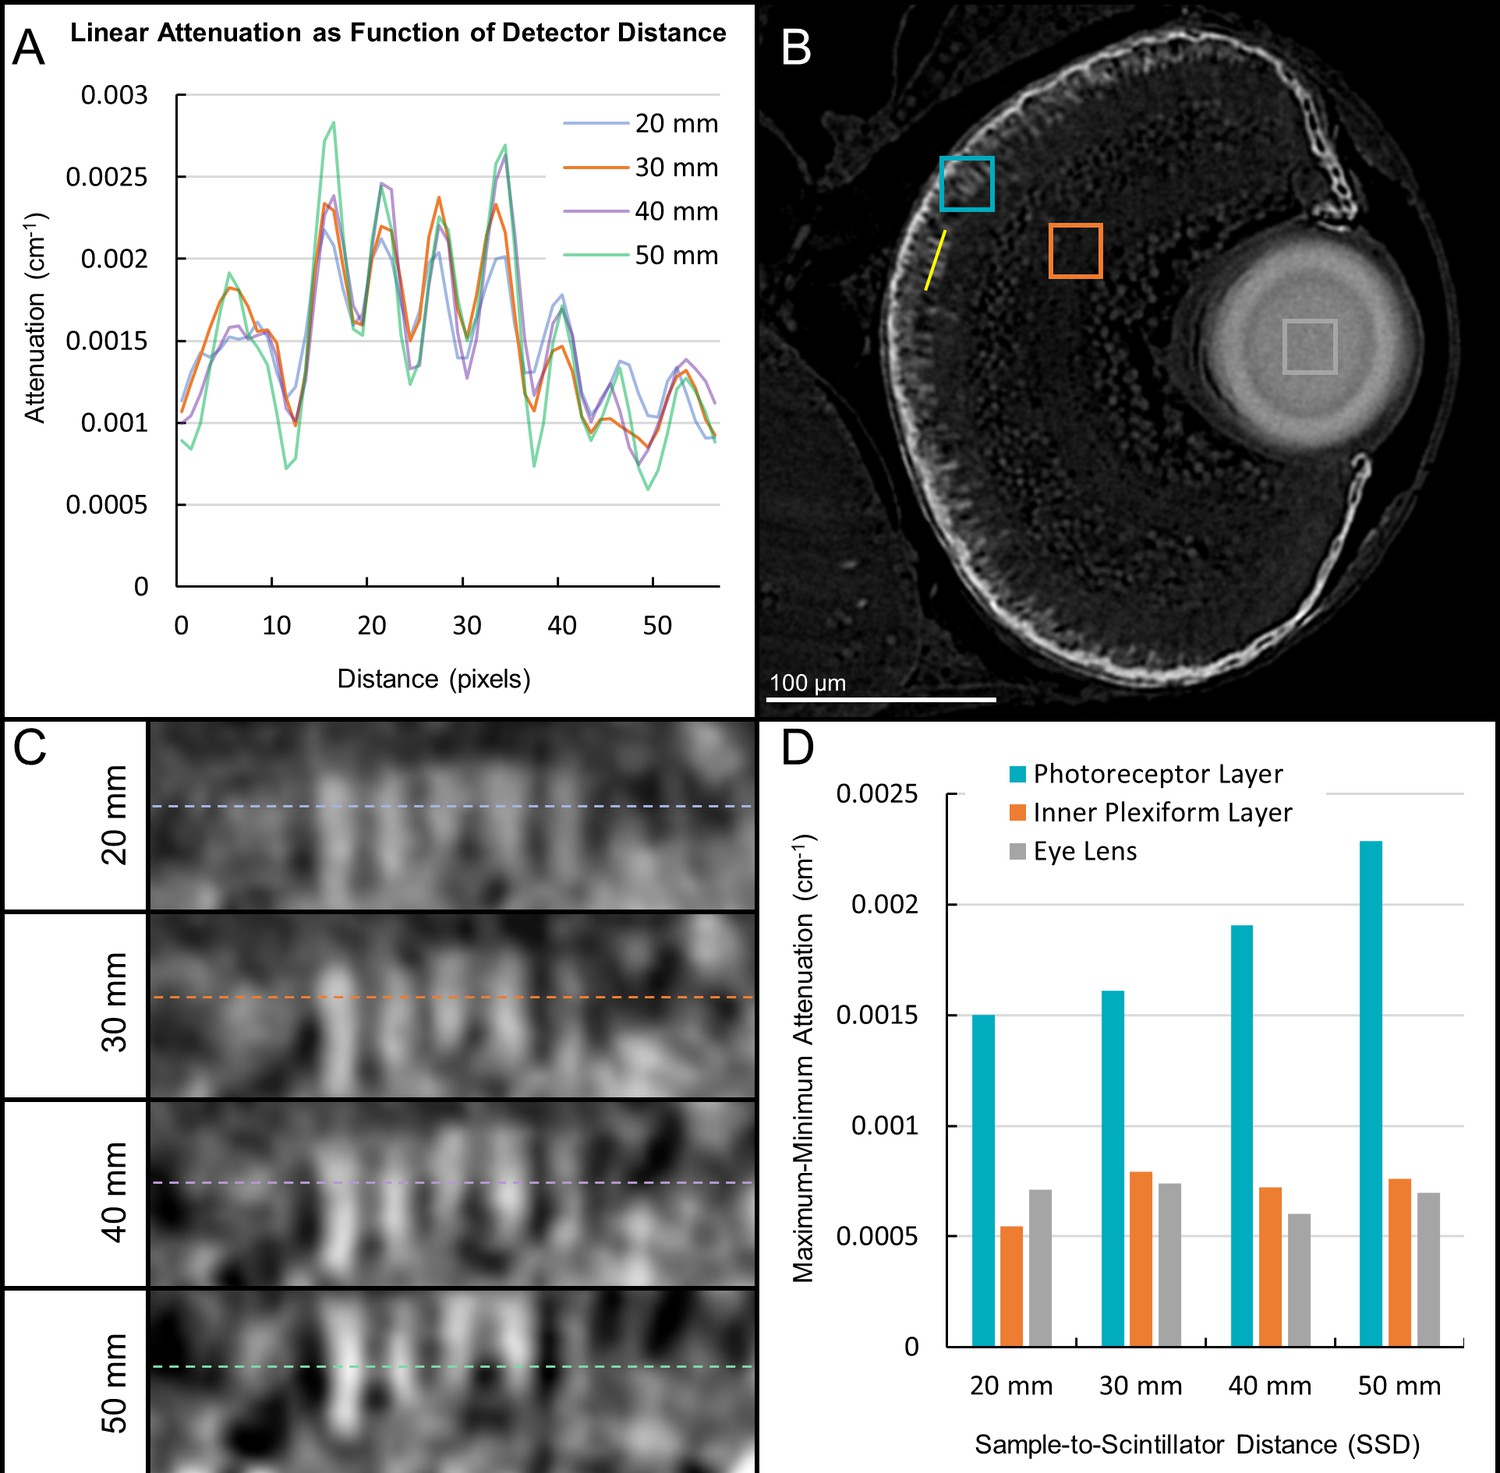
Sample-to-scintillator distance selection for synchrotron X-ray micro-tomography.
A range of sample-to-scintillator distances (SSD) was surveyed for phase contrast enhancement of edges in larval samples. A line profile (A) is drawn through the retinal region as denoted by the yellow line in (B) to highlight differences in voxel intensity at edges. Zoomed insets (C) show the photoreceptor layer aligned with the attenuation profile in (A). The attenuation range (maximum attenuation– minimum attenuation) is shown in (D) for homogenous (lens, inner plexiform layer) and variable (photoreceptor layer) regions. The attenuation range increases for variable regions but remains constant for homogenous regions as SSD increases, demonstrating the effects of phase contrast edge enhancement. A SSD of 30 mm provided a level of edge perception resembling that found in traditional glass slide histology and was used for all subsequent acquisitions.
Figure 1—figure supplement 3
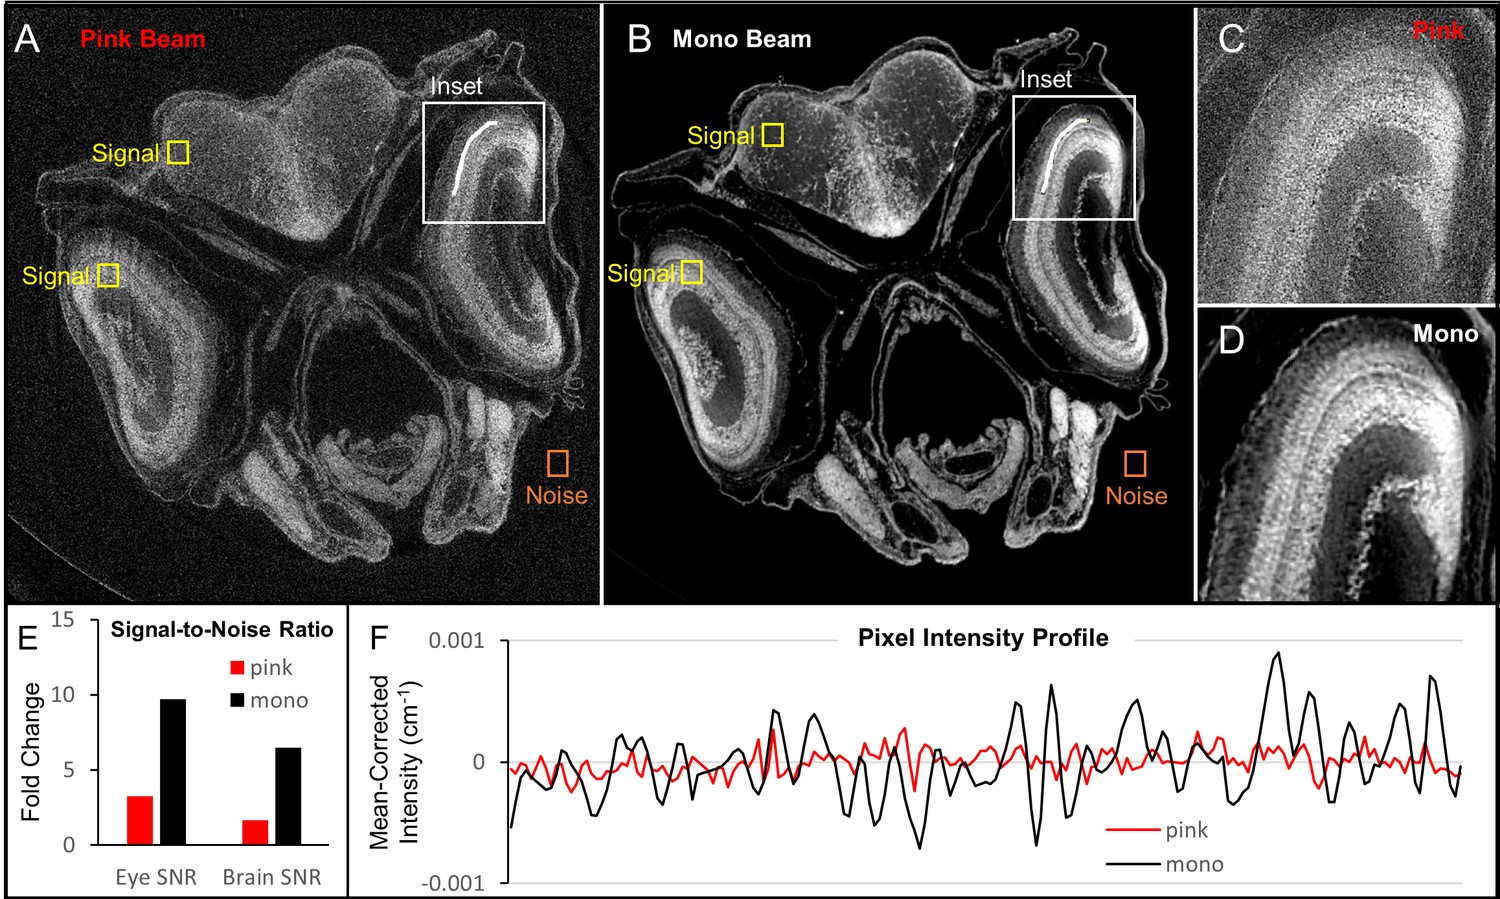
Comparison of image quality between monochromatic and polychromatic X-rays for synchrotron micro-CT.
A juvenile (33 dpf) zebrafish was scanned using pink-beam (A) and monochromatic (B) sources. Insets show the ability for pink-beam (C) and monochromatic beam (D) to resolve the fine detail found in zebrafish photoreceptor layer. Signal-to-noise ratio (SNR) in high (eye lens) and low attenuation (brain) tissues was compared for both images (E). The monochromatic beam image has a higher SNR than the pink-beam image in both cases. While the noise in the pink beam image could be reduced by increasing acquisition times, the contrast in the monochromatic image is inherently better. A line profile (F) through the photoreceptor layer shows that the monochromatic beam is superior for discerning edges, which can be attributed to the phase contrast optimization done in Figure 1—figure supplement 1. Under these pink-beam imaging conditions, phase-contrast enhancement, which is energy-dependent, gets averaged out.
Figure 2
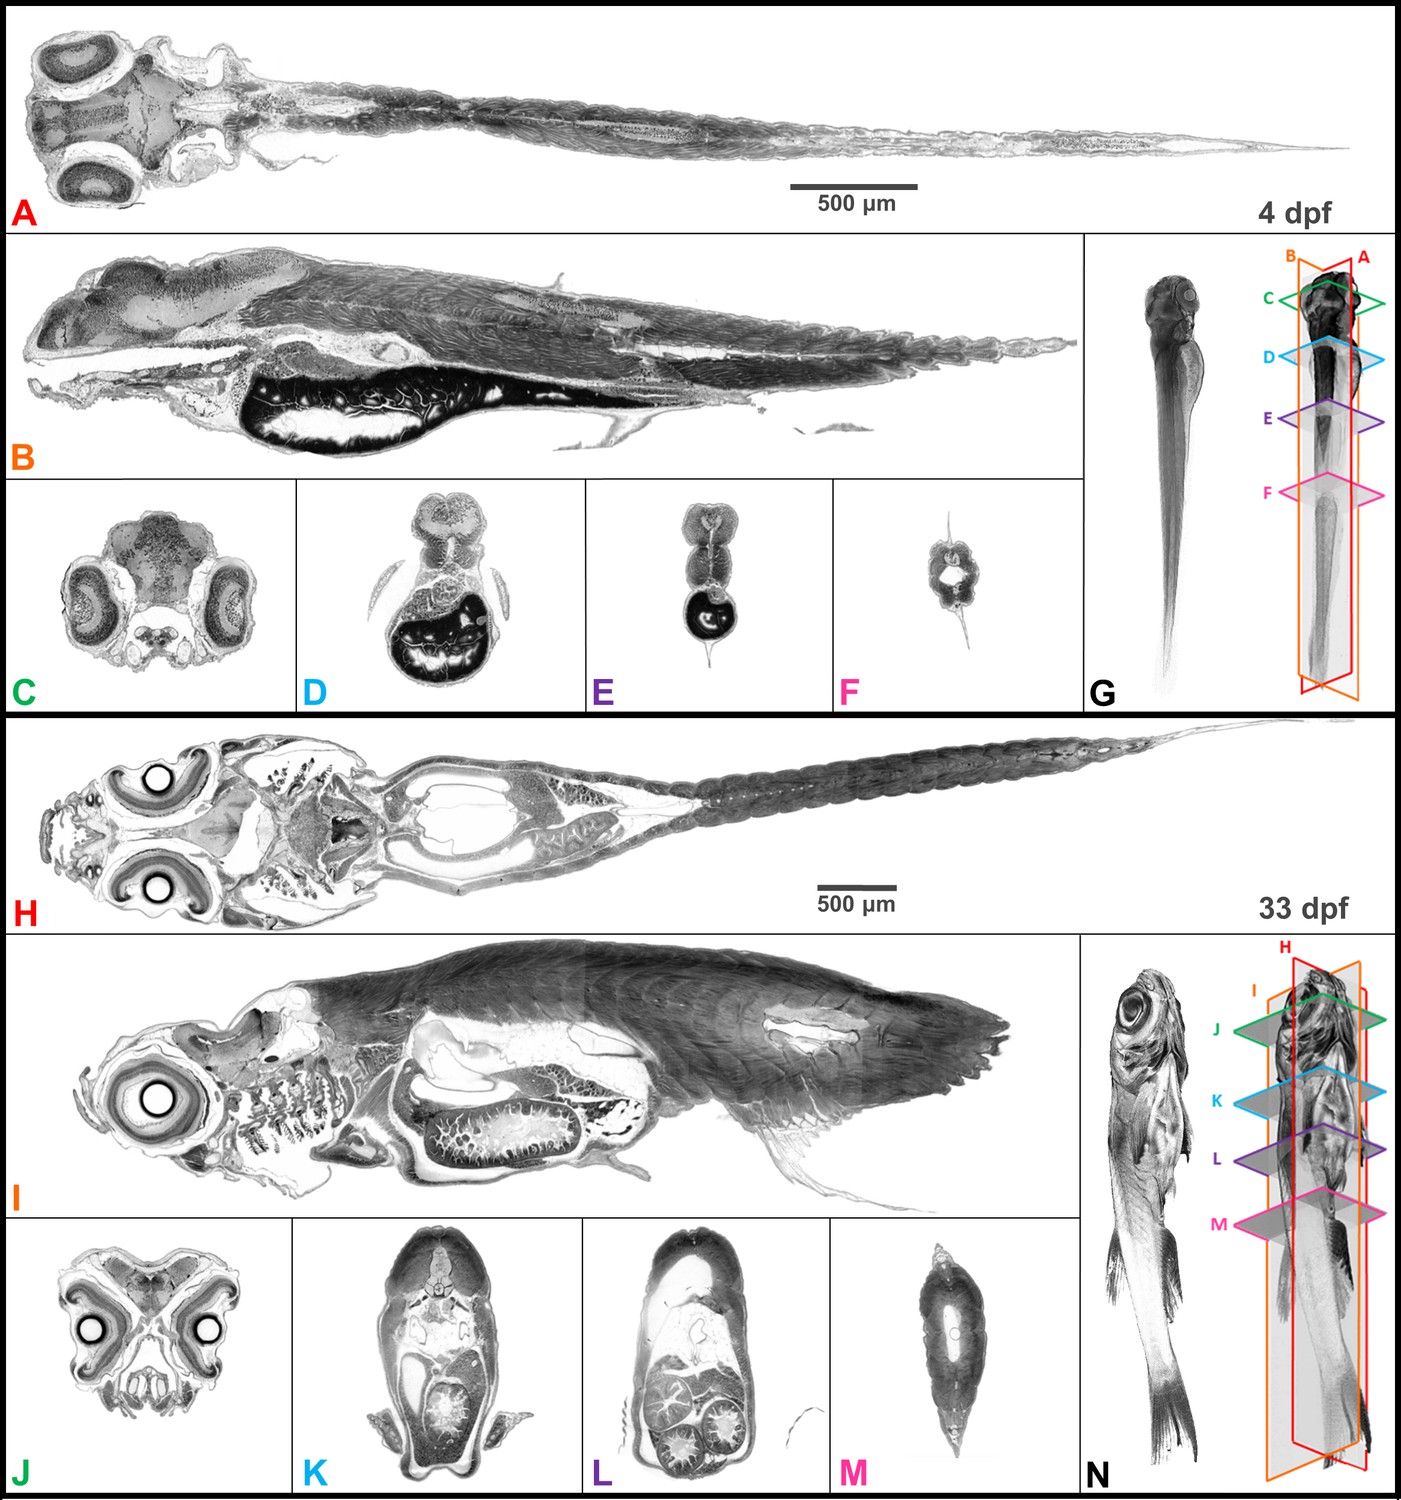
Whole organism imaging of PTA-stained zebrafish at cell resolution enables histology-like cross sections.
Coronal (A, H), sagittal (B, I), and axial (C–F, J–M) cross sections of 4 dpf larval (A–G) and 33-dpf juvenile (H–N) wild-type zebrafish acquired using synchrotron X-ray micro-tomography at 0.743 μm3 and 1.43 μm3 isotropic voxel resolution, respectively. 3D volume renderings (G, N) show the cross-sections in relation to the whole organism. In contrast to histology, the cross sections are a single voxel in thickness and can be obtained in any plane (including oblique cuts) after imaging. Complete cross-sections in the orthogonal directions for both fish are provided (Videos 2 and 3). Images are presented to match histological convention of dark cell nuclei (higher attenuation is darker).
Figure 3 with 1 supplement
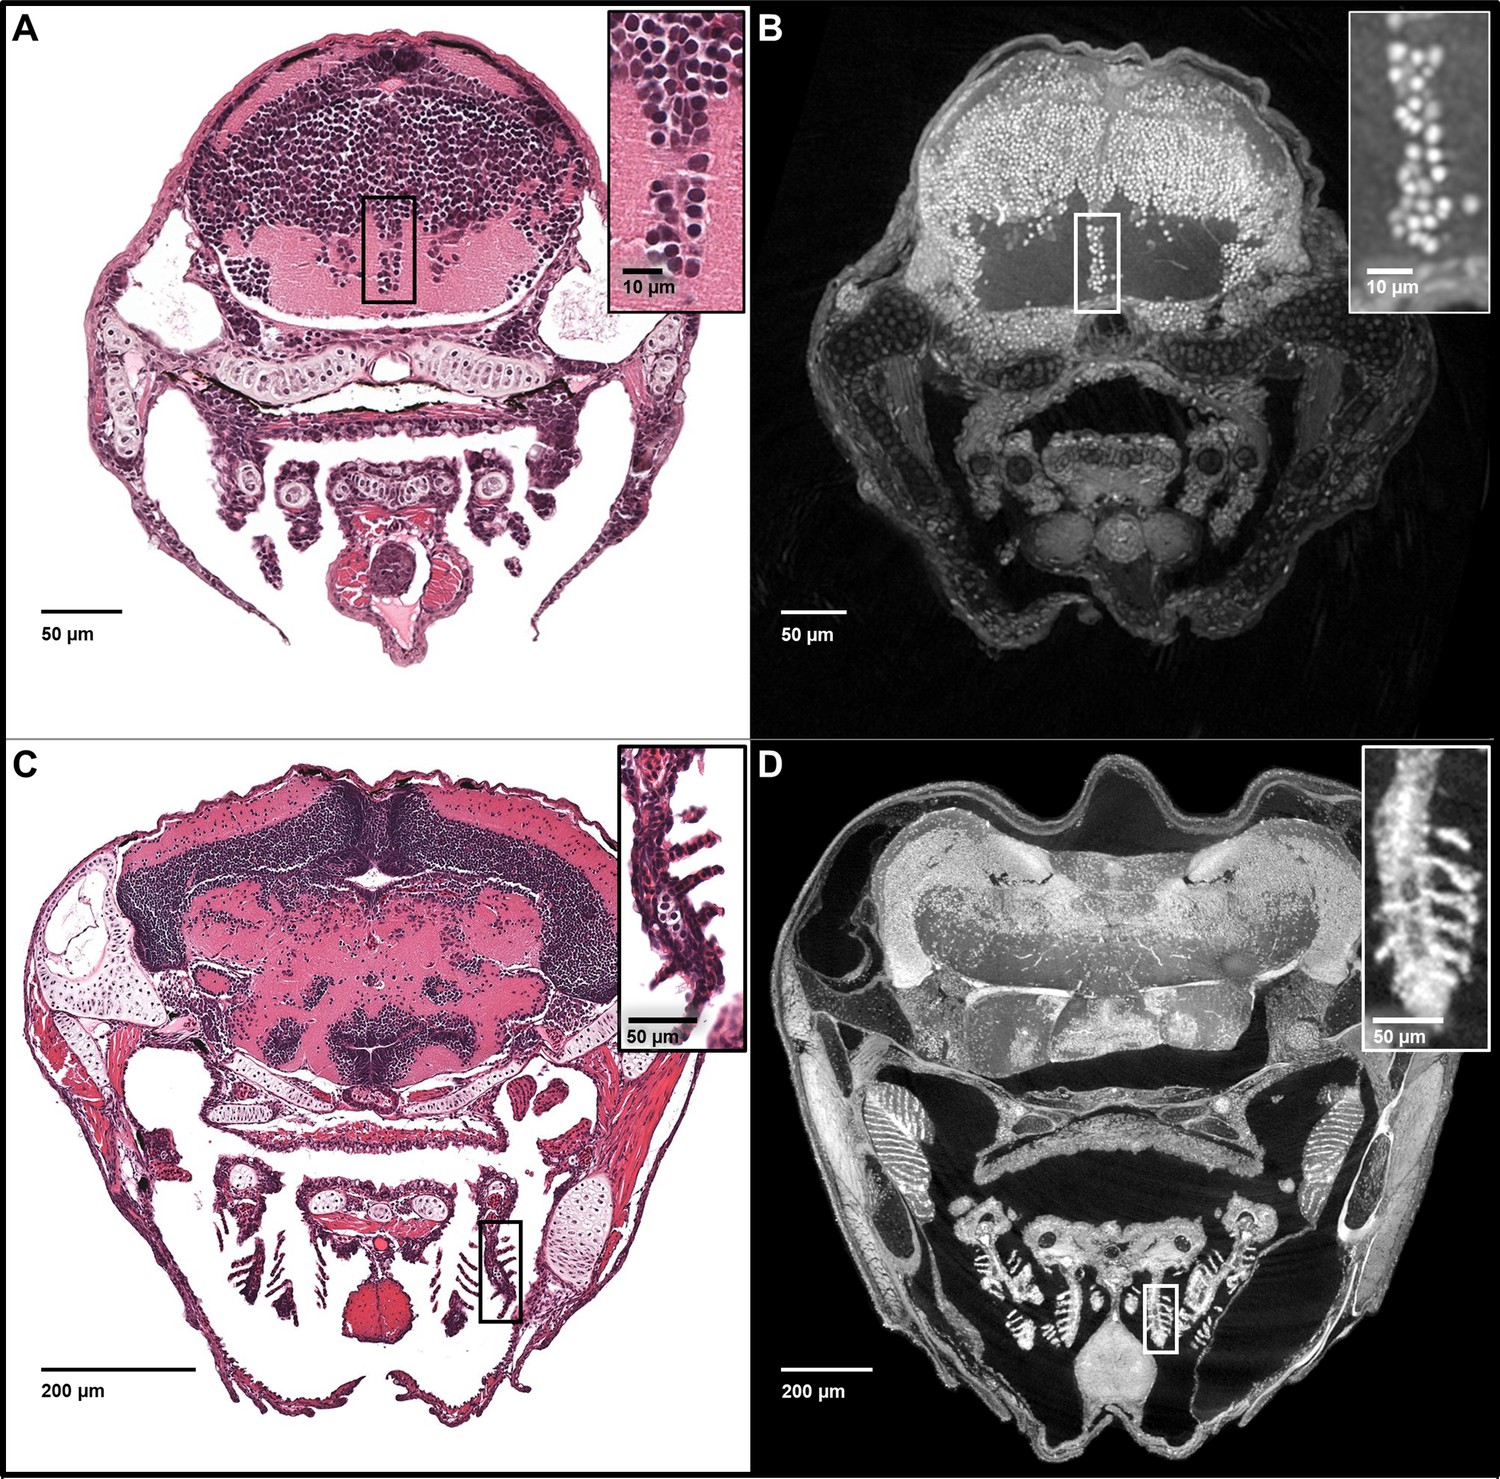
Five micron thick maximum intensity projections of synchrotron X-ray histotomographic images resemble histology.
Top: Comparison of larval (five dpf) zebrafish obtained from a 5 μm thick histology section and micro-tomography data (A and B, respectively). The larval micro-tomograph is 0.743 μm3 in isotropic voxel resolution, and a maximum intensity projection (MIP) of 7 slices, totalling 5.20 μm, resembling the appearance of ~5 μm thick histological sections. Bottom: Comparison of juvenile (33 dpf) zebrafish i5 μm histology section and micro-tomographic MIPs (C and D, respectively). Juvenile scan data is of 1.43 μm3 isotropic voxel resolution, and a MIP of 3 slices, totalling 4.29 μm thickness, is shown. Insets show detail of brain cell nuclei (A–B) and delicate gill structure (C–D). The images demonstrate the near histological resolution of X-ray histotomography. While natural variation in the size of specific features is observed in age matched fish (panel C length = 7.8 mm, panel D length = 10 mm) individual histological features are consistent.
Figure 3—figure supplement 1
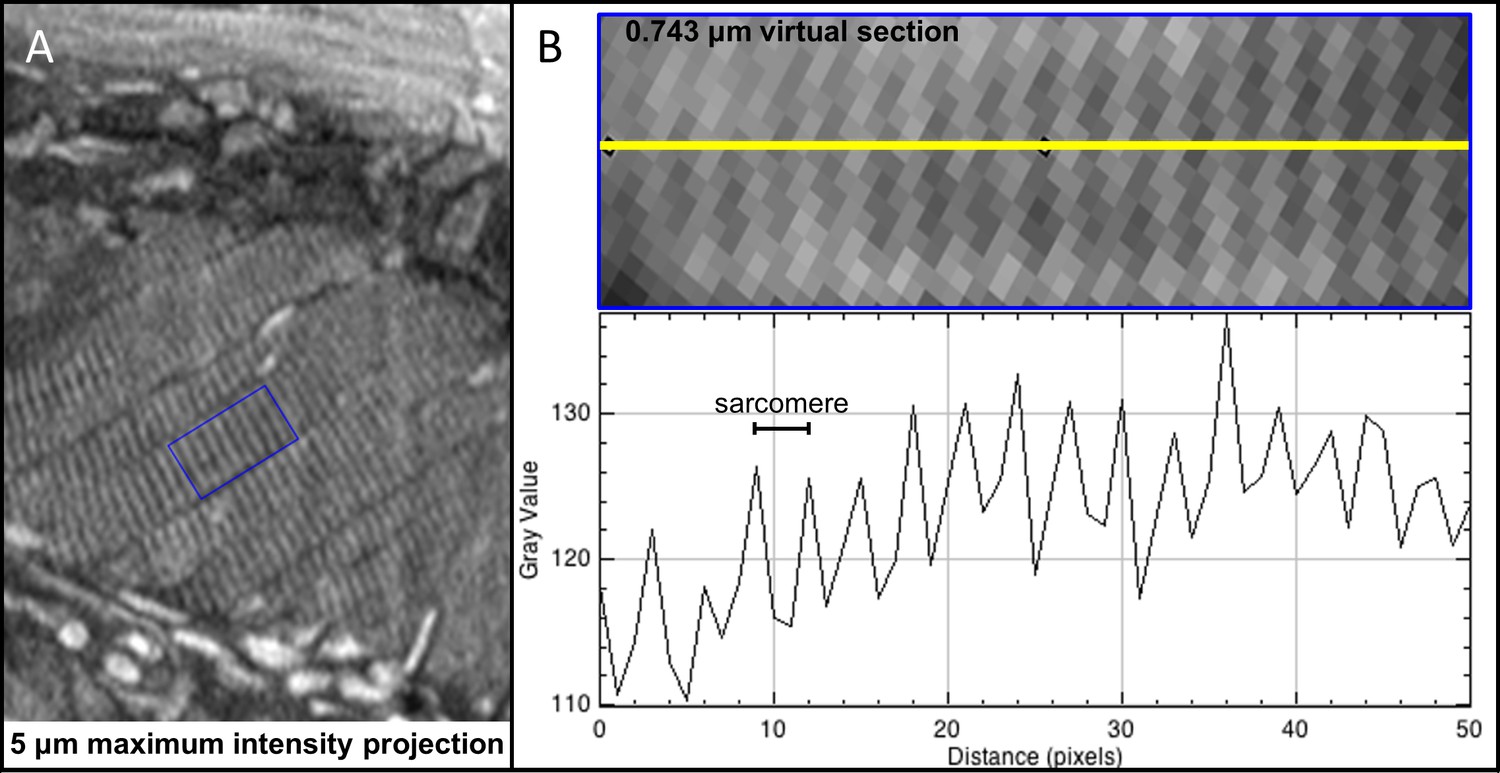
Bands of skeletal muscle wrapping the air bladder of larval zebrafish allow characterization of resolution.
The biological validation of imaging resolution was performed through measurement of distances between Z-lines in the swim bladder striated muscle strands. Cross sections of striated muscle surrounding the swim bladder diagonally in larval (five dpf) zebrafish (A) was used to generate pixel intensity profiles (B). Measurement of pixel distances between local intensity maxima assuming 0.743 μm3 isotropic voxel resolution yielded an average sarcomere length of 2.16 μm (SD = 0.55 μm for 293 distance measurements), consistent with published sarcomere lengths in larval zebrafish (Burghardt et al., 2016; Dou et al., 2008).
Figure 4
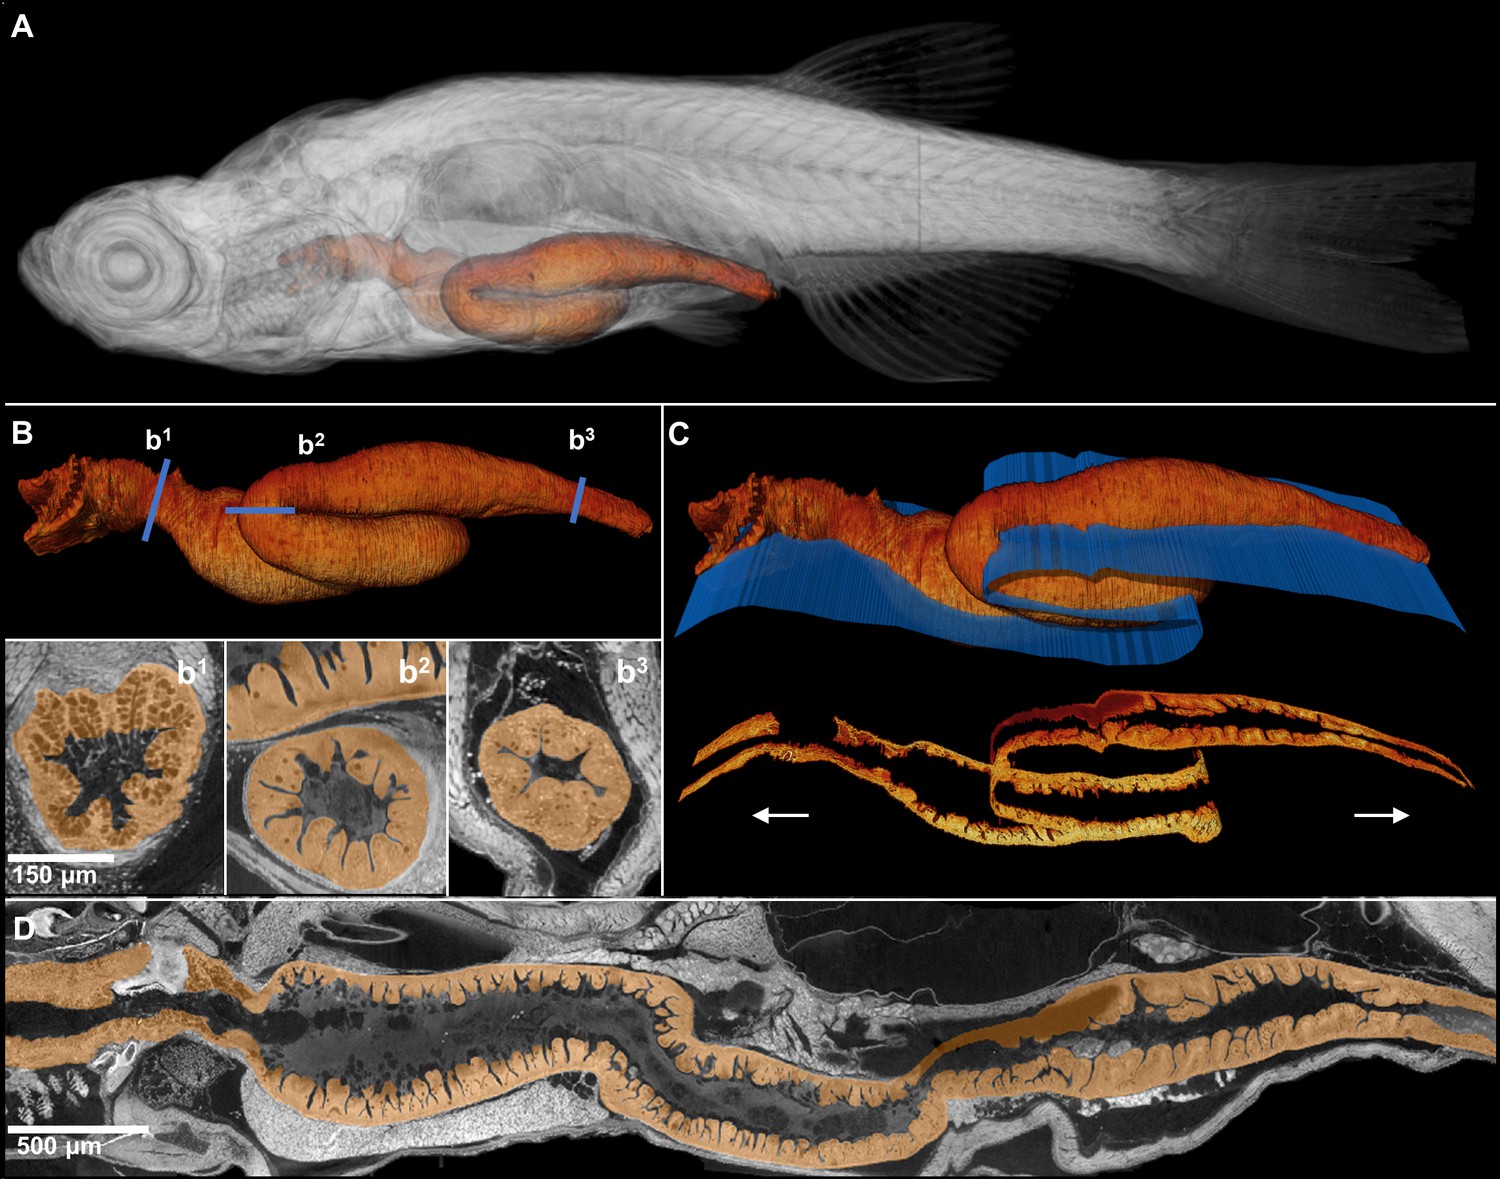
Comprehensive histological cross-sectioning of convoluted structures in juvenile zebrafish.
A 3D rendering of a whole juvenile (33 dpf) zebrafish is presented with highlighted gastrointestinal (GI) tract (A). The GI tract exemplifies a convoluted structure for that can be unraveled for histological analysis. The isolated GI tract is displayed (B). Isotropic resolution of data permits virtual slicing at any angle (B1–B3) without a decrease in resolution, allowing comprehensive histology-like visualization despite its tortuous nature. A spline-based reslicing method for visualizing serpentine organs across their entire path is also shown (C). A nonlinear cutting plane (blue) follows the structure of interest, allowing the cut to render a structure’s total length onto a single plane (D).
Figure 5 with 1 supplement
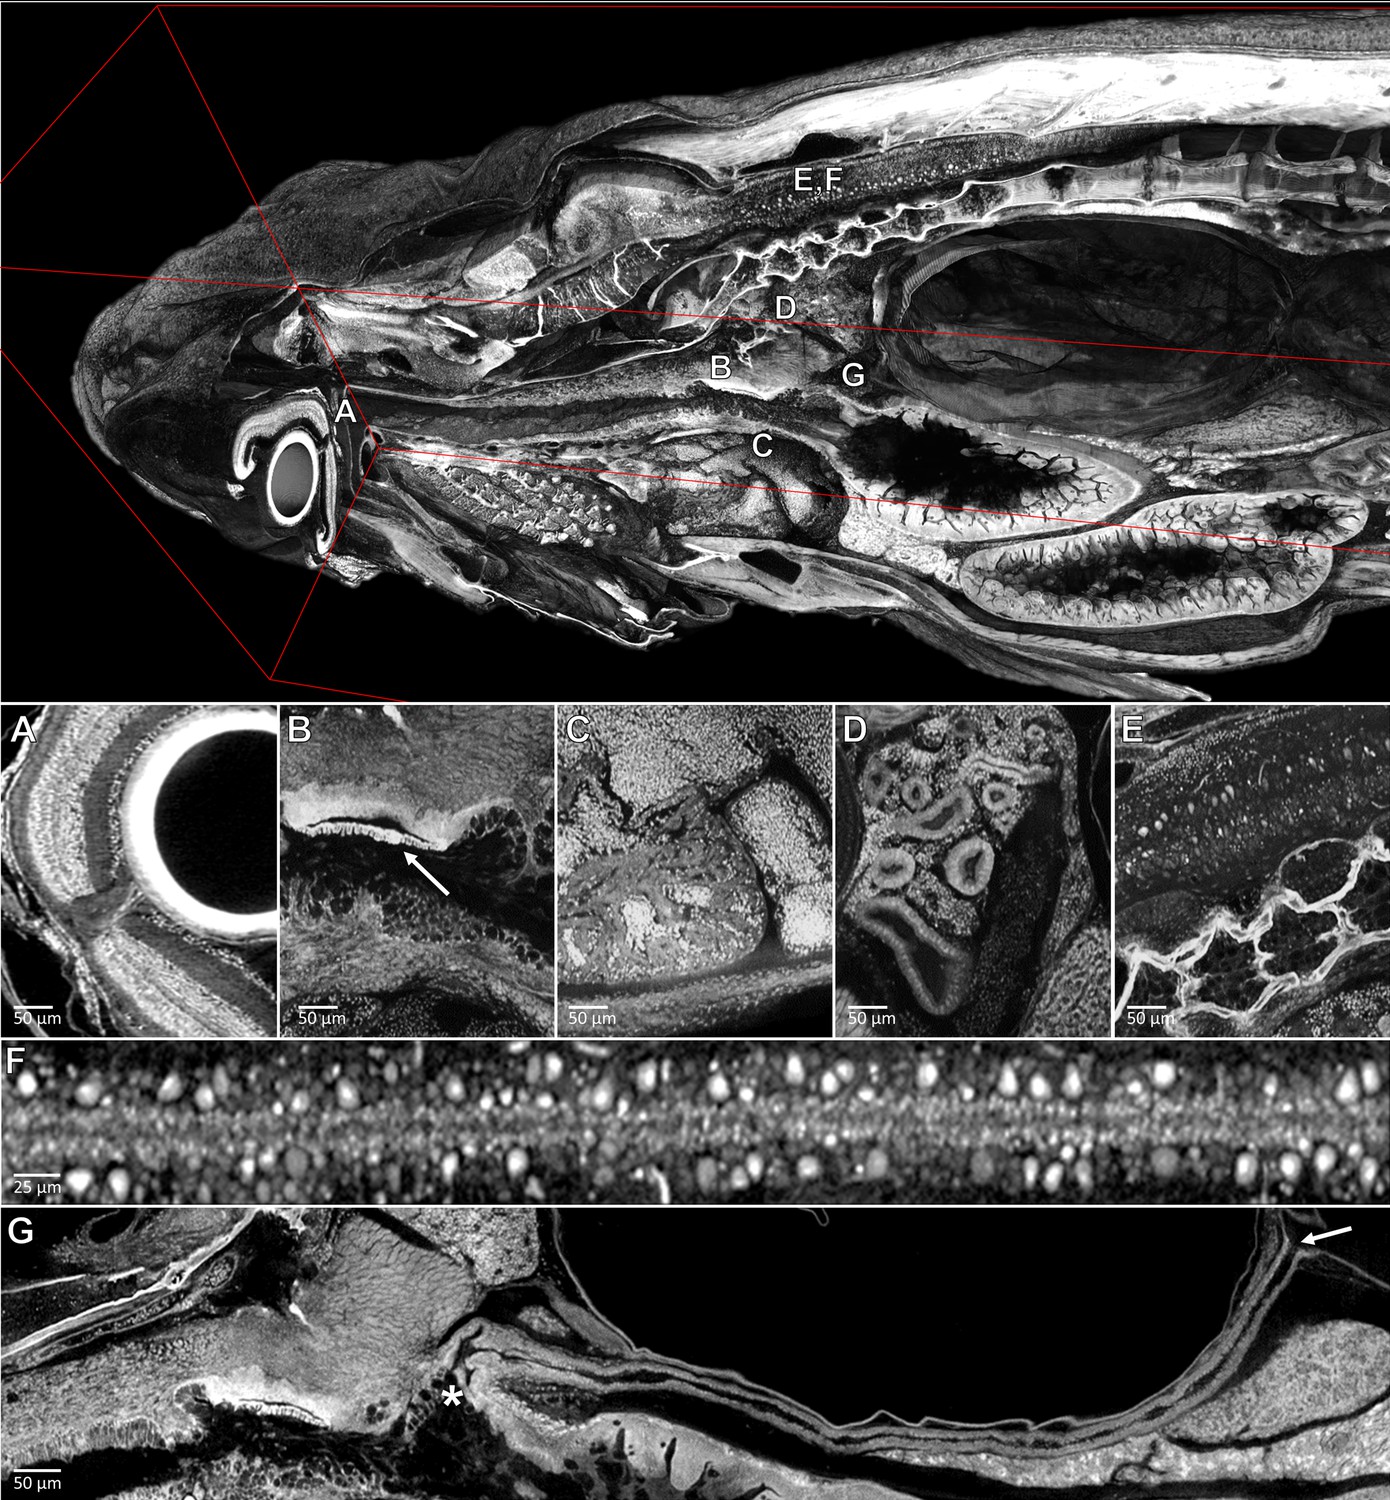
Pan-cellular staining and variable-thickness views allow for characterization of 3D microanatomical features.
Top: Cutout visualization of a juvenile (33 dpf) zebrafish stained with PTA showing detail in many soft tissue structures. Bottom: Cell types and structures that can be visualized include neuronal cells in the eye (A), cartilaginous rudiments of the squamous patch dorsum (arrow) of the pharynx (B), nucleated red blood cells and heart chambers (C), nephrons of the kidney (D), brain nuclei and motor neurons in spinal nerve cord (E, F). Curved multiplanar slicing, as used for Figure 4D, was used to display the full length of the pneumatic duct (proximal and distal ends noted by an ‘*' and arrow, respectively) (G). Panels A and E represent individual slices (1.43 μm in thickness) while panels B, C, D represent maximum intensity projections of 5 μm thick sections to visualize larger 3D structures. F represents a 7 μm thick projection.
Figure 5—figure supplement 1
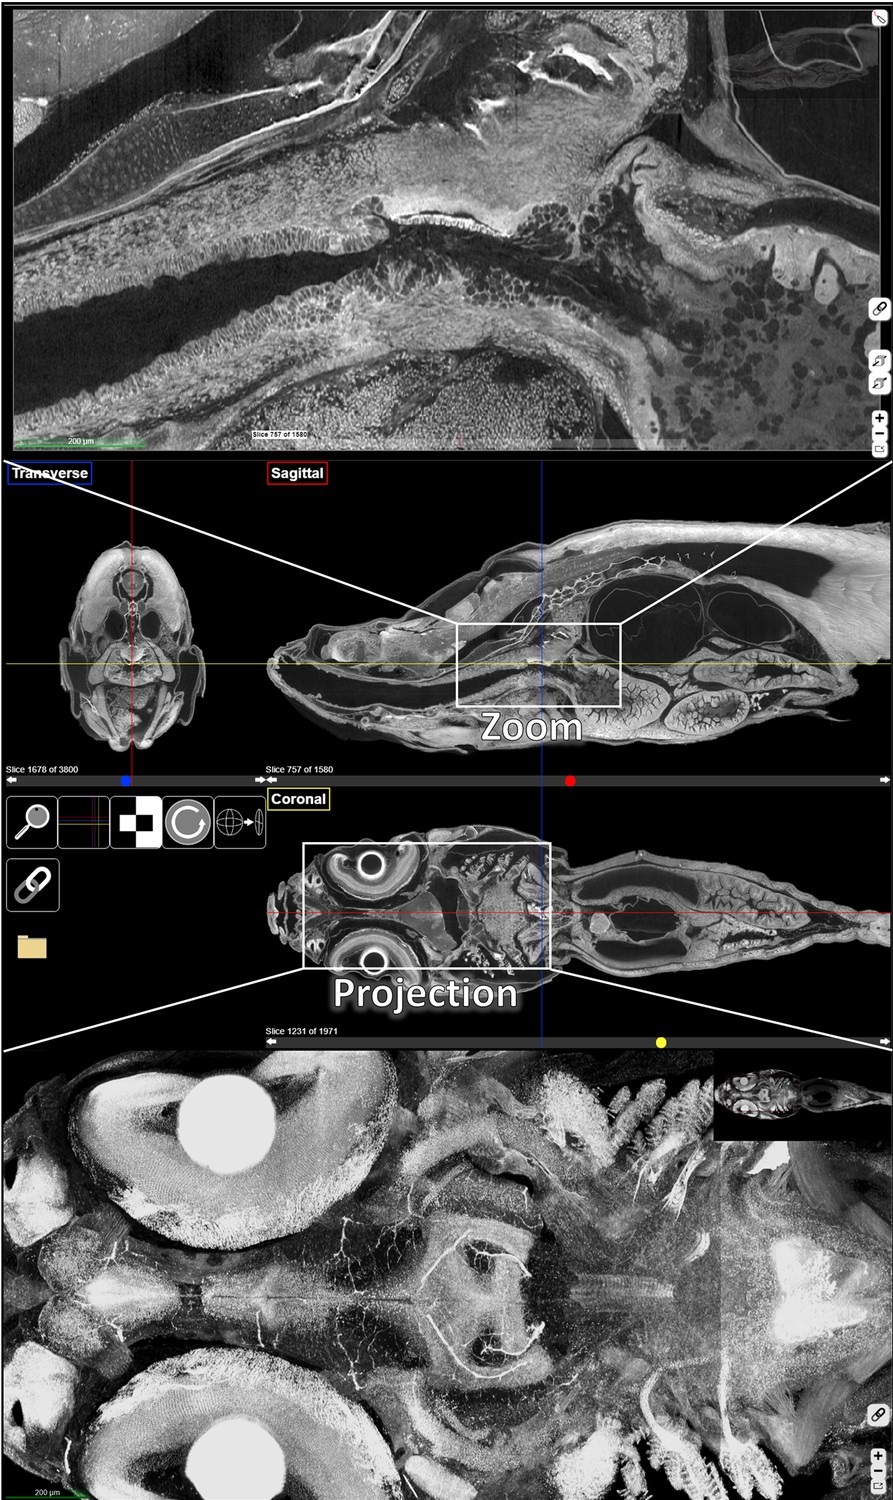
ViewTool, a web-based, digital, multi-planar histology interface.
Orthogonal views (middle), a zoomed view (top), and a projection zoom view (bottom, 36 slice, 50 µm projection) of the head of a juvenile (33 dpf) zebrafish are presented. Sagittal, coronal, and transverse sections are denoted by red, yellow, and blue lines, respectively.
Figure 6
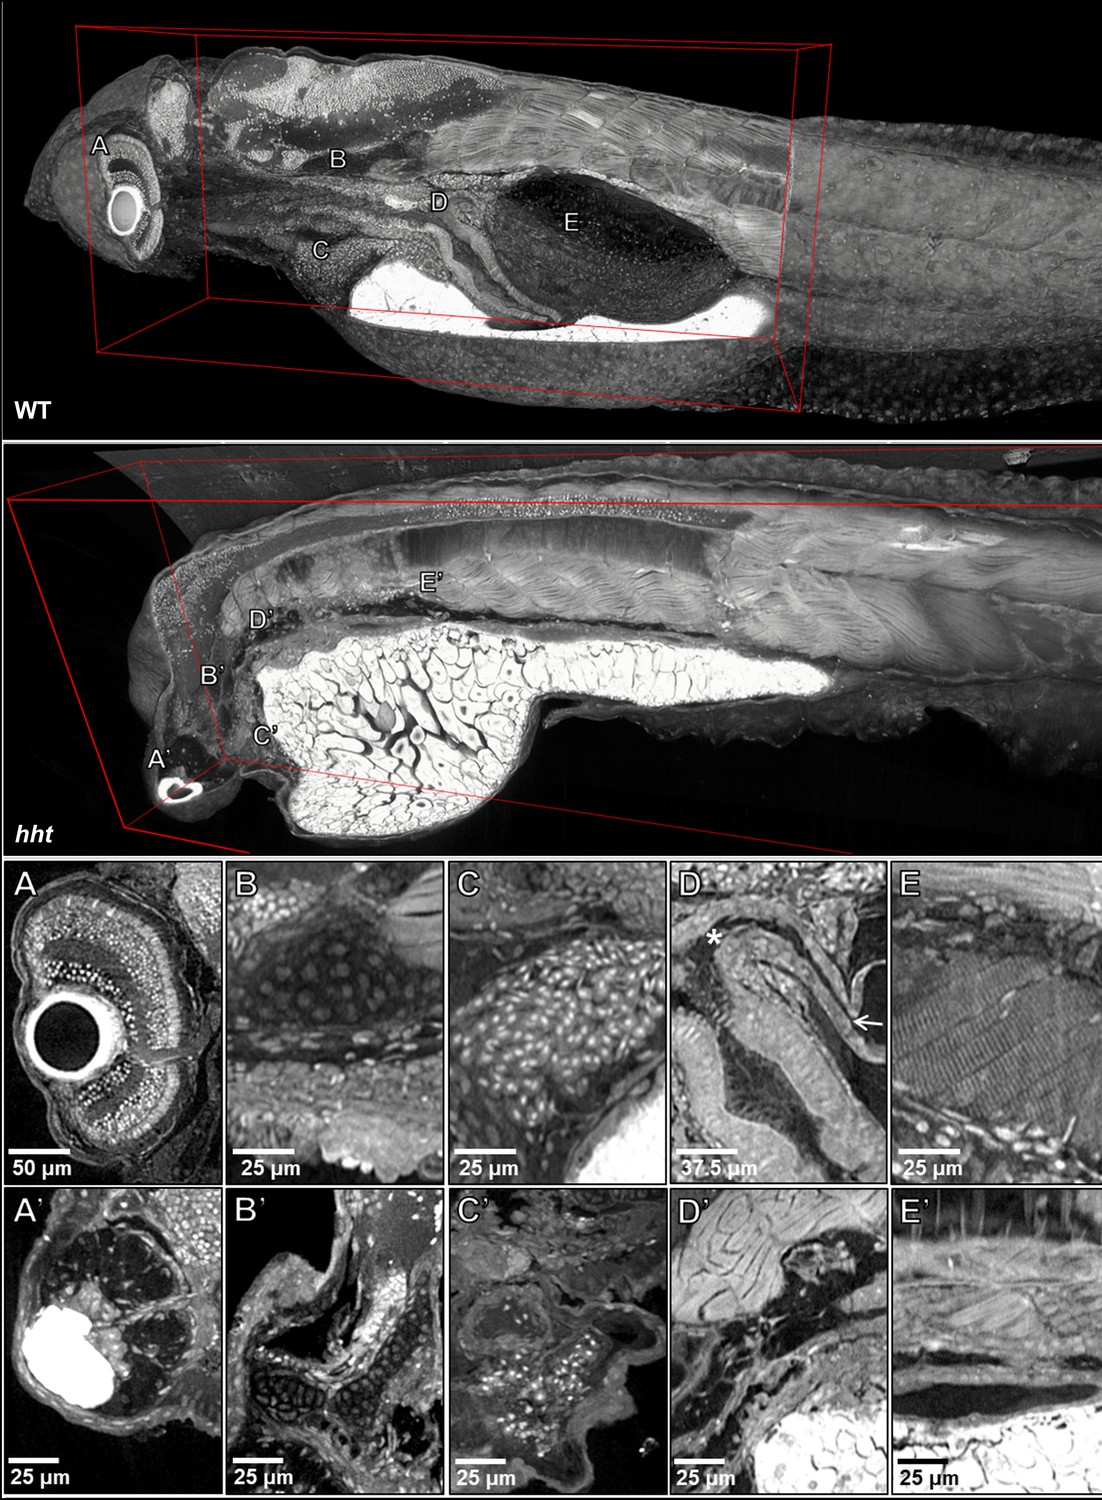
Pan-cellular staining and variable-thickness views allow for characterization of 3D pathological features in wild-type larval and huli hutu mutant specimens.
Top: Cutout visualization of both wild-type and huli hutu larval (five dpf) zebrafish stained with PTA showing detail in many soft tissue structures. Bottom: Cell types and structures that can be visualized include neuronal cells in the eye (A), cartilaginous rudiments of the squamous patch on the dorsal (arrow) pharynx (B), nucleated red blood cells (C), intact pneumatic duct (* to arrow) and goblet cells in the gut (D), and cross-striations of bands of muscles encircling the swim bladder (E). Panels A and D represent individual slices (0.743 μm in thickness) while B, C, E represent maximum intensity projections of 5 μm thick sections to visualize larger 3D structures. Compared to age matched wild-type larval zebrafish (top), the number of neuronal cells in the eye are markedly reduced (A’), chondrocytes appear cytologically normal, but formation of cartilaginous structures is markedly reduced (B’), the myocardium is thickened and, as is evident from a survey through all the sections of the heart (a single slice shown here) contains a markedly reduced number of nucleated red blood cells, consistent with anemia and abnormal hematopoiesis (C’). We are able determine the absence of the pneumatic duct and swim bladder in hht due to the ability to scan through the full volume of the sample. D’ shows degenerate tissue and E’ other tissues where those organs normally lie. A’, B’ and D’ represent individual slices (0.743 μm in thickness) while C’ and E’ represent maximum intensity projections of 5 μm thick sections to visualize structures of larger dimension.
Figure 7 with 2 supplements
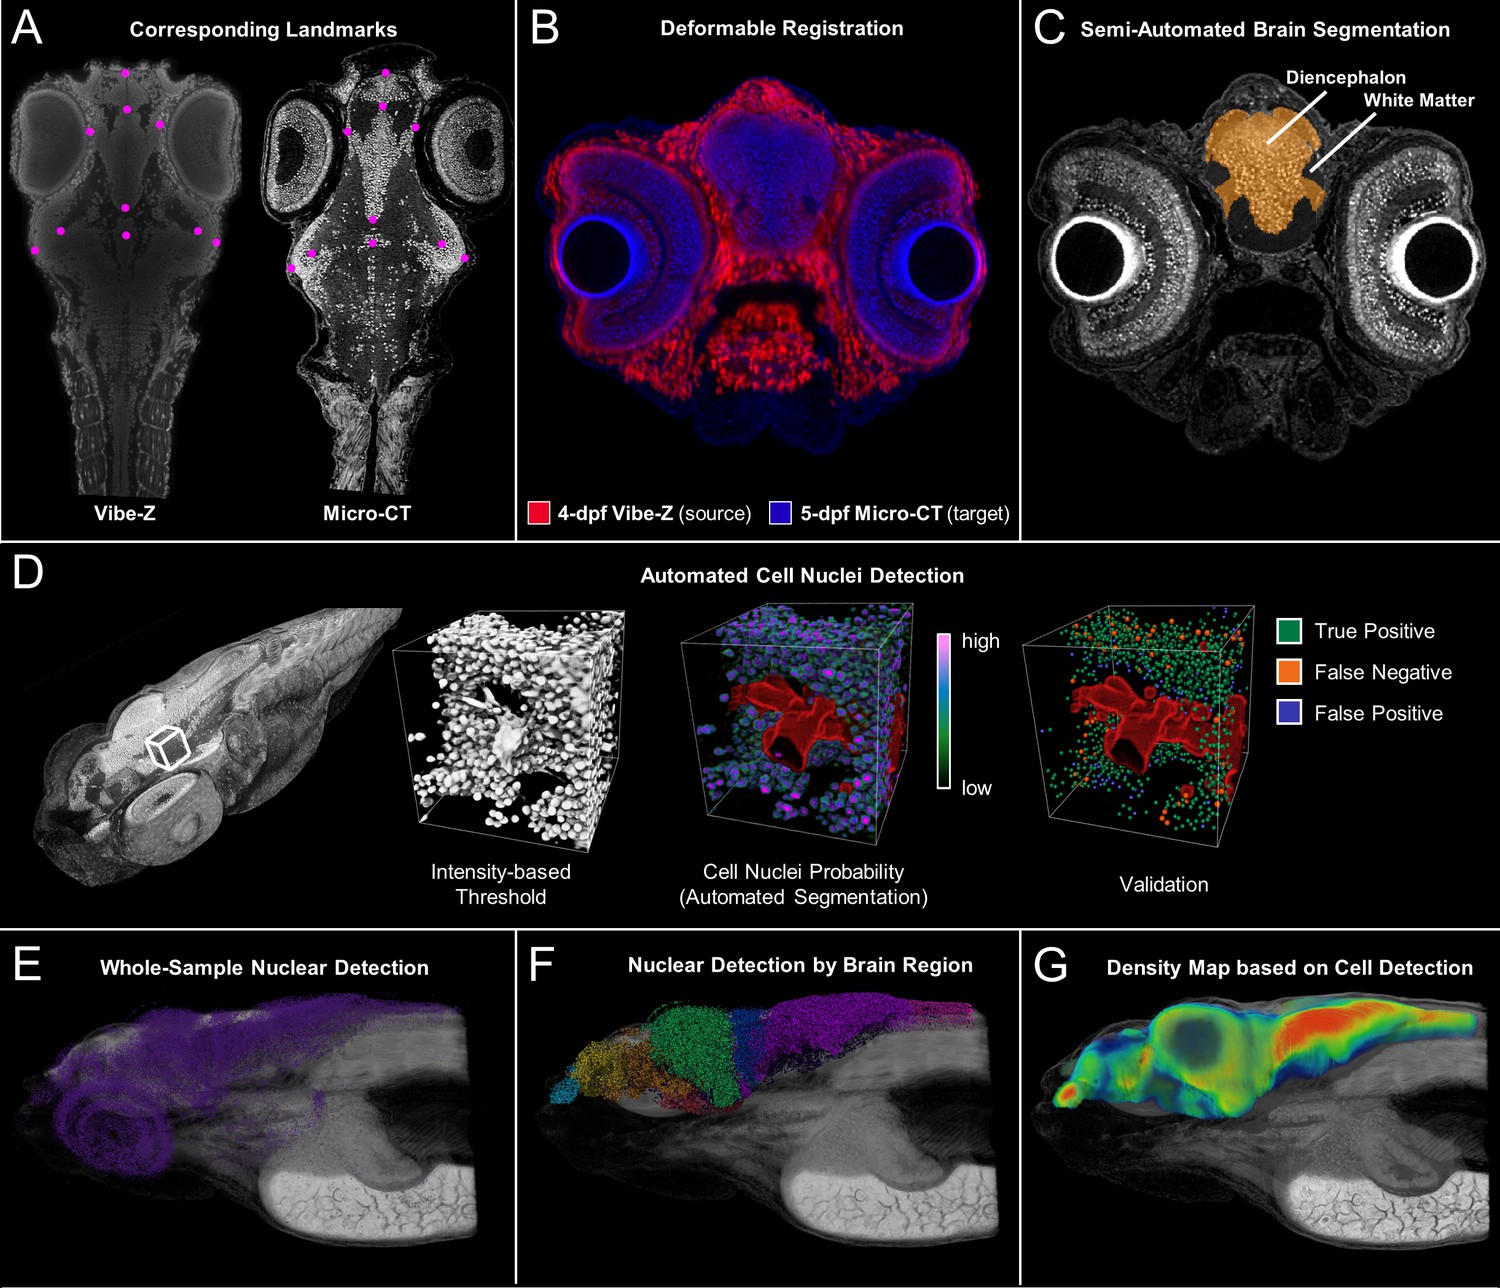
Cross-atlas registration and neuronal cell nuclei detection for assignment of automatically detected cells to major brain regions in developing zebrafish.
Developing larval (five dpf) zebrafish brains were divided into 10 quantifiable anatomically relevant regions by registering sample brains to the Vibe-Z volume-based zebrafish brain atlas and referencing to an immunohistochemistry BrdU based neuroanatomy atlas. Sample landmark selection is shown for equivalent slices between the ViBE-Z atlas data and a five dpf micro-CT for registration-based segmentation (A). Overlay of ViBE-Z atlas embryo (red) over five dpf data (blue) post-registration (B). Semi-automated brain segmentation presented for a five dpf sample in its anatomic context in a representative slice (C). Neuronal cell nuclei detection and validation using a supervised random forest classifier (D). Nuclear detection visualized as a point map for a typical five dpf sample in its anatomic context (E). Semi-automated brain segmentation overlaid onto classifier-based nuclei detection (F). Brain density was calculated by counting every nucleus within a ~ 22 micron (30 voxel) radius surrounding each voxel of the brain (G)..This dimension waschosen because it covers about 5 cell diameters, an estimate of the width of a small brain region.
Figure 7—figure supplement 1
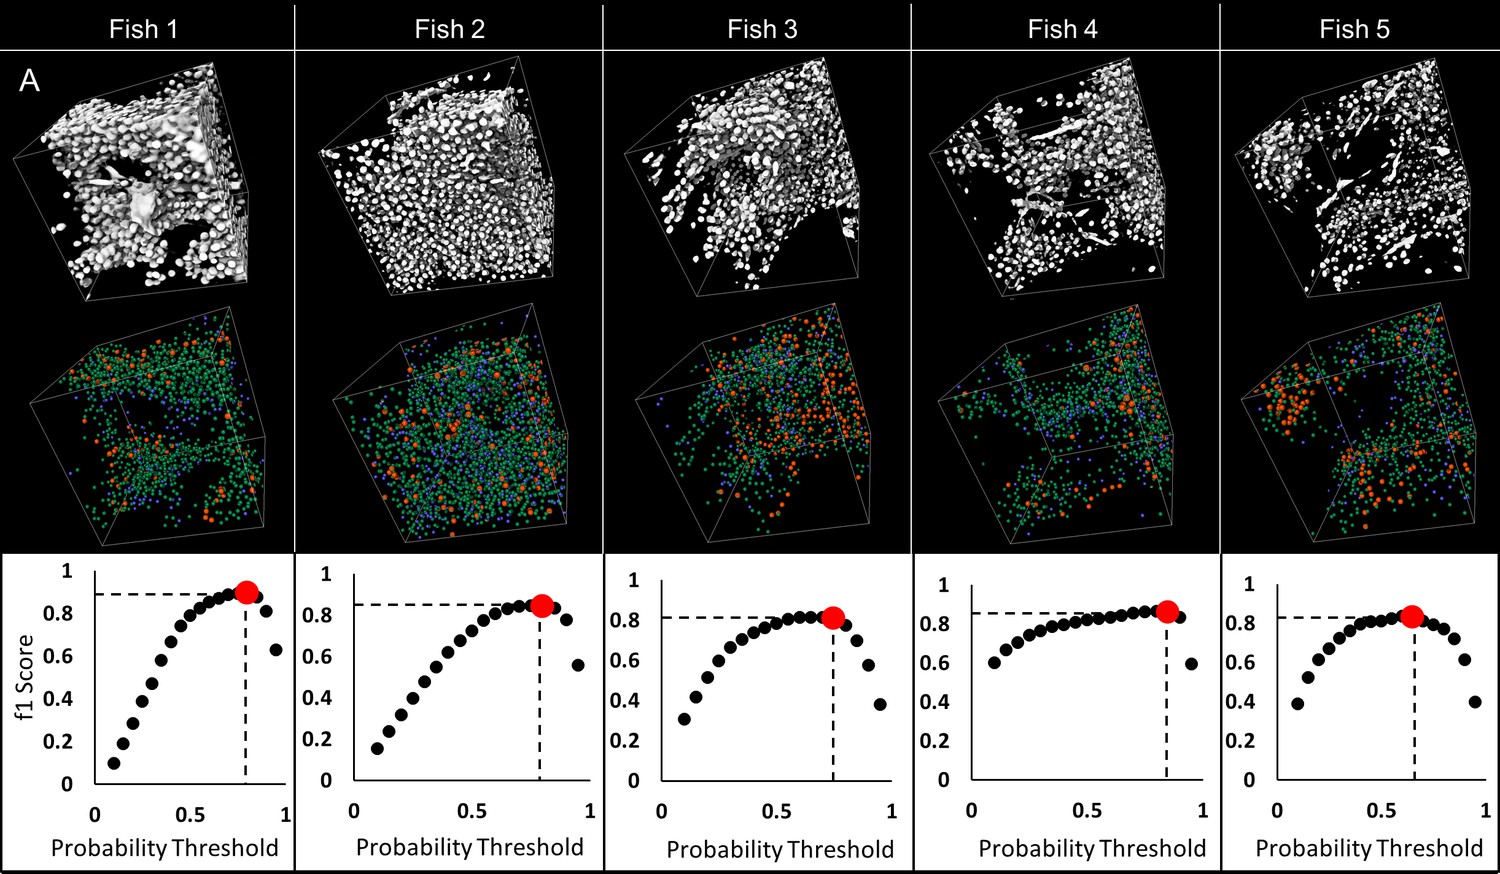
Validation of automated detection of neuronal cell nuclei in larval (five dpf) zebrafish.
75 × 75×75 µm regions were selected on each fish to validate detection of nuclei: sample regions R1, R2 and R3 are presented (A). 3D visualizations of thresholded original data (B–a) and nuclear probabilities based on the trained classifier (B–b) in Region two are shown. 3D rendering of validation is presented in (B–c); green denotes true positive, blue false positive, orange false negative. Good agreement between manual and automated segmentation is shown on regional 3D rendering and f1 scores (C) across all specimens.
Figure 7—figure supplement 2
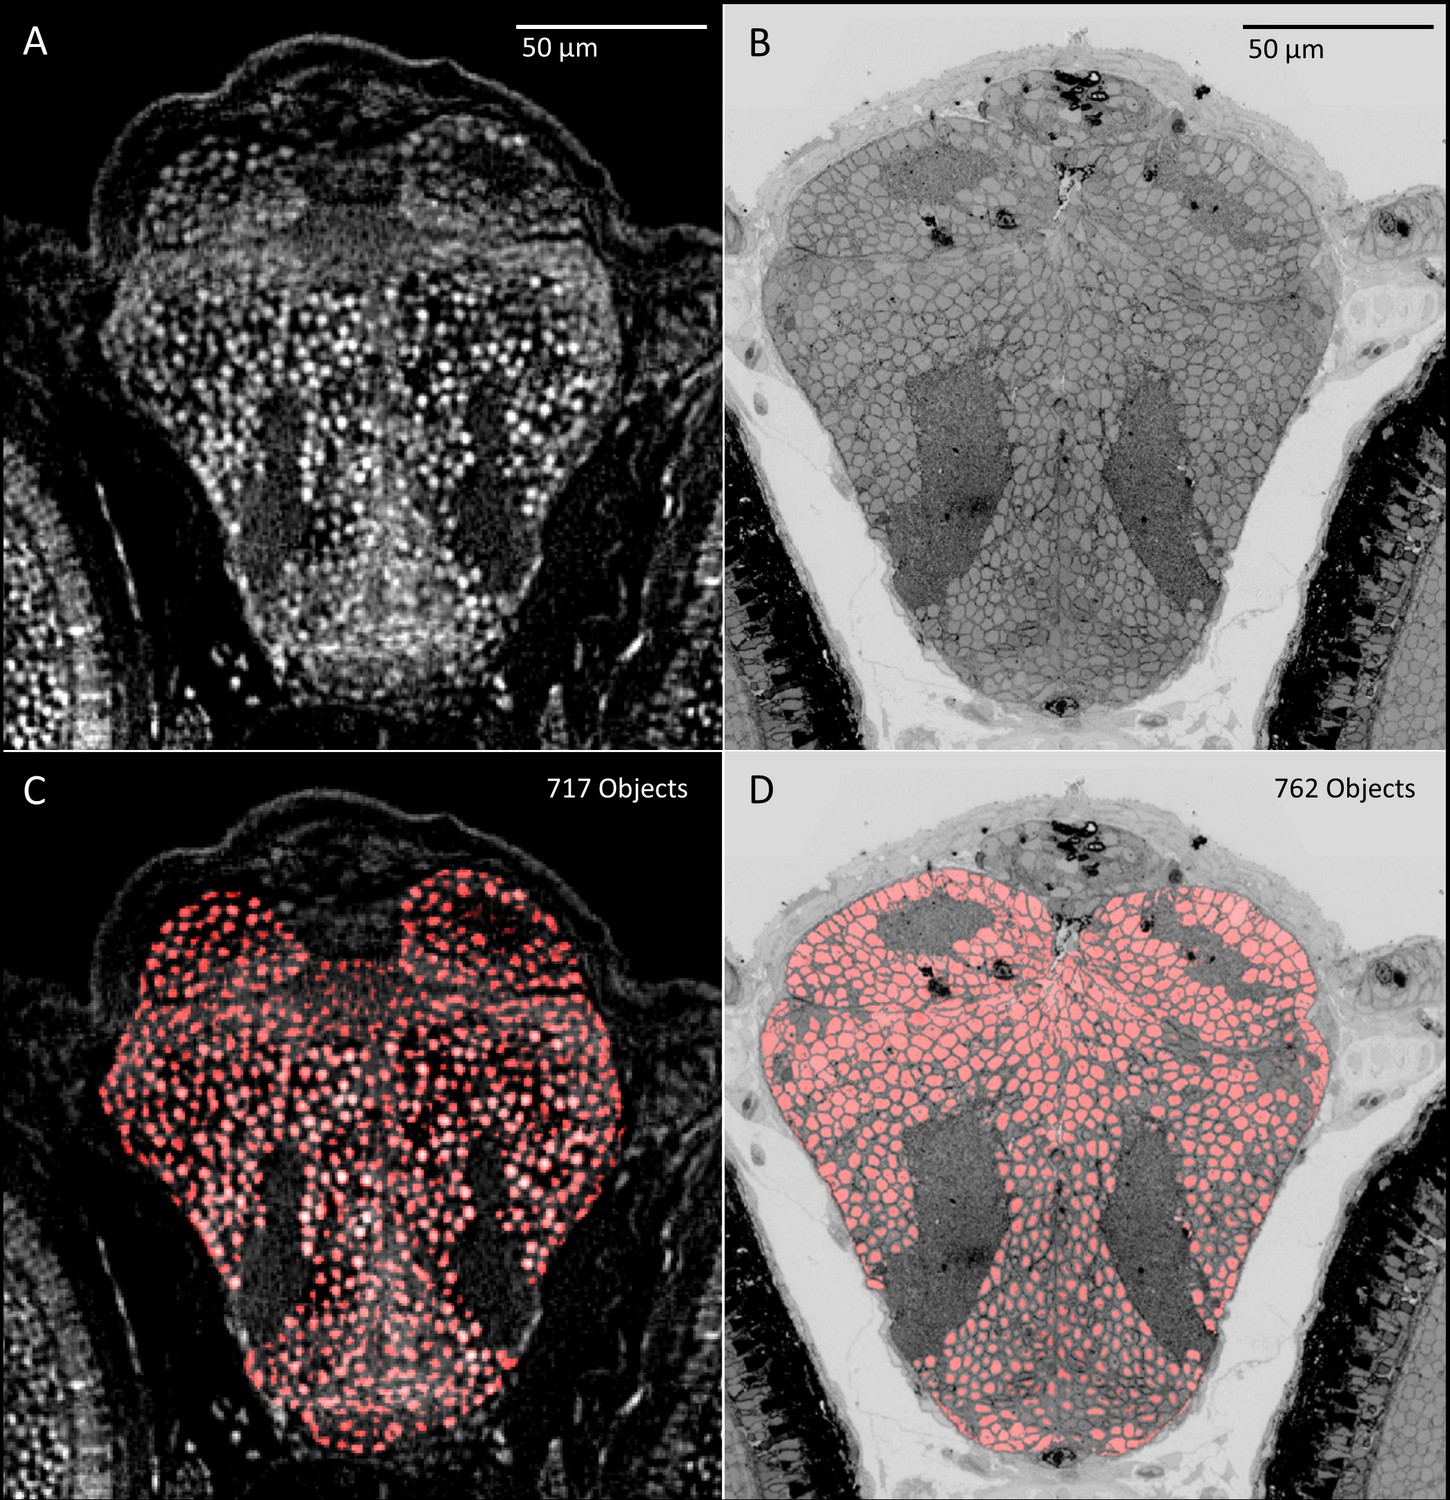
Comparison of object detection between micro-CT (five dpf) and transmission electron microscopic (5.5 dpf) sections.
PTA and osmium staining in (A) micro-CT and (B) transmission electron microscopy images (Hildebrand et al., 2017) both allow the nuclei of individual cells to be distinguished. Automated object detection applied to these images show similar regional patterning and counts of nuclei in corresponding brain slices (C, D).
Figure 8

Measurement of shape and volume of brain nuclei.
Shape and volume of manually detected brain cell nuclei varies between red blood cells (RBCs) and motor neurons (n = 20 cells each) (A, B). The mean elongation was 1.9, 1.3, and 1.1 for RBCs, motor neurons, and brain nuclei, respectively. The mean volume was 99, 102, and 13 µm3 for RBCs, motor neurons, and brain nuclei, respectively. These releative values are consistent with what is visually apparent in both histology (C1 and C3) and histotomography (C2 and C4). Volumes of motor neuron and erythrocytes include both nuclei and cytoplasm. Differences in the distribution of brain nuclei were also observed. Cell nuclei were also identified across whole zebrafish samples via a manually trained classifier and segregated by registering brain regions for five five dpf samples (D). The regions identified through anatomical landmarks include olfactory epithelium, telencephalon, diencephalon, mesencephalon, metencephalon, myelencephalon, hypothalamus, spinal cord, and white matter. The proportion of cells per brain region as percentage of total cell counts, agree in rank order between samples (E). Computed elongation and volumes showed no significant difference between individual fish (F, G).
Figure 9
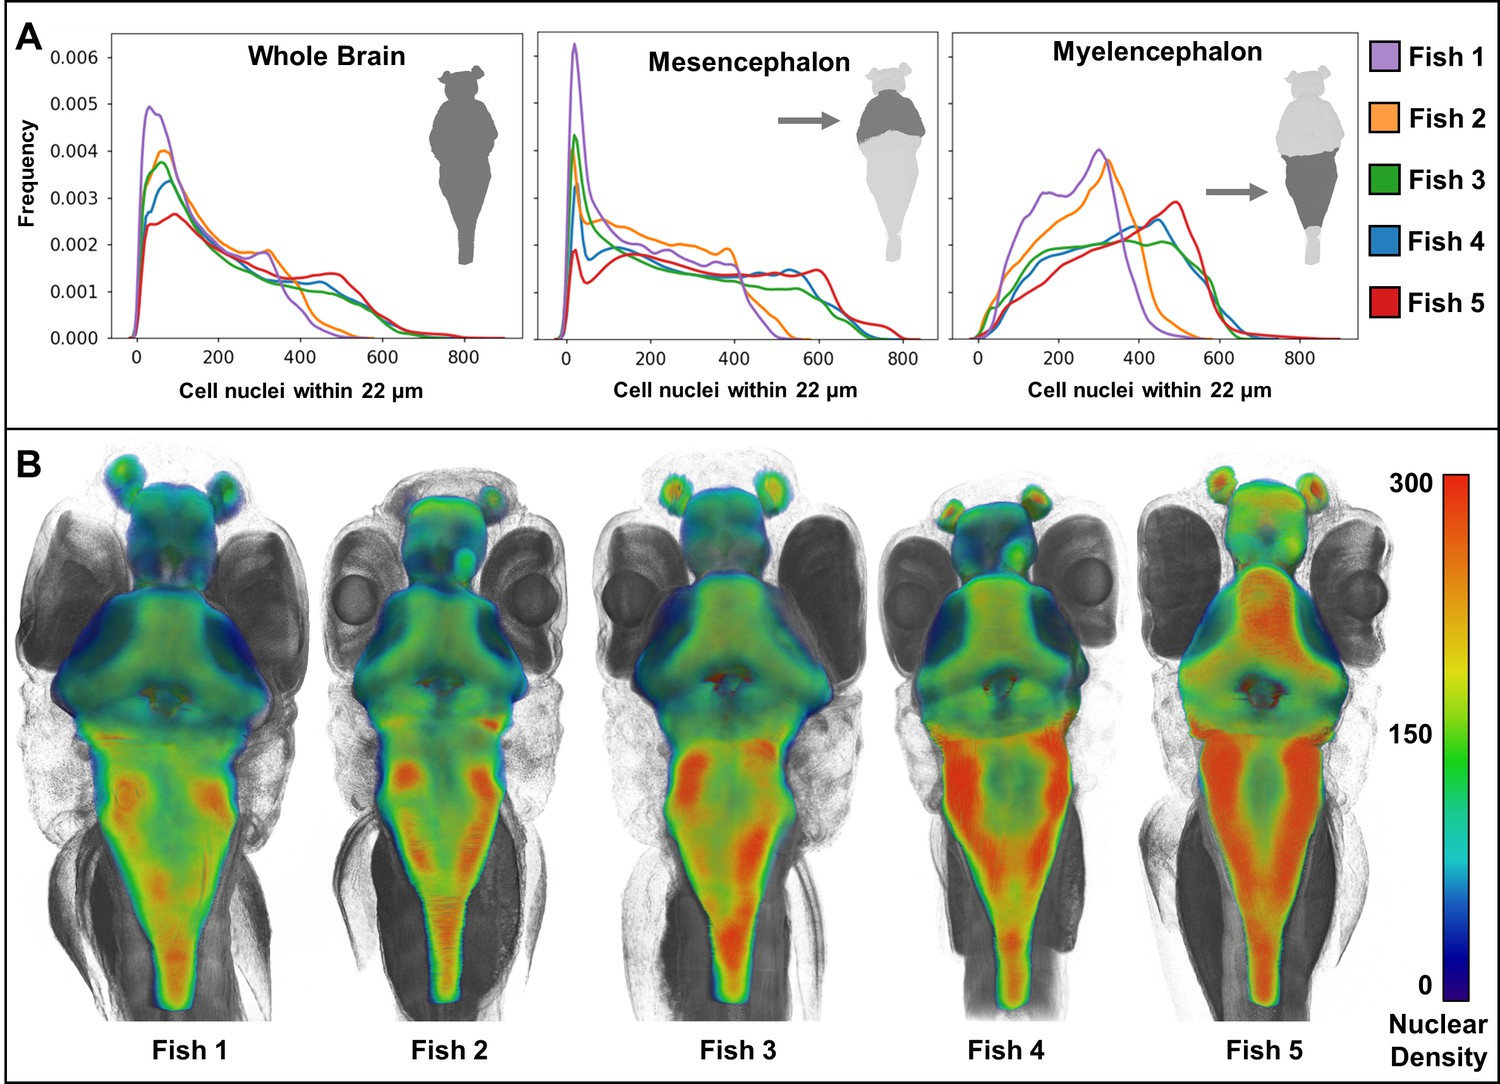
Heat maps of regional density of cell nuclei reveal striking phenotypic variation between larval zebrafish.
Cellular density varies between individual brain regions and carries distinct signals consistent between individual samples (A). 3D renderings of whole-brain densities with identical transparency settings are presented for each fish (B) and reflects signal differences presented in (A).
Videos
Video 1
X-ray Projection and Sinogram.
This video demonstrates the relationship between multi-angle projection data and sinograms, which are used in reconstruction to backproject single axial slices that are combined to generate a volume (online viewing available from, https://youtu.be/MjobFBLc5m8). Best if viewed at highest quality setting.
Video 2
Larval Flipbook.
This video shows full cross-sections of the larval (five dpf) zebrafish from the sagittal orientation (0.743 micron slice thickness) for histology-like phenotyping and qualitative analysis (online viewing available from, https://youtu.be/hyyZu2_75Qc). Intensity histogram of the dataset was inverted and locally adjusted to better discern originally faint or overlapping structures. Best if viewed at highest quality setting.
Video 3
Juvenile Flipbook.
This video shows full cross-sections of the juvenile (33 dpf) zebrafish from the sagittal orientation (1.4 micron slice thickness) for histology-like phenotyping and qualitative analysis (online viewing available from, https://youtu.be/gyxmFJGU1RY). Intensity histogram of the dataset was inverted and locally adjusted to better discern originally faint or overlapping structures. Best viewed at highest quality setting.
Video 4
Gill Flyover.
The gill structure is visualized in a whole juvenile (33 dpf) zebrafish in order to demonstrate the ability of soft tissue synchrotron micro-CT to resolve the complex structure of 3D tissues in detail (online viewing available from, https://youtu.be/16sZpZZj9GU). Best viewed at highest quality setting.
Video 5
Juvenile Flythrough.
Tissue structure of a juvenile (33 dpf) zebrafish stained with PTA and imaged with synchrotron micro-CT are visualized through a core-like cut from the center of the digitized sample (online viewing available from, https://youtu.be/FNG-NwXsGHA). Best viewed at highest quality setting.
Video 6
Huli hutu Larval Flipbook and Cell Detection.
This video shows full cross-sections of the huli hutu mutant larval (five dpf) zebrafish from the sagittal orientation (0.743 micron slice thickness) for histology-like phenotyping and qualitative analysis (online viewing available from, https://youtu.be/KbVnamIMPiA). Neuronal cell nuclei probabilities of the mutant are also shown along with a wild-type comparison. The intensity histogram of the dataset was inverted and locally adjusted to enhance the visibility of faint or overlapping structures. Best viewed at highest quality setting.
Tables
Table 1
ViewTool database.
Scans listed are available for viewing on ViewTool at http://3D.fish and are PTA stained unless otherwise noted. Raw scans are available on request. Note: The wild-type larval five dpf samples, used for quantitative analysis, were imaged on the same day. *Only the cranial section (head) is presented.
| Zebrafish specimen | Age (dpf) | Segments | 12-bit projections (GB) | 32-bit reconstructions (GB) |
|---|---|---|---|---|
| Larval (wildtype) | 2 | 2 | 25.2 | 64 |
| 3 | 2 | 25.2 | 64 | |
| 4 | 3 | 37.8 | 96 | |
| 5 | 3 | 37.8 | 96 | |
| 5 | 1* | 12.6 | 32 | |
| 5 | 1* | 12.6 | 32 | |
| 5 | 1* | 12.6 | 32 | |
| 5 | 1* | 12.6 | 32 | |
| Larval (huli hutu) | 2 | 1* | 12.6 | 32 |
| 3 | 1* | 12.6 | 32 | |
| 4 | 1* | 12.6 | 32 | |
| 5 | 2 | 25.2 | 64 | |
| Juvenile | 33 | 5 | 63.0 | 160 |
Table 2
Cell nuclei counts in different five dpf zebrafish brain regions.
Major divisions of the zebrafish brain and the number of cell nuclei in each division (counts) are shown across five fish. Mean total cell nuclei count is 75,413 and relative standard deviation ±11.3%.
| Major brain divisions | Brain region cell nuclei (Counts) | ||||
|---|---|---|---|---|---|
| Specimen number | 1 | 2 | 3 | 4 | 5 |
| Olfactory Epithelium | 855 | 398 | 1103 | 1158 | 1257 |
| Telencephalon | 3696 | 4735 | 4576 | 3704 | 4570 |
| Diencephalon | 6323 | 6076 | 7390 | 7718 | 8134 |
| Hypothalamus | 2096 | 2342 | 3392 | 3047 | 2680 |
| Mesencephalon | 17,377 | 15,993 | 21,161 | 21,448 | 22,275 |
| Metencephalon | 876 | 1025 | 1012 | 2865 | 1713 |
| Myelencephalon | 27,899 | 28,691 | 30,991 | 37,769 | 34,766 |
| White Matter | 5633 | 5955 | 5810 | 4524 | 5181 |
| Spinal Cord | 1408 | 1570 | 1850 | 1712 | 2312 |
| Total | 66,163 | 66,785 | 77,285 | 83,945 | 82,888 |
Table 3
Brain Volumes by Region for five dpf Zebrafish Brain.
Major divisions of the zebrafish brain and their volumes (μm3) are shown across five zebrafish. Mean total volume is 15,507,461 and relative standard deviation ± 11.9%.
| Major brain divisions | Brain region volumes (µm3) | ||||
|---|---|---|---|---|---|
| Specimen number | 1 | 2 | 3 | 4 | 5 |
| Olfactory Epithelium | 293,251 | 171,459 | 164,338 | 131,459 | 111,195 |
| Telencephalon | 1,117,500 | 1,021,518 | 956,493 | 826,273 | 672,572 |
| Diencephalon | 1,440,447 | 1,300,518 | 1,097,698 | 1,134,753 | 1,046,486 |
| Hypothalamus | 813,210 | 702,116 | 732,073 | 608,018 | 575,387 |
| Mesencephalon | 4,353,108 | 3,442,415 | 3,663,909 | 3,183,413 | 2,885,684 |
| Metencephalon | 324,562 | 273,699 | 388,409 | 529,656 | 296,336 |
| Myelencephalon | 4,982,069 | 4,636,451 | 3,977,877 | 4,550,207 | 3,850,373 |
| White Matter | 4,783,477 | 4,358,188 | 4,119,302 | 3,963,126 | 3,529,787 |
| Spinal Cord | 78,092 | 97,609 | 117,260 | 109,808 | 125,722 |
| Total | 18,185,716 | 16,003,973 | 15,217,359 | 15,036,713 | 13,093,542 |
Key resources table
| Reagent type (species) or resource | Designation | Source or reference | Identifiers | Additional information |
|---|---|---|---|---|
| Strain (Danio rerio) | Wild-type Ekkwill | ZFIN ID: ZDB-GENO -990520–2 | ||
| Genetic reagent (Danio rerio) | huli hutu | Mohideen et al., 2003 | ||
| Chemical compound, drug | 10% neutral buffered formalin | Fisher Scientific | ||
| Chemical compound, drug | EMBed-812 | Electron Microscopy Sciences | ||
| Chemical compound, drug | ethyl alcohol | Pharmco-Aaper | ||
| Chemical compound, drug | Finquel (MS-222, tricaine-S) | Argent Chemical Laboratories | ||
| Chemical compound, drug | glycol methacrylate | Polysciences | ||
| Chemical compound, drug | Kapton tubing | Small Parts | ||
| Chemical compound, drug | phosphate-buffered saline | Sigma-Aldrich | ||
| Chemical compound, drug | phosphotungstic acid | VWR | ||
| Chemical compound, drug | Ovadine | Syndel | ||
| Software, algorithm | Avizo | Thermo Fisher Scientific | SCR_014431 | version 9.4 |
| Software, algorithm | Elastix | http://elastix.isi.uu.nl/ | SCR_009619 | version 4.8 |
| Software, algorithm | Fiji/ImageJ2 | https://fiji.sc/ | SCR_002285 | |
| Software, algorithm | Ilastik | Sommer et al., 2011 (http://ilastik.org/) | SCR_015246 | version 1.3 |
| Software, algorithm | ITK-SNAP | Yushkevich et al., 2006 (http://www.itksnap.org) | SCR_002010 | version 3.4 |
| Software, algorithm | OpenSeaDragon | https://openseadragon.github.io/ | ||
| Software, algorithm | TomoPy | Argonne National Labs (http://tomopy.readthedocs.io) | ||
| Software, algorithm | VGStudio Max 2.1 | Volume Graphics |
Additional files
-
Transparent reporting form
- https://doi.org/10.7554/eLife.44898.028
Download links
A two-part list of links to download the article, or parts of the article, in various formats.
Downloads (link to download the article as PDF)
Open citations (links to open the citations from this article in various online reference manager services)
Cite this article (links to download the citations from this article in formats compatible with various reference manager tools)
Computational 3D histological phenotyping of whole zebrafish by X-ray histotomography
eLife 8:e44898.
https://doi.org/10.7554/eLife.44898


