A Myt1 family transcription factor defines neuronal fate by repressing non-neuronal genes
- Stanford University, United States
- Howard Hughes Medical Institute, Stanford University, United States
- Sloan-Kettering Institute, United States
- University of California, Davis, United States
Figures
Figure 1 with 2 supplements
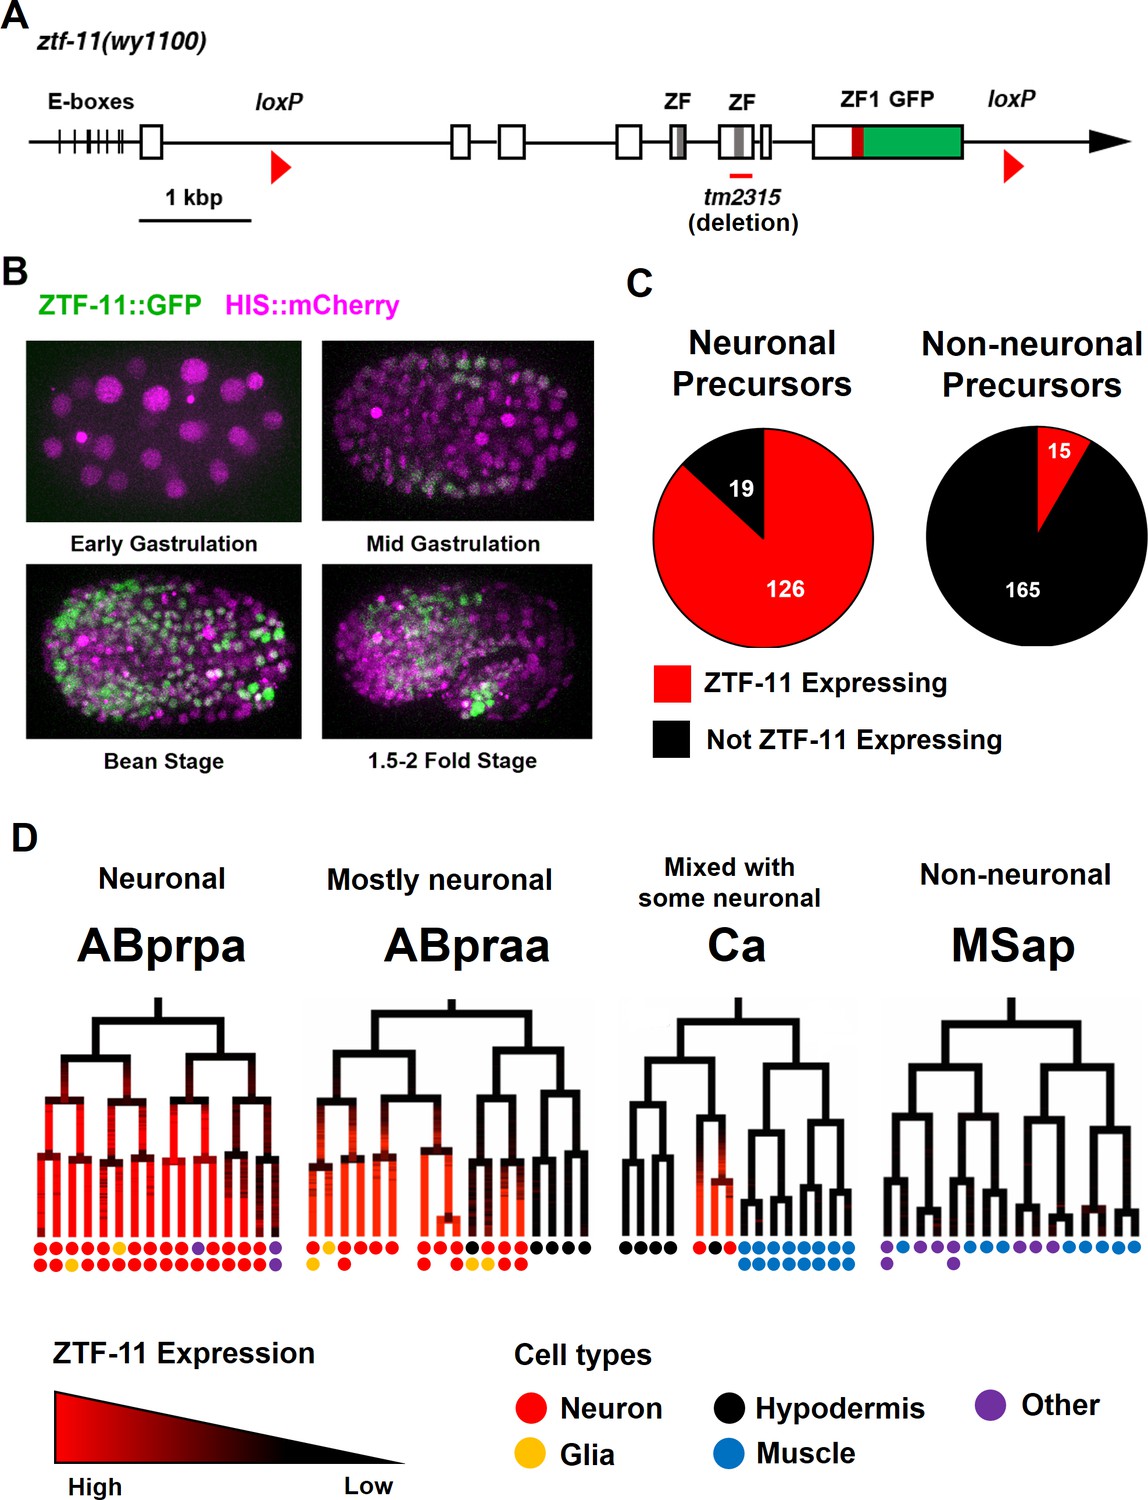
Myt1 family homolog ZTF-11 is expressed in neuronal precursors.
(A) Schematic showing ztf-11::gfp (wy1100). ZF, C2HC zinc-finger domain. ZF1, ZF1 zinc-finger domain. Magenta line underneath the second ZF denotes the area deleted in tm2315. See also Figure 1—figure supplement 1 for evolutionary conservation of Myt1 family proteins. (B) ZTF-11::GFP expression in neuronal precursor populations during embryogenesis. Also see Video 1. (C) Quantification of ZTF-11::GFP expressing cells in neuronal precursors and non-neuronal precursors at 350 cell stage. A neuronal precursor was defined by any cells giving rise to non-pharyngeal neurons. (D) Selected lineage diagrams showing correlation between ZTF-11::GFP expression and terminal cell fates in selected sub-lineages. Each dot under the line represents the ultimate cellular fate. In many cases, cells undergo additional round of cell division past automated lineage tracing and result in two daughter cells (indicated by two dots under each line). See also Supplementary file 1 for full lineage diagram with ZTF-11::GFP expression and their terminal fates.
Figure 1—figure supplement 1
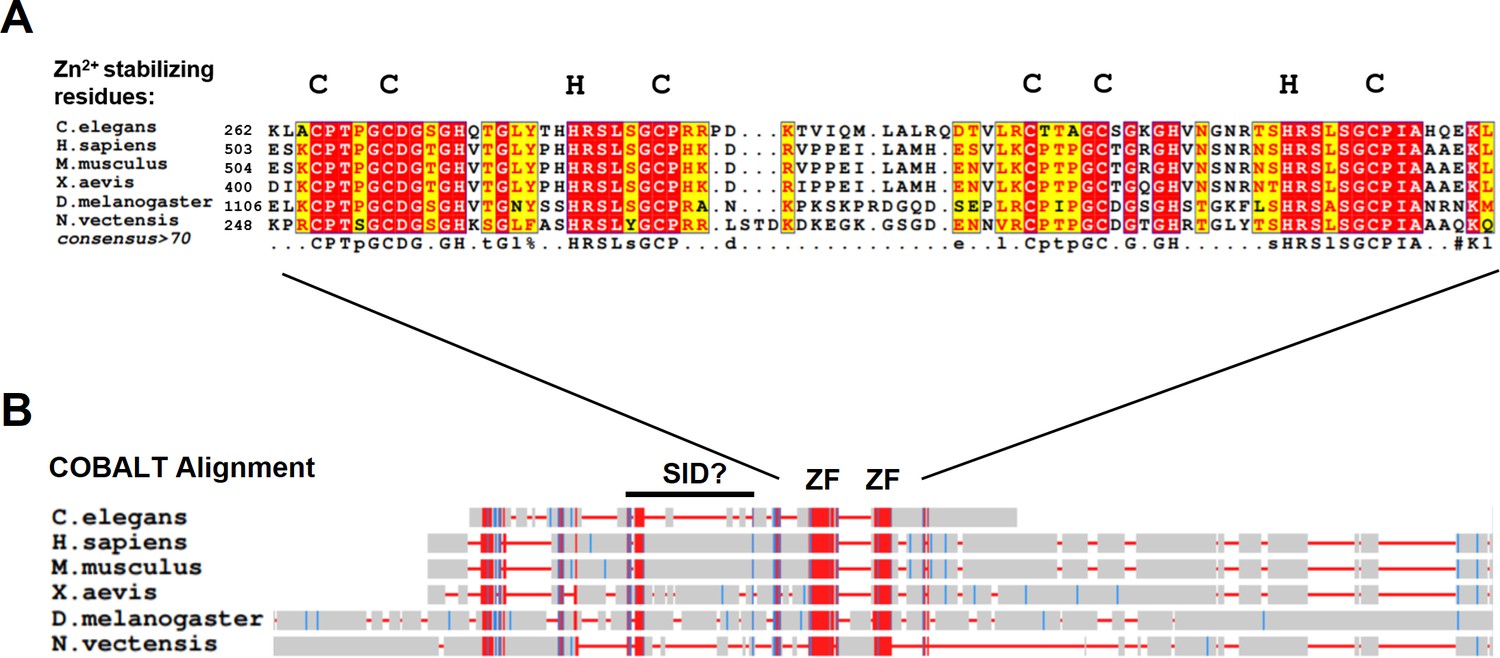
Myt1 family proteins share conserved C2HC zinc-finger domains.
(A) Amino acid conservation of C2HC zinc-finger domains from representative Myt1 family proteins. Identical amino acid are in red and conserved amino acids are in yellow. Note the zinc ion stabilizing residues that define C2HC zinc-finger. Alignment was generated using T-Coffee and visualized by ESPript. (B) Constraint-based Multiple Alignment (COBALT) of representative Myt1 family proteins. Strongly conserved regions are in red, weakly conserved regions are in blue, and non-conserved regions are in gray.
Figure 1—figure supplement 2

ZTF-11 is expressed in postembryonic neuroectoblasts.
Representative confocal images of endogenous ZTF-11 expression during early larval development. Cells were identified based on lineage and position.
Figure 2 with 1 supplement

ZTF-11 is a direct transcriptional target of proneural bHLH genes.
(A) ztf-11 transcriptional reporter expression in head neurons is strongly decreased in E/daughterless homolog hlh-2(tm1768) hypomorphic mutant. Left, representative confocal images of ztf-11 transcriptional reporter in wt or hlh-2. Synchronized early L1 animals were used in the experiment. Right, transcriptional activity was measured in total GFP intensity within each animal’s head (white dashed outlines), n = 20 and 22, respectively. Error bars, S.D. ****p<0.0005, Student’s t-test two-tailed. See Figure 2—source data 1 for numerical data. (B) E-boxes are required for ZTF-11 transcriptional reporter expression. wt, wild-type ztf-11 promoter driving GFP and mCherry reporters. ΔE-box, 8 E-box sequences (CANNTG) nearest to ztf-11 tss were mutated to ACnnAG for GFP driving promoter, mCherry expression is under wild-type ztf-11 promoter as expression level control. Synchronized early L1 animals were used in the experiment. Left, representative confocal images. Right, relative intensities between GFP and mCherry within each animal’s head (white dashed outlines) were quantified. n = 10 each. Error bars, S.E.M. **p<0.05, Student’s t-test two-tailed. See Figure 2—source data 2 for numerical data.
-
Figure 2—source data 1
Raw fluorescence intensity values of ZTF-11 transcriptional reporter in wild-type or hlh-2(tm1768) animals.
- https://doi.org/10.7554/eLife.46703.009
-
Figure 2—source data 2
Normalized fluorescence intensity values of wild-type or ∆E-box transcriptional reporters.
- https://doi.org/10.7554/eLife.46703.010
Figure 2—figure supplement 1

Expression pattern of ZTF-11 transcriptional reporter.
ZTF-11 transcriptional reporter (magenta) colocalizes with endogenous ZTF-11::GFP (green) in the embryo. Control ZTF-11 promoter fusion construct used in Figure 2 was used to generate ZTF-11 transcriptional reporter.
Figure 3 with 1 supplement
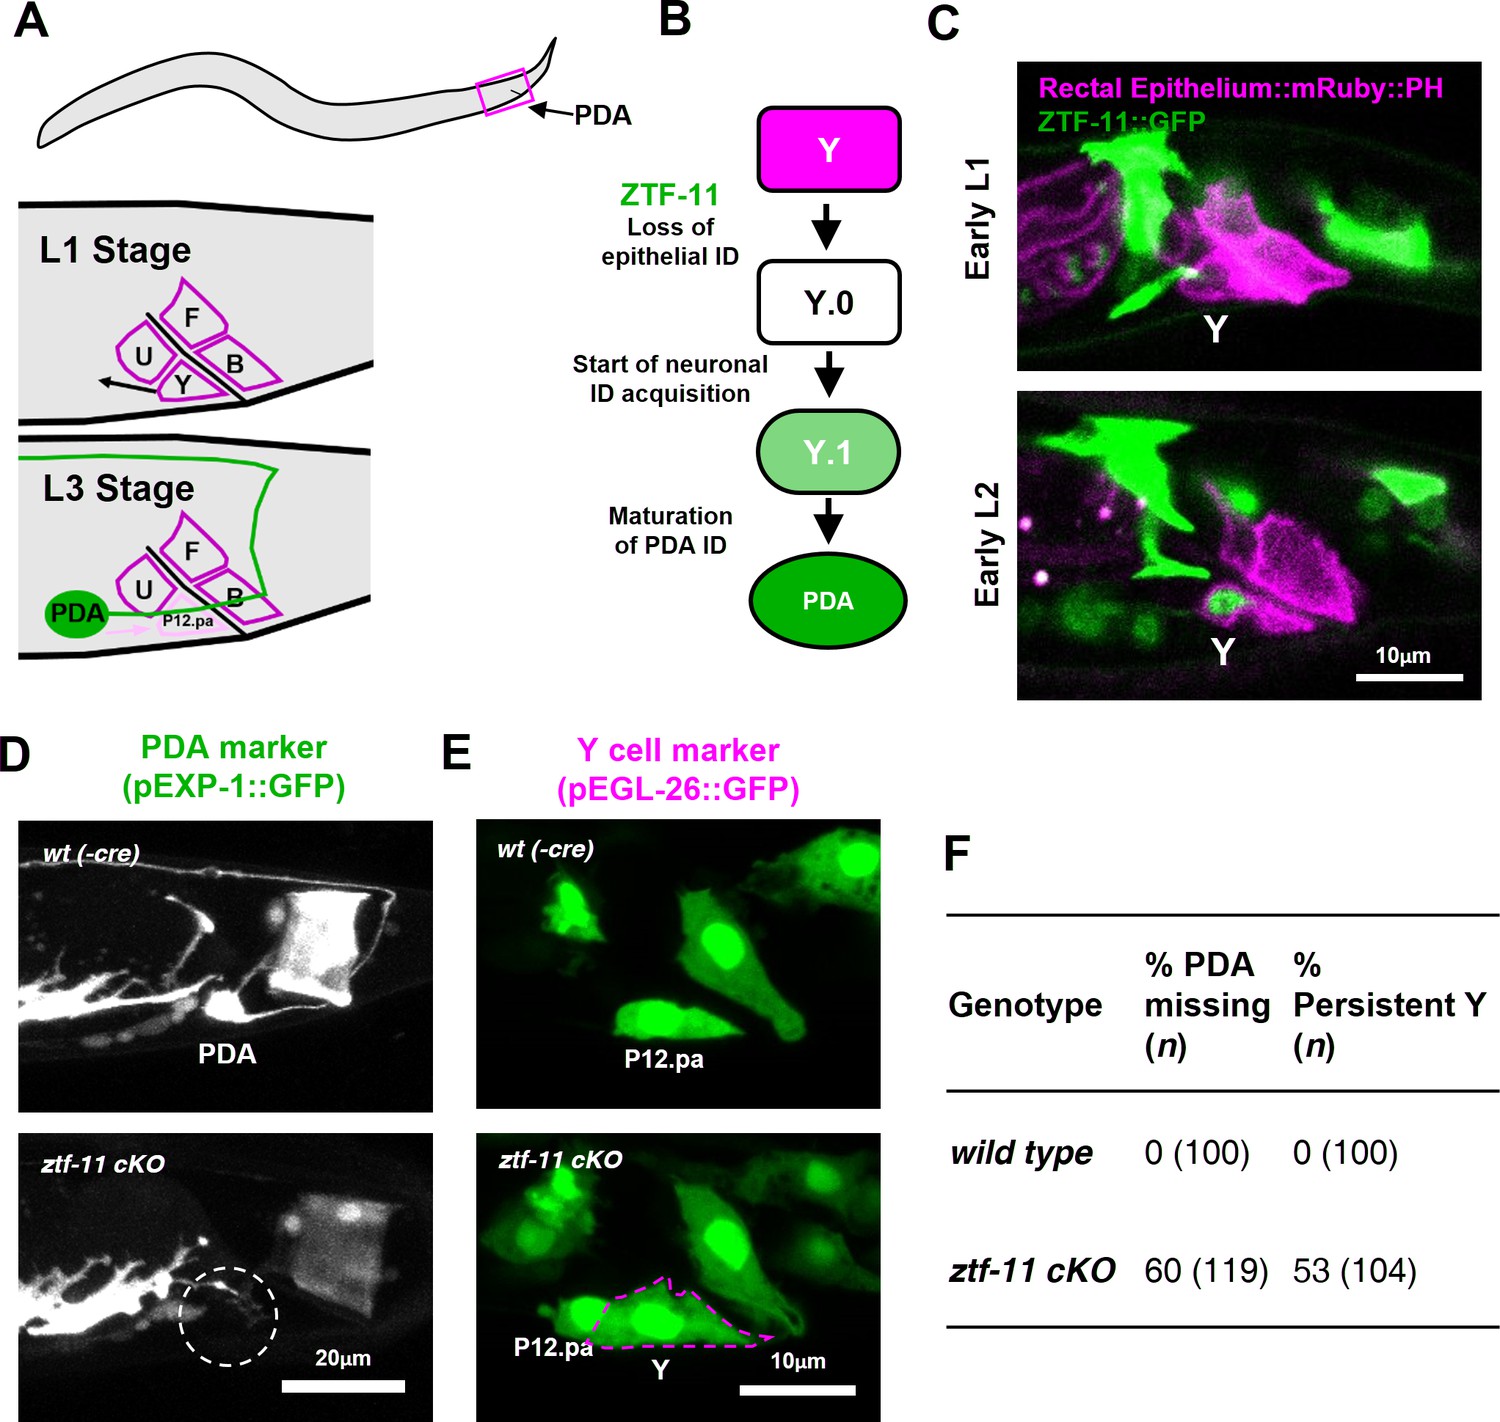
ZTF-11 is required for epithelial-to-neuronal transdifferentiation in vivo.
(A) PDA neuron, located in preanal ganglion, arises from stereotyped transdifferentiation of rectal epithelial cell Y. (B) Schematic diagram of Y-to-PDA transdifferentiation event. Rectal epithelium Y cell withdraws from its rectal niche starting late L1 and loses epithelial markers to yield an intermediate cell (Y.0). During L2, Y gains neuronal markers and morphology (Y.1) to become mature PDA in L3. Meanwhile, P12.pa cell take place of Y in the rectal epithelium. Letter color code; magenta (epithelial), green (neuronal) (C) Representative images of ZTF-11::GFP expression during Y-PDA transdifferentiation. Rectal epithelium was labeled with egl-26 marker (magenta, rectal epithelium::mRuby::PH). (D) PDA marker, exp-1, expression in wild type (wt(-Cre)) or ztf-11 conditional knock-out (ztf-11 cKO). Dashed circle indicates the position of PDA cell body. (E) Y cell marker, egl-26, expression in wild type (wt(-Cre)) or ztf-11 conditional knock-out (ztf-11 cKO). Magenta dashed line outlines the retained Y cell. See also Figure 3—figure supplement 1 for exclusivity between PDA marker (cog-1) and rectal epithelium marker (col-34). (F) Quantification of PDA marker (exp-1) loss (from D) and Y marker retention (from E) phenotypes.
Figure 3—figure supplement 1

Rectal epithelial and neuronal fates are mutually exclusive during transdifferentiation.
PDA (cog-1) and rectal epithelium (col-34) markers are shown in wild type (without Cre recombinase expression) or conditional knock-out (Cre expression in Y cell) mutant. Green arrows, PDA. Magenta Arrows, retained Y cell. Note that P12.pa cell, which replaces Y in wild type, fails to localize to its rectal niche.
Figure 4 with 2 supplements

ZTF-11 is required for loss of epithelial identity and subsequent neuronal differentiation in sensory organ development.
(A) ztf-11 and lin-32 are expressed during postdeirid development. Both genes are expressed throughout postdeirid neuroblast (V5.pa) divisions to yield two neuron and two glia. See also Figure 4—figure supplement 1 for full sequence of ztf-11 and lin-32 expression during postdeirid development. (B) V lineage diagram showing cell divisions resulting in postdeirid neurogenesis during L2 larval development. In contrast to V1-4, V5 dynamically expresses ZTF-11 and LIN-32 during neurogenesis. V5 and other seams cells undergo asymmetric cell divisions where the posterior daughters remain as seam cells and the anterior daughters join the epidermal syncytium (hyp7). Line colors denote expression of lin-32 or ztf-11. Letter color code; black (epithelial), magenta (neuronal), pink (glial). (C) PVD marker, ser-2, expression in wild type (wt(-Cre)) or ztf-11 conditional knock-out (ztf-11 cKO). Note that lin-32-expressing nuclei are still present, suggesting that postdeirid cells are born, but fails to adopt neuronal fate. (D) Seam cell marker, scm (wIs78), expression in wild-type expression in wild type (wt(-Cre)) or ztf-11 conditional knock-out (ztf-11 cKO). For C and D, postdeirid cells are labeled with lin-32 marker. (E) Quantification of missing PVD phenotype from C. (F) Quantification of seam cell fate retention phenotype. n = 50 for each genotype. See Figure 4—source data 1 for numerical data.
-
Figure 4—source data 1
Number of cell nuclei expressing both LIN-32 and SCM fate markers.
- https://doi.org/10.7554/eLife.46703.016
-
Figure 4—source data 2
Raw fluorescence intensity values of floxed ZTF-11::GFP in wild-type(-cre) or ztf-11 cKO animals.
- https://doi.org/10.7554/eLife.46703.017
Figure 4—figure supplement 1
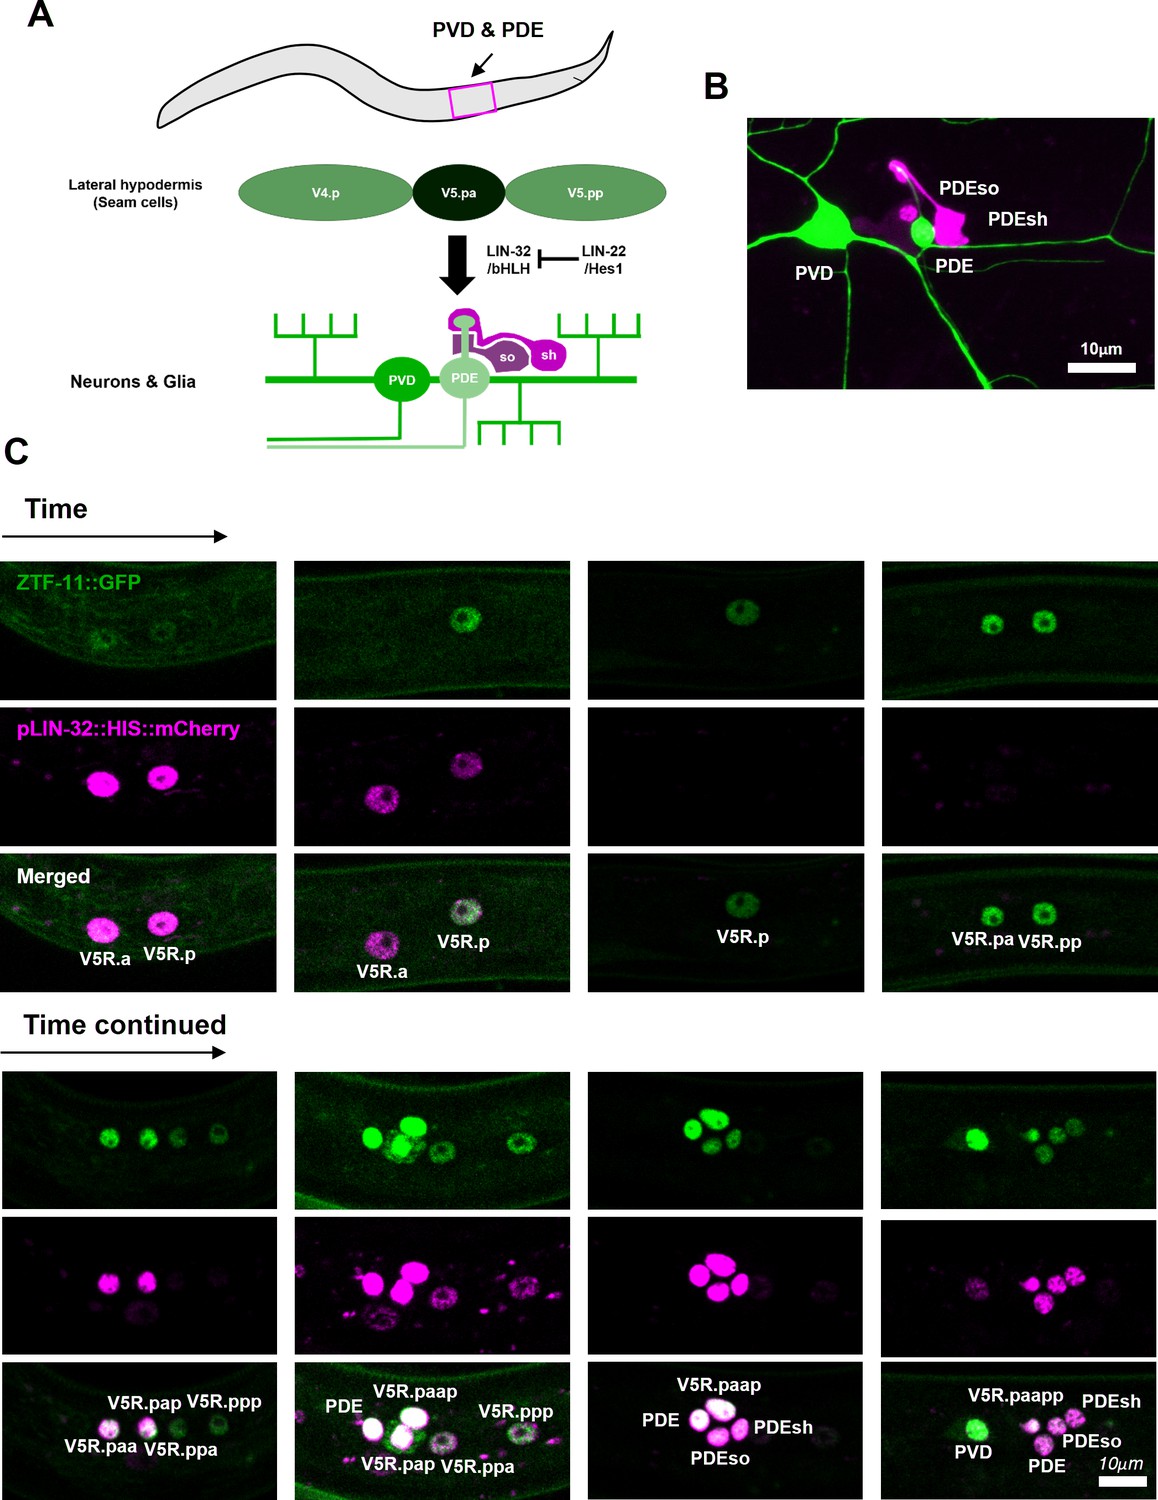
ZTF-11 functions in an epithelial precursor to promote development of a simple sensory organ.
(A) Schematic illustration of postdeirid development. A precursor from V5 seam cell lineage gives rise to two neurons and two glia driven by Atoh1 homolog lin-32. (B) Representative confocal image of postdeirid. Two neurons (PVD and PDE) and two glia (PDEso and PDEsh) are labeled by ser-2 (green) and ram-5 (magenta) markers, respectively. (C) Representative confocal images of postdeirid development showing every cell divisions and expression of LIN-32 and ZTF-11 in each cells.
Figure 4—figure supplement 2
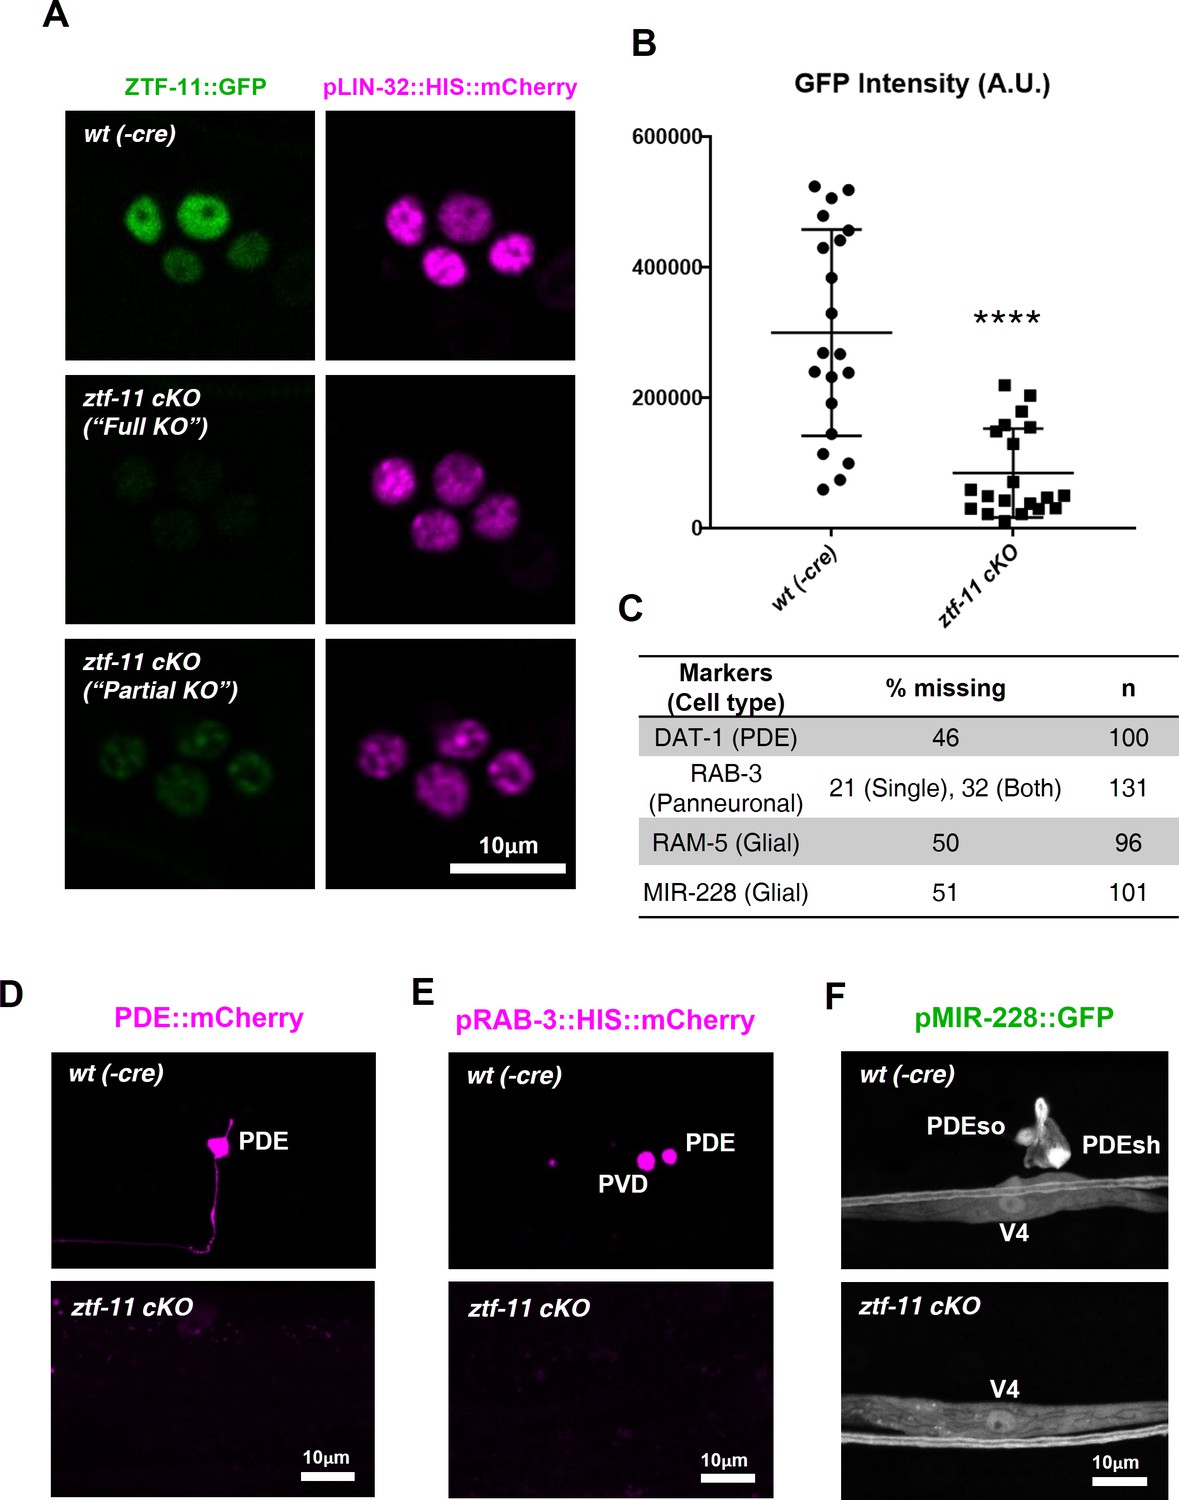
Neuronal and glial cell fates are lost in ztf-11 conditional knock-out.
(A) Representative images of ztf-11 conditional knockout by Cre-lox system. (B) Efficiency of conditional knock-out were quantified by GFP intensity in four postdeirid cells during ‘rosette stage’, composed of PDE, PDEso, PDEsh, and PVD mother cell. n = 20 each. Error bars, S.D. Student’s t-test, two tailed, ****p<0.0005 (C) Quantification of respective cell fate marker from D-F. For rab-3 marker, often only one cell lost its expression (categorized as ‘single’). (D) Representative confocal image of PDE marker, dat-1, expression in wild type (wt(-Cre)) or ztf-11 conditional knock-out (ztf-11 cKO). (E) Representative confocal image of pan-neuronal marker, rab-3, expression in wild type (wt(-Cre)) or ztf-11 conditional knock-out (ztf-11 cKO). (F) Representative confocal image of glial marker, mir-228, expression in wild type (wt(-Cre)) or ztf-11 conditional knock-out (ztf-11 cKO). Note that mir-228 expression is only lost in PDEso and PDEsh but not in seam cell V4.
Figure 5 with 1 supplement
ZTF-11 is sufficient to generate neurons from epithelial cells by repressing epithelial identity.
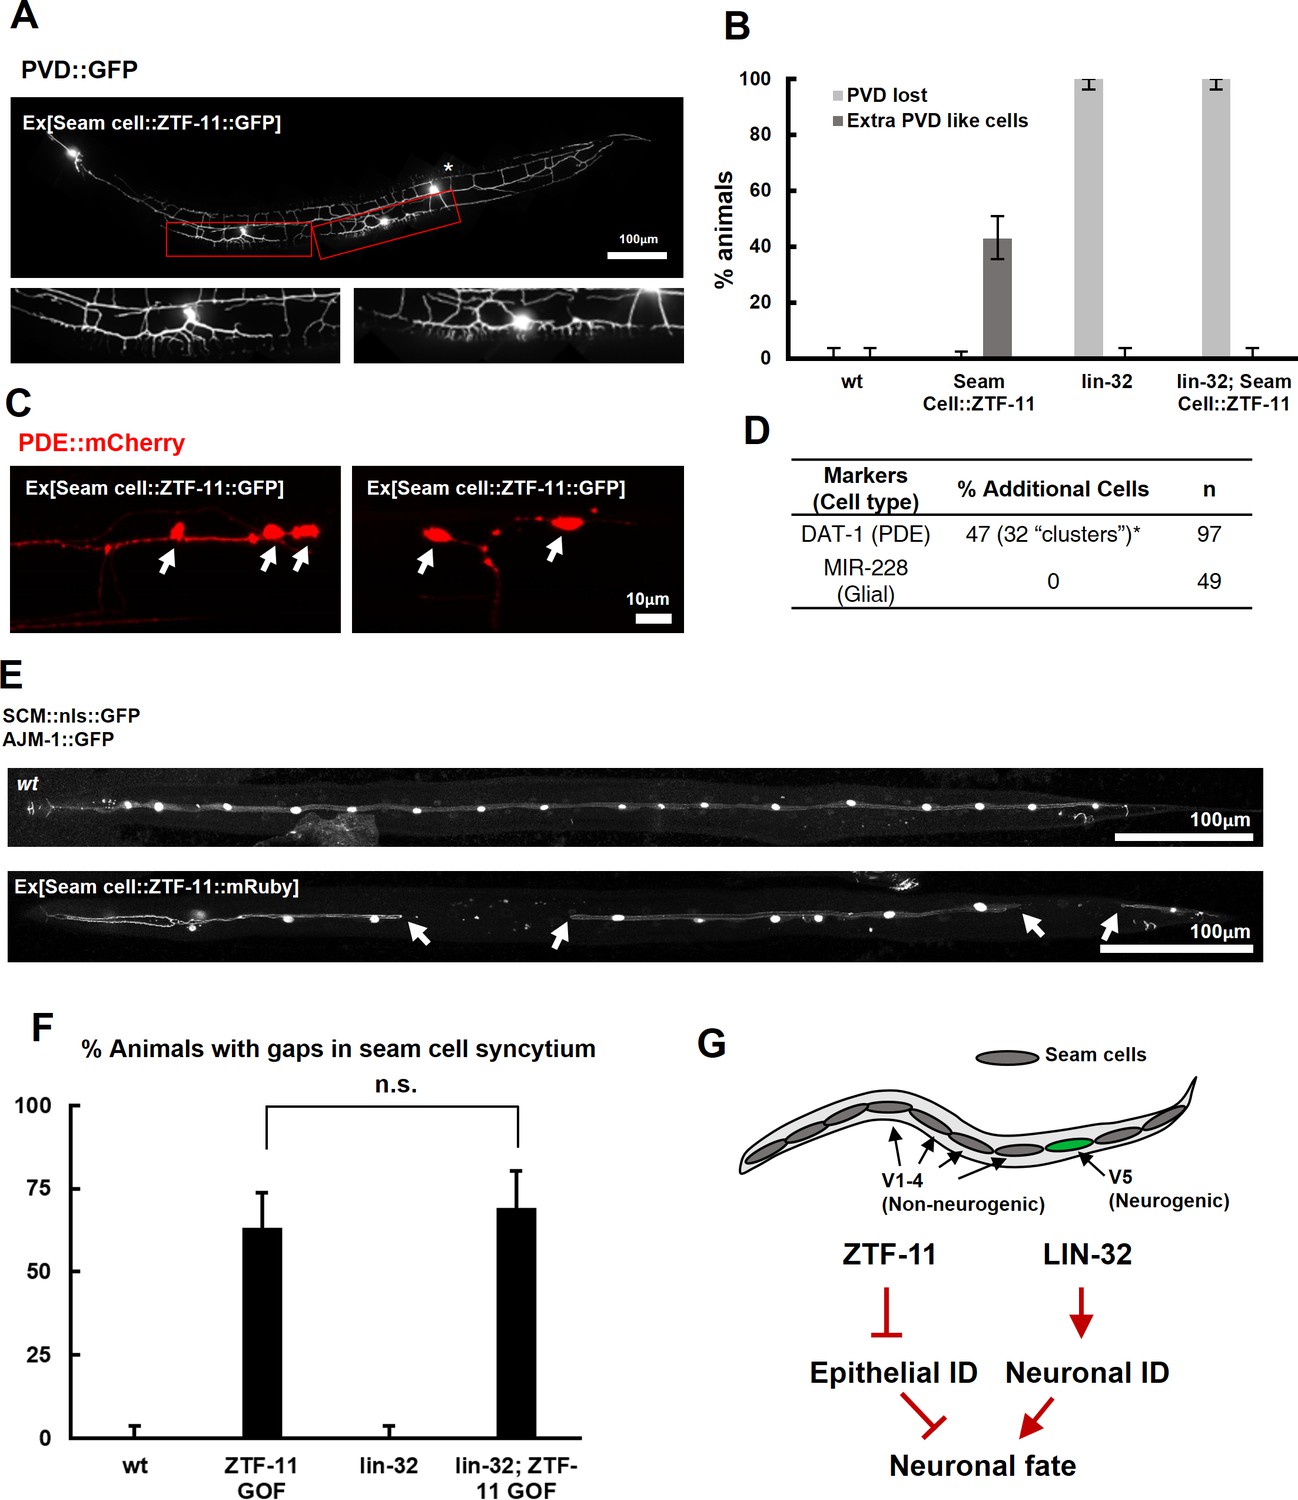
(A) Representative confocal image showing proneural activity of ZTF-11. ZTF-11 was expressed in seam cells resulting in epithelial seam cell lineages to produce PVD neuron-like cells. Red boxes, ZTF-11-induced PVD-like cells, zoomed in below images. Star, wild type PVD cell body. (B) Quantification of ZTF-11 proneural activity in wild type (wt) or lin-32 (u282) genetic background. n = 100, 158, 100, 100, respectively. Error bars are 95% Wilson-Brown C.I. See Figure 5—source data 1 for numerical data. (C) Confocal images of ZTF-11 induced PDE-like cells (white arrows) from epithelial seam cell images. ‘Clusters’ multiple PDE-like cells were often found in close proximity (>100 μm). (D) Quantification of ZTF-11 proneural or proglial activities based on PDE marker or glial markers. (E) Representative confocal images showing seam cell identity repression by ZTF-11. ZTF-11 was expressed in seam cells resulting in repression of seam cell identities. Number of SCM-positive seam cell nuclei was reduced. Gaps in seam cell syncytium are visible with apical junction marker, ajm-1. (F) Quantification of seam cell syncytium gaps in wild type (wt) or lin-32 (u282) genetic backgrounds. Error bars are 95% Wilson-Brown C.I. n = 100, 111, 100, 93, respectively. n.s., p>0.05, binomial test. See Figure 5—source data 2 for numerical data. (G) ZTF-11 and LIN-32 function in parallel to repress epithelial identity and activate neuronal identity in V5 lineage to produce postdeirid cells.
-
Figure 5—source data 1
Number of counted animals of each genotype with associated phenotypes.
- https://doi.org/10.7554/eLife.46703.020
-
Figure 5—source data 2
Number of counted animals of each genotype with associated phenotypes.
- https://doi.org/10.7554/eLife.46703.021
-
Figure 5—source data 3
Raw counts of cells counted with associated phenotypes.
- https://doi.org/10.7554/eLife.46703.022
Figure 5—figure supplement 1

ZTF-11-induced ectopic neurons, but not non-neuronal cells, express LIN-32.
(A) Expression of LIN-32 transcriptional reporter in ZTF-11-induced ectopic neurons. Ectopic neurons were defined as ectopic PVD::GFP expressing cells extending neurite-like processes as shown here. Arrows, LIN-32-positive ectopic neuronal nuclei. (B) Expression of LIN-32 transcriptional reporter in ZTF-11-expressing non-neuronal cells. ZTF-11-expressing non-neuronal cells were defined as cells expressing nuclear ZTF-11::GFP but not PVD::GFP marker. Arrowhead, non-neuronal ZTF-11::GFP-expressing cell. Asterisk, dendrite from PVD, note that this PVD::GFP-labeled neurite is not emanating from the non-neuronal cell. (C) Quantification of LIN-32 expressing cells in ectopic neurons (A) or non-neuronal cells (B). n = 26, 56 cells, respectively. Error bars, 95% Wilson-Brown C.I. Binomial test, ****p<0.0001. See Figure 5—source data 3 for numerical data.
Figure 6
ZTF-11 is required for generating postembryonic neurons from multiple neuroectoblast lineages.
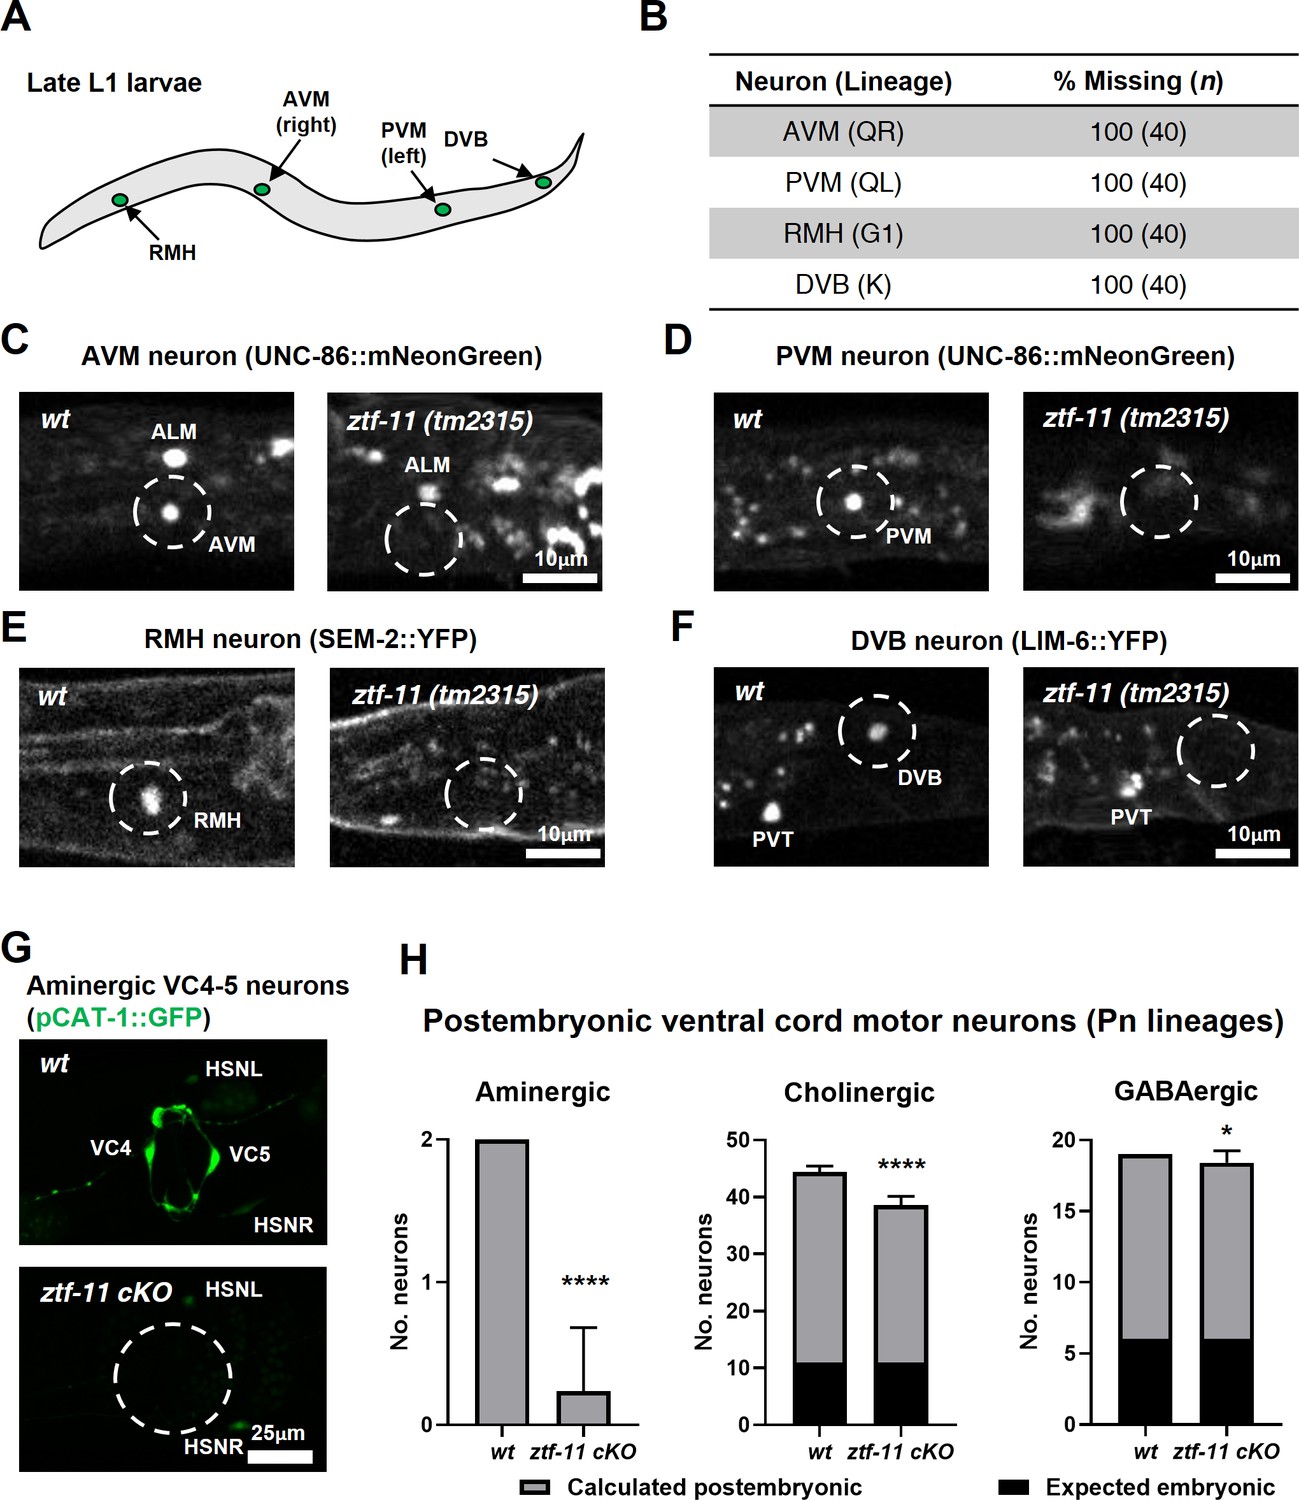
(A) Locations of postembryonic neurons born during L1 larval development that were analyzed for this study. (B) Quantification of missing postembryonic neuron fate markers in ztf-11(tm2315) null mutants. Animals were synchronized to late L1 by bleaching and then fed for 20 hr prior to analyzing expression of respective cell fate markers (UNC-86::mNeonGreen for AVM and PVM, SEM-2::YFP for RMH, and LIM-6::YFP for DVB). (C) Expression of AVM marker, UNC-86, in late L1 animals of wild type or ztf-11(tm2315) null mutant. Dashed circle indicates the location of AVM neuron. Note that ALM, an embryonic neuron, is still generated in ztf-11(tm2315). (D) Expression of PVM marker, UNC-86, in late L1 animals of wild type or ztf-11(tm2315) null mutant. Dashed circle indicates the location of PVM neuron. (E) Expression of RMH marker, SEM-2, in late L1 animals of wild type or ztf-11(tm2315) null mutant. Dashed circle indicates the location of RMH neuron. (F) Expression of DVB marker, LIM-6, in late L1 animals of wild type or ztf-11(tm2315) null mutant. Dashed circle indicates the location of DVB neuron. Note that PVT, an embryonic neuron, is still generated in ztf-11(tm2315). (G) Expression of aminergic neuron marker, CAT-1, that labels VC4 and VC5 postembryonic serotonergic neurons in wild type or ztf-11 conditional knock-out (ztf-11 cKO) animals. (H) Quantification of numbers of ventral cord motor neurons by neurotransmitter types. Neurons were counted based on markers of respective neurotransmitter types. Aminergic neurons, pCAT-1::GFP expressing cells (postembryonic: VC4-5 (two neurons)). Cholinergic neurons, pUNC-17::GFP expressing cells (postembryonic: VA2-11, VB3-11, AS2-10, and VC1-6 (34 neurons), embryonic: DA2-7 and DB3-7 (11 neurons)). GABAergic neurons, pUNC-47::GFP expressing cells (postembryonic: VD1-13 (13 neurons), embryonic DD1-6 (six neurons)). All postembryonic ventral cord motor neurons are generated from Pn lineages. As ztf-11 was conditionally knocked-out in Pn lineages, any lost neurons were expected to be postembryonic (gray bars) rather than embryonic (black bars). Error bars are SD. ****p<0.0001, *p<0.05, Student’s t-test two-tailed, n = 40, 119, respectively for aminergic neurons, 22, 61, respectively for cholinergic neurons, 20, 53 animals, respectively for cholinergic neurons. See Figure 6—source data 1 for numerical data.
-
Figure 6—source data 1
Raw counts of neurons expressing respective neurotransmitter markers in wild-type (-cre) or ztf-11 cKO animals.
- https://doi.org/10.7554/eLife.46703.024
Figure 7 with 1 supplement
ZTF-11 is mostly dispensable for embryonic neurogenesis.
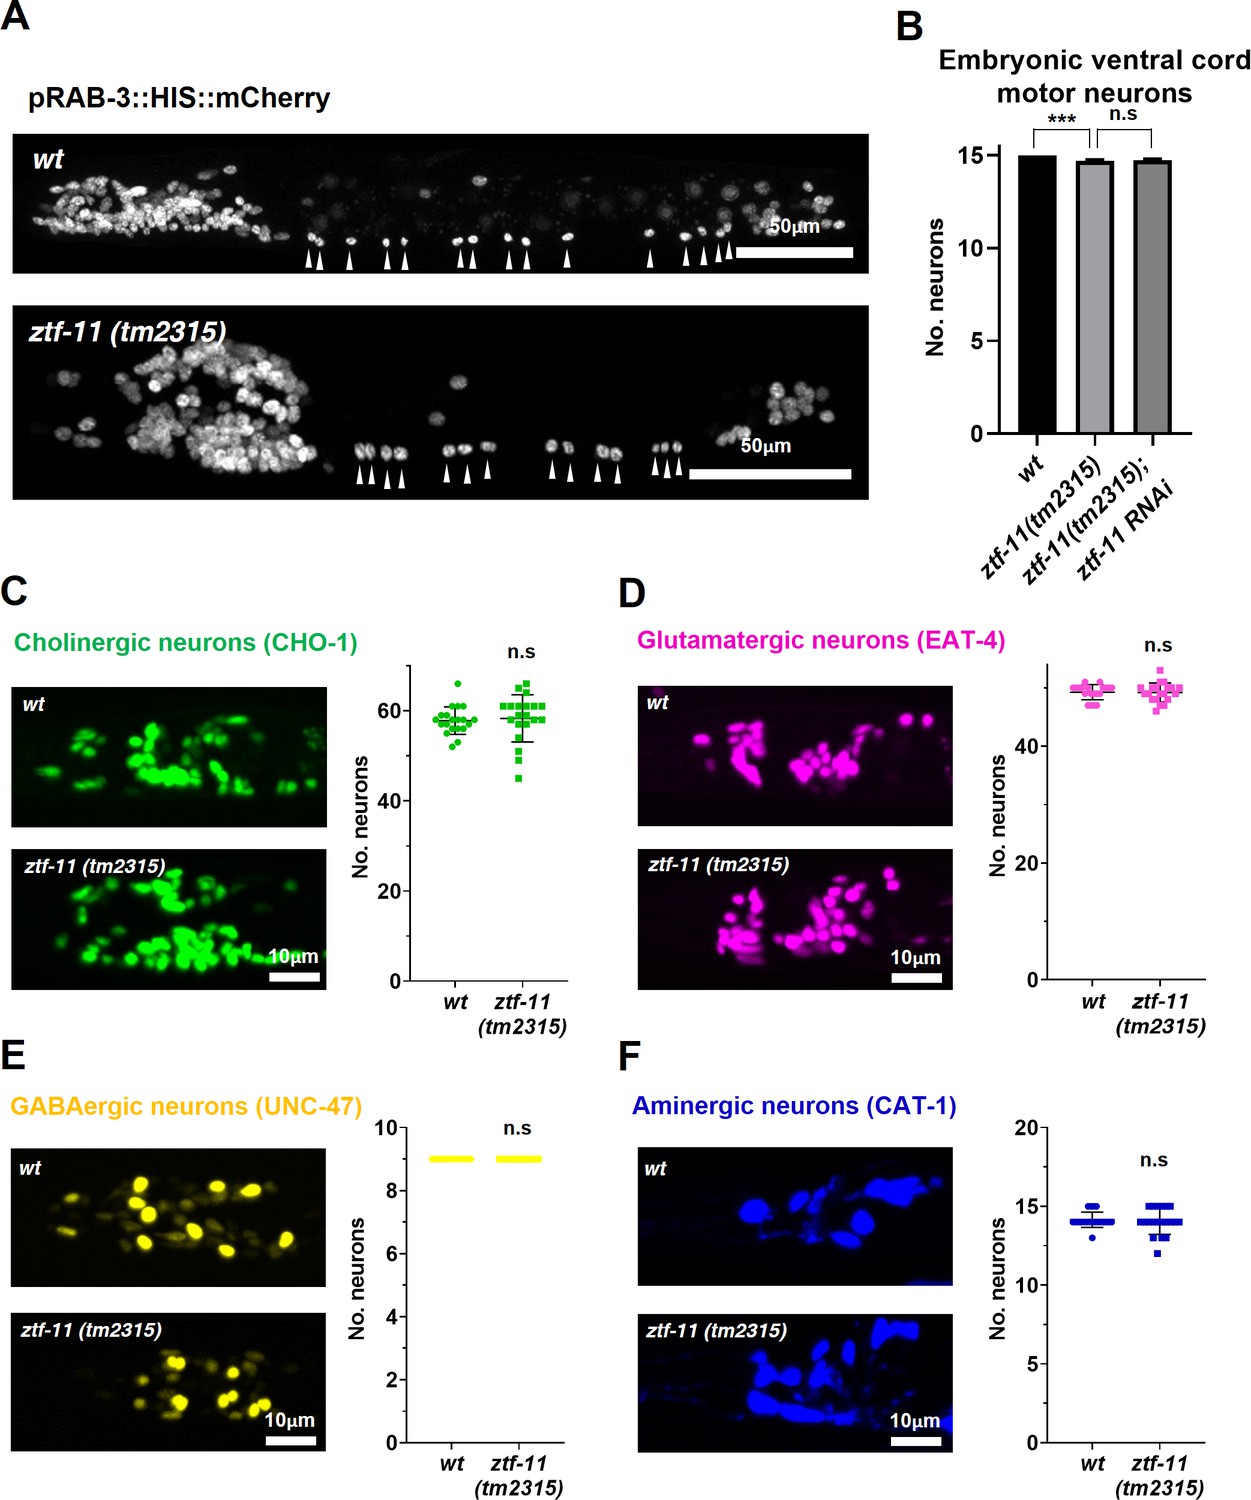
(A) Pan-neuronal marker expression in wild type and ztf-11(tm2315) L1 larva. Arrowheads point to embryonic ventral cord motor neurons. (B) Number of embryonic ventral cord motor neurons is slightly reduced in ztf-11(tm2315) or ztf-11(tm2315) further treated with feeding RNAi against maternal ZTF-11. Neurons were counted based on pan-neuronal RAB-3 marker expression. Error bars are SD. ****p<0.0001, n.s, p>0.05 Student’s t-test two-tailed, n = 79, 80, 50 animals respectively. See Figure 7—source data 1 for numerical data. (C) ZTF-11 is mostly dispensable for embryonic cholinergic neurons in the head. Left, expression of cholinergic neuron marker, CHO-1, in wild type or ztf-11(tm2315). Right, quantification of counted CHO-1-expressing neurons. (D) ZTF-11 is mostly dispensable for embryonic glutamatergic neurons in the head. Left, expression of glutamatergic neuron marker, EAT-4, in wild type or ztf-11(tm2315). Right, quantification of counted EAT-4-expressing neurons. (E) ZTF-11 is mostly dispensable for embryonic GABAergic neurons in the head. Left, expression of GABAergic neuron marker, UNC-47, in wild type or ztf-11(tm2315). Right, quantification of counted UNC47-expressing neurons. (F) ZTF-11 is mostly dispensable for embryonic aminergic neurons in the head. Left, expression of aminergic neuron marker, CAT-1, in wild type or ztf-11(tm2315). Right, quantification of counted CAT-1-expressing neurons. RIH neuron was very weakly labeled by CAT-1 and only occasionally counted. (C–F) Synchronized early L1 animals by bleaching were used for experiments. Error bars are SD. n.s, p>0.05 Student’s t-test two-tailed, n = 20 animals each. See Figure 7—source data 2 for numerical data.
-
Figure 7—source data 1
Raw counts of RAB-3 expressing nuclei in animals of each genotypes.
- https://doi.org/10.7554/eLife.46703.027
-
Figure 7—source data 2
Raw counts of nuclei expressing respective neurotransmitter markers in wild-type or ztf-11(tm2315) animals.
- https://doi.org/10.7554/eLife.46703.028
-
Figure 7—source data 3
Raw counts of thrashes exhibited by animals of each genotypes.
- https://doi.org/10.7554/eLife.46703.029
Figure 7—figure supplement 1
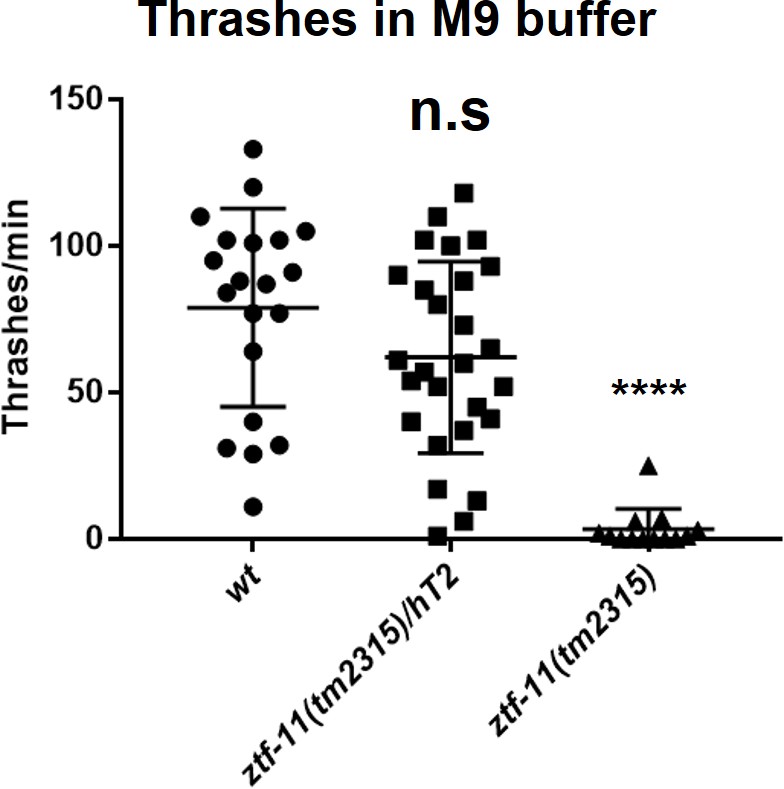
Embryonic ZTF-11 is required for coordinated motility.
Quantification of thrashing assay. Each alternate ‘C’ bends were counted as a thrashing motion. n = 20, 27, 13, respectively, Student’s two-tailed t-test, n.s., p>0.05. ****p<0.0001. See Figure 7—source data 3 for numerical data.
Figure 8
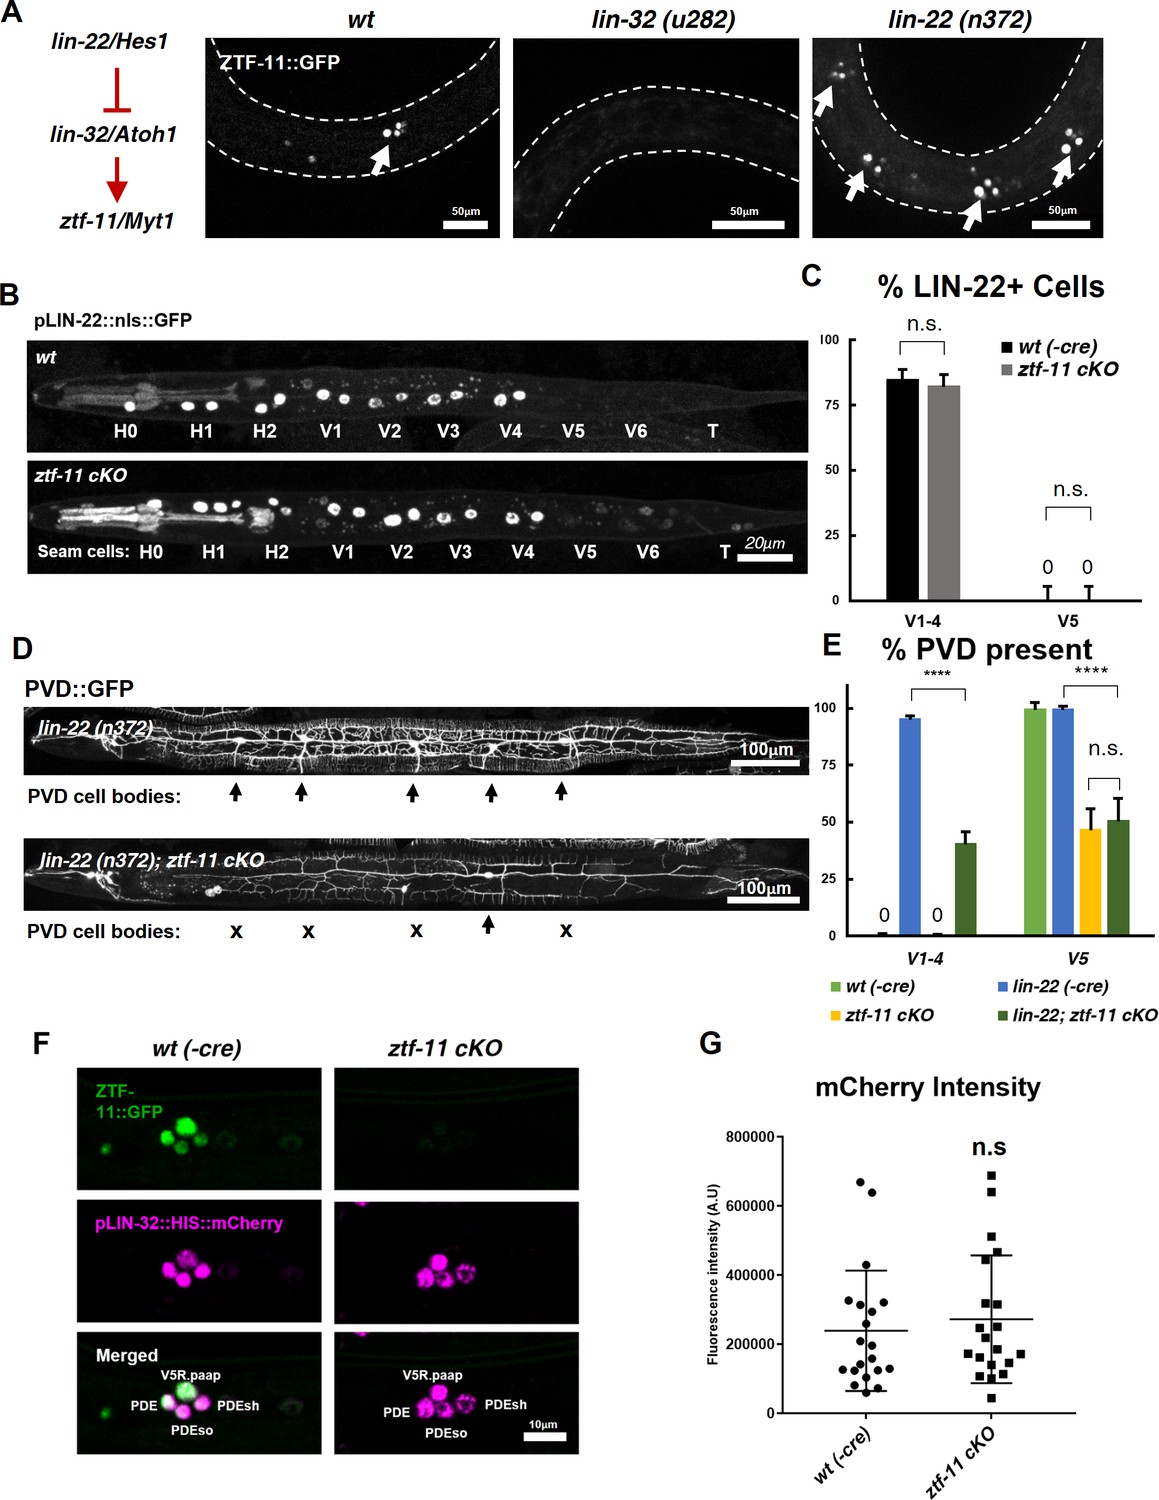
ZTF-11 does not function by repressing lin-22/Hes1.
(A) ztf-11 functions downstream of postdeirid development genes lin-22 and lin-32. Right, representative images of ZTF-11::GFP expression during postdeirid neurogenesis in wild type, lin-32, or lin-22 mutants. (B) lin-22 transcriptional reporter expression in wild type and ztf-11 cKO early L2 larvae. LIN-22 is expressed in lateral seam cells but excluded from three posterior seam cells (V5, V6, and T) Pharyngeal staining is bleed through from co-injection marker pMYO-2::mCherry. (C) Quantification of pLIN-22::GFP-positive seam cells in b. n = 66–68 animals each. Error bars, 95% Wilson-Brown C.I. Fischer’s exact test n.s, p>0.05. See Figure 7—source data 1 for numerical data. (D) ztf-11 cKO is epistatic to lin-22(n372), suggesting that ZTF-11 is unlikely to function through repressing LIN-22. lin-22(n372) results in duplication of postdeirid lineage in V1-4, resulting in five postdeirid on each side. In ztf-11 cKO lin-22(n372) double mutant, some of four additional postdeirid as well as wild type V5 postdeirid, are lost. (E) Quantification of PVD::GFP-positive cells from d. Parent seam cell lineage for each PVD::GFP positive cells were inferred from position along AP axis. n = 100–101 animals each. Error bars, 95% Wilson-Brown C.I. Fischer’s exact test, ****p<0.0001. n.s., p>0.05. See Figure 7—source data 2 for numerical data. (F) lin-32 transcriptional marker expression in wild type and ztf-11 cKO. (G) Quantification of lin-32 transcriptional activity. pLIN-32::HIS::mCherry fluorescence intensity was scored. n = 20 animals each. Error bars, S.D. Student’s t-test two-tailed, n.s, p>0.05. See Figure 7—source data 3 for numerical data.
-
Figure 8—source data 1
Raw counts of LIN-22 expression in V cells in wild-type of ztf-11 cKO animals.
- https://doi.org/10.7554/eLife.46703.031
-
Figure 8—source data 2
Raw counts of PVD or PVD-like cells in animals of each genotype.
- https://doi.org/10.7554/eLife.46703.032
-
Figure 8—source data 3
Raw fluorescence intensity values of LIN-32 transcriptional reporter in wild-type(-Cre) or ztf-11 cKO animals.
- https://doi.org/10.7554/eLife.46703.033
Figure 9
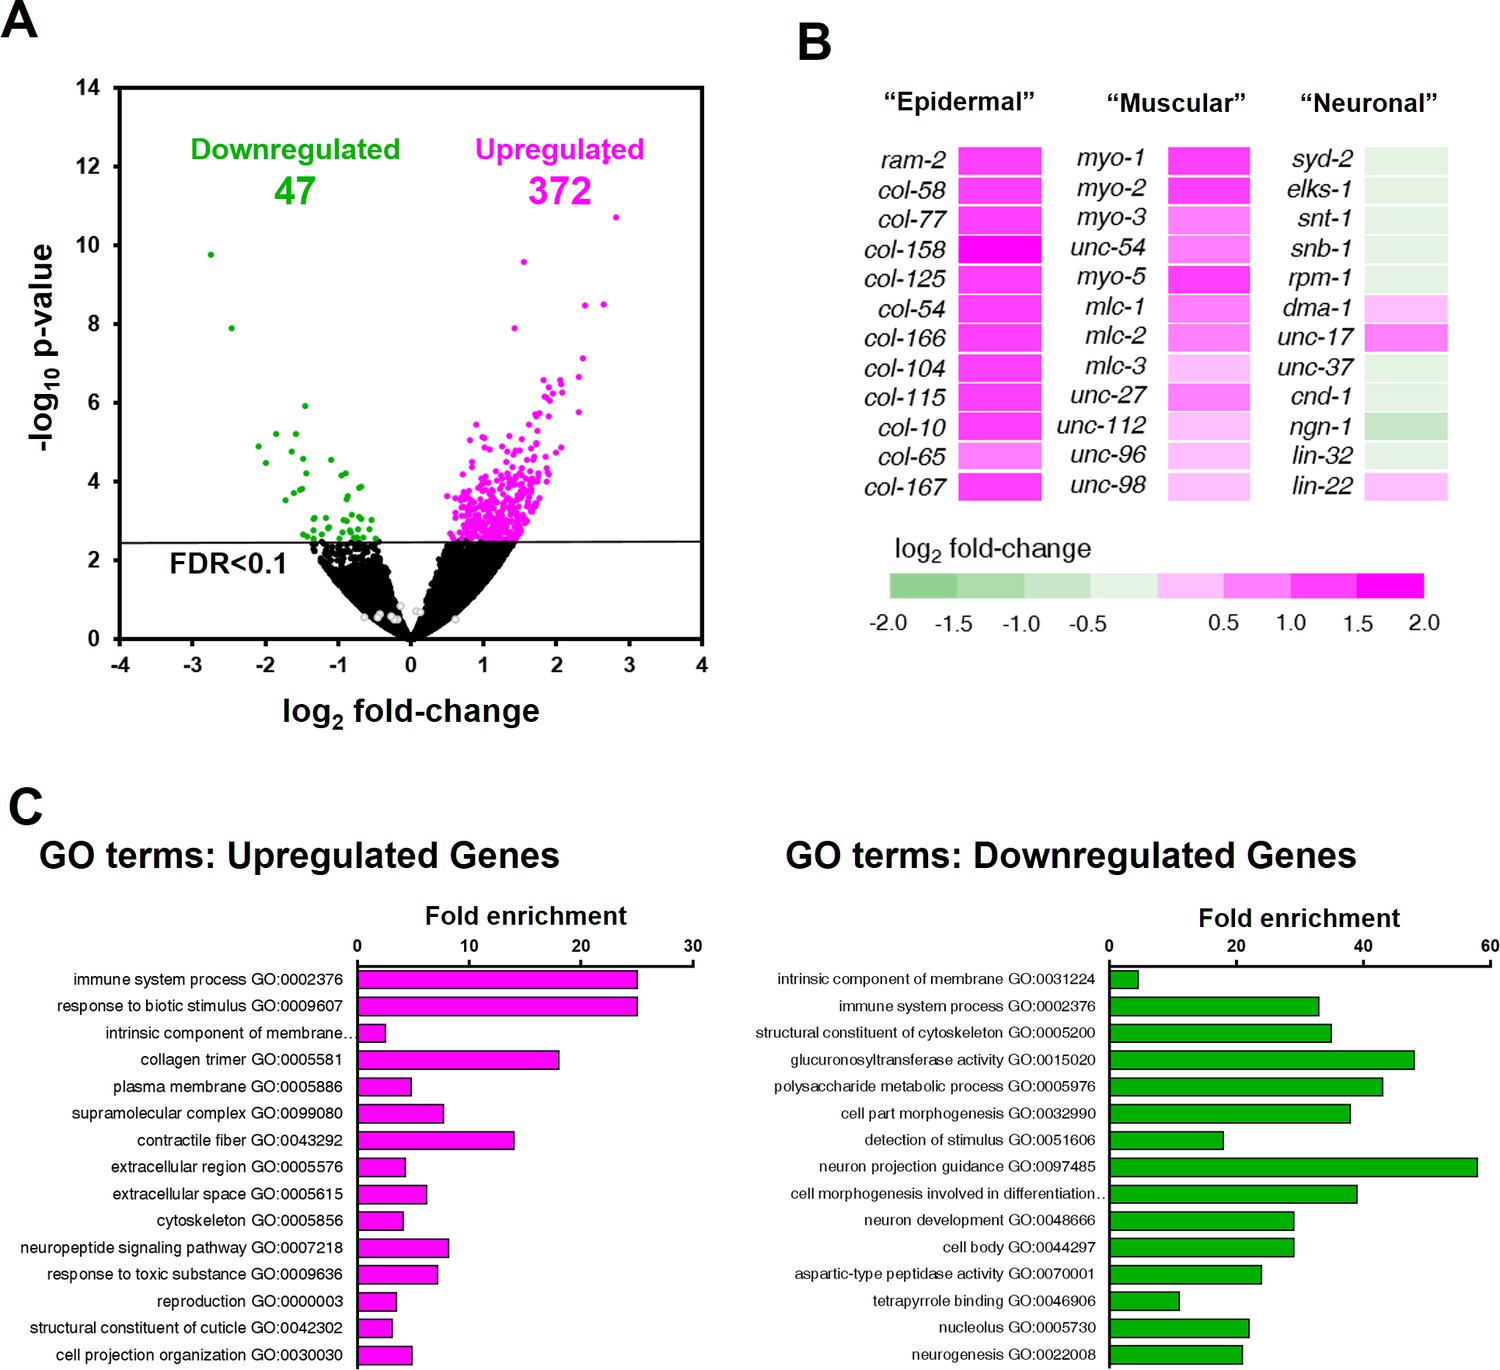
ZTF-11 negatively regulates non-neuronal genes.
(A) Volcano plot of differentially expressed genes in ztf-11-depleted embryos. Whole embryos treated with RNAi against ztf-11 or control vector were used for the experiments. Numbers, number of genes that were significantly (FDR < 0.1) upregulated (magenta) or downregulated (green). Selected neuronal genes from (B) are shown as gray circles. See Supplementary file 2 for full list of differentially expressed genes. (B) Heat map showing expression level changes in selected cell-type identity markers. Epidermal identity genes were curated from among the significantly changed collagen genes. Muscle (sarcomere) and neuronal identity genes were chosen blind to the fold changes. (C) GO-term enrichment analysis using gene sets of significantly upregulated (magenta) or downregulated (green) transcripts. Note that epidermal (collagen trimer, structural component of cuticle) and muscular (contractile fiber) terms are enriched in upregulated gene set. See Supplementary file 2 for full list of enriched GO-terms.
Figure 10 with 1 supplement
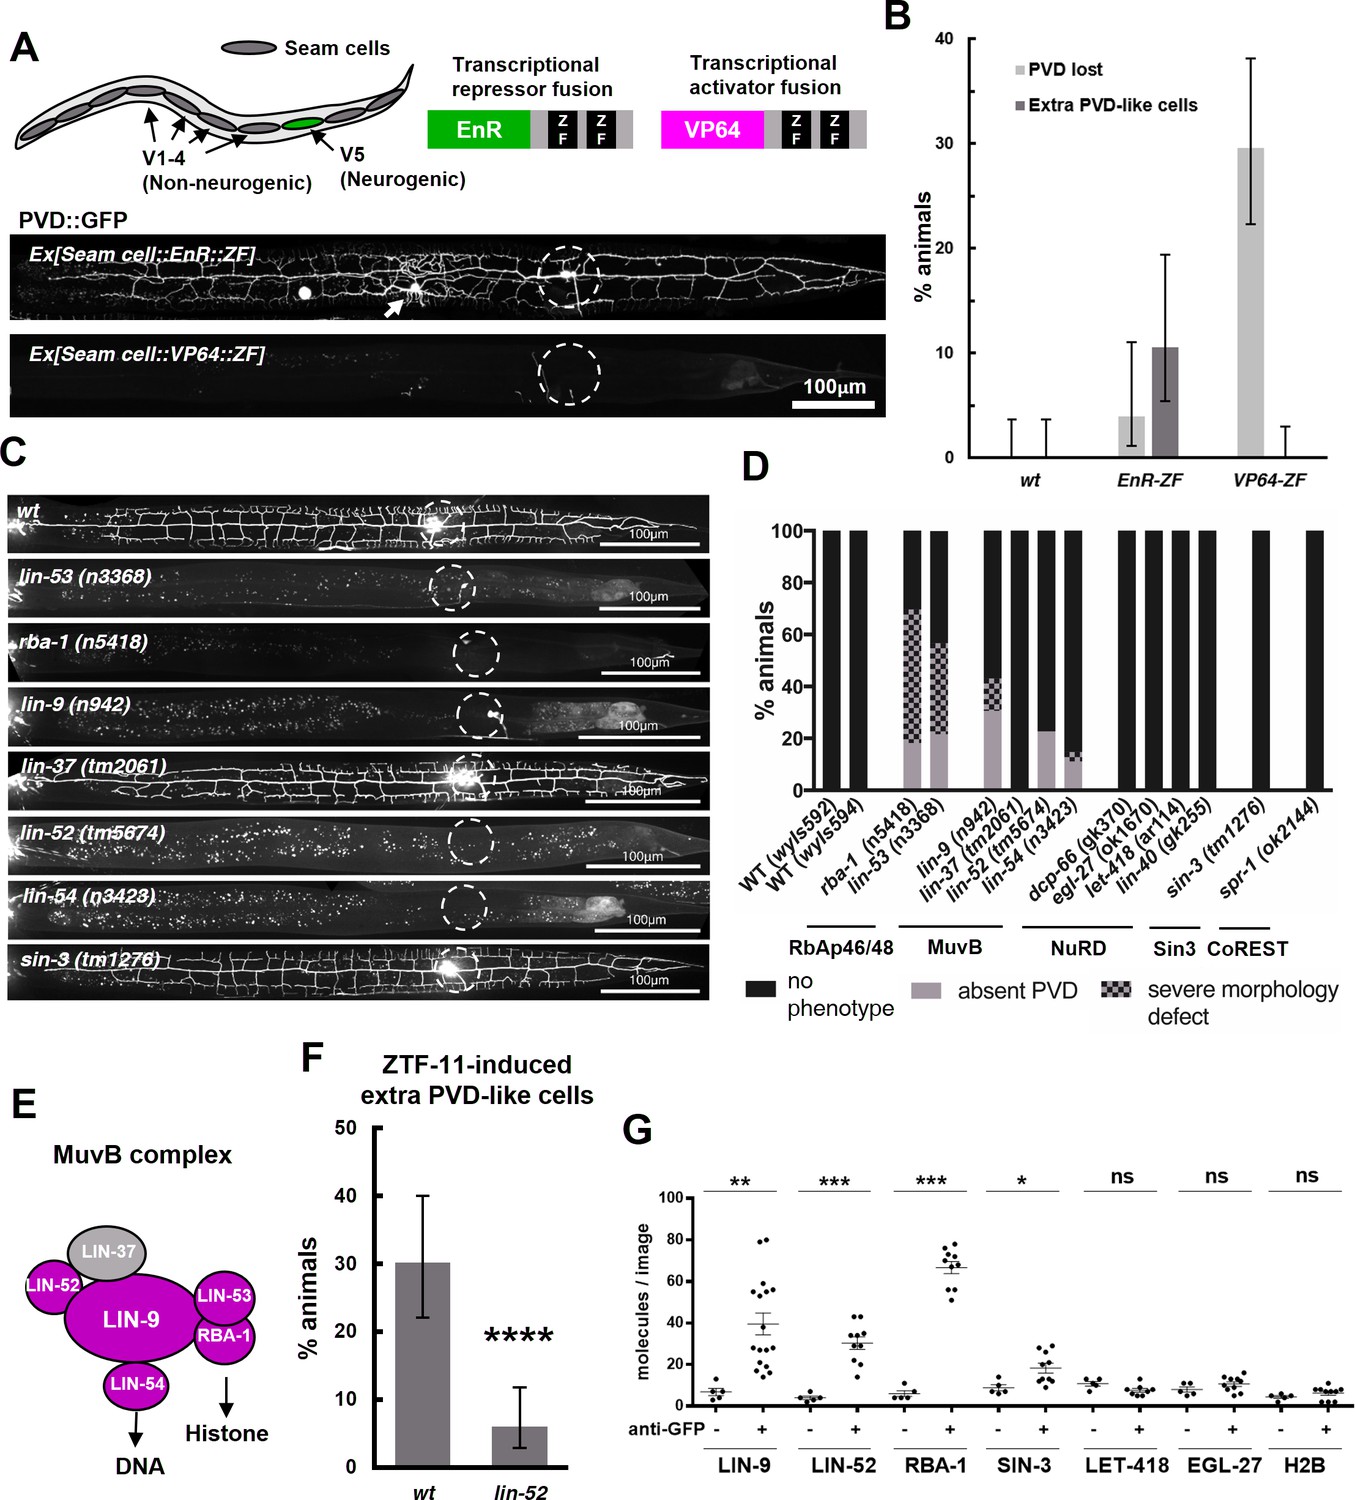
ZTF-11 functions with the MuvB co-repressor complex.
(A) Top, schematic diagram of the experiment. Transcriptional repressor (EnR-ZF) or activator (VP64-ZF) fusion proteins were expressed in both neurogenic V5 and non-neurogenic V1-4 seam cells. Bottom, representative confocal images showing extra PVD-like cells generated with EnR-ZF expression or loss of PVD generated with VP64-ZF expression. (B) Quantification of respective fusion protein overexpression phenotypes. Error bars are 95% Wilson-Brown C.I. n = 100, 76, 125 for wt, EnR-ZF, VP64-ZF, respectively. See Figure 10—source data 1 for numerical data. (C) Representative confocal images showing postdeirid neurogenesis phenotypes in wild type, MuvB, or Sin3 co-repressor complex mutants. (D) Quantifications of PVD neurogenesis defects of MuvB, Sin3, NuRD, or CoRest co-repressor complexes. n = 27–117. (E) Schematic diagram of core components of MuvB complex. Genes required for postdeirid neurogenesis are colored in magenta. See also Figure 10—figure supplement 1 for fly and human orthologs. (F) Proneural activity of ztf-11 requires MuvB gene lin-52. ZTF-11 was ectopically expressed in seam cells in wild type (N2) or lin-52(tm5674) backgrounds and transgenic animals were scored for presence of ectopic PVD-like cells. Error bars are 95% Wilson-Brown C.I. n = 96, 117, respectively. Binomial test, ****p<0.0001. See Figure 10—source data 2 for numerical data. (G) SiMPull experiment shows binding of MuvB complex components to ZTF-11. Error bars, S.E.M. n = 5–17 each. Student’s t-test two-tailed *p<0.05, **p<0.005, ***p<0.0005. See Figure 10—source data 3 for numerical data.
-
Figure 10—source data 1
Number of animals with associated phenotypes in wild-type or transgenic lines expressing transcriptional repressor (EnR-ZF) or activator (VP64-ZF) fusion proteins.
- https://doi.org/10.7554/eLife.46703.037
-
Figure 10—source data 2
Number of counted animals of each genotype with associated phenotypes.
- https://doi.org/10.7554/eLife.46703.038
-
Figure 10—source data 3
Number of mCherry-tagged corepressor molecules in each raw images.
- https://doi.org/10.7554/eLife.46703.039
Figure 10—figure supplement 1
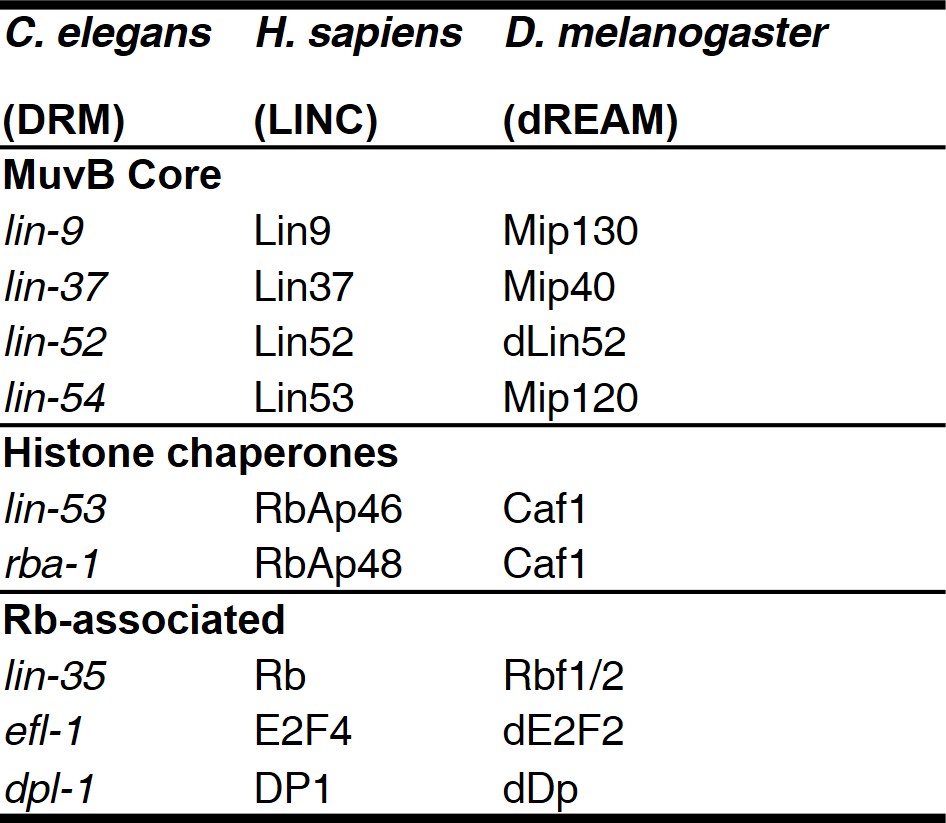
MuvB complex genes and their homologs in model organisms.
https://doi.org/10.7554/eLife.46703.036Videos
Video 1
ZTF-11 expression in developing C. elegans embryo.
https://doi.org/10.7554/eLife.46703.006Tables
Key resources table
| Reagent type (species) or resource | Designation | Source or reference | Identifiers | Additional information |
|---|---|---|---|---|
| Gene (Caenorhabditis elegans) | ztf-11 | NA | Wormbase gene: WBGene00009939 | |
| Strain, strain background (C. elegans) | N2 | C. elegans Genetic Center (CGC) | Wild type strain | |
| Genetic reagent (C. elegans) | ztf-11(tm2315) | National Bioresource Project (Dr. Shohei Mitani) | ||
| Genetic reagent (C. elegans) | lin-32(u282) | C. elegans Genetic Center (CGC) | ||
| Genetic reagent (C. elegans) | lin-22(n372) | C. elegans Genetic Center (CGC) | ||
| Genetic reagent (C. elegans) | lin-52(tm5674) | National Bioresource Project (Dr. Shohei Mitani) | ||
| Genetic reagent (C. elegans) | ztf-11(wy1077) | This study | ZTF-11::GFP endogenous knock-in | |
| Genetic reagent (C. elegans) | ztf-11(wy1088) | This study | Floxed ztf-11 allele | |
| Genetic reagent (C. elegans) | ztf-11(wy1100) | This study | Floxed ztf-11::gfp allele | |
| Genetic reagent (C. elegans) | lin-9(wy1224) | This study | mCherry::LIN-9 endogenous knock-in | |
| Genetic reagent (C. elegans) | lin-52(wy1225) | This study | LIN-52::mCherry endogenous knock-in | |
| Genetic reagent (C. elegans) | rba-1(wy1212) | This study | RBA-1::mCherry endogenous knock-in | |
| Genetic reagent (C. elegans) | sin-3(wy1210) | This study | SIN-3::mCherry endogenous knock-in | |
| Genetic reagent (C. elegans) | let-418(wy1215) | This study | LET-418::mCherry endogenous knock-in | |
| Genetic reagent (C. elegans) | egl-27(wy1207) | This study | EGL-27::mCherry endogenous knock-in | |
| Transfected construct (E. coli HT115 (DE3)) | Feeding RNAi clone against ztf-11 | Dr. Julie Ahringer, Source BioScience | RRID:SCR_017064 | Primer pair number: 1528 |
| Antibody | anti-GFP, biotin conjugated (Rabbit polyclonal) | Rockland Immunochemicals | Rockland Cat# 600-406-215, RRID:AB_828168 | |
| Recombinant DNA reagent | pnhr-81::ztf-11::GFP | This paper | ZTF-11 seam cell gain of function | |
| Recombinant DNA reagent | pnhr-81::ztf-11::mRuby3 | This paper | ZTF-11 seam cell gain of function (used in conjunction with seam cell markers) | |
| Recombinant DNA reagent | pztf-11::his::mCherry | This paper | ztf-11 transcriptional reporter | |
| Recombinant DNA reagent | pztf-11::his::GFP | This paper | ztf-11 transcriptional reporter | |
| Recombinant DNA reagent | pztf-11::his::GFP(-Ebox) | This paper | E-box mutated ztf-11 transcriptional reporter | |
| Recombinant DNA reagent | pegl-26::Cre | This paper | Rectal epithelial Cre | |
| Recombinant DNA reagent | pnhr-81::Cre | This paper | Seam cell Cre | |
| Recombinant DNA reagent | pnhr-81::vp64::ztf-11(217-360) | This paper | Transcriptional activator fusion | |
| Recombinant DNA reagent | pnhr-81::EnR::ztf-11(217-360) | This paper | Transcriptional repressor fusion | |
| Commercial assay or kit | RNeasy Plus Micro Kit | Qiagen | Cat#: 74034 | |
| Commercial assay or kit | QiaShredder | Qiagen | Cat#: 79654 | |
| Chemical compound, drug | Chymotrypsin | Sigma Aldrich | Cat#: CHY5S | |
| Chemical compound, drug | Chitinase | Sigma Aldrich | Cat#: C6137 | |
| Software, algorithm | ImageJ | NIH | RRID:SCR_003070 | |
| Software, algorithm | GraphPad Prism | GraphPad | RRID:SCR_002798 |
Additional files
-
Supplementary file 1
Embryonic cell lineages expressing ZTF-11, up to 350-cell stage and their postmitotic identities.
- https://doi.org/10.7554/eLife.46703.040
-
Supplementary file 2
Differentially expressed genes in ztf-11 knockdown embryos.
- https://doi.org/10.7554/eLife.46703.041
-
Supplementary file 3
Strains used for this study.
- https://doi.org/10.7554/eLife.46703.042
-
Supplementary file 4
DNA constructs and oligos used for this study.
- https://doi.org/10.7554/eLife.46703.043
-
Transparent reporting form
- https://doi.org/10.7554/eLife.46703.044
Download links
A two-part list of links to download the article, or parts of the article, in various formats.
Downloads (link to download the article as PDF)
Open citations (links to open the citations from this article in various online reference manager services)
Cite this article (links to download the citations from this article in formats compatible with various reference manager tools)
A Myt1 family transcription factor defines neuronal fate by repressing non-neuronal genes
eLife 8:e46703.
https://doi.org/10.7554/eLife.46703


