CTCF confers local nucleosome resiliency after DNA replication and during mitosis
- Institut Pasteur, CNRS UMR3738, France
- Equipe Labellisée LIGUE Contre le Cancer, France
- Sorbonne Université, Collège Doctoral, France
- Institut Pasteur, CNRS UMR 3738, France
- Gladstone Institutes, United States
- University of California, San Francisco, United States
Figures
Figure 1 with 1 supplement

CTCF binding and nucleosome positioning.
(A) Representative genome snapshot (chr6:89606260–89683988; 78 kb) showing CTCF binding in blue (reads per million; RPM) and the associated NDR/NOAs in red (MPB). (B) MNase-seq (left) and MNase H3 ChIP-seq (right) V-plots (MNase fragment mid-point vs MNase fragment length) at CTCF binding sites showing +/- 1 kb surrounding CTCF motifs for fragment sizes in the range 30–250 bp. Sidebars indicate densities for fragments with midpoints (Mp) located either within 40 bp of the CTCF motif (highlighting CTCF footprints; blue), or at more than 70 bp (highlighting nucleosomal fragments; red). Top bar gives metaplots of footprints (fragment length <100 bp; blue) and nucleosomes (fragment length within 140–200 bp; red). The Y-axis represent fragment midpoints-per-billion (MPB).
Figure 1—figure supplement 1

Additional information on CTCF binding in interphase.
(A) Intersection between our CTCF peaks and published peaks from Nora et al. (2017), ENCFF508CKL, ENCFF347BWU (ENCODE Project Consortium, 2012; Davis et al., 2018), and (Pękowska et al., 2018) respectively. (B) Relationship between CTCF aggregate motif score (the sum of all FIMO motif scores within a peak) and CTCF interphase peak height (RPM), displayed as contour/heatmap (left) and violin plot of peak height for the quintiles of motif score. (C) V-plot of ATAC-seq data presented as in Figure 1B, except that color scale is square root normalized and it covers fragments in the range [30, 300] bp. Footprints calculated from fragment <150 bp, and nucleosome signal from fragments in [150, 250] bp.
Figure 2
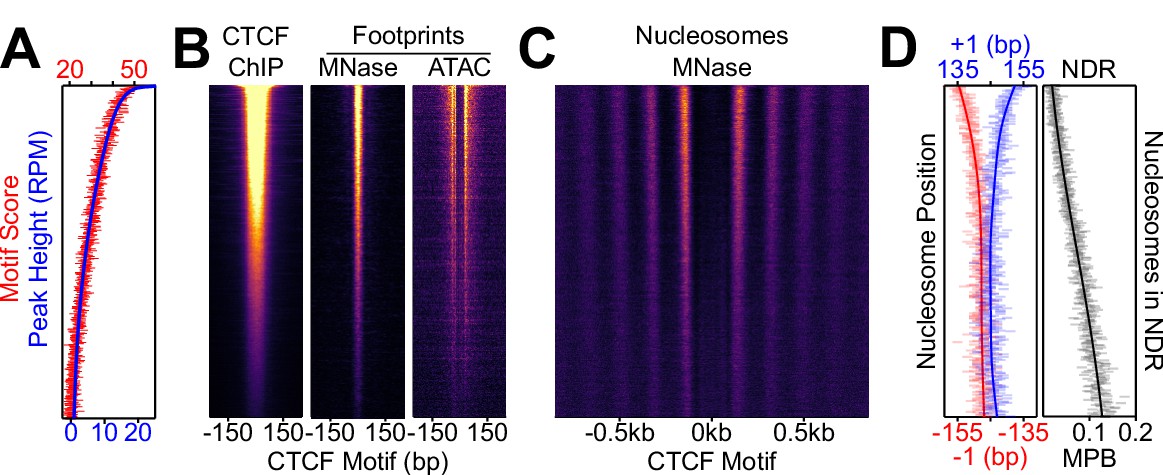
Nucleosome positioning correlates with CTCF occupancy.
CTCF binding regions were ordered by peak height descending in 100-region bins in all panels. (A) Overlaid of the aggregate of motif scores beneath each CTCF binding region (red) and the height of the corresponding CTCF peaks (blue). (B) CTCF motif-centered heatmaps for CTCF ChIP-seq and MNase/ATAC footprints. ChIP marks the midpoint of inferred ChIP fragments; MNase marks +/- 4 bp of midpoint for 1–100 bp fragments; ATAC marks cut sites of 1–150 bp fragments shifted inwards by 4 bp. (C) Heatmaps of nucleosome-sized MNase fragment midpoints (140–200 bp). (D) Quantitative analysis of the NDR. Left; the position (in bp) of the median nucleosomal signal (140–200 bp MNase-seq fragments with midpoints within +/- 70–230 bp from the motif) for the +/- 1 nucleosome (blue and red, respectively) per bin and smoothed with Gaussian process regression (line). Right; mean depth of nucleosomal fragments (MNase H3 ChIP-seq MPB; black) with midpoints in the NDR defined as +/- 80 bp centered on the motif for each bin and then smoothed with a Gaussian process regression.
Figure 3 with 1 supplement
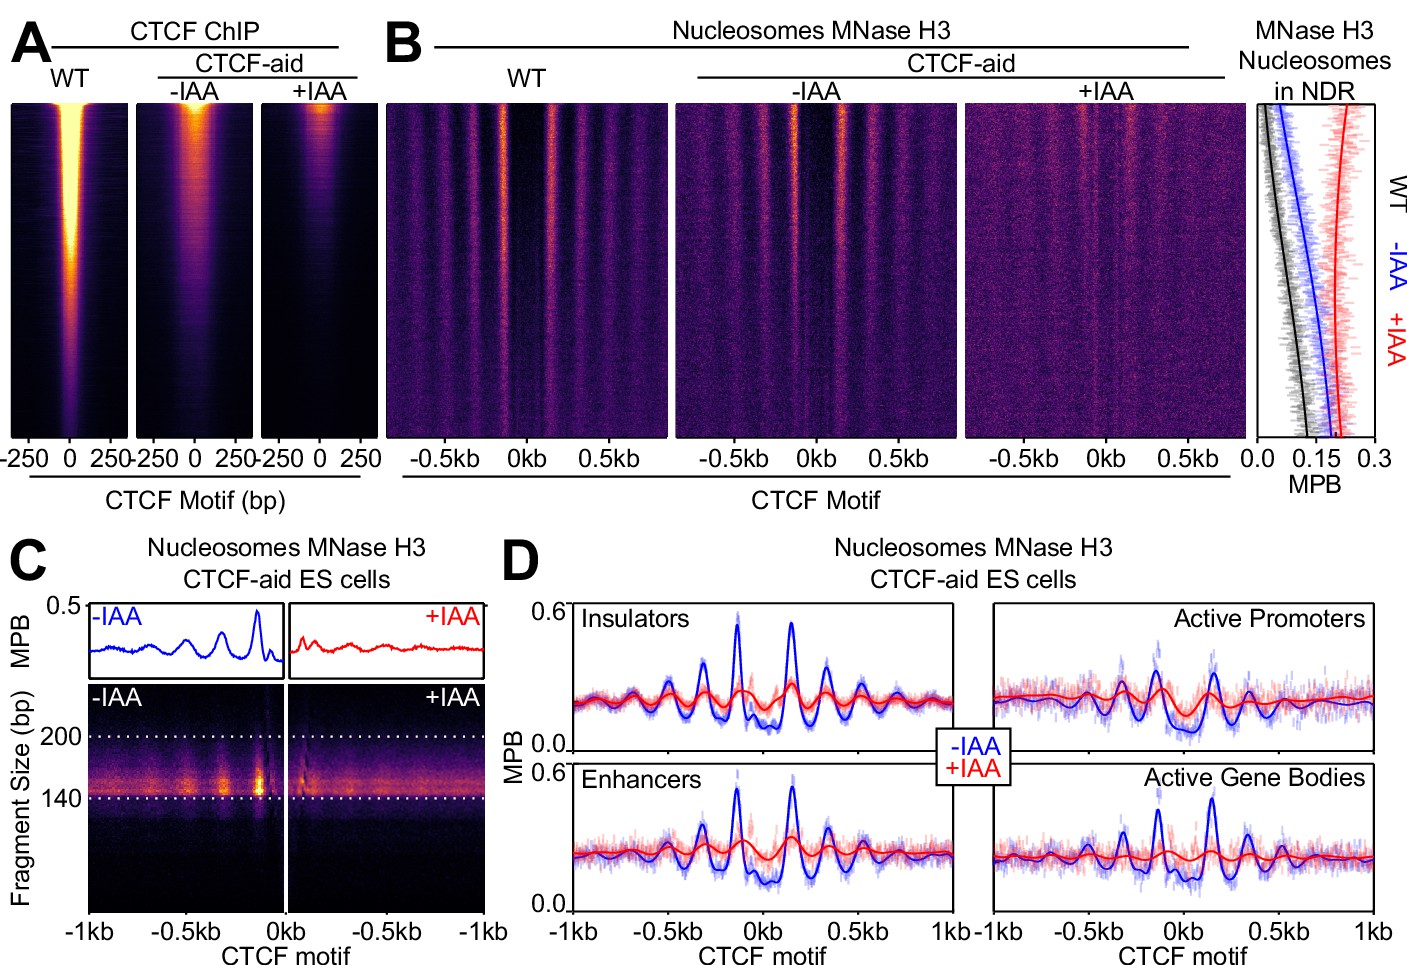
CTCF drives local nucleosome positioning.
(A) CTCF ChIP-seq in wild-type (E14Tg2a; WT) and CTCF-aid -/+ IAA (2 hr treatment) ES cells, presented as in Figure 2B and scaled to WT. (B) Nucleosome analysis as a function of CTCF binding. Left; heatmaps of nucleosomal fragments of MNase H3 ChIP-seq in WT and CTCF-aid -/+ IAA presented as in Figure 2C and scaled to WT. Right; nucleosomal signal (MBP) within the NDR (+/- 80 bp of motif) for WT (black) and CTCF-aid -/+IAA (blue and red, respectively), presented as in Figure 2D. (C) Split V-plot and corresponding metaplot of MNase H3 nucleosomal ChIP-seq signal presented as in Figure 1B for -IAA (left) and +IAA (right). (D) Metaplots of MNase H3 ChIP-seq for -IAA and +IAA centered at CTCF motifs of CTCF peaks intersecting with the indicated ChromHMM categories. Datapoints mark mean MPB per site at each base pair; lines represent Gaussian process regression.
Figure 3—figure supplement 1
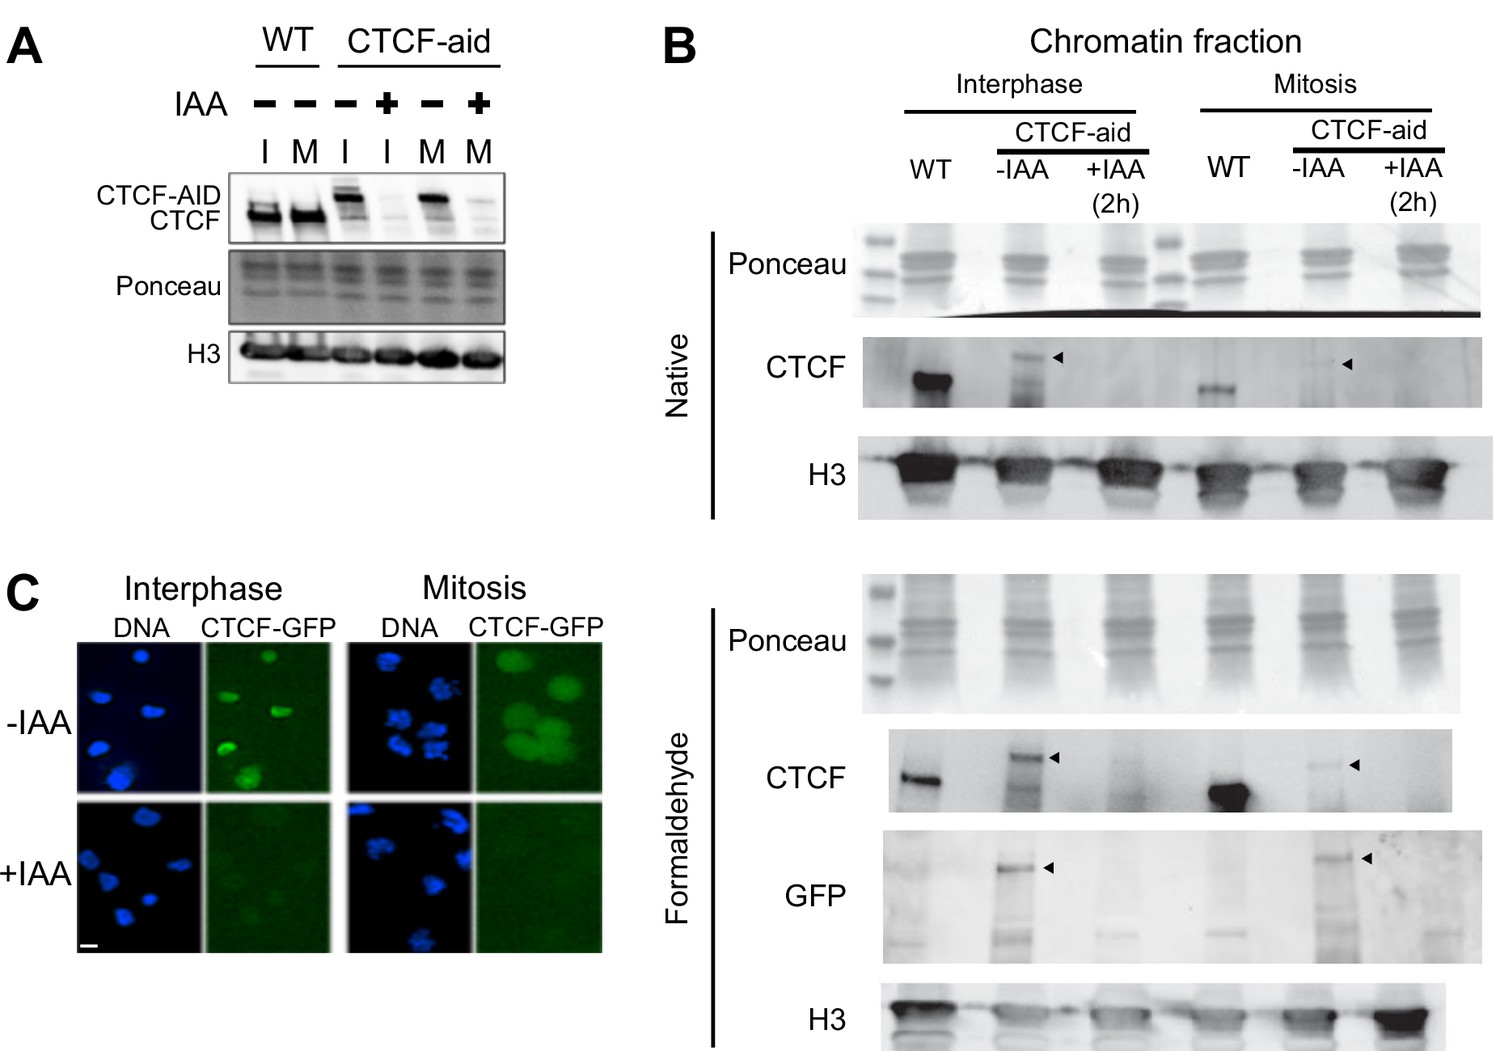
Auxin-induced degradation of CTCF-aid in interphase and mitosis.
Expression of CTCF-aid, which is fused in frame to GFP (Nora et al., 2017), analyzed by Western Blot in total protein extracts (A) or in the chromatin fraction (B), as well as by Imaging (C). Both in interphase (I) and in mitosis (M), CTCF-aid was efficiently degraded after 2 hr of IAA treatment. Note the hypomorphic nature of CTCF-aid line showing reduced expression in interphase and mitosis (A) and, more prominently, bulk chromatin association especially in mitotic chromatin (B). Arrowheads in (B) indicate position of CTCF-aid band.
Figure 4 with 1 supplement
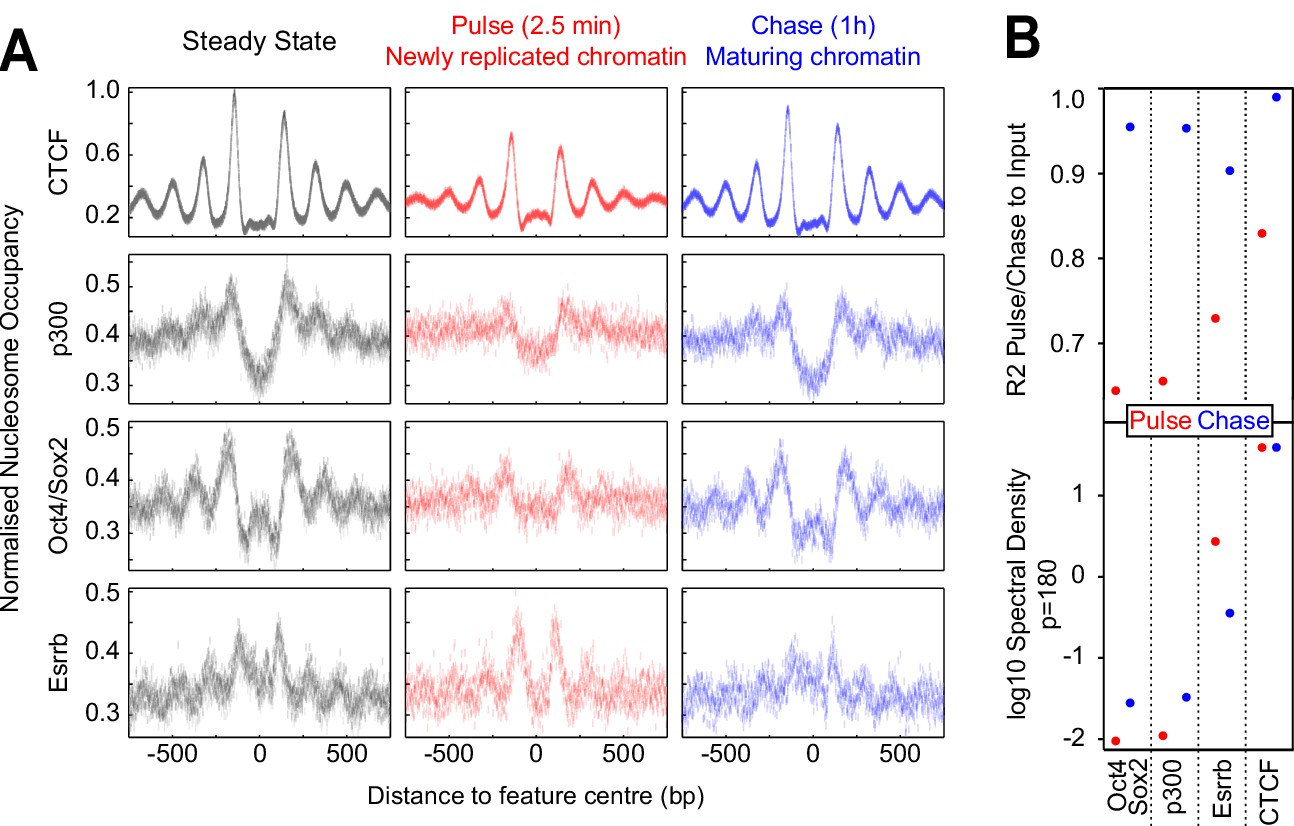
Fast nucleosome positioning at CTCF and Esrrb binding regions after replication.
(A) MINCE-seq metaplots of nucleosomal fragments at CTCF (motif centered), p300 (summit centered), Oct4/Sox2 (motif centered) and Esrrb (motif centered) at steady state (pulse and chase inputs overlaid), pulse (newly replicated chromatin; 2.5 min) and chase (maturing chromatin; 1 hr). Datapoints represent mean MPB per site at each base pair normalized to input/steady-state control. (B) Quantification of reconstitution of steady-state nucleosomal order. Top: R² between relevant pulse/chase and controls. Bottom: log10 spectral density at p=180 (nucleosome + linker) of Gaussian process squared exponential covariance function, with optimized hyperparameters.
Figure 4—figure supplement 1
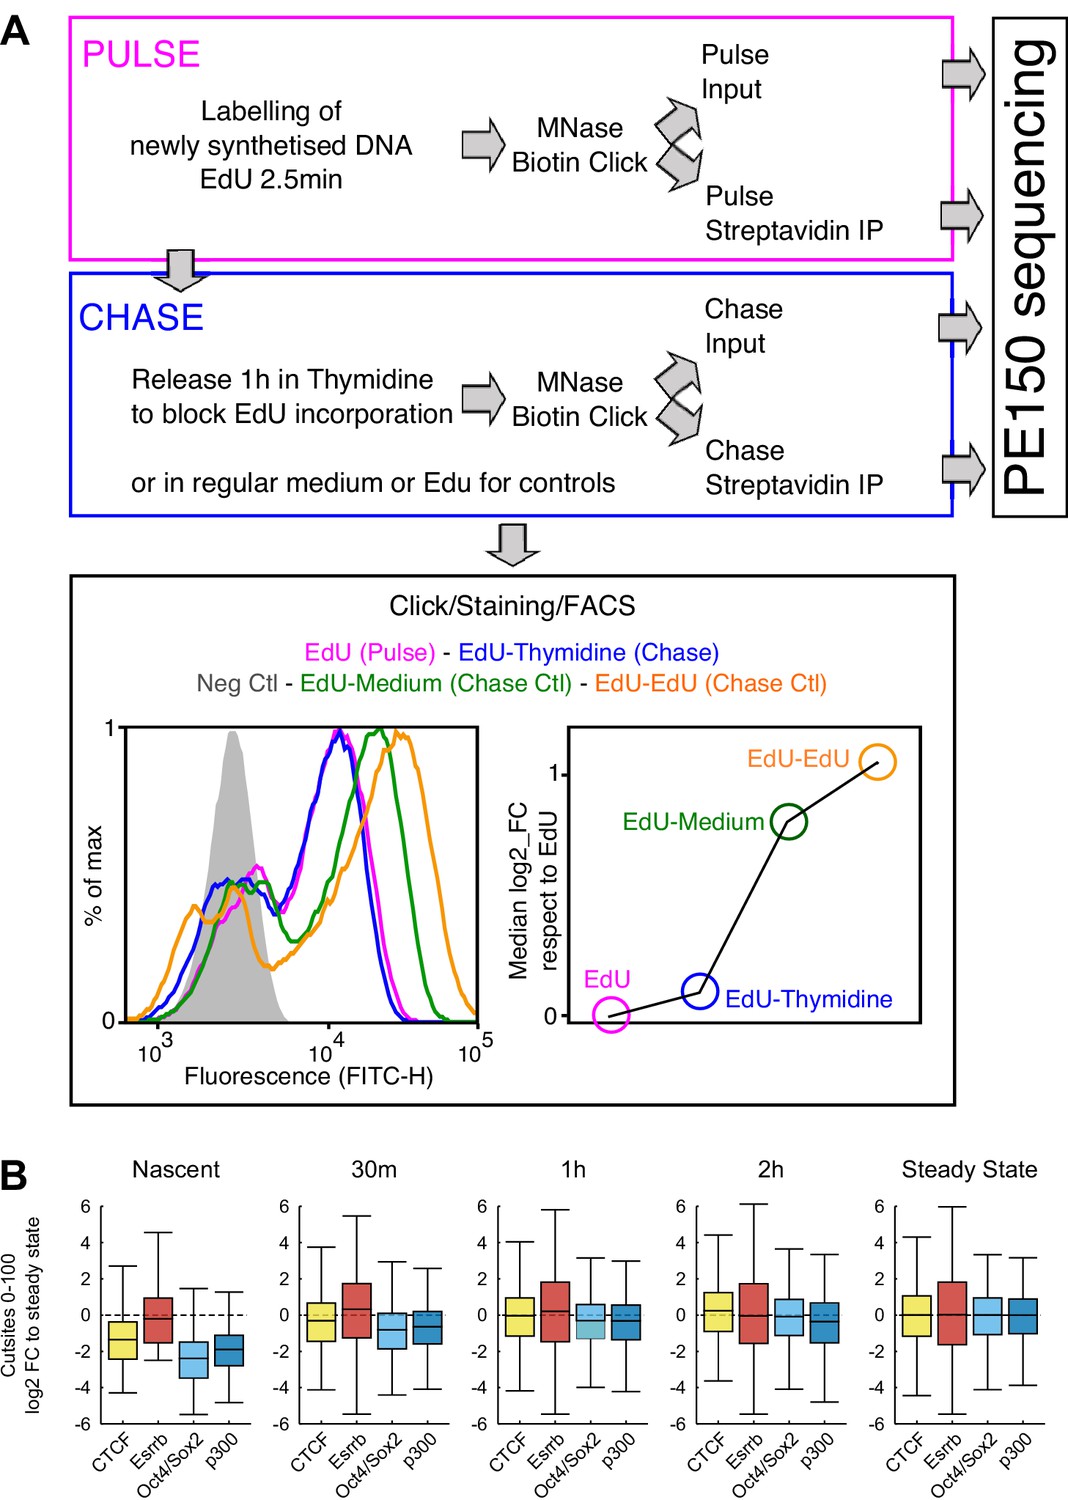
MINCE-seq controls and validation.
(A) Depiction of the main steps of our protocol, adapted from previous work (Ramachandran and Henikoff, 2016; Kliszczak et al., 2011; Sirbu et al., 2011). In ES cells we could use extremely short pulses (2.5 min) leading to around 60% of cells labeled by EdU as shown by FACS. After the pulse, the cells were washed and released in Thymidine to block the incorporation of remnant EdU. These samples were processed as indicated to generate sequencing libraries. The efficiency of the chase regarding the lack of further EdU incorporation was assessed by releasing EdU-treated cells in either regular medium or in EdU-containing medium, which lead to readily detectable increases in EdU incorporation, as shown by FACS. (B) Validation of MINCE-seq results in repli-ATAC-seq data (Stewart-Morgan et al., 2019). Boxplots show the log2 fold change of cut sites of repli-ATAC small fragment (0–100 bp) relative to median of steady state for each analyzed region (CTCF, Esrrb, Oct4/Sox2 and p300 sites). Repli-ATAC was quantified in 200 bp regions centered either on TF motifs (CTCF, Esrrb, Oct4/Sox2) or on peak summits (p300).
Figure 5 with 5 supplements

CTCF is a mitotic bookmarking factor in ES cells.
(A) Split V-plot of MNase data at CTCF binding sites in interphase (left) and mitosis (right) presented as in Figure 3C. (B) Representative genome snapshot (chr6:89606260–89683988; 78 kb; as in Figure 1A) for CTCF ChIP-seq (RPM), MNase-seq nucleosome fragments (MPB) and Cohesin (SMC1) ChIP-seq (RPM), in interphase (blue) and mitosis (red). (C) Heatmaps of CTCF ChIP-seq signal (RPM per peak) in interphase (X-axis) and mitosis (Y-axis) for ES, C2C12 and NIH3T3 cells, at all peaks identified in ES cells.
Figure 5—figure supplement 1
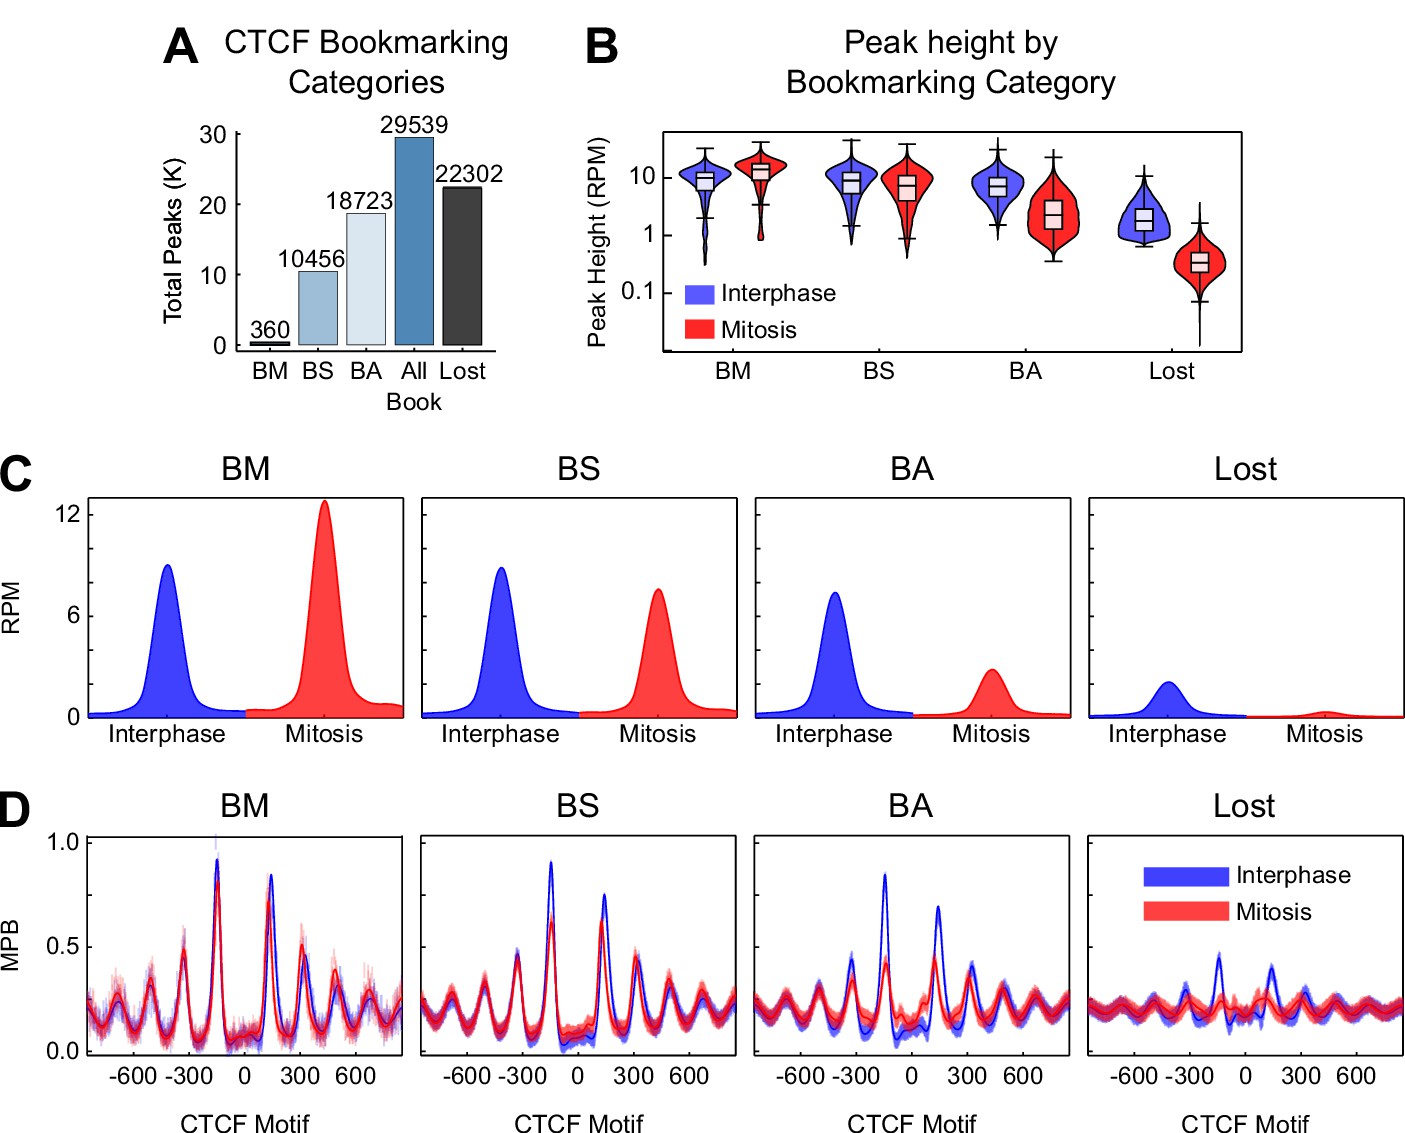
Additional information on CTCF binding in mitosis.
(A) Total number of sites per peak category. BM: bookmarked peaks with Mitosis >Interphase; BS: bookmarked peaks with Mitosis ≈ Interphase; BA: bookmarked peaks with Mitosis <Interphase. (B) Violin plots of peak height in interphase and mitosis for bookmarking categories. (C) Metaplot in reads per million (RPM) of CTCF ChIP-seq for each bookmarking category in interphase (blue) and mitosis (red). (D) Metaplots of nucleosomes in MNase-seq for bookmarking categories in MPB for interphase (blue) and mitosis (red).
Figure 5—figure supplement 2
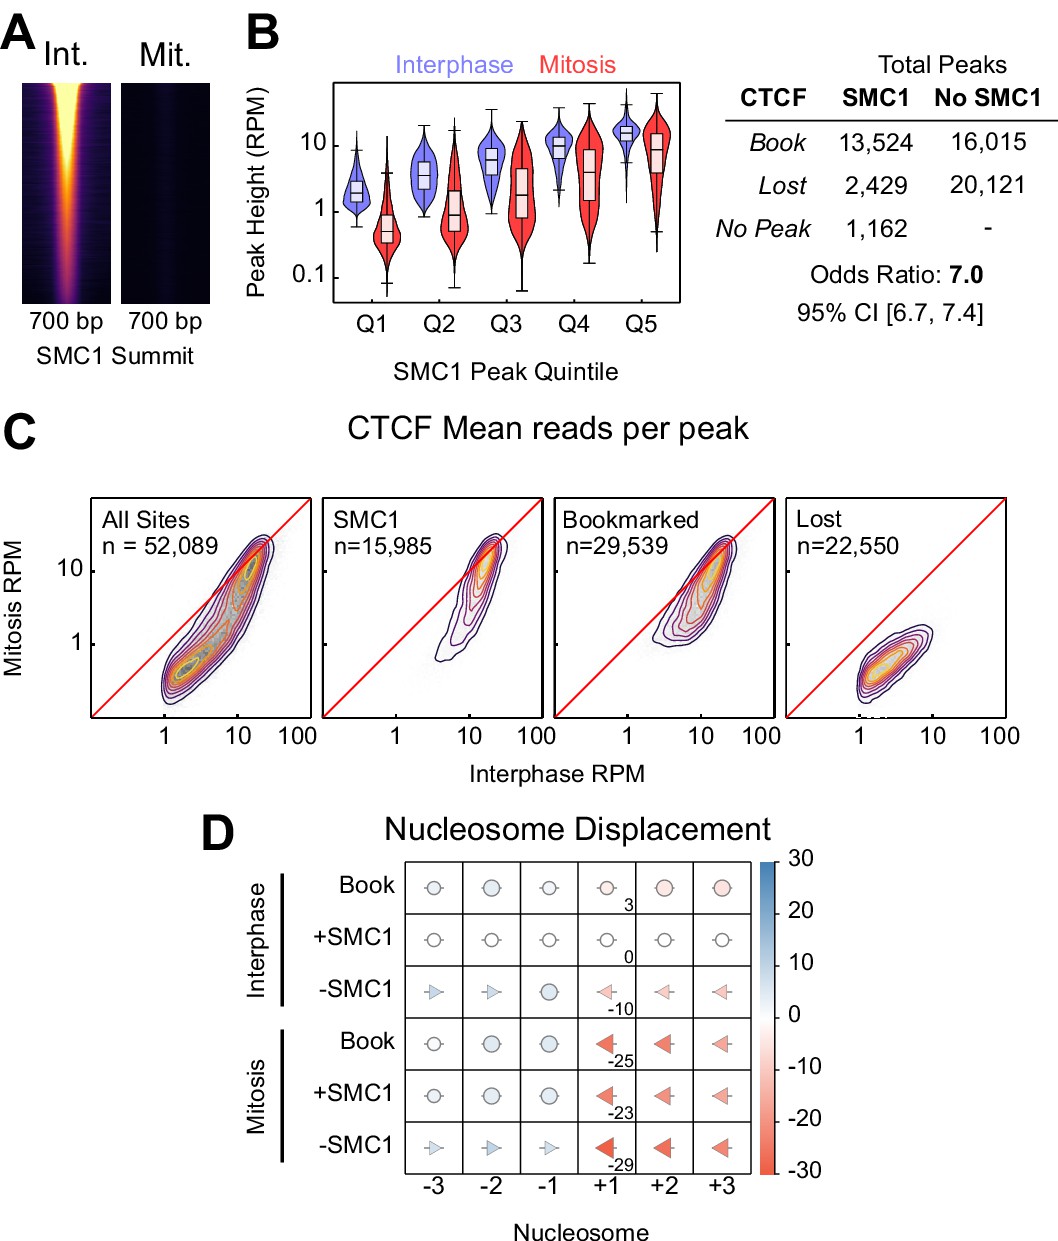
SMC1 binding in interphase and mitosis.
(A) SMC1 ChIP-seq in interphase and mitosis at SMC1 interphase peaks centered on SMC1 summit, scaled to interphase signal. (B) Relationship between SMC1 and CTCF occupancy; left: violin plots of CTCF peak height (RPM) in interphase and mitosis for SMC1 peak height quintiles; right: contingency table of CTCF peaks with and without SMC1 against those bookmarked and lost. Fisher p-value<2.2e-16. (C) Heatmap/contour plots of mean reads per CTCF peak in interphase and mitosis for all peaks, SMC1 intersecting peaks, bookmarked peaks and lost peaks as indicated. (D) Mean displacement of +/- 1,2,3 nucleosome positions at CTCF bookmarked, SMC1 positive and SMC1 negative peaks in interphase and mitosis relative to SMC1 positive interphase peaks. Circles denote nucleosome movements < 5 bp; arrow direction, size and color describe movements > 5 bp. Numbers indicate the displacement of the +1 nucleosome.
Figure 5—figure supplement 3
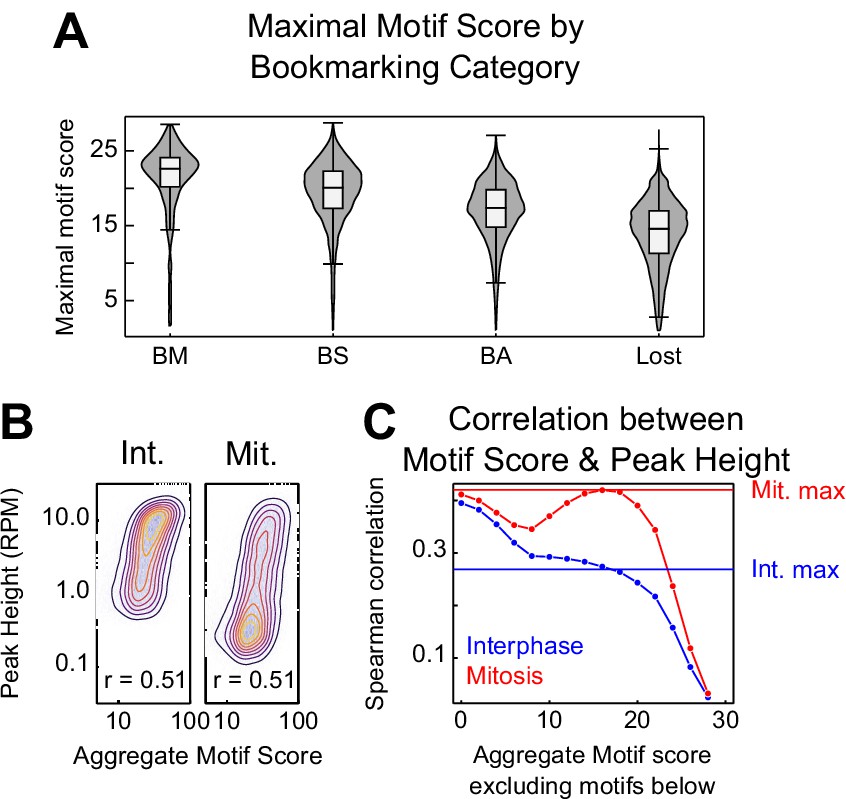
CTCF binding motifs and mitotic bookmarking.
(A) Violin plots of maximal motif FIMO score per peak for bookmarking categories described in Figure 5—figure supplement 1. (B) Relationship between CTCF aggregate motif score (the sum of all FIMO motif scores within a peak) and CTCF peak heights in interphase and mitosis as contour/heatmap as Figure 1—figure supplement 1B. (C) Spearman correlation coefficient between interphase and mitosis peak height and a thresholded aggregate FIMO score in which all motifs less than or equal to the value on the horizontal axis were excluded. Horizontal lines indicate the Spearman correlation between the maximum scoring CTCF motif within each peak and peak height. Mitosis peak heights have a greater dependence on high scoring motifs. Interphase peak heights share the greatest correlation with the sum of all motifs, regardless of FIMO score.
Figure 5—figure supplement 4
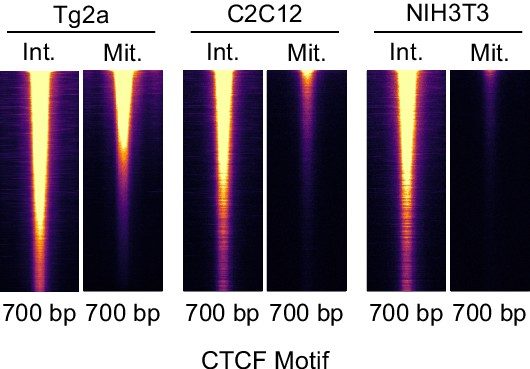
CTCF binding in C2C12 and NIH3T3.
CTCF ChIP-seq in interphase and mitosis in E14Tg2a (ES cells, labeled: Tg2a), C2C12 and NIH3T3 cells at Tg2a peaks, heatmaps mark entire inferred ChIP-seq fragment and are scaled to Tg2a.
Figure 5—figure supplement 5
Global behavior of CTCF in mitotic cells.
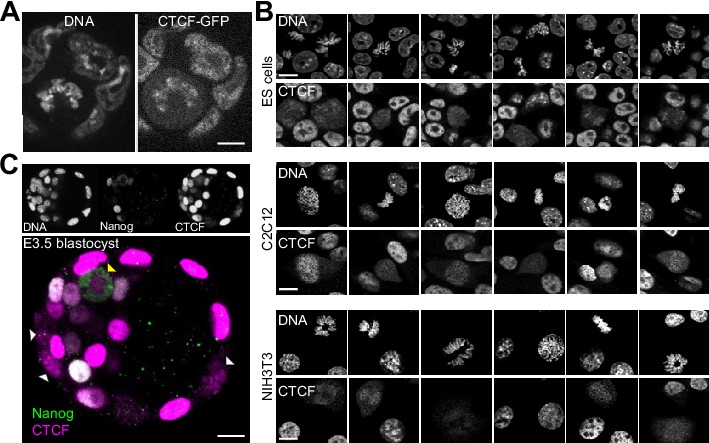
(A) Live imaging of CTCF-aid ES cells that also carry a GFP in frame with CTCF-aid (Nora et al., 2017); coating of the mitotic chromosomes was readily detectable. (B) In contrast to other TFs that require alternative fixation approaches based on DSG or Glyoxal to capture the bulk of interactions with the mitotic chromosomes (Festuccia et al., 2019), CTCF could be crosslinked with formaldehyde and no major differences were observed with DSG or Glyoxal (not shown). In the three cell lines that we tested (ES cells, C2C12 and NIH3T3) we observed cell-to-cell heterogeneity in respect to CTCF retention during mitosis. The signal observed in C2C12 and NIH3T3 tends to be less prominent than in ES cells and more variable, with some cells exhibiting a clear chromosomal exclusion. (C) Out of 7 embryos (of which five were treated with nocodazole), we could observe 46 mitoses: 40 in the trophectoderm (TE) and six in the inner cell mass. In the TE, 37 mitoses displayed clear coating of the chromosomes by CTCF and the other 3, dimmer signal; the signal observed in six mitotic cells of the ICM was more diffused although not excluded from the chromosomes as seen for Nanog.
Figure 6 with 1 supplement
CTCF Positions Nucleosomes in Mitosis.
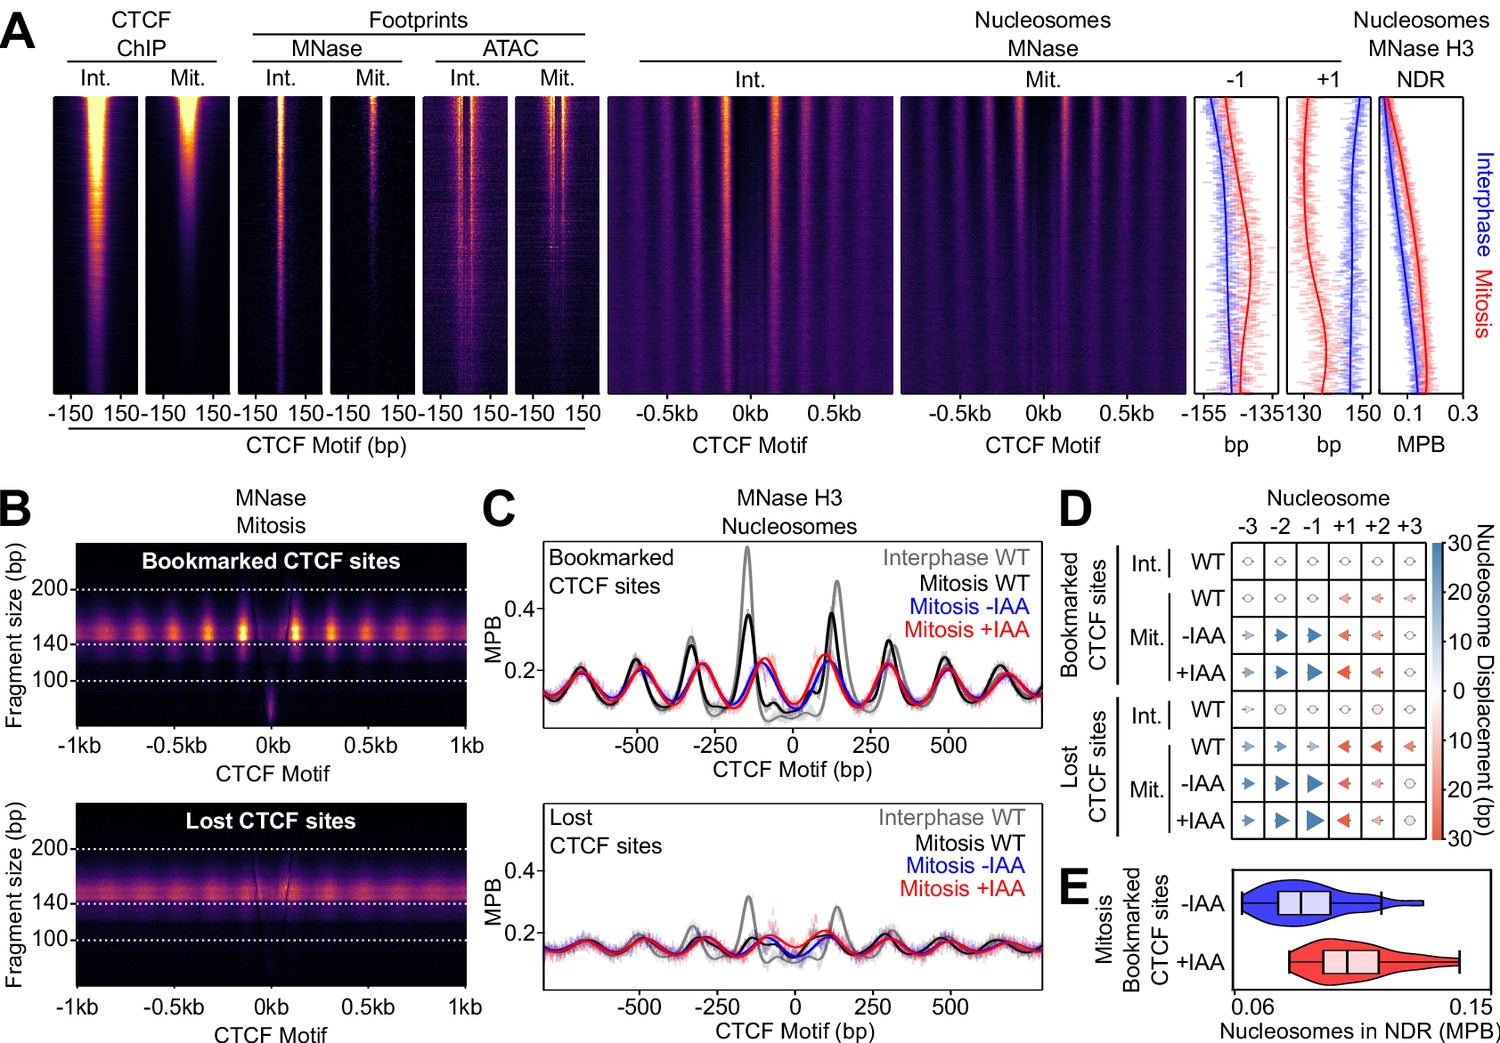
(A) Interphase (Int.) and mitosis (Mit.) data presented as in Figure 2 for CTCF ChIP-seq; MNase/ATAC-seq footprints; MNase-seq nucleosomal signal; +/- 1 nucleosome positions and NDR signal (MNase H3 ChIP-seq). The regions are ordered by descending mitotic ChIP-seq peak height. All heatmaps are scaled to interphase. (B) Mitosis MNase V-plots for CTCF Bookmarked (top) and Lost regions (bottom), presented as in Figure 1B. (C) MNase H3 ChIP-seq metaplots at CTCF Bookmarked (top) and Lost sites (bottom) centered on CTCF motifs for wild-type interphase and mitosis (gray and black, respectively) and for mitosis CTCF-aid -/+ IAA (blue and red, respectively), normalized to WT interphase, unnormalized metaplots shown in Figure 6—figure supplement 1B. (D) Mean +/- 1,2,3 nucleosome positions relative to wild-type interphase, for datasets shown in (C), complete unnormalized datasets shown in Figure 6—figure supplement 1D. Circles denote nucleosome movements < 5 bp; arrow direction, size and color describes movements > 5 bp. (E) Nucleosome signal in NDR ([−40, 40]bp of the motif) at Bookmarked sites in mitosis CTCF-aid -/+ IAA, normalized to WT interphase; unnormalized data shown in Figure 6—figure supplement 1C.
Figure 6—figure supplement 1
Additional information on CTCF binding and nucleosome positioning in CTCF-aid ES cells.
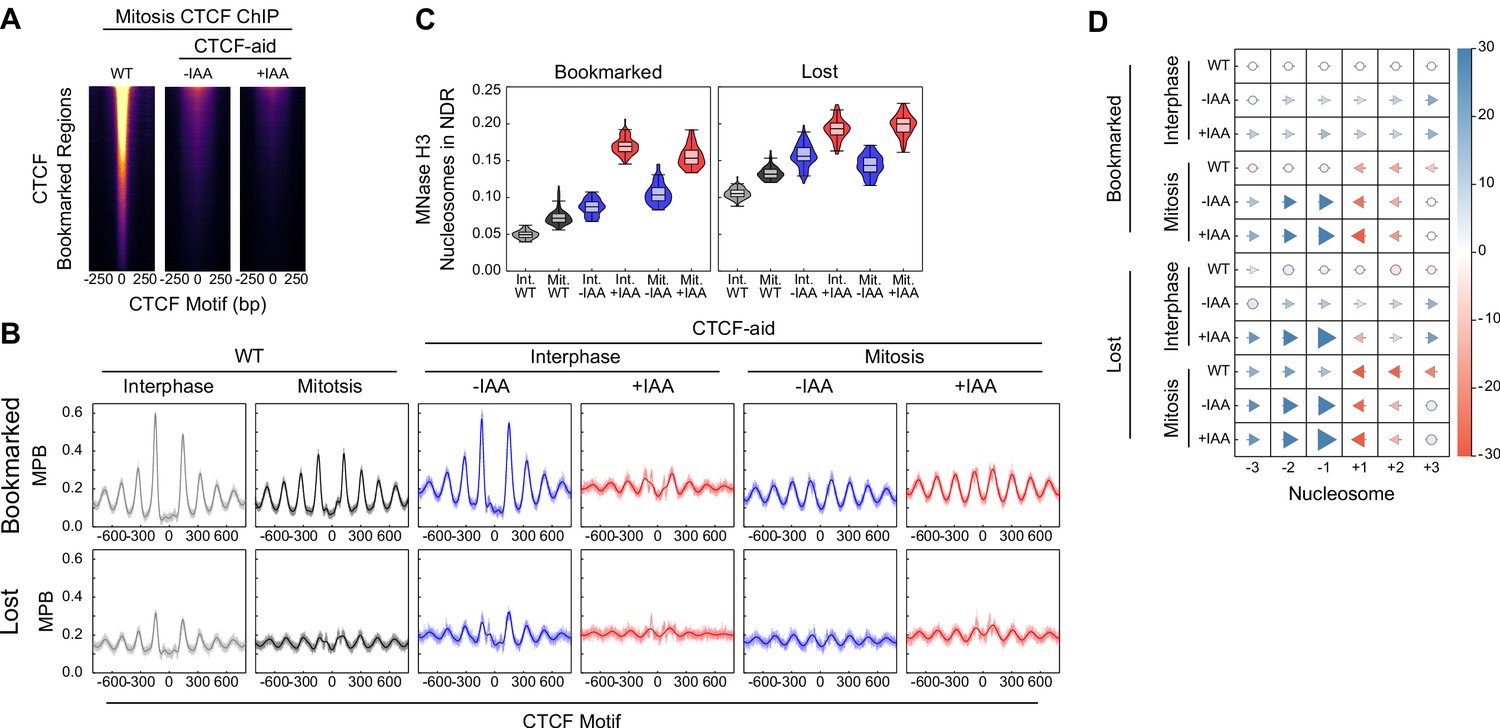
(A) CTCF ChIP-seq in mitosis for wildtype (WT), CTCF-aid -IAA and +IAA, at CTCF bookmarked sites. All heatmaps scaled to WT interphase. Due to low signal CTCF-aid ChIP-seq marks entire inferred fragment rather than midpoint. (B) Nucleosome average profiles in MNase H3 ChIP-seq at bookmarked and lost CTCF sites in MPB for interphase and mitosis in WT and CTCF-aid +/- IAA. (C) Nucleosome signal in NDR ([−40, 40]bp of the motif, as Figure 6E) at Bookmarked sites (left) and Lost sites (right) for interphase and mitosis in WT and CTCF-aid +/- IAA. (D) Nucleosome displacement (as Figure 6D) at bookmarked and lost CTCF sites in wildtype and CTCF-aid ES cells in interphase and in mitosis.
Figure 7
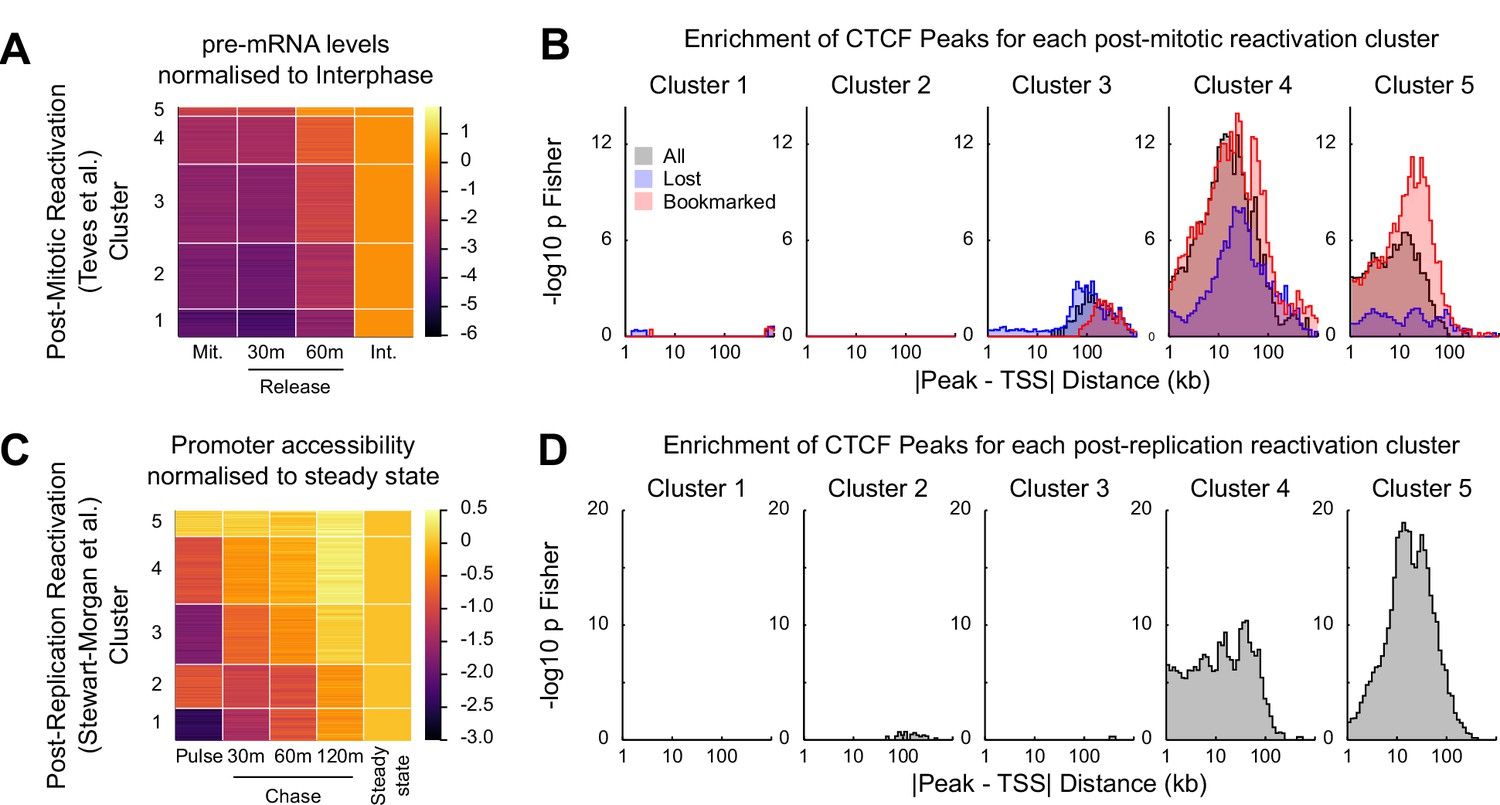
CTCF binding is associated with rapid gene activation after replication and mitosis.
(A) K-means clustering (k = 5) of chromatin associated RNA-seq following release from mitosis (Teves et al., 2018). Heatmap shows log2 fold change of Mitosis (Mit.), 30 min and 60 min nocodazole release (30 m and 60 m respectively) relative to Interphase (Int.). (B) -log10 Fisher exact p-value enrichment of CTCF bookmarked and lost peaks in proximity to genes in clusters in (A). (C) K-means clustering (k = 5) of repli-ATAC-seq (Stewart-Morgan et al., 2019) at active promoters in mouse ES cells. Heatmap shows log2 fold change of Nascent (Pulse), 30 min (30 m), 1 hr (60 m) and 2 hr (120 m) chromatin relative to Steady State chromatin. (D) -log10 Fisher exact p-value enrichment of CTCF peaks in proximity to genes in clusters in (C).
Tables
Key resources table
| Reagent type (species) or resource | Designation | Source or reference | Identifiers | Additional information |
|---|---|---|---|---|
| Cell line (Mus musculus) | E14Tg2a | Grown in serum and LIF | ||
| Cell line (Mus musculus) | Ctcf-aid | PMID: 28525758 | Grown in serum and LIF | |
| Antibody | anti-CTCF rabbit polyclonal | Active Motif | Cat# 61311 | 4 µL/ChIP-seq |
| Antibody | anti-SMC1 rabbit polyclonal | Bethyl Laboratories | Cat# A300-055A | 4 µL/ChIP-seq |
| Antibody | anti-H3 rabbit polyclonal | Abcam | Cat#: ab1791 | 5 µg/ChIP-seq |
| Software, algorithm | Bowtie2 v2.1.0 | (Langmead and Salzberg, 2012) | RRID:SCR_005476 | |
| Software, algorithm | STAR v2.5.0a | (Dobin et al., 2013) | RRID:SCR_015899 | |
| Software, algorithm | RSEM v1.2.29 | (Li and Dewey, 2011) | RRID:SCR_013027 | |
| Software, algorithm | VERSE | (Zhu, 2016) | https://github.com/qinzhu/VERSE | |
| Software, algorithm | MACS2 v2.0.10 | (Feng et al., 2012) | RRID:SCR_013291 | |
| Software, algorithm | DESeq2 v1.18.1 | (Love et al., 2014) | RRID:SCR_015687 | |
| Software, algorithm | FIMO v4.12.0 | (Grant et al., 2011) | RRID:SCR_001783 | |
| Software, algorithm | picard-tools v2.8.1 | http://broadinstitute.github.io/picard/ | RRID:SCR_006525 | |
| Software, algorithm | samtools v1.9 | (Li et al., 2009) | RRID:SCR_002105 | |
| Software, algorithm | GPy | https://github.com/SheffieldML/GPy | ||
| Software, algorithm | Julia v0.6.4 | (Bezanson et al., 2017) | https://julialang.org/ | |
| Software, algorithm | Python v3.6.7 | https://www.python.org/ | RRID:SCR_008394 | |
| Software, algorithm | R v 3.4.4 | http://www.r-project.org/ | RRID:SCR_001905 |
Additional files
-
Supplementary file 1
Describes all ChIP-seq, MNase H3 ChIP-seq and MINCE-seq samples sequenced in this study.
- https://doi.org/10.7554/eLife.47898.019
-
Supplementary file 2
Describes all CTCF and SMC1 binding regions identified in this study, their enrichments in interphase and mitosis and their bookmarking status.
- https://doi.org/10.7554/eLife.47898.020
-
Transparent reporting form
- https://doi.org/10.7554/eLife.47898.021
Download links
A two-part list of links to download the article, or parts of the article, in various formats.
Downloads (link to download the article as PDF)
Open citations (links to open the citations from this article in various online reference manager services)
Cite this article (links to download the citations from this article in formats compatible with various reference manager tools)
CTCF confers local nucleosome resiliency after DNA replication and during mitosis
eLife 8:e47898.
https://doi.org/10.7554/eLife.47898


