The evolutionary plasticity of chromosome metabolism allows adaptation to constitutive DNA replication stress
- Department of Molecular and Cellular Biology, Harvard University, United States
Figures
Figure 1 with 3 supplements
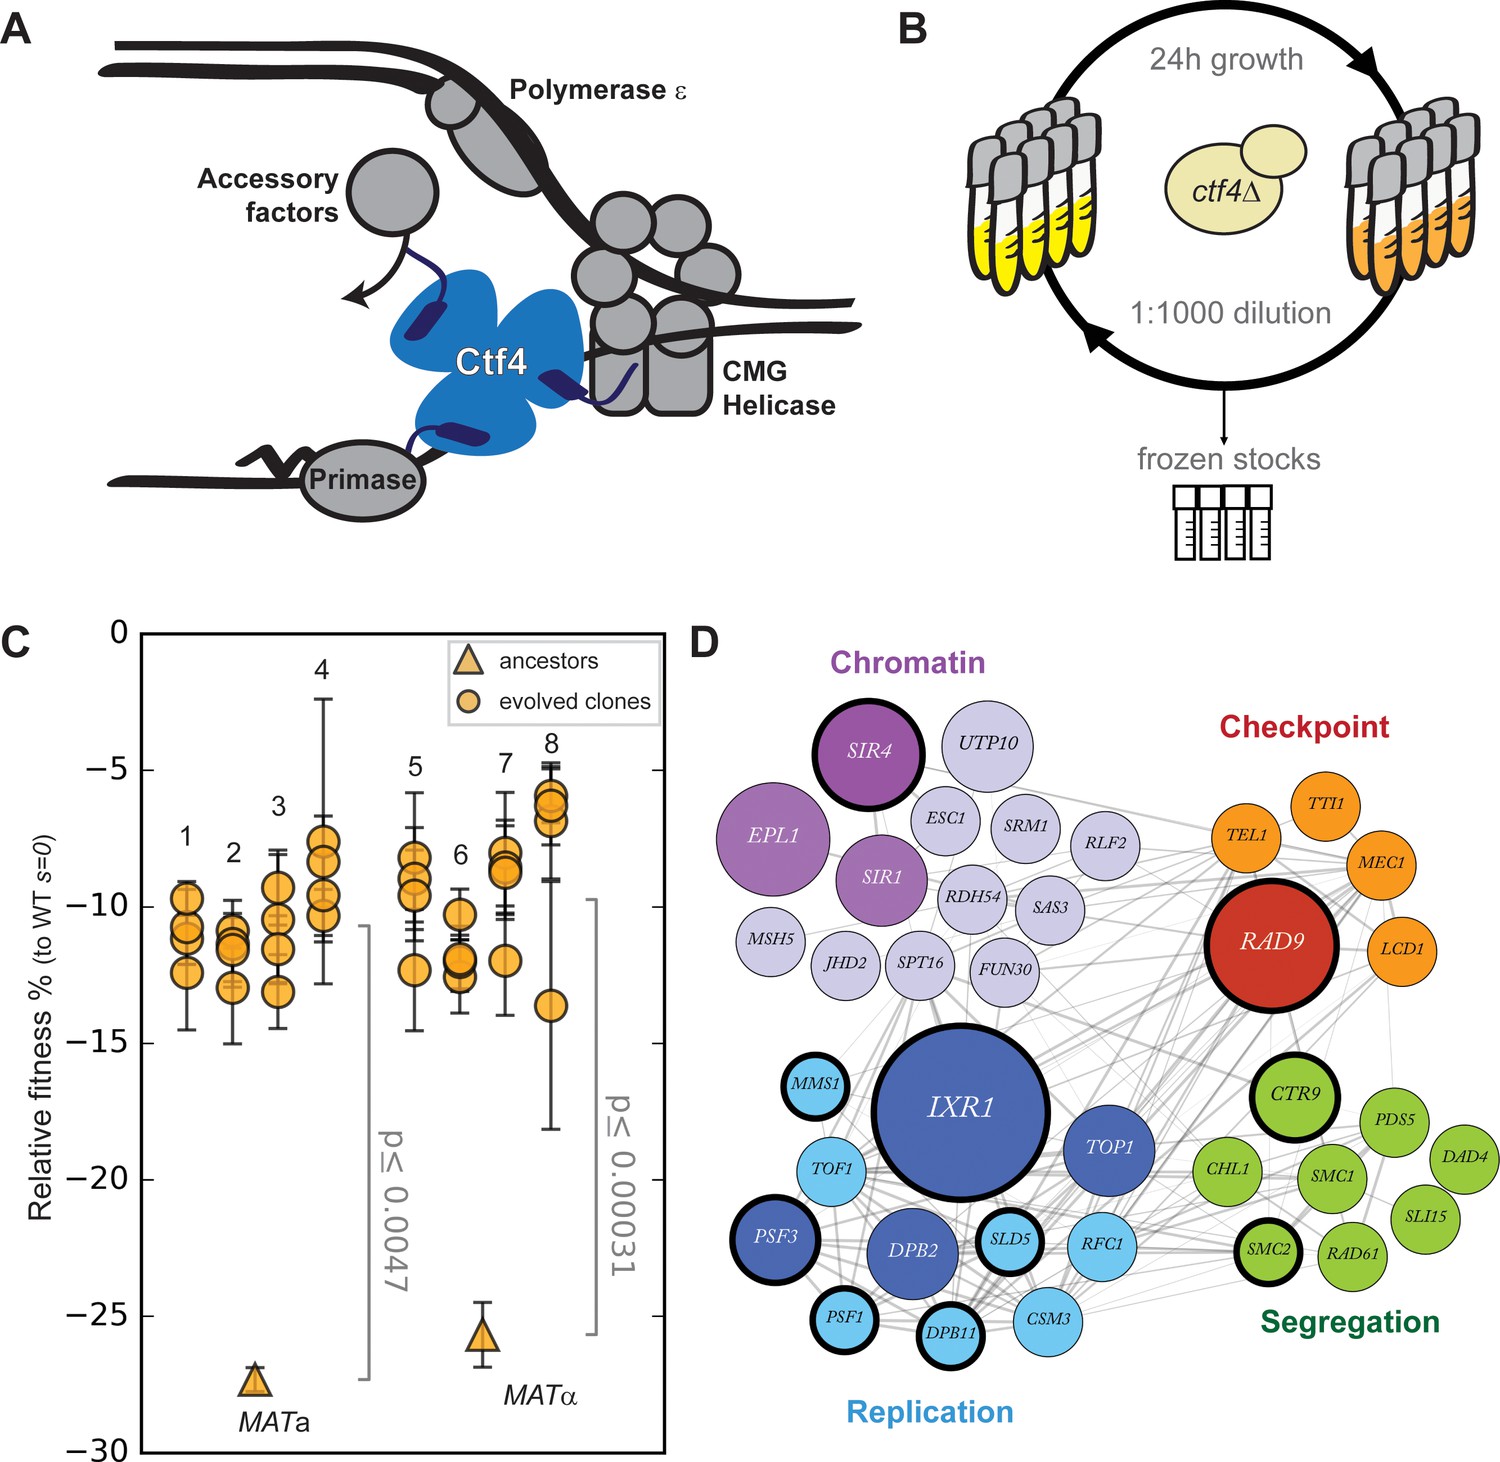
Fast evolutionary adaptation to DNA replication stress.
(A) Schematic representation of the replisome focused on the role of Ctf4 in coordinating the replicative helicase, primase, and other factors. (B) The experimental evolution scheme: independent colonies of ctf4∆ S. cerevisiae were inoculated in rich media, grown to saturation, and diluted 1:1000 in fresh media for a total of 100 cycles (1000 generations). Populations samples were saved every 50 generations for future analysis. (C) Fitness of the ctf4Δ ancestor strains and of 32 evolved clones isolated from the 8 (labeled 1 through 8) populations derived from them, relative to wt cells (s = 0). Error bars represent standard deviations. MATa and MATα refer to the strain sex. (D) Simplified representation of the modules enriched in putative adaptive mutations, found in evolved clones. Gray lines represent evidence of genetic and physical interactions from the literature (https://string-db.org). Node diameter is proportional to the number of populations in which the gene was mutated. Selection on darker nodes was statistically significant. Nodes surrounded with a bold circle are genes in which mutations were found to strongly correlate with the evolved phenotype by bulk segregant analysis.
-
Figure 1—source data 1
Numerical values corresponding to the graph in panel C.
- https://cdn.elifesciences.org/articles/51963/elife-51963-fig1-data1-v2.xlsx
Figure 1—figure supplement 1
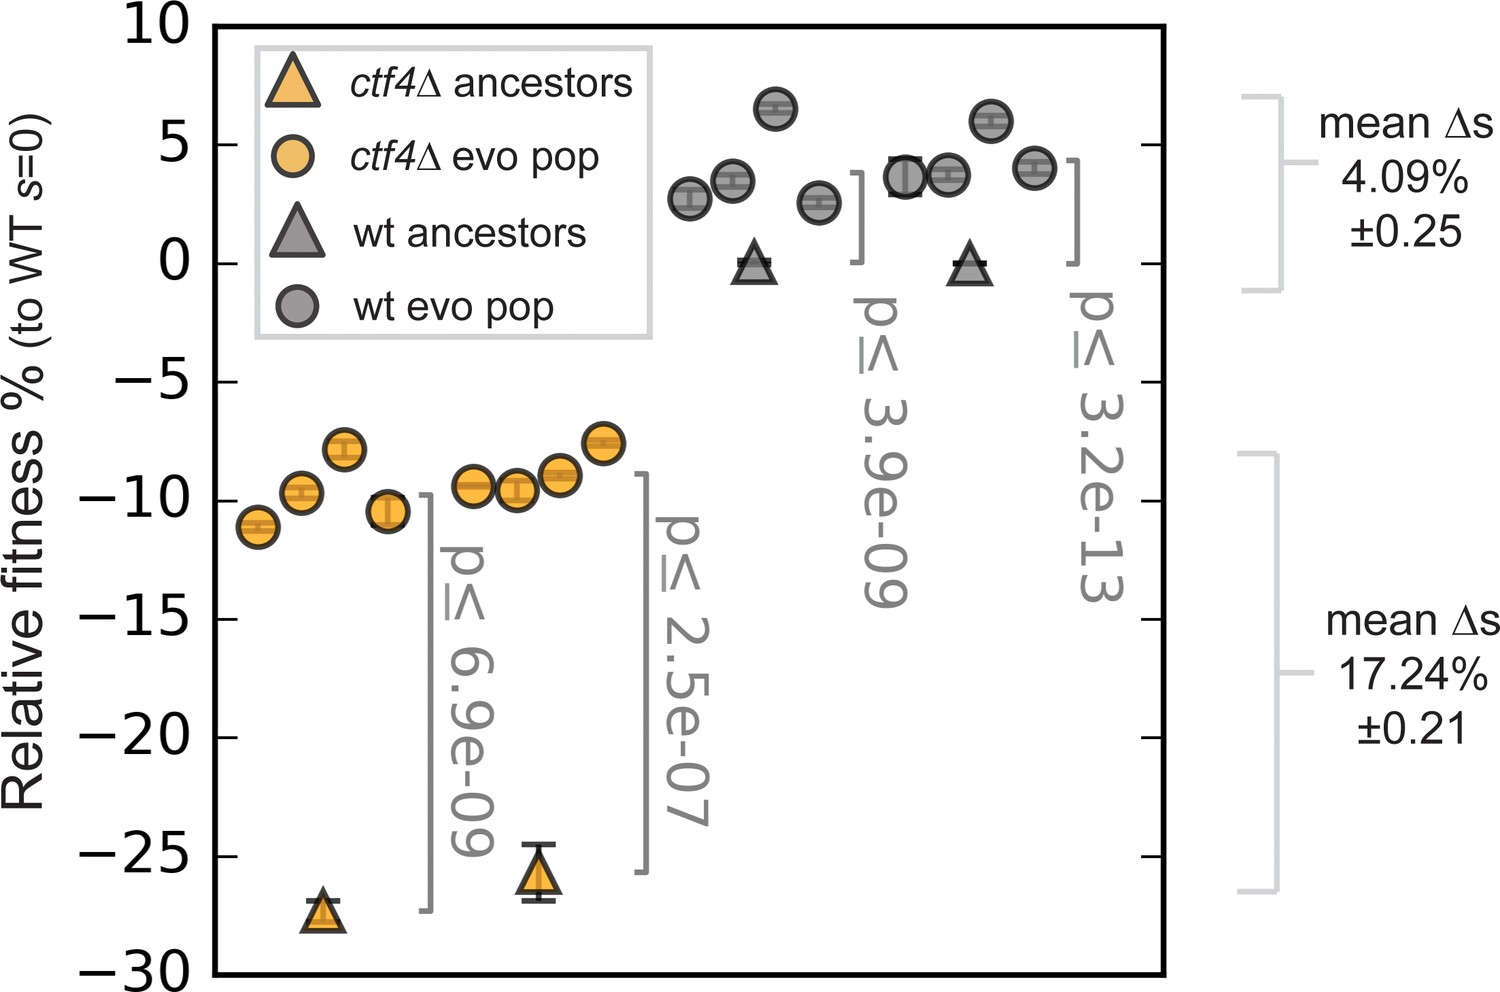
Fitness of the evolved populations.
Fitness of the ctf4Δ (yellow) and wt (gray) ancestors and of 16 evolved populations derived from them (eight each), relative to wt cells (s = 0). Error bars represent standard deviations. Note that this panel shows the fitnesses of populations, whereas Figure 1C shows the fitness of clones isolated from populations.
-
Figure 1—figure supplement 1—source data 1
Numerical values corresponding to the graph.
- https://cdn.elifesciences.org/articles/51963/elife-51963-fig1-figsupp1-data1-v2.xlsx
Figure 1—figure supplement 2
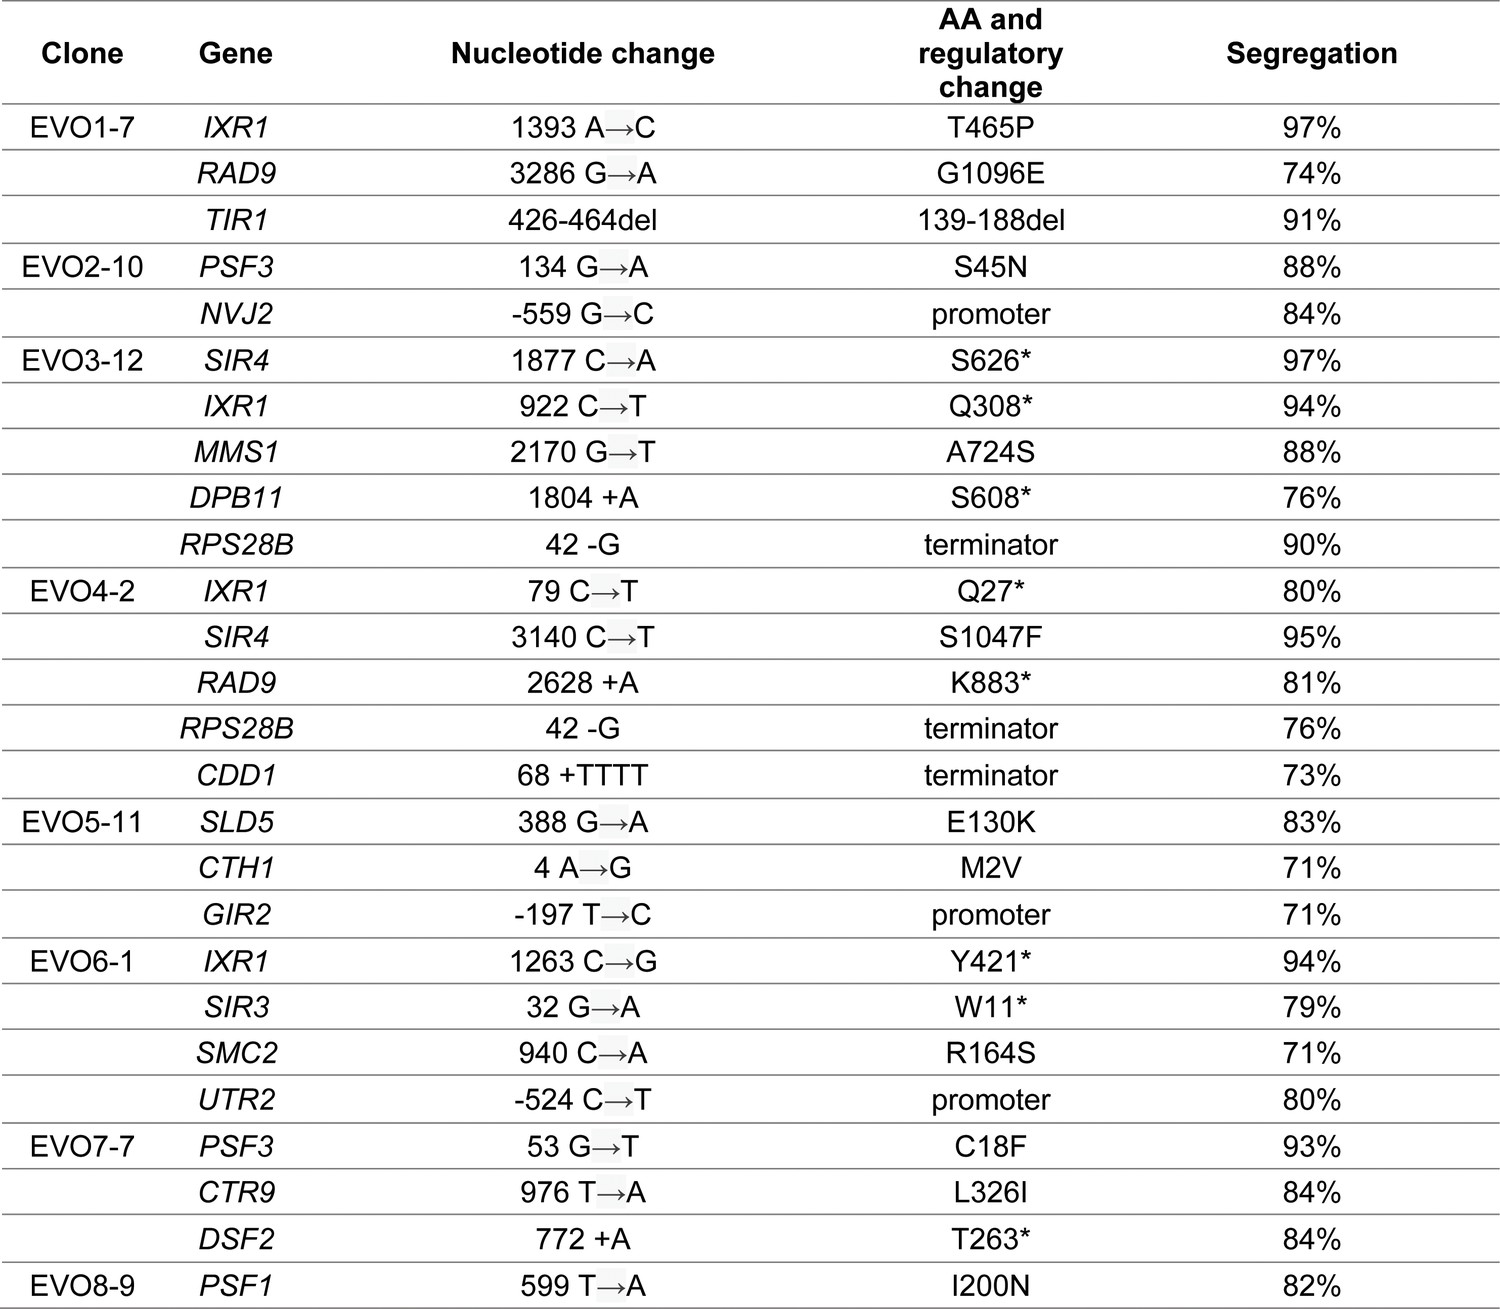
Bulk segregant analysis of evolved clones.
One clone per population was crossed with a wt ancestor and subjected to bulk segregant analysis. For each clone, the mutations found to strongly segregate (>70%) with the evolved phenotype are reported. An average of 71 reads (with a minimum of 35 reads) was used to calculate locus segregation.
Figure 1—figure supplement 3

Chromosome metabolism-associated GO terms.
Extract from Supplementary file 2: GO term that are enriched in the genes that were found to be either strongly significantly selected or segregating with the evolved phenotype by bulk segregant analysis.
Figure 2 with 1 supplement
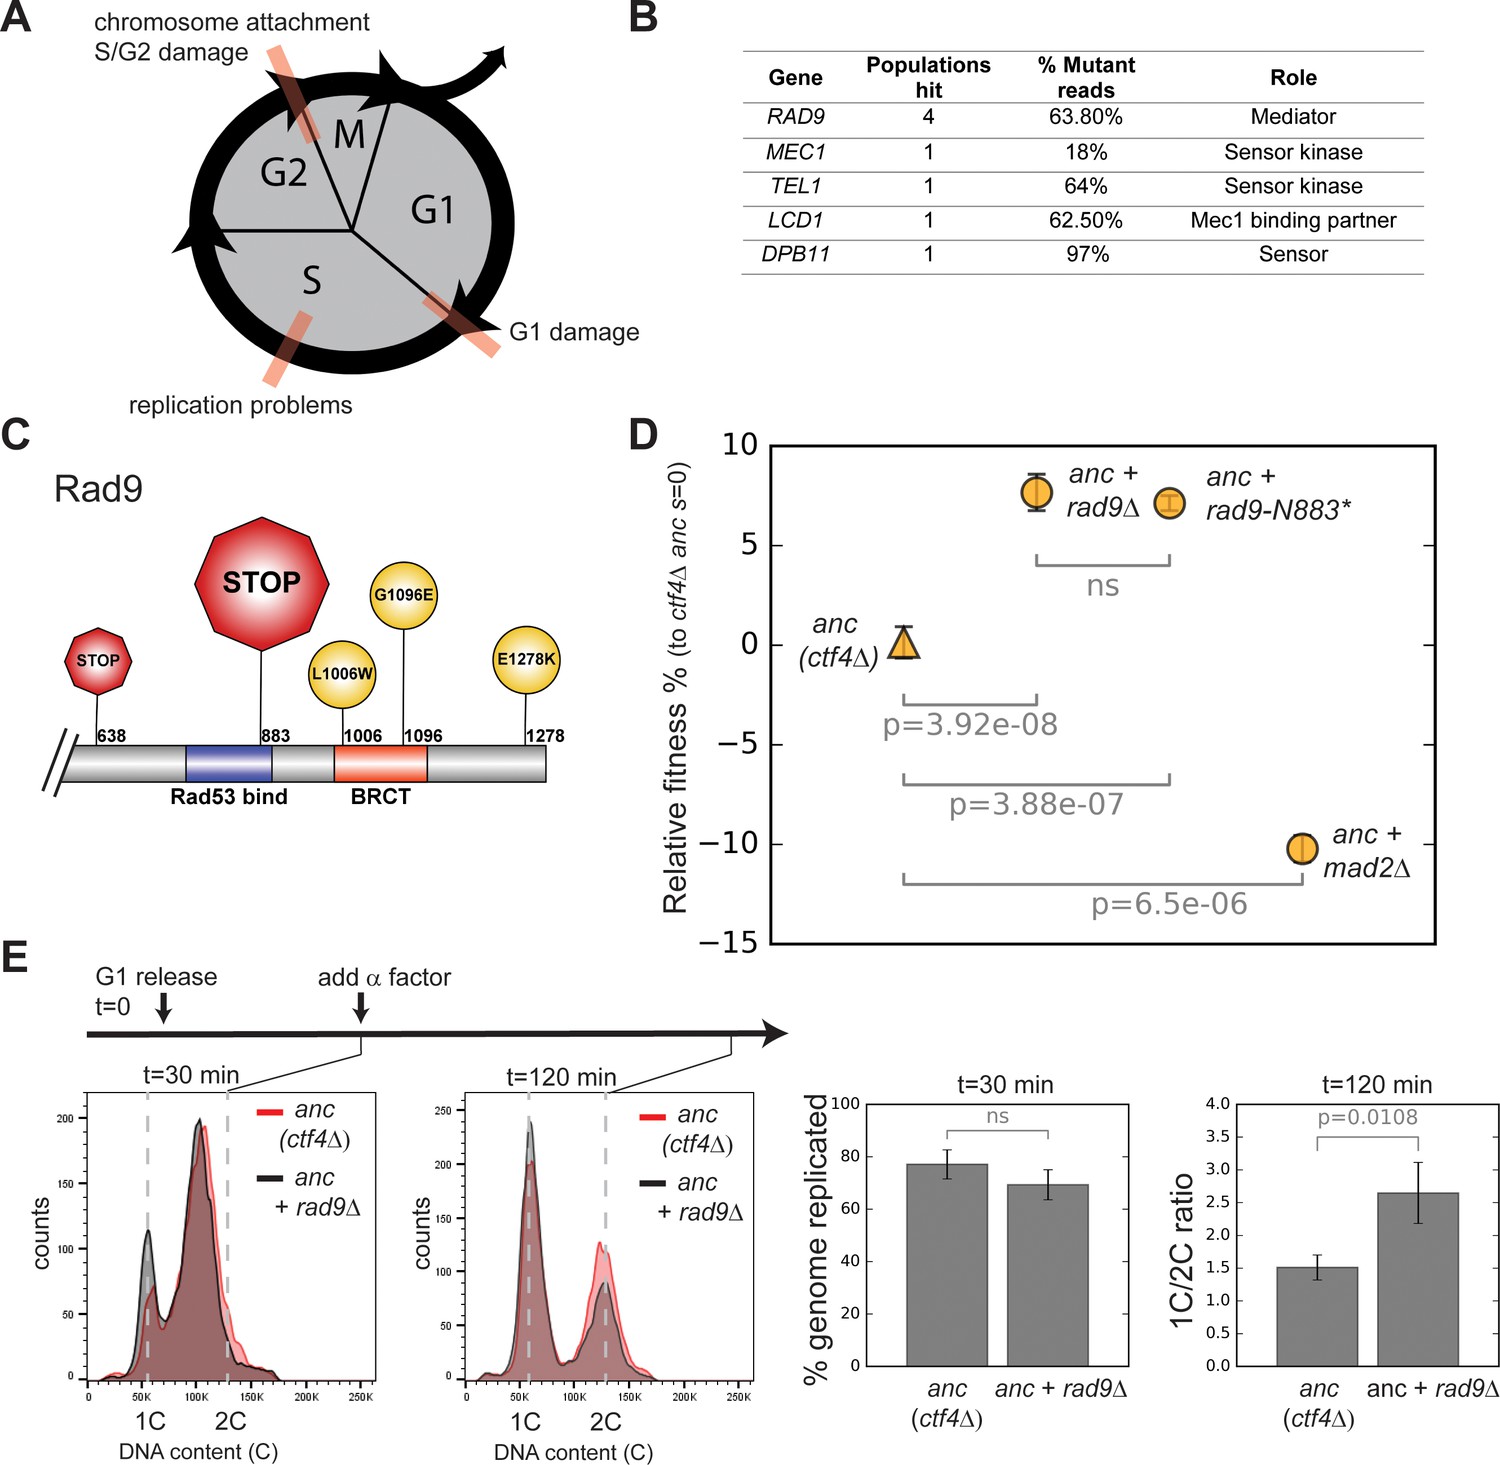
Checkpoint mutations cause a faster G2/M transition in evolved cells.
(A) Schematic representation of cell cycle progression. The transitions delayed by various checkpoints are highlighted in red. (B) List of checkpoint genes mutated in evolved clones and their role in the signaling cascade. ‘Populations hit’ refers to the number of populations where the gene was mutated. ‘% Mutant reads’ was calculated as the average of the mutant read frequencies in the different populations where the mutation was detected. (C) Schematic of the C-terminal region of Rad9 that was affected by mutations in evolved clones. The diameter of the symbol is proportional to the number of populations where the mutation was detected. Note that both stop codons resulted from an upstream frameshift. Two populations contained more than one distinct RAD9 mutations. (D) The fitness of ctf4∆ strains carrying two reconstructed mutations in the DNA damage checkpoint (rad9∆ and rad9K883*) and an engineered inactivation of the spindle checkpoint (mad2∆) relative to the ctf4Δ ancestors (ctf4Δ anc, s=0). Error bars represent standard deviations. (E) Cell cycle profiles of ctf4Δ ancestor and ctf4Δ rad9Δ cells at two time points during a synchronous cell cycle. Cells were arrested in G1 and subsequently released synchronously into S-phase. Time points taken at 30 min and 120 min after the release are shown. 1C is the DNA content of a cell in G1. α-factor was added 30 min after release to prevent cells entering a second cell cycle and thus ensure that 2C cells at the 120 min measurement resulted from a G2 delay rather than progress through a second cell cycle. The percentage of genome replicated at 30 min was calculated based on the cell cycle profile. 1C/2C ratios were calculated based on the height of the respective 1C and 2C peaks at 120 min.
-
Figure 2—source data 1
Numerical values corresponding to the graph in panel D.
- https://cdn.elifesciences.org/articles/51963/elife-51963-fig2-data1-v2.xlsx
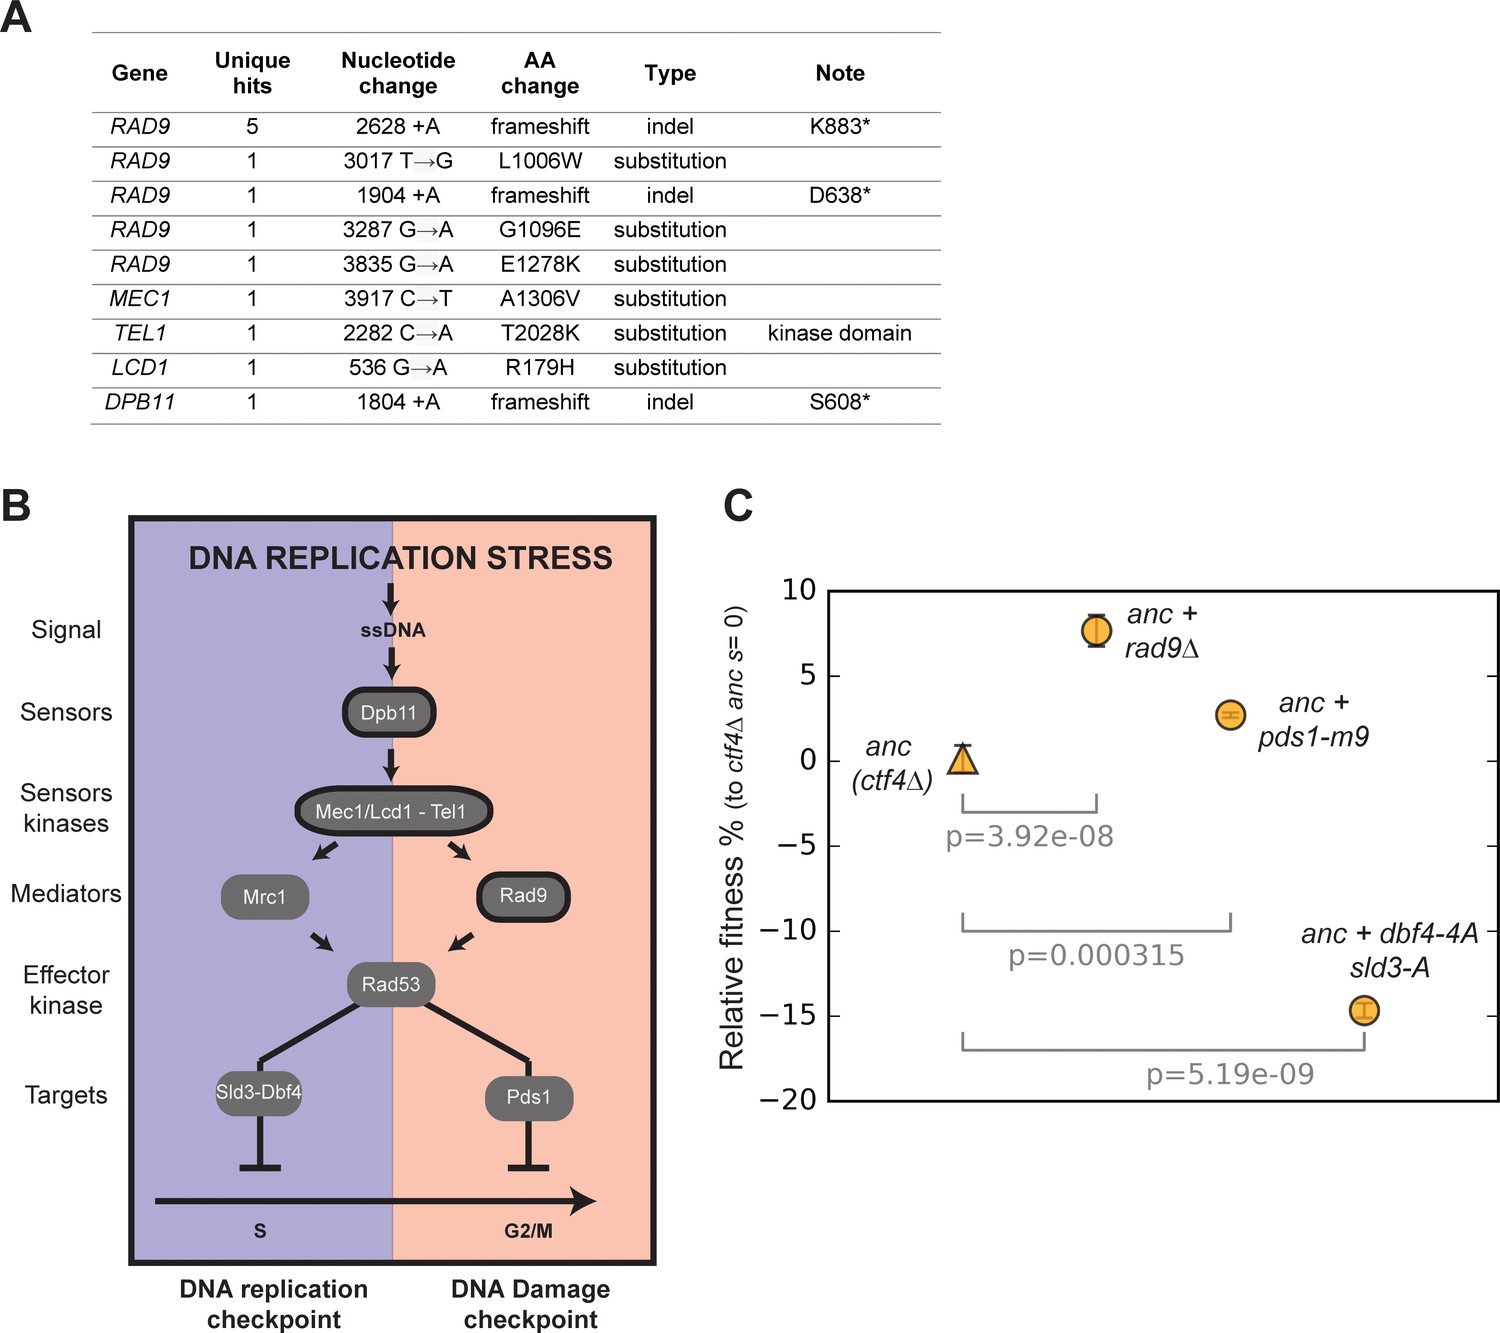
Figure 2—figure supplement 1
Mutations in checkpoint genes.
(A) Mutations affecting components of the DNA damage checkpoint that were found in evolved clones. (B) Schematic representation of the checkpoint signaling cascade induced by DNA replication stress. In blue (left) the DNA replication checkpoint, which delays S phase by phosphorylating Sld3 and Dbf4. In red (right) the DNA damage checkpoint, which induces a mitotic delay by phosphorylating Pds1. Factors highlighted in bold were found mutated in evolved lines. Some of the checkpoint factors (in the middle of the panel) play a role in both checkpoint responses, although this double role is likely not exerted simultaneously and may depend on the dynamics of the upstream checkpoint reactions. (C) The fitness of ancestral ctf4∆ strains carrying mutations affecting the DNA replication checkpoint signaling cascade at different levels, relative to the ctf4Δ ancestor (s = 0). Error bars represent standard deviations.
Figure 3 with 3 supplements
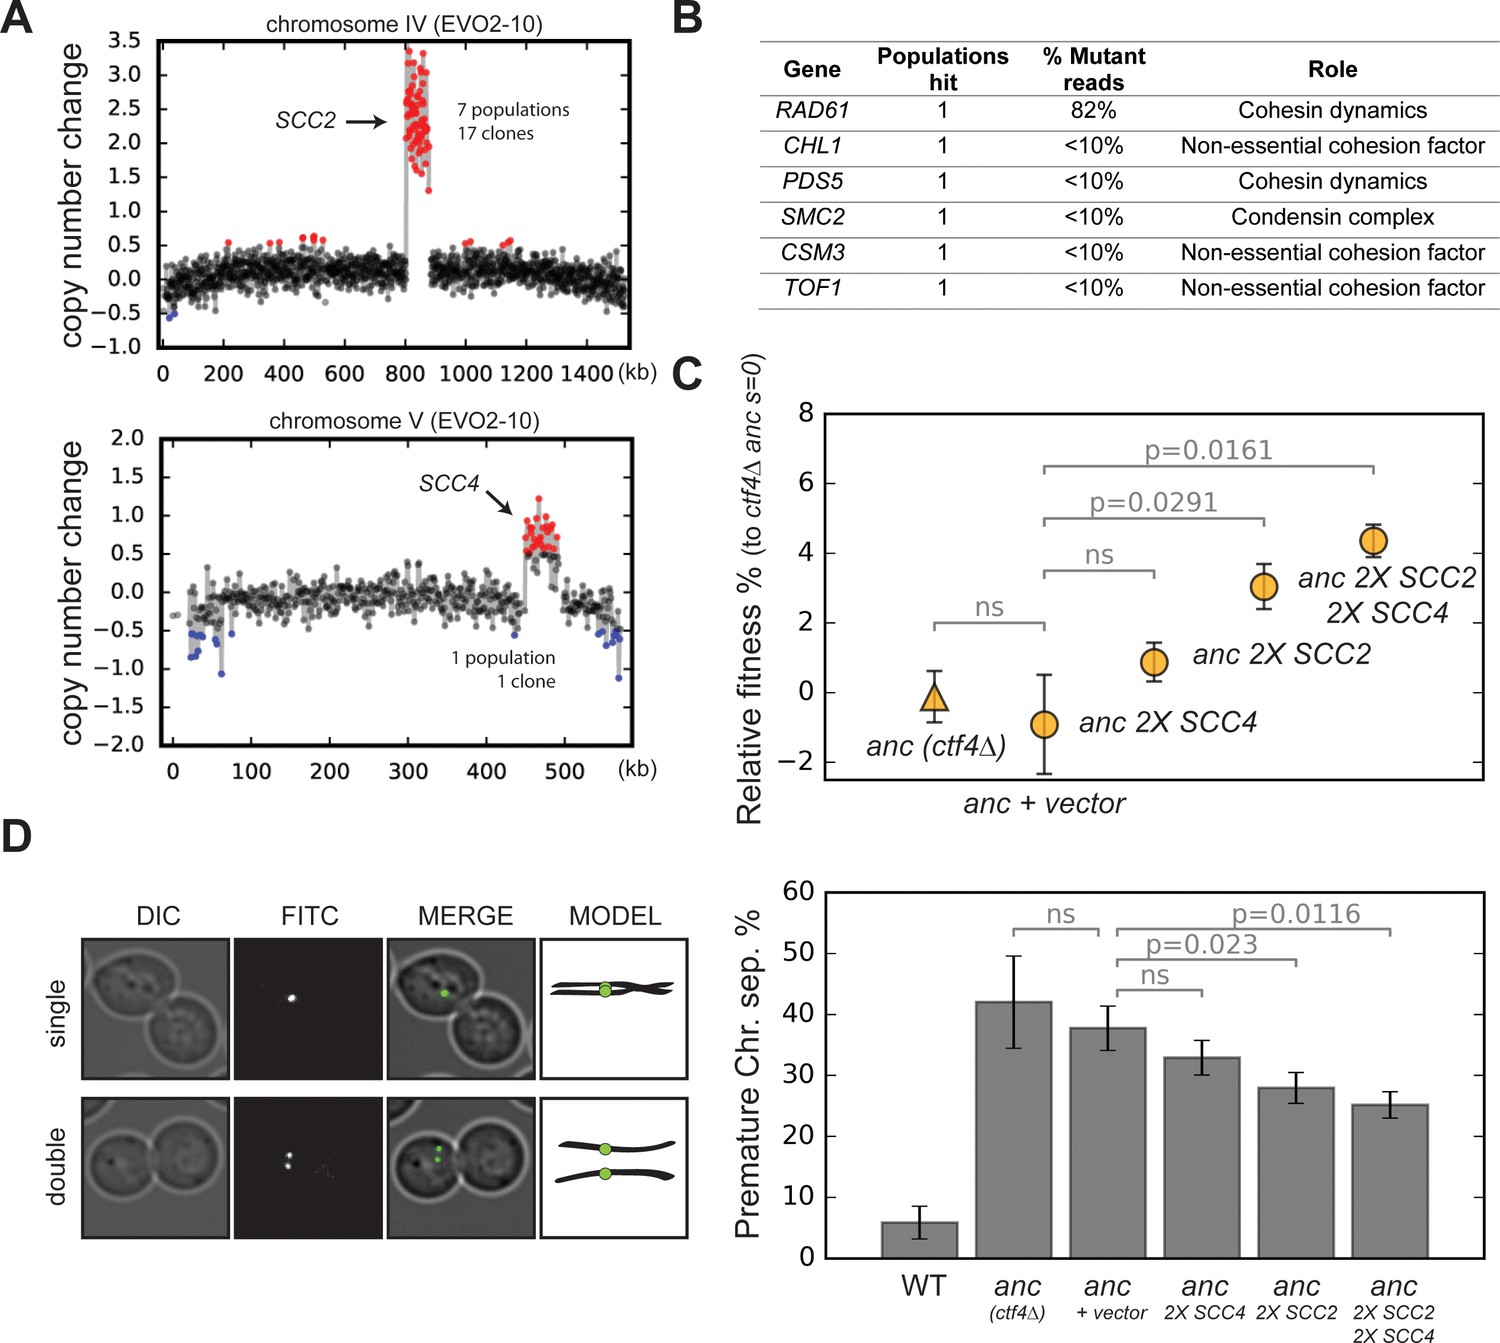
Amplification of cohesin loader genes.
(A) Copy number variations (CNVs) affecting chromosome IV and chromosome V in clone EVO2-10. Copy number change refers to the fragment’s gain or loss during the evolution experiment (i.e. +1 means that one copy was gained). Red highlights gains, blue highlights losses. (B) List of genes involved in chromosome segregation that were mutated in evolved clones, and their respective role in the process. ‘populations hit’ is the number of populations where the gene was found mutated. ‘% Mutant reads’ was calculated as the average of the mutant read frequencies in the different populations where the mutation was detected. (C) Fitness of ancestral, ctf4∆ strains that carry chromosomally integrated extra copies of cohesin loader genes, relative to the ctf4Δ ancestor (s = 0). Error bars represent standard deviations. (D) Premature chromatid separation assay: Cells which contained a chromosome marked by a GFP dot (Lac repressor-GFP binding to an array of LacO sites) were arrested in metaphase and visualized under the microscope. The number of dots reports on premature sister chromatid separation. Two sister chromatids that are still linked to each other produce a single fluorescent dot (single, left panel), while cells whose sister chromatids have separated contain two distinguishable dots (double, left panel). Quantitation of premature sister chromatid separation in cells carrying extra copies of cohesin loader genes (right panel).
-
Figure 3—source data 1
Numerical values corresponding to the graph in panel C.
- https://cdn.elifesciences.org/articles/51963/elife-51963-fig3-data1-v2.xlsx
-
Figure 3—source data 2
Numerical values corresponding to the graph in panel D.
- https://cdn.elifesciences.org/articles/51963/elife-51963-fig3-data2-v2.xlsx
Figure 3—figure supplement 1
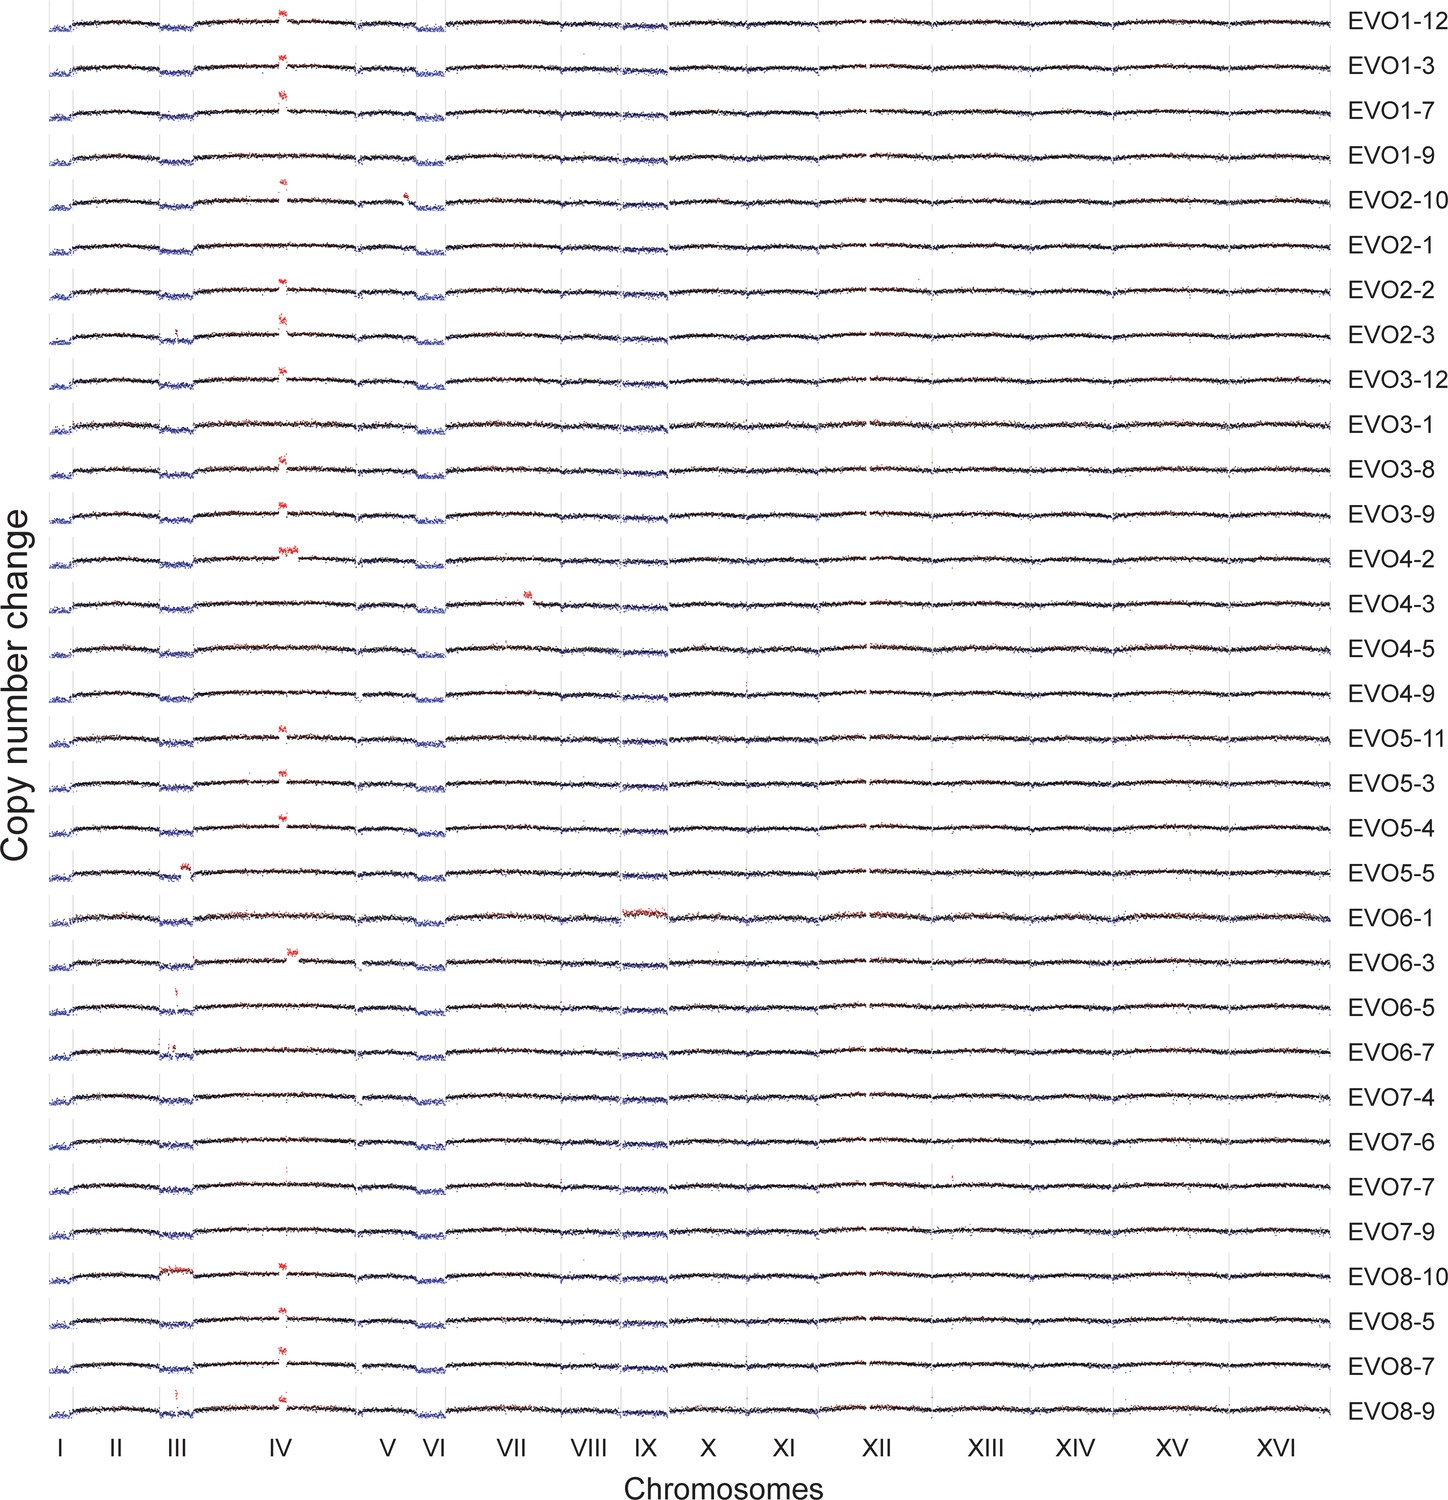
CNVs affecting the genome of the 32 isolated evolved clones.
Red highlights gains, blue highlights losses. Note that the aneuploidies affecting chromosome I, III, VI and IX, all of which are small chromosomes, may be due to the altered ancestral karyotype. We retrospectively found that ancestral ctf4Δ clones carried extra copies of these chromosomes, likely caused by chromosome mis-segregation acquired during strain construction or the initial pre-culture. Many evolved clones lose one of the two copies of these chromosomes during evolution arguing that aneuploidy for these chromosomes does not confer a long-term fitness advantage.
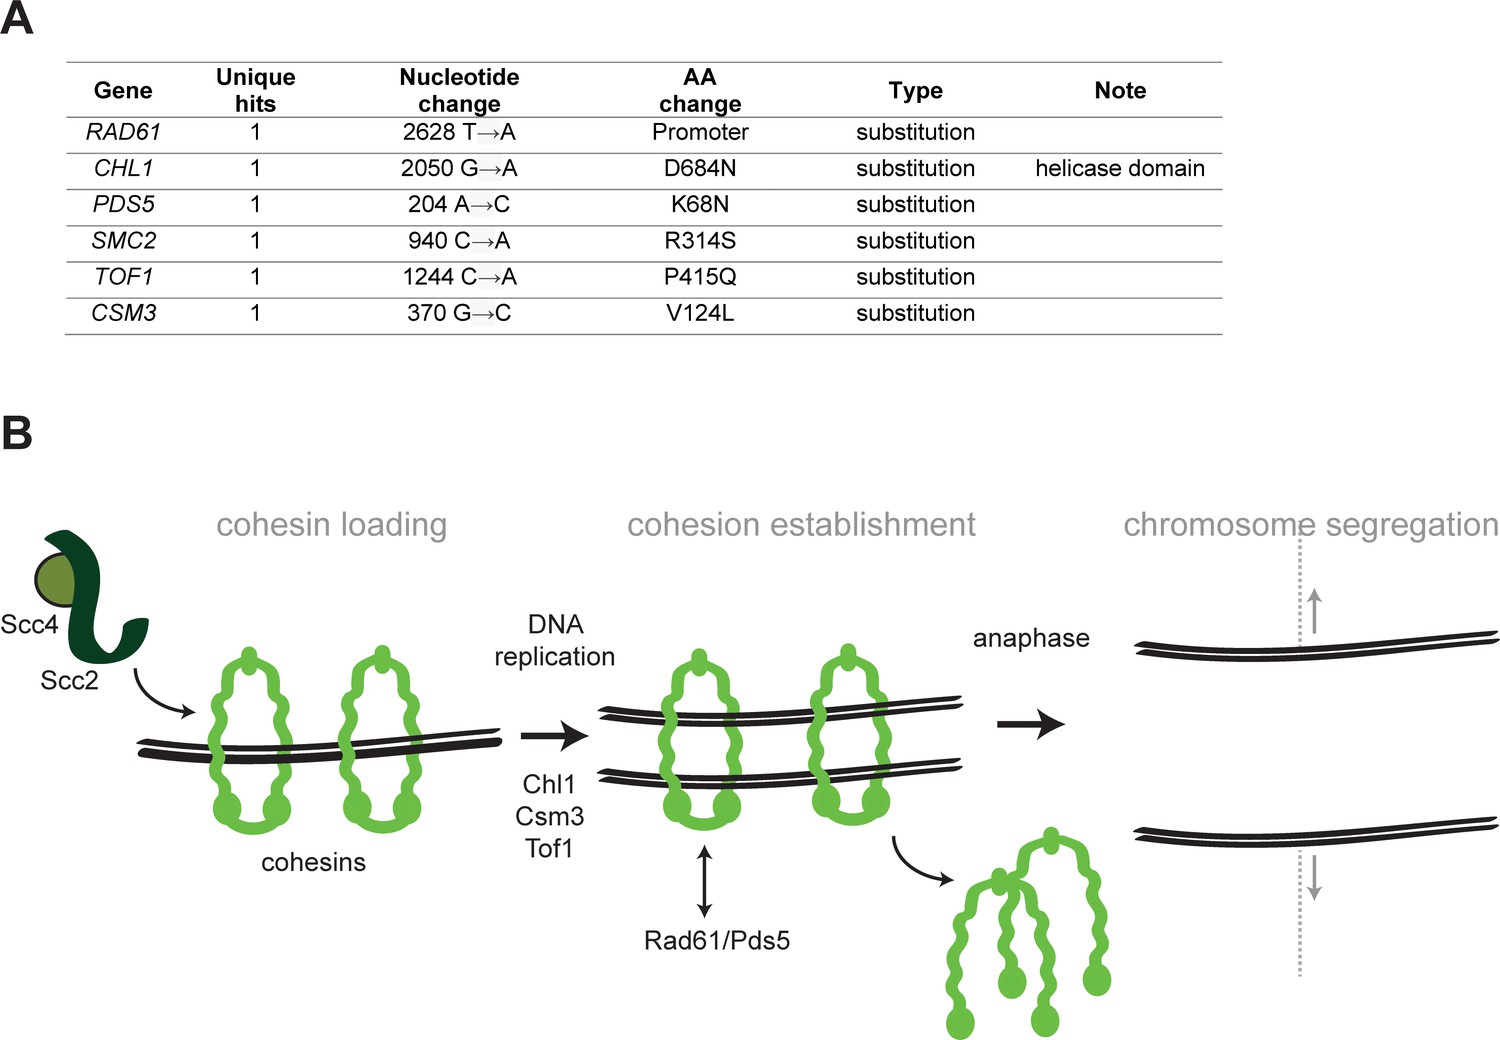
Figure 3—figure supplement 2
Mutations affecting chromosome segregation.
(A) Mutations affecting genes implicated in chromosome segregation that were found in evolved clones. (B) Schematic representation of cohesion establishment: the cohesin loading complex (Scc2-Scc4) loads the cohesin ring onto chromosome in G1. With the passage of the replisomes during DNA replication, cohesion between sister chromatids is established. At the onset of anaphase, cohesin is cleaved to allow cells entering anaphase and segregating the chromosomes. Proteins whose genes were mutated in evolved strains are indicated next to the steps where they are believed to act.
Figure 3—figure supplement 3

SCC2/4 amplification in EVO2.
(A) CNVs affecting chromosome IV and V were detected by sequencing the EVO2 population (upper panel) or individual clones isolated at generation 1000 (lower panel). Purple squares highlight the segmental amplifications on chromosome IV affecting SCC2, the orange circle highlights the segmental amplification on chromosome V affecting SCC4 in clone EVO2-10. (B) Proposed phylogenetic tree for clones isolated from EVO2 population. Purple lines represent clones carrying SCC2 amplification, orange line represents the additional amplification of SCC4. The tree was derived by parsimony considering the presence or absence of CNVs (panel A), and other shared mutations detected in the isolated clones (Supplementary file 1). Note that the segmental amplification of SCC4 on chromosome V cannot be observed from the population sequencing (panel A) since clone EVO2-10 only represent a limited fraction of the cells (estimated by the abundance of EVO2-10 variants in the EVO2 deep sequencing results, Supplementary file 1).
Figure 4 with 4 supplements
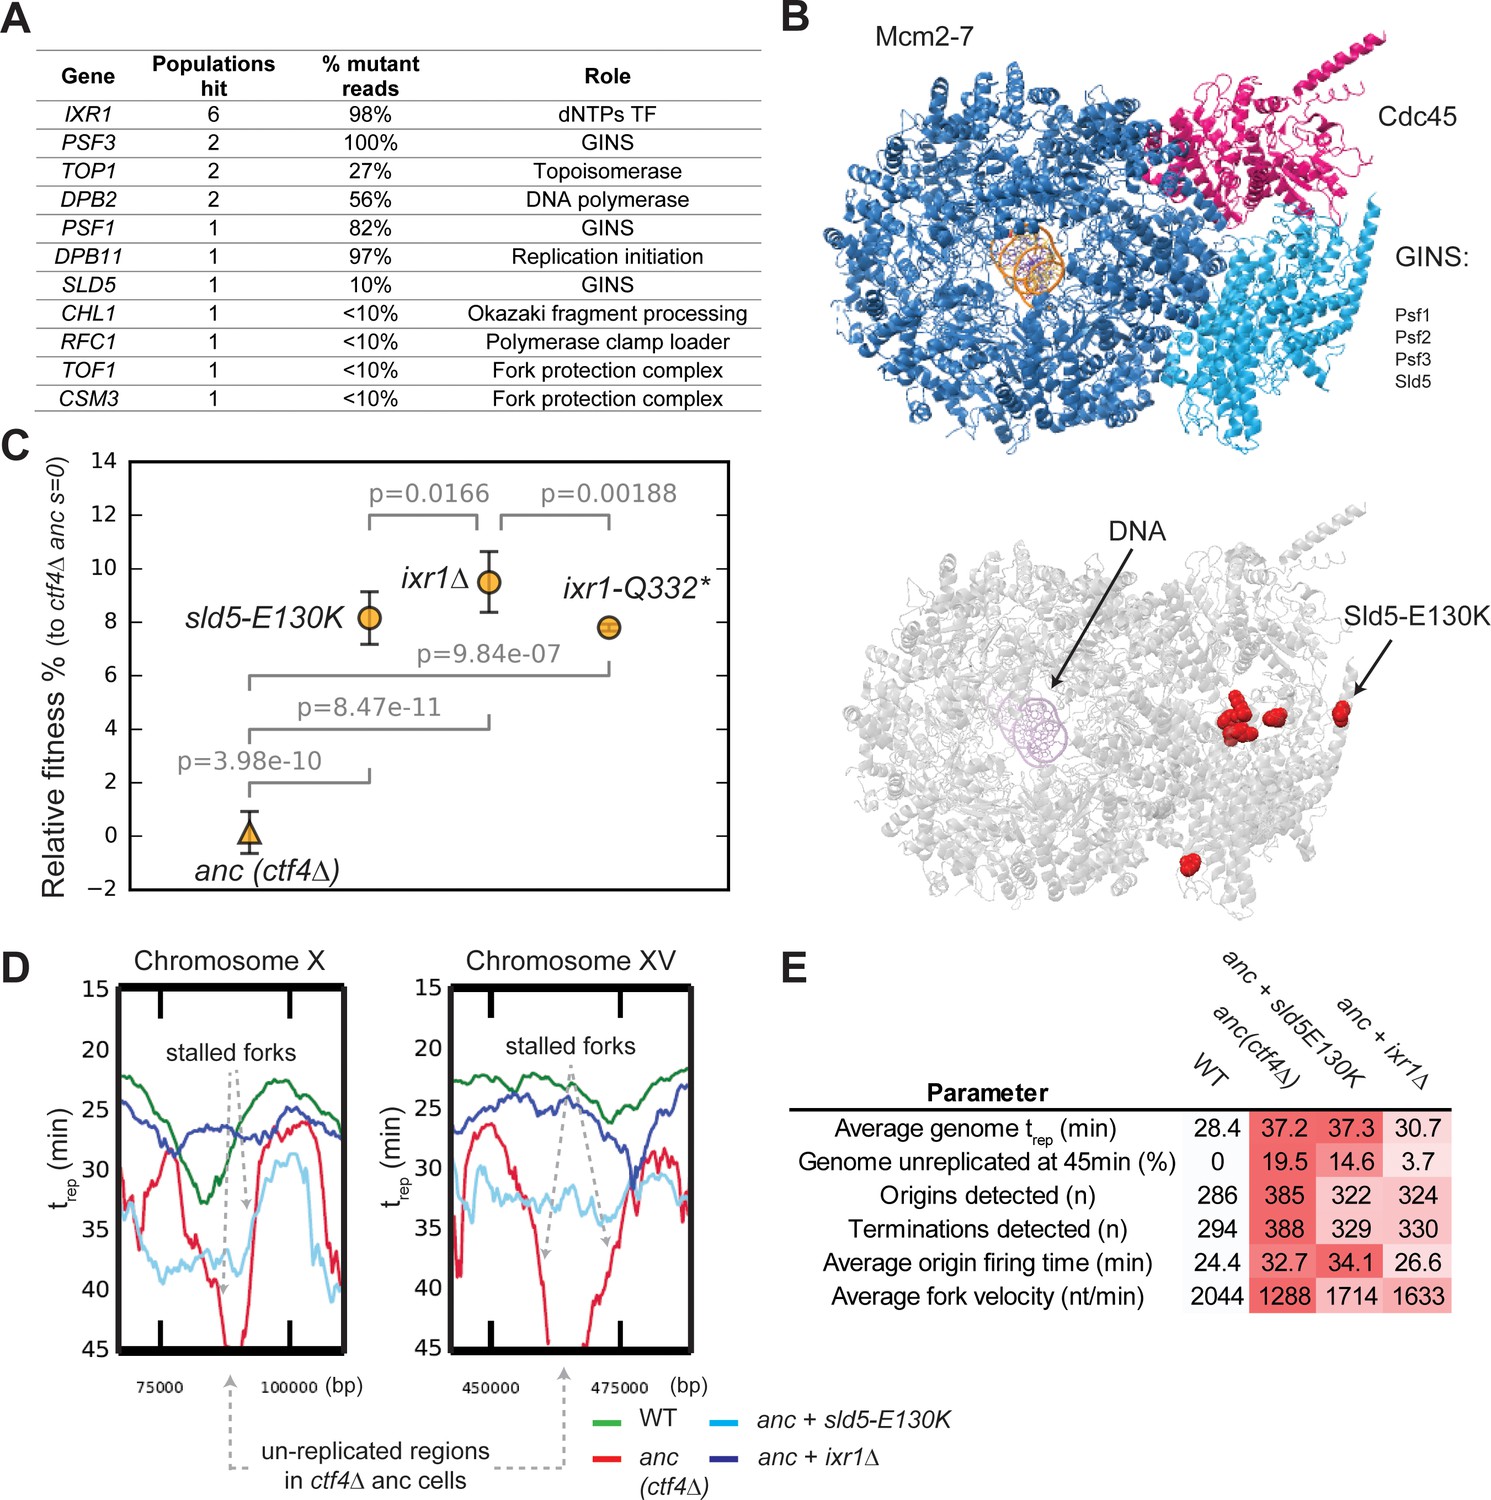
Adaptive mutations change DNA replication dynamics.
(A) Genes involved in DNA replication that were mutated in evolved clones, and their role in replication. ‘populations hit’ is the number of populations where the gene was found mutated. ‘% Mutant reads’ was calculated as the average of the mutant read frequencies in the different populations where the mutation was detected. (B) Structure of the CMG helicase (PDB:5u8s, upper panel) highlighting the catalytic subunits (Mcm2-7) and the regulatory subunits (Cdc45 and GINS). Red spheres represent the residues affected by mutations found in evolved clones (lower panel). (C) The fitness of ctf4∆ strains carrying reconstructed mutations in the replicative helicase (sld5-E129K) and in IXR1 (ixr1∆ and ixr1-Q332*) relative to the ctf4Δ ancestor (s = 0). Error bars represent standard deviations. (D) DNA replication profiles: cells were arrested in G1 and released into a synchronous S-phase, taking samples every 15 min for whole genome sequencing analysis. Change in DNA copy number over time were analyzed and used to calculate trep (time at which 50% of the cells in the population have replicated a given region (Figure 4—figure supplement 3, see material and methods for details). Snapshots of regions from chromosome X and XV are shown as examples, highlighting the presence of stalled forks and unreplicated regions in ctf4∆ cells (which are absent in strains that also carry sld5-E130K or ixr1∆ mutations). (E) Quantitative analysis of DNA replication. Each parameter was derived from the genome-wide DNA replication profile of each sample (Figure 4—figure supplement 3, see material and methods for details). Heatmaps refer to the severity of the defect (white = wt, red = ctf4Δ ancestor).
-
Figure 4—source data 1
Numerical values corresponding to the graph in panel C.
- https://cdn.elifesciences.org/articles/51963/elife-51963-fig4-data1-v2.xlsx
Figure 4—figure supplement 1
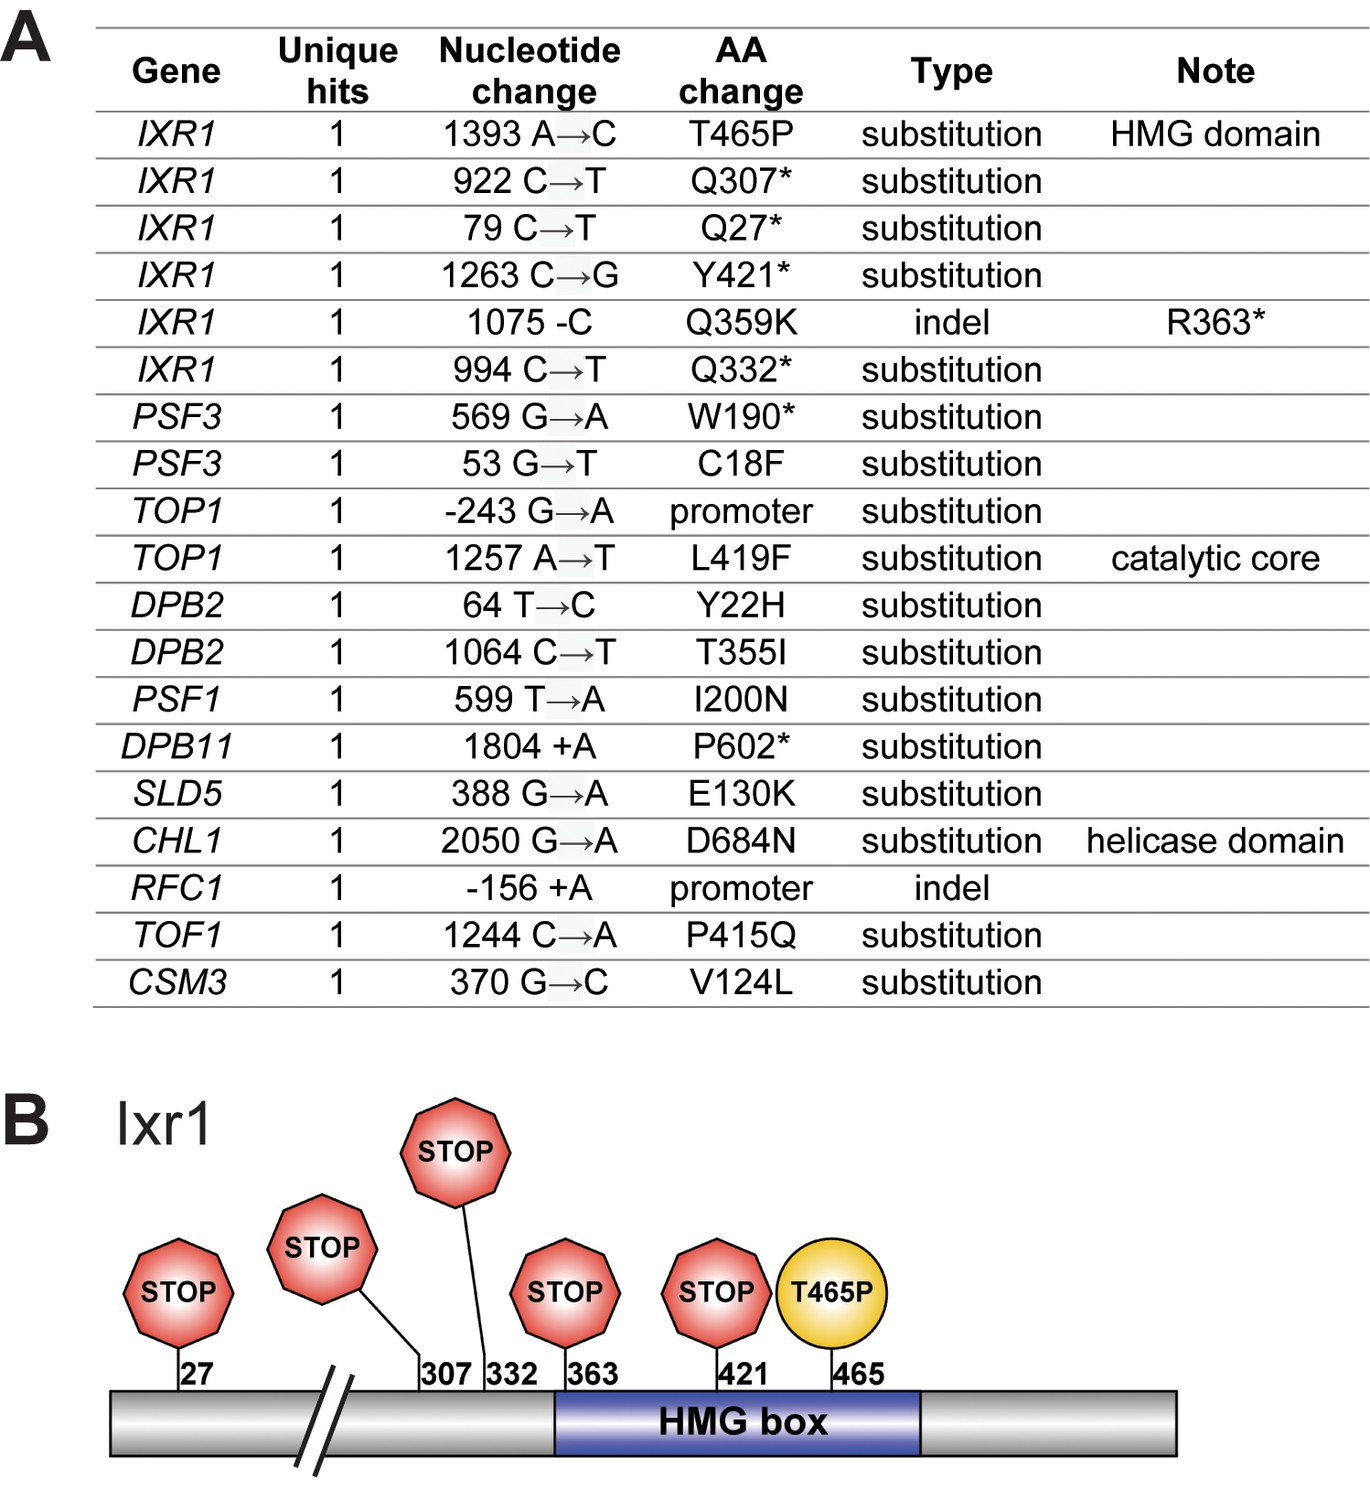
Mutations affecting DNA replication.
(A) Mutations affecting genes implicated in DNA replication that were found in evolved clones. (B) Mutations affecting Ixr1 found in evolved clones. Note that one stop codon (Q332*) resulted from an upstream frameshift.
Figure 4—figure supplement 2
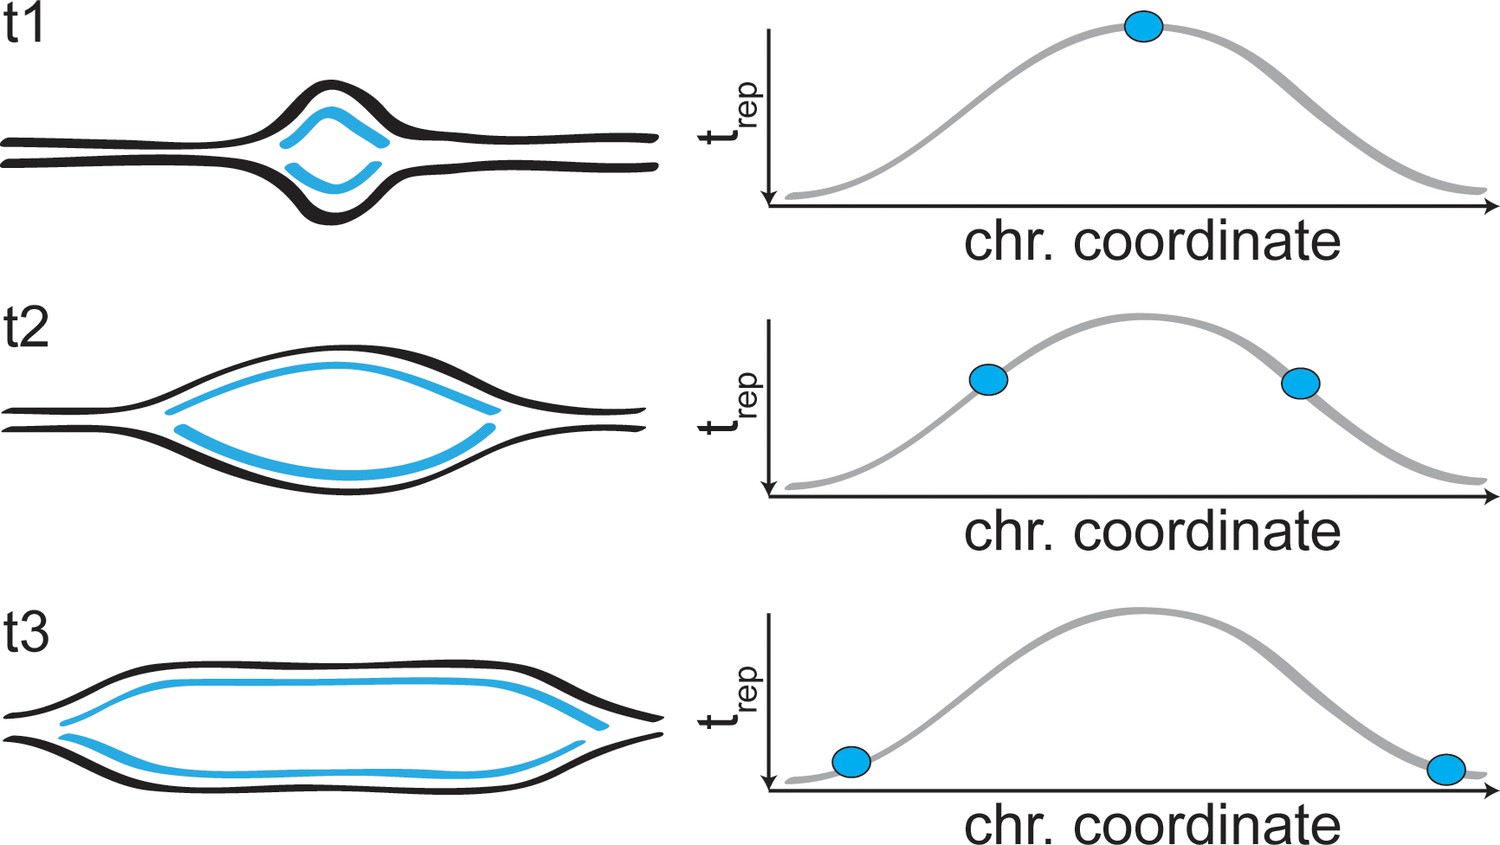
Forks progression in DNA replication profiles.
Schematic representation of the two replication forks arising from an origin of replication, and the signal they generate in the replication profiles.
Figure 4—figure supplement 3
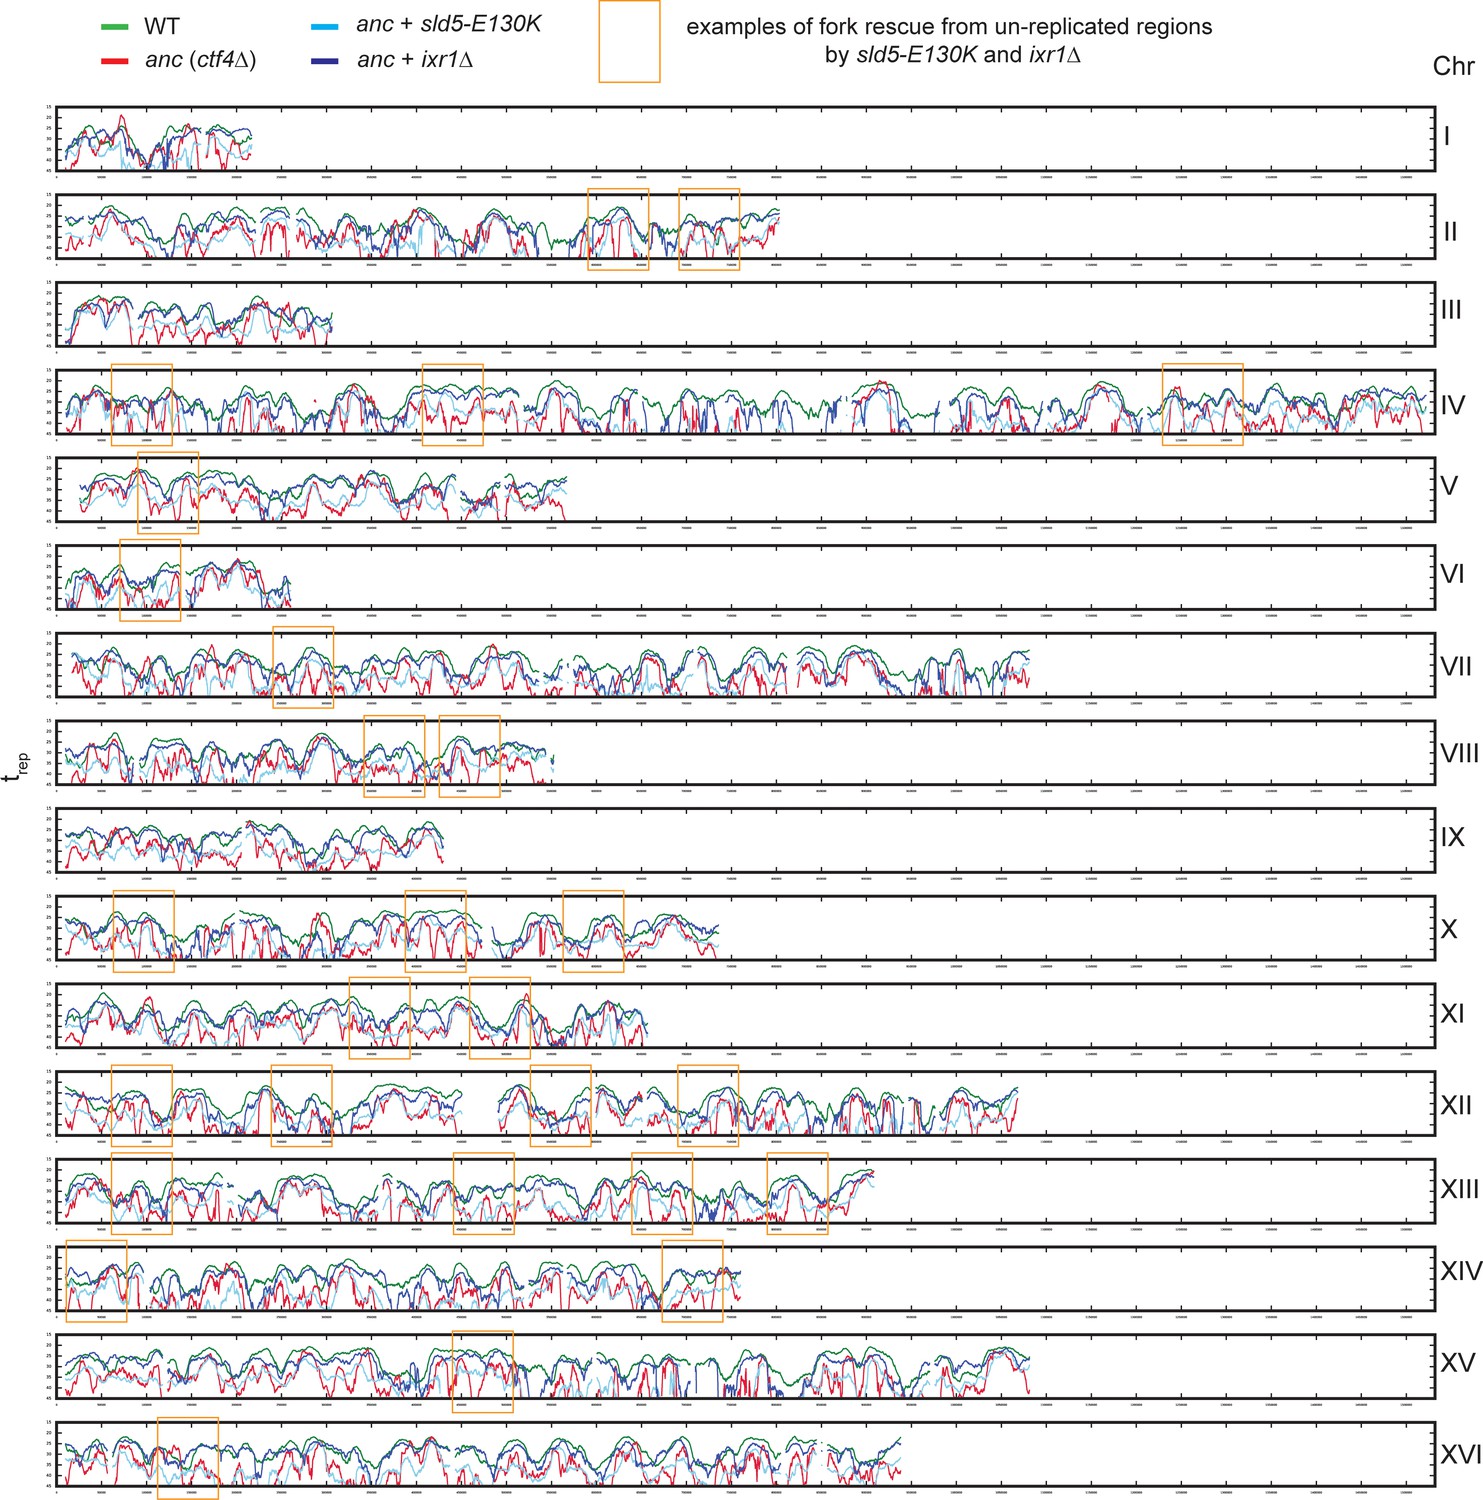
DNA replication profiles.
Genome-wide DNA replication profiles of wt, the ctf4∆ ancestor, and two double mutant strains: ctf4Δ sld5-E130K and ctf4Δ ixr1Δ. trep refers to the time at which 50% of the cells in the population have replicated a region. trep was derived from the change in DNA copy numbers over time, measured by deep sequencing (see material and methods). Examples of fork rescue from un-replicated regions in ctf4∆ cells by sld5-E130K and ixr1Δ are highlighted in gold rectangles.
Figure 4—figure supplement 4
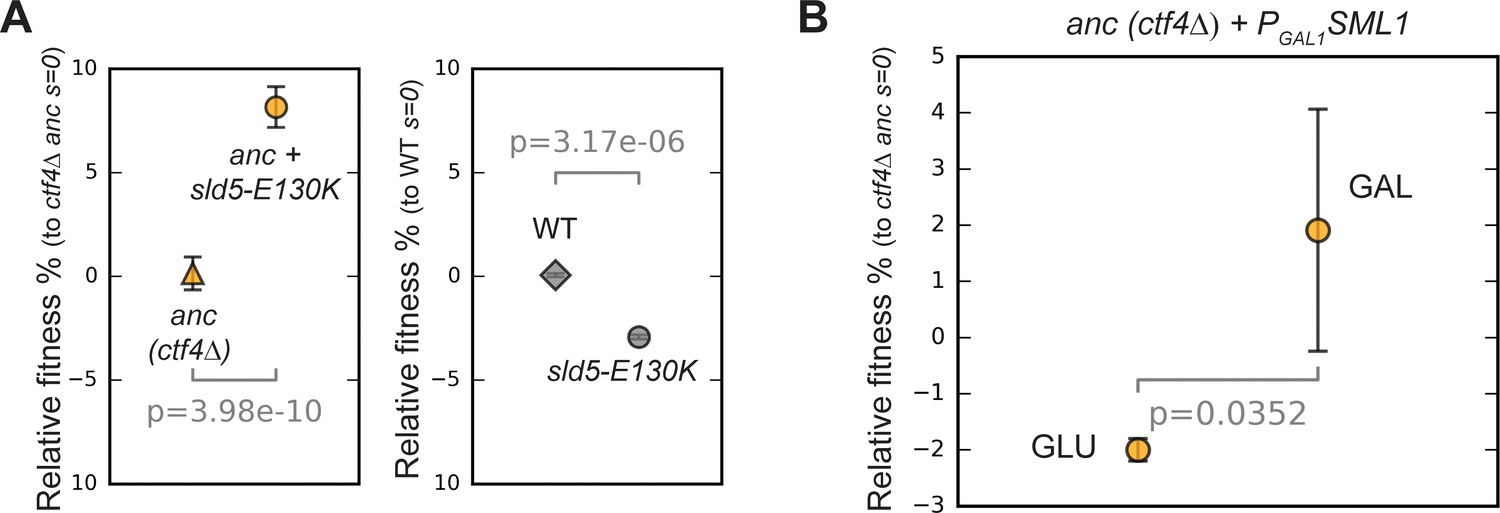
Effect of helicase mutations and dNTPs levels on fitness.
(A) Fitness effect of sld5-E130K on ctf4Δ ancestor cells (left panel) and on wt, CTF4 cells (right panel). The fitness measurements are relative to ctf4Δ and wt respectively. Error bars represent standard deviations. (B) Effect of altered levels on deoxyribonucleotide triphosphates (dNTPs) on ancestor cells. Error bars represent standard deviations. ctf4Δ ancestor cells carrying a conditional PGAL1-SML1 allele were used. Sml1 is an inhibitor of the ribonucleotide reductase, an enzyme essential for dNTP production. SML1 was expressed from the GAL1 promoter, that is inhibited by glucose and strongly activated by galactose. A ctf4Δ PGAL1-SML1 strain was pre-cultured in YP + 2% raffinose and then competed against a ctf4Δ reference strain either in YP + 2% glucose (left side), or in YP + 2% galactose 2% raffinose (right side). This should result in dNTP overproduction (glucose) and shortage (galactose).
-
Figure 4—figure supplement 4—source data 1
Numerical values corresponding to the graph in panel A.
- https://cdn.elifesciences.org/articles/51963/elife-51963-fig4-figsupp4-data1-v2.xlsx
-
Figure 4—figure supplement 4—source data 2
Numerical values corresponding to the graph in panel B.
- https://cdn.elifesciences.org/articles/51963/elife-51963-fig4-figsupp4-data2-v2.xlsx
Figure 5 with 2 supplements
Epistatic interaction and evolutionary dynamics.
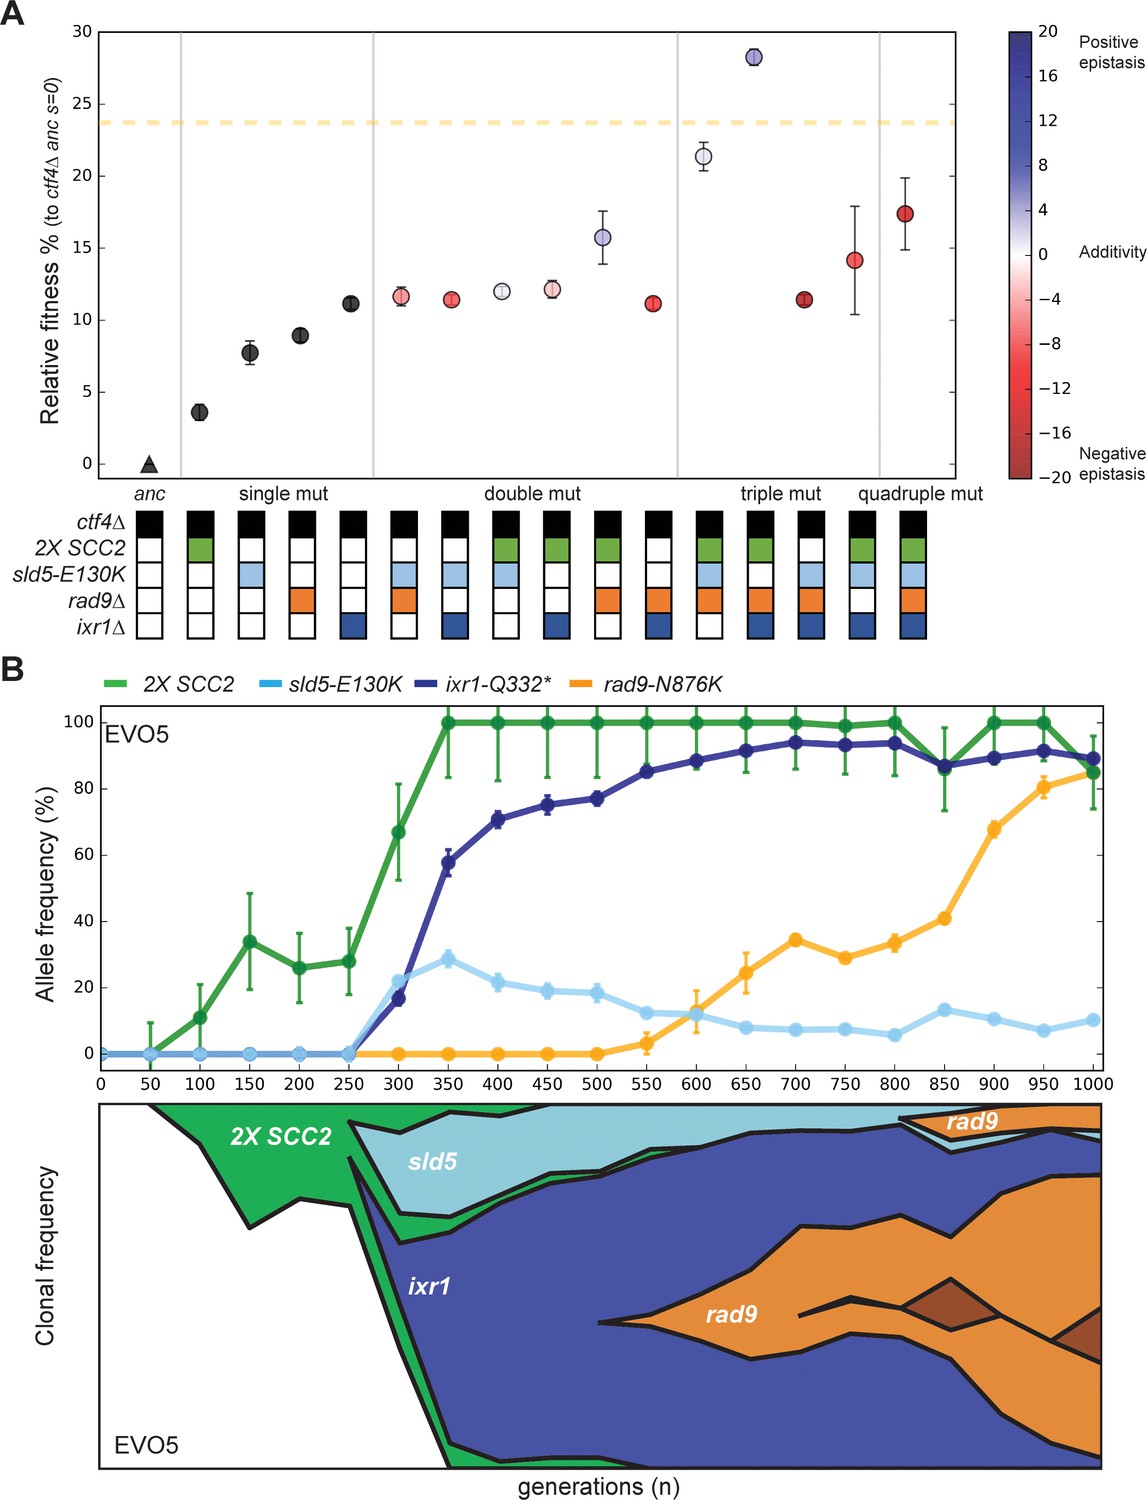
(A) Fitness of all possible combinations of four adaptive mutations in the ctf4Δ ancestral background. The fitness measurements are relative to ctf4Δ ancestors (s = 0). The dashed yellow line represents the average fitness of clones isolated from EVO5. Note that, unlike Figure 1C, fitness values are calculated relative to the ancestral ctf4Δ strain, and not to WT (hence the differences in absolute values, see material and methods). Error bars represent standard deviations. The fitnesses of individual strains are colored using the heatmap to the right of the figure, which represents epistasis: white = perfect additivity, red = negative epistasis (antagonism), blue = positive epistasis (synergy). Colors in the heatmap represent the deviation in percentage between the observed fitness and the one calculated by adding the fitness effects of the individual mutations. (B) The temporal spread of mutant alleles during the experimental evolution of population EVO5 (upper panel). Error bars represent standard deviations. Genomic DNA was extracted from population samples, mutated loci were PCR amplified and Sanger sequencing was used to measure allele ratios (upper panel). A Muller diagram representing the lineages evolving in population EVO5 (lower panel). Data was obtained by combining alleles frequencies with their linkage as revealed by whole genome sequencing of clones isolated from EVO5 (Figure 5—figure supplement 2 and Supplementary file 1).
-
Figure 5—source data 1
Numerical values corresponding to the graph in panel A.
- https://cdn.elifesciences.org/articles/51963/elife-51963-fig5-data1-v2.xlsx
-
Figure 5—source data 2
Numerical values corresponding to the graph in panel B (upper panel).
- https://cdn.elifesciences.org/articles/51963/elife-51963-fig5-data2-v2.xlsx
-
Figure 5—source data 3
Numerical values corresponding to the graph in panel B (lower panel).
- https://cdn.elifesciences.org/articles/51963/elife-51963-fig5-data3-v2.xlsx
Figure 5—figure supplement 1
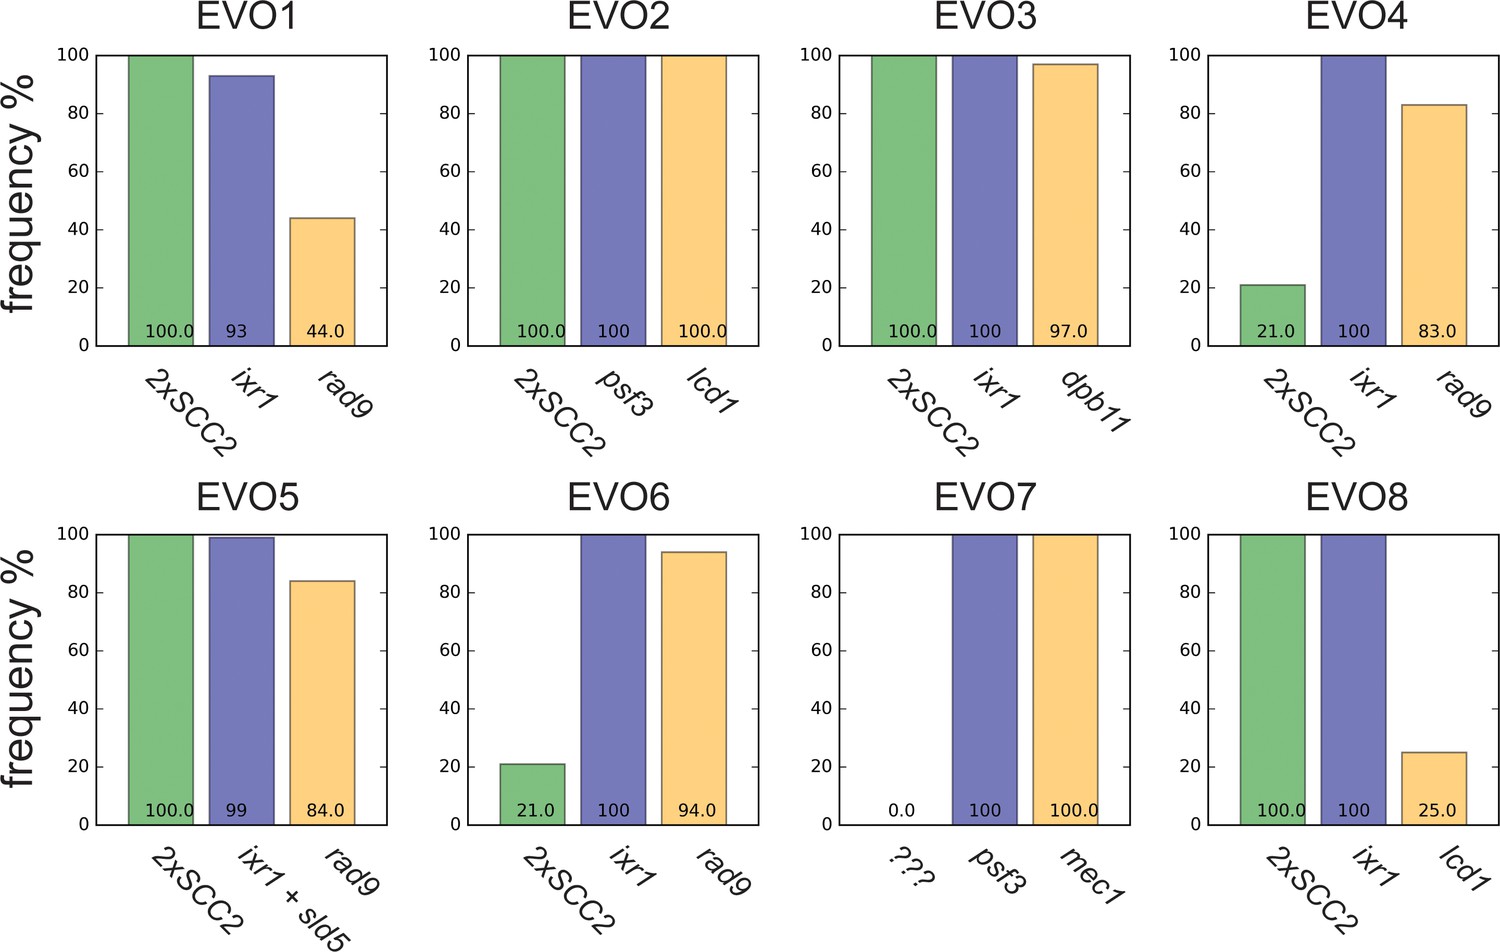
Reproducibility in evolutionary trajectories.
Frequencies of putative adaptive mutations in the cohesion (green), replication (blue) and checkpoint (orange) modules in the evolved populations at the conclusion of the experiment (generation 1000). The putative adaptive mutations were inferred based on results obtained for population EVO5. When the experimentally validated genes were not present, closely interacting genes were considered. Alleles frequencies in populations were obtained by deep sequencing of genomic DNA extracted from a population sample.
-
Figure 5—figure supplement 1—source data 1
Numerical values corresponding to the graphs.
- https://cdn.elifesciences.org/articles/51963/elife-51963-fig5-figsupp1-data1-v2.xlsx
Figure 5—figure supplement 2
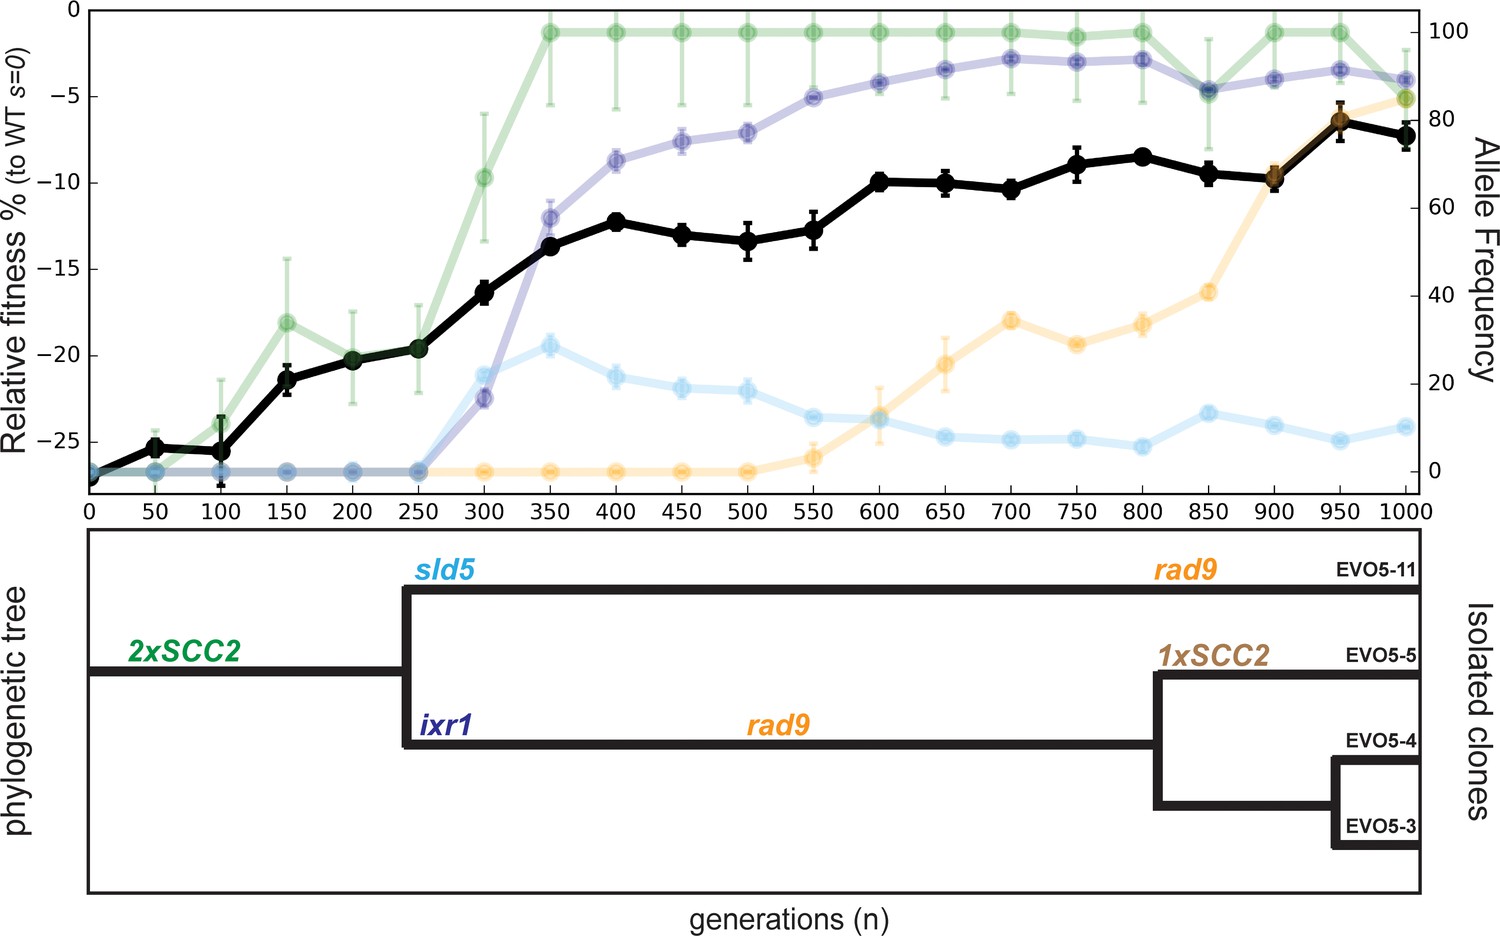
Evolutionary history of EVO5.
Fitness of population EVO5 relative to wt (s = 0) measured every 50 generations during the experiment (upper panel, dark plot, left y axis) with the frequency of mutant alleles included for reference (upper panel, faint plots, right x axis). Error bars represent standard deviations. Phylogenetic tree for clones isolated from population 5 (lower panel). Linkage was derived from analyzing whole genome sequences of the individual clones (Supplementary file 1), while branch length was inferred from the allele frequencies obtained by Sanger sequencing.
Figure 6
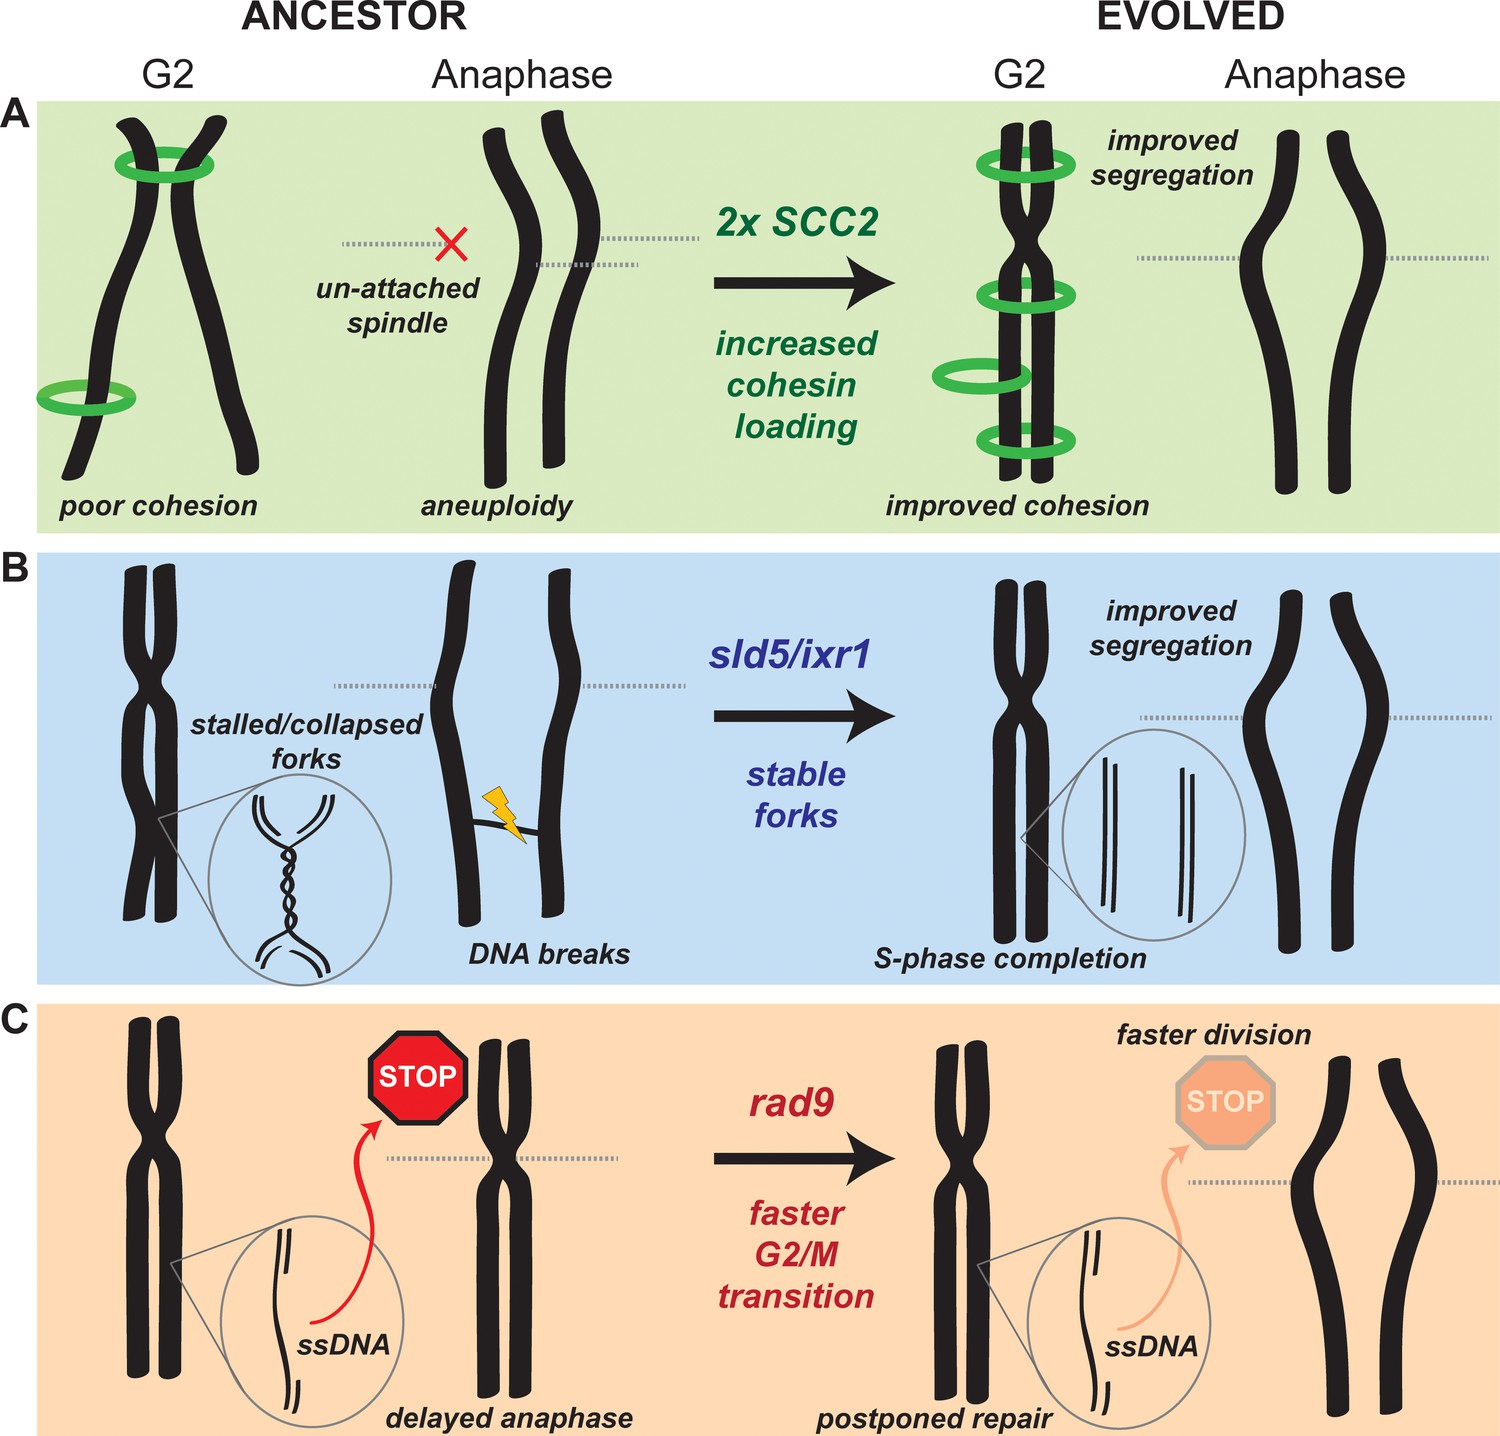
Mechanistic models of adaptation.
(A) Amplification of the cohesin loader subunit SCC2 increases cohesin loading and sister chromatid cohesion leading to accurate chromosome segregation (B) Mutations of the replicative helicase (sld5) or in ixr1 stabilize replication forks and ensure the completion of chromosome replication before anaphase. (C) Mutations in rad9 abolish the DNA damage checkpoint response triggered by stretches of single strand DNA (ssDNA) and allow faster cell division.
Tables
Key resources table
| Reagent type (species) or resource | Designation | Source or reference | Identifiers | Additional information |
|---|---|---|---|---|
| Strain, strain background (S. cerevisiae) | W303 | Murray lab | W1588 | The complete list of derived strains is available in Supplementary file 5 |
| Commercial assay or kit | Nextera DNA Library Prep (24 Samples) | Illumina | 15028212 | |
| Commercial assay or kit | Nextera Index kit (96 Indices) | Illumina | 15028216 | |
| Commercial assay or kit | High Sensitivity D1000 ScreenTape | Agilent | 5067–5584 | |
| Software, algorithm | Python | www.python.org | RRID:SCR_008394 | Custom pipelines available at github.com/marcofumasoni/Fumasoni_and_Murray_2019 |
| Software, algorithm | Fiji | fiji.sc | RRID:SCR_002285 |
Additional files
-
Supplementary file 1
Mutations detected in the evolved lines.
- https://cdn.elifesciences.org/articles/51963/elife-51963-supp1-v2.xlsx
-
Supplementary file 2
Putative adaptive mutations in evolved ctf4Δ strains.
- https://cdn.elifesciences.org/articles/51963/elife-51963-supp2-v2.xlsx
-
Supplementary file 3
Enriched GO terms among putative genes under positive selection in evolved ctf4Δ strains.
- https://cdn.elifesciences.org/articles/51963/elife-51963-supp3-v2.xlsx
-
Supplementary file 4
Chromosome features enriched in fork-stall zones in ctf4∆ cells.
- https://cdn.elifesciences.org/articles/51963/elife-51963-supp4-v2.xlsx
-
Supplementary file 5
Yeast strains used in the study.
- https://cdn.elifesciences.org/articles/51963/elife-51963-supp5-v2.xlsx
-
Supplementary file 6
Tables represented in figures.
- https://cdn.elifesciences.org/articles/51963/elife-51963-supp6-v2.docx
-
Transparent reporting form
- https://cdn.elifesciences.org/articles/51963/elife-51963-transrepform-v2.docx
Download links
A two-part list of links to download the article, or parts of the article, in various formats.
Downloads (link to download the article as PDF)
Open citations (links to open the citations from this article in various online reference manager services)
Cite this article (links to download the citations from this article in formats compatible with various reference manager tools)
The evolutionary plasticity of chromosome metabolism allows adaptation to constitutive DNA replication stress
eLife 9:e51963.
https://doi.org/10.7554/eLife.51963


