Cryo electron tomography with volta phase plate reveals novel structural foundations of the 96-nm axonemal repeat in the pathogen Trypanosoma brucei
- University of California, Los Angeles, United States
- McGill University, United States
Figures
Figure 1
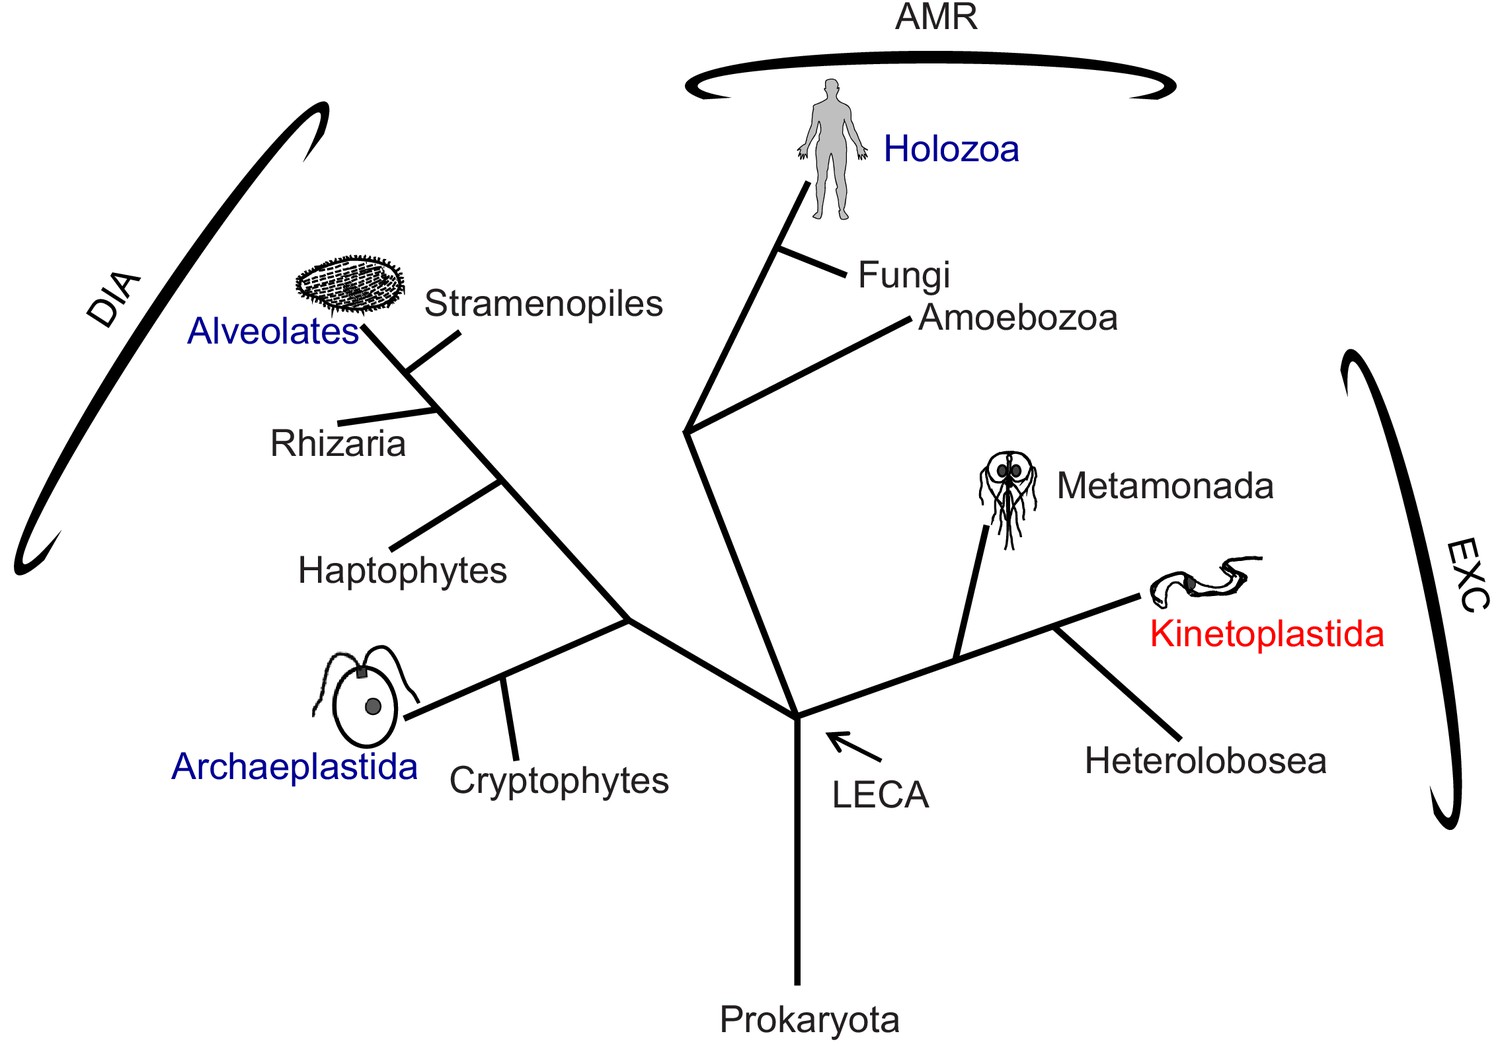
Phylogenetic tree of eukaryotes.
The tree is adapted from Dacks and Field (2018) and Adl et al. (2019). High-resolution structures of the 96-nm repeat of the axoneme are published for the clades indicated in blue, with the corresponding organism depicted in cartoon. T. brucei is in the clade Kinetoplastida, indicated in red, and represents the Excavates (EXC) that includes other pathogens, such as Giardia within Metamonada, also depicted in cartoon. The position of the last eukaryotic common ancestor (LECA) is indicated. AMR: Amorphea; DIA: Diaphoretickes; and EXC: Excavates are indicated.
Figure 2

Intact demembranated flagella from BSF T. brucei.
(A) A representative scanning electron microscope image of a procyclic form T. brucei parasite , with the cell body colored blue. The inset is a transmission electron microscope image of the flagellum from BSF T. brucei in representative transverse section, viewed from the proximal end, showing the 9+2 axoneme and PFR, enclosed within the flagellar membrane which is outlined by the yellow dotted line (adapted from Hill, 2003). (B–E) Negative stain TEM images of purified flagellum samples from BSF T. brucei, distributed on the grid with minimal clustering (B), showing that the axoneme and PFR are intact (C), with the basal body and pro-basal body on the proximal end (D), and a tapered tip at the distal end (E). The black box in (B) shows the approximate region chosen to image for cryoET. (F) Histogram of the length distribution of purified flagellum samples showing that the majority are full-length with a mean length of 25.2 microns (standard deviation = 3.5 microns). (G) A zero-degree tilted cryoEM image shows intact Axoneme, PFR and Ax-PFR connectors (arrows) from BSF T. brucei. (H–I) 6-A thick digital slice from a representative tomogram showing the sample in longitudinal (H) and the transverse (I) sections, with main structures labelled. Black line indicates one 96-nm axonemal repeat.
-
Figure 2—source data 1
Data for measurement of axoneme lengths in Figure 2, panel F.
- https://cdn.elifesciences.org/articles/52058/elife-52058-fig2-data1-v3.xlsx
Figure 3 with 4 supplements
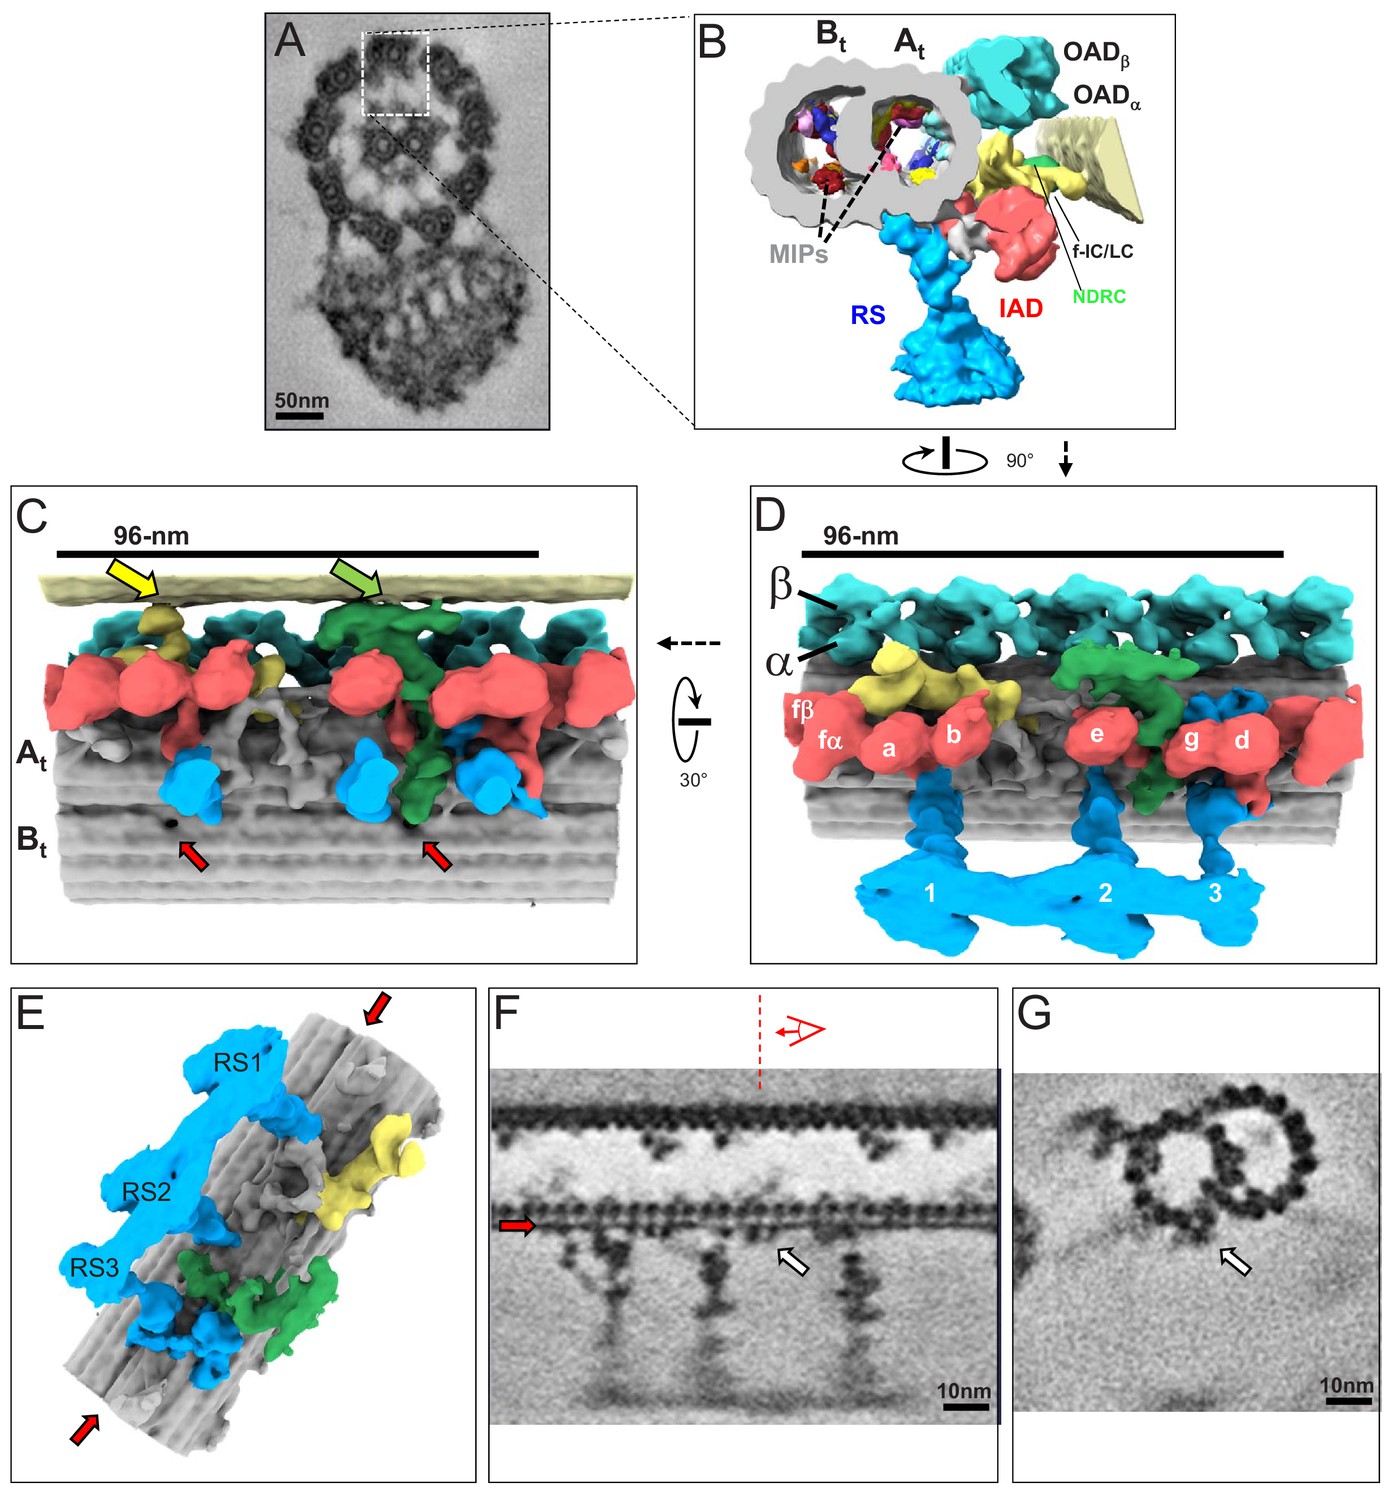
The 3D ultrastructure of the 96-nm repeat from intact axonemes of BSF T. brucei.
(A) A representative cross-section of a demembranated and negative-stained T. brucei flagellum, viewed from the proximal end (adapted from Hughes et al., 2012). Boxed region orients the view of the averaged 96-nm repeat along a DMT shown in B. (B) Cross-section view of the 96-nm repeat obtained by sub-tomogram averaging. Labeled are: the A- and B-tubule (At, Bt), Microtubule Inner Proteins (MIPs), Radial Spokes (RS), Inner Arm Dyneins (IAD), Nexin Dynein Regulatory Complex (NDRC), IAD-f-Intermediate Chain/Light Chain Complex (f-IC/LC), Outer Arm Dynein (OAD). The surface of the B-tubule from the adjacent DMT is visible on the right. The coloring scheme is as follows: cyan, OAD; red, IAD; blue, RS; green, NDRC; yellow, dynein f IC/LC. This scheme is consistently used throughout all main figures, figure supplements and videos unless stated otherwise. (C, D) Shaded surface rendering longitudinal views of the 96-nm repeat. Panel C shows the view from the center of the axoneme looking outward with the proximal end of the axoneme on the left and spoke heads removed for clarity (rotation relative to Panel D is shown). The surface of the B-tubule of the adjacent DMT is visible on top. Yellow and green arrows point to the inter-doublet connections formed by the f-connector and NDRC, respectively. Red arrows point to the proximal and distal holes in the inner junction between the A- and B-tubules. Panel D shows the view from the adjacent DMT, with proximal end of the axoneme on the left (rotation relative to panel B is shown). For reference, alpha (α) and beta (β) OAD are indicated, individual IADs and RS are labeled. (E) Shaded surface rendering of the averaged 96-nm repeat with the IAD, OAD and MIA complex removed, showing a massive structure at the base of the RS3 (see also Figure 3—figure supplement 1). Red arrows point to the density corresponding to the FAP59/172, 96-nm ruler (Oda et al., 2014a) between protofilaments A2 and A3. (F, G) Longitudinal (F) and transverse (G) density slices of the averaged 96-nm repeat. Red arrows in panels E and F point at the density of the FAP59/172 ruler between protofilaments A2 and A3. The red dashed line and perspective cartoon in panel F show the position and perspective of the cross-section shown in G, with the white arrow in panels F and G indicating the FAP59/172 ruler.
Figure 3—figure supplement 1
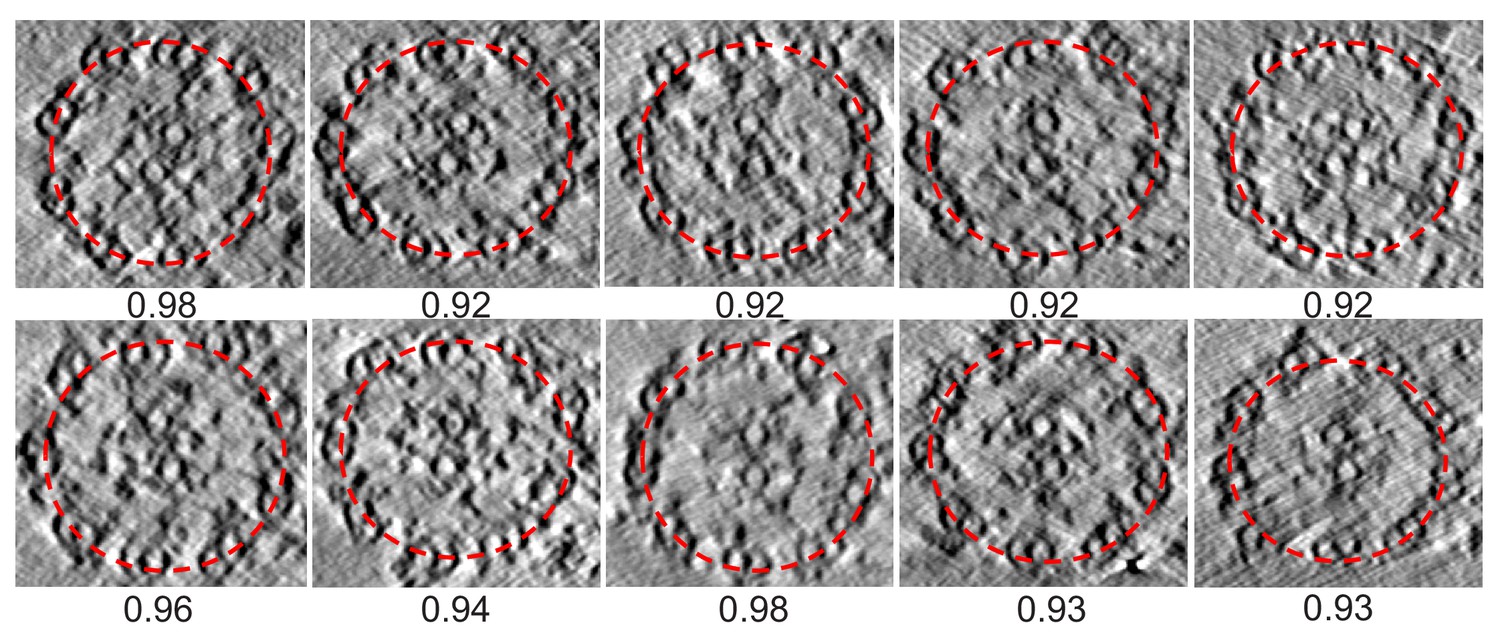
Cross sections of the ten tomograms used to obtain the entire averaged BSF 96-nm axonemal repeat structure.
[related to Figure 3]. Cross sections fitted with red dashed ellipses. The circularity, ratio of short axis/long axis of the ellipse, is given below each axoneme and ranges from 0.92 to 0.98.
Figure 3—figure supplement 2
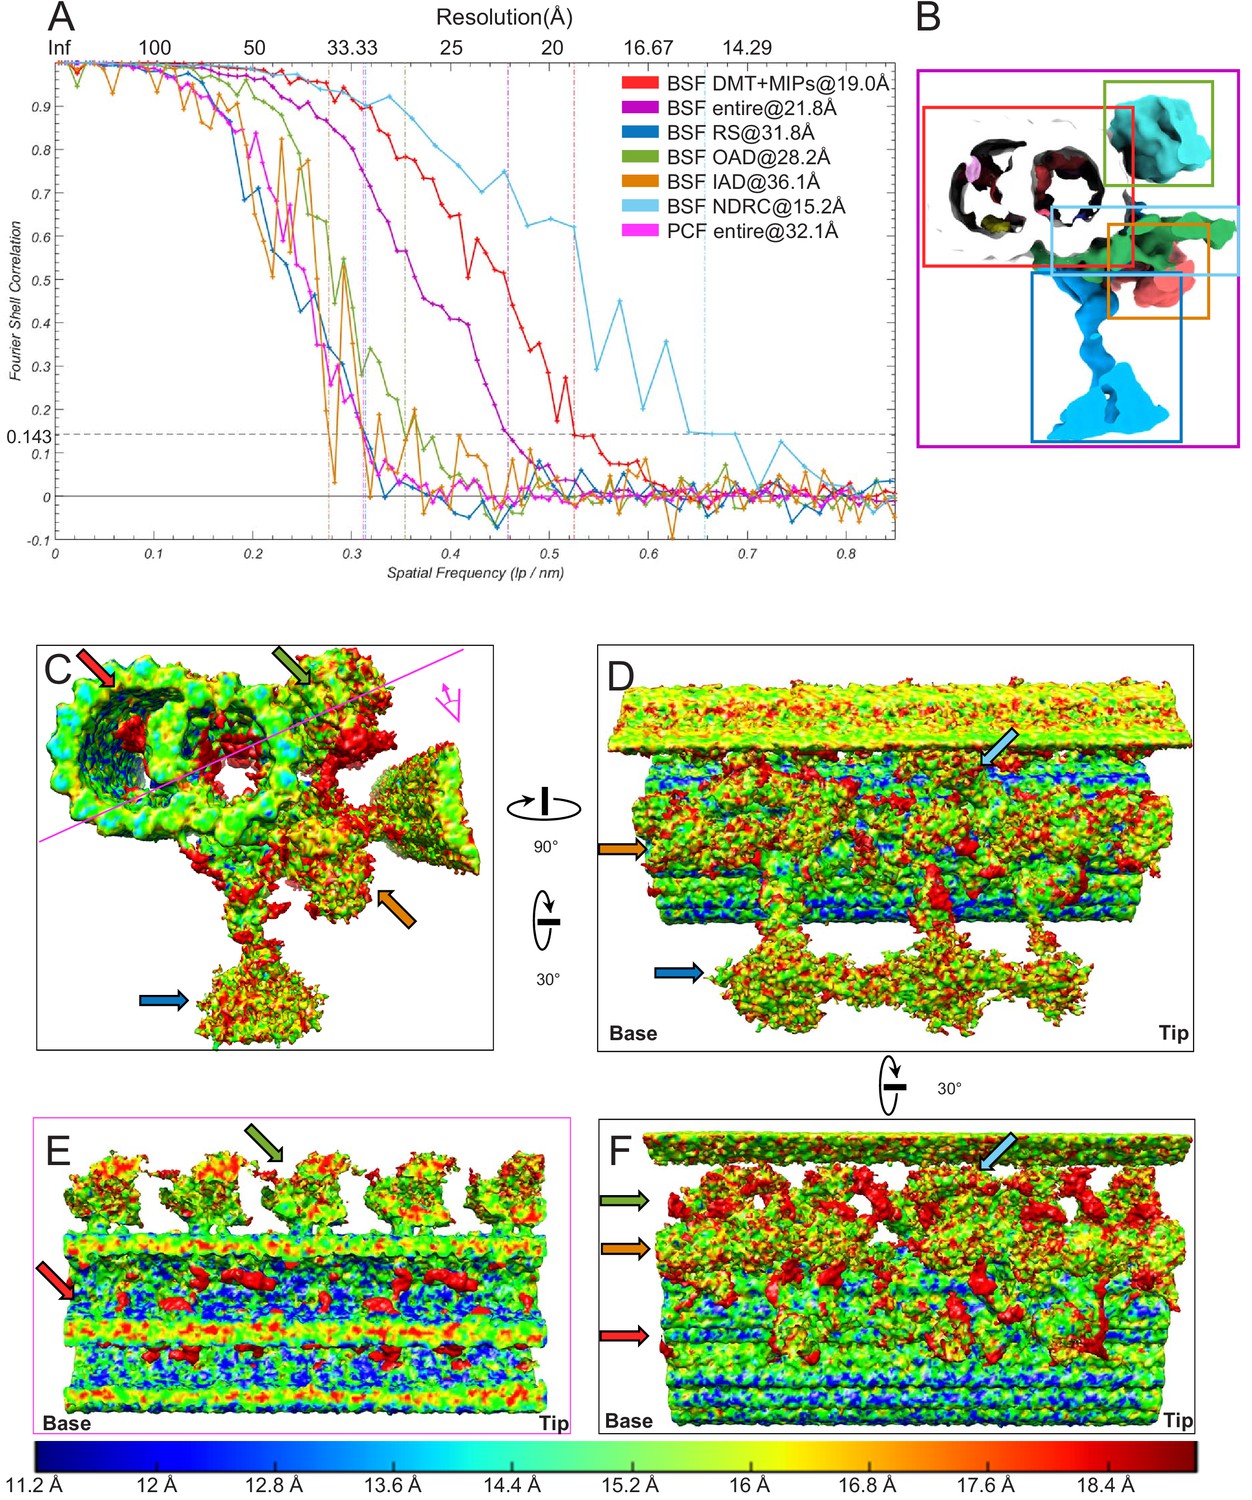
Gold Standard Fourier shell correlation (FSC) and ResMAP analyses.
(A) Fourier shell correlation (FSC) coefficients are plotted as a function of spatial frequency for sub-tomogram averages of the 96-nm axonemal repeats for either the entire maps of the BSF and PCF 96-nm repeat or the indicated local regions of the BSF 96-nm repeat. The resolutions based on the 0.143 criterion are indicated by vertical dashed lines. The FSC curve for some of the regions are rather ragged likely due to noisier densities and/or relative tight/small box used for selecting local regions. (B) Local regions used for FSC analysis in panel A. The local regions were cut using a cuboid containing primarily DMT with MIPs, or OAD, or IAD, or NDRC, or RS as illustrated by the colored rectangles. Note that each cuboid also contains residual densities from nearby structures. (C–F) Local resolution evaluation using the ResMap (Kucukelbir et al., 2014) program for the BSF structure shown in different views with local resolutions indicated in the bottom color bar. Colored arrows indicate different local regions used for local FSC calculation in panel A. Red = BSF DMT with MIPs, Purple = BSF entire 96-nm repeat, Blue = BSF RS, Green = BSF OAD, Brown = BSF IAD, Cyan = BSF NDRC and Pink = PCF entire 96-nm repeat. The views in C, D, F correspond roughly to Figure 3B,D,C respectively. Pink line in panel C indicates section and viewing perspective shown in panel E. The proximal (base) and distal (tip) ends of the axoneme are indicated and rotation of panel D relative to C and of panel F relative to D is shown.
Figure 3—figure supplement 3
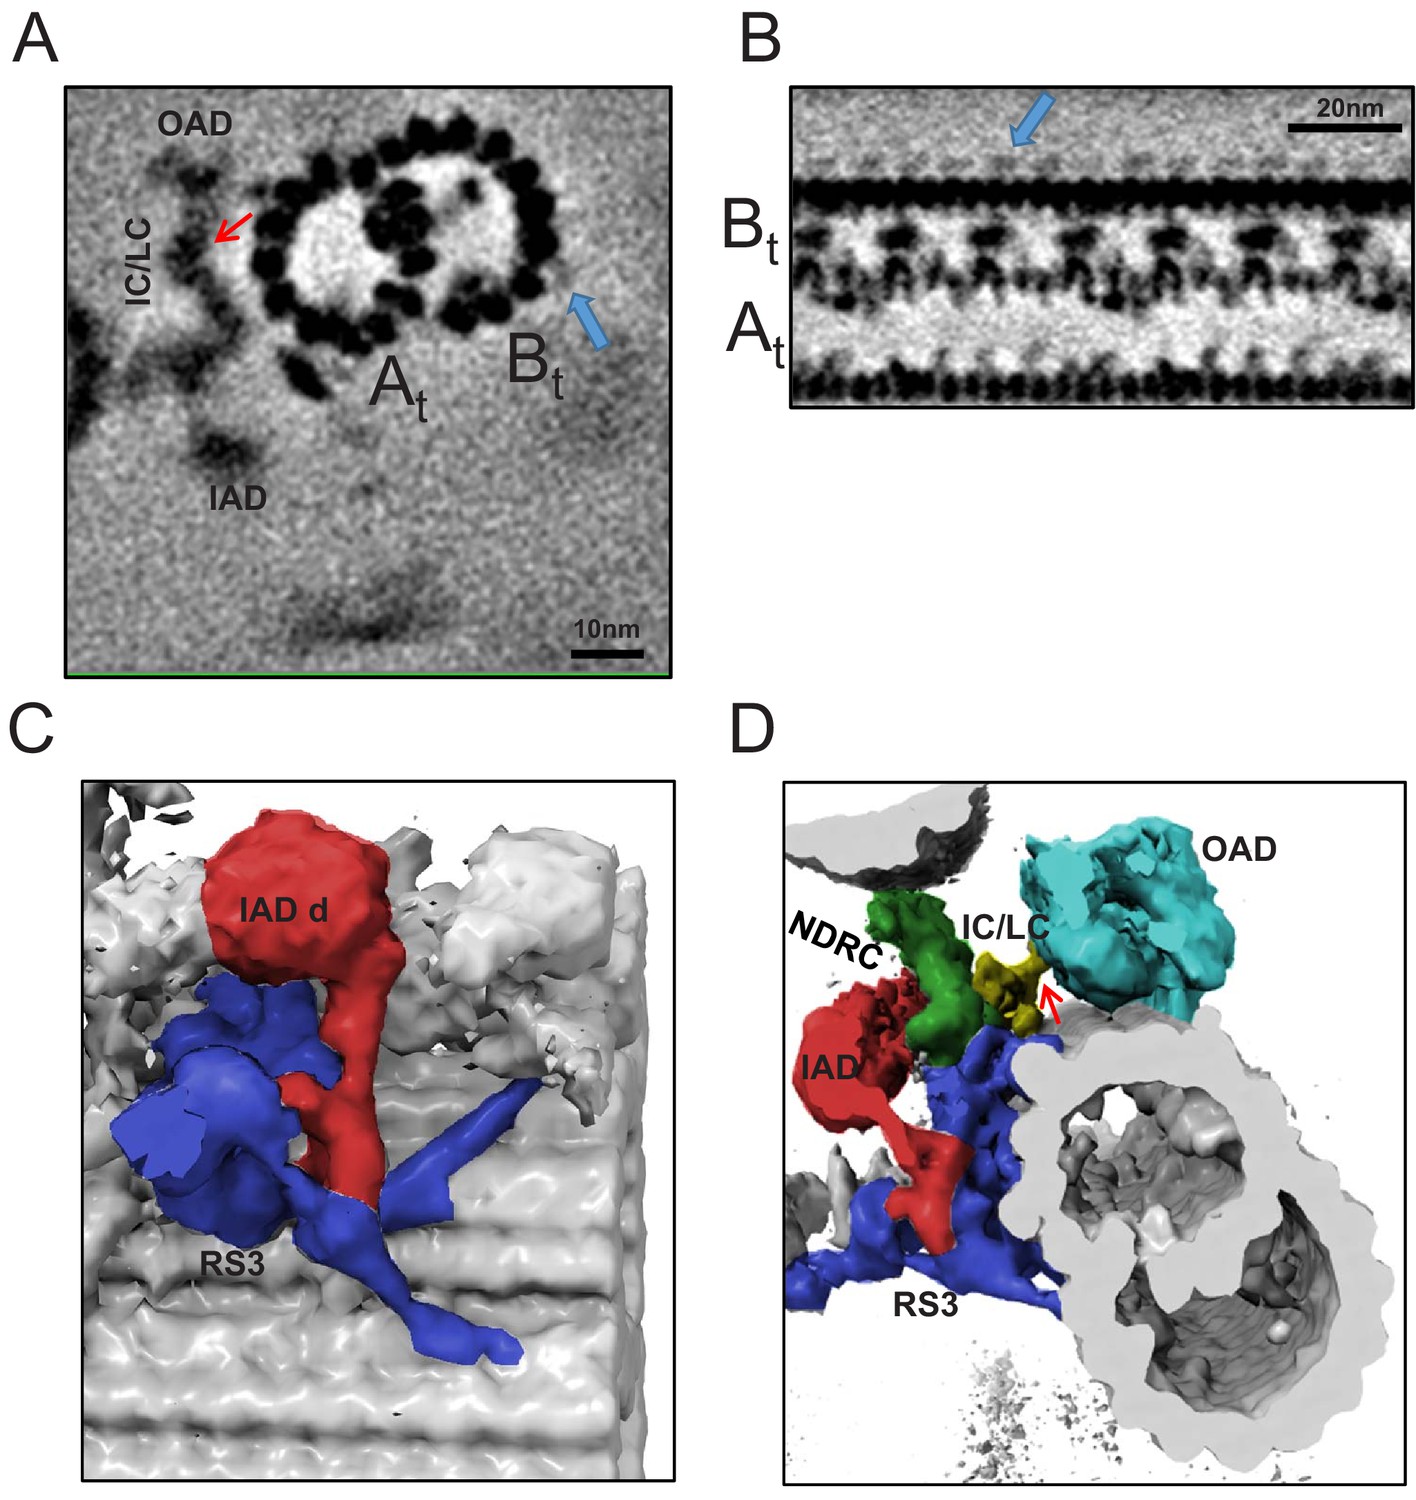
Extra densities outside protofilaments b7b8 and massive density at the base of RS3 in BSF T. brucei.
(A) Cross-section through the BSF averaged density map, viewed from the distal end of the axoneme and showing connections of the f-IC/LC complex to the IAD and OAD, red arrow. A and B-tubules are labeled and blue arrow points to the density outside protofilaments b7 and b8. (B) Longitudinal section through the BSF averaged density map, with the proximal end of the axoneme at the left. A and B-tubules are labeled and blue arrow points to the novel density outside protofilaments b7 and b8. (C) 3D isosurface rendering of the BSF averaged 96-nm repeat, showing the connection between IAD-d (red) and RS3 (blue). (D) 3D isosurface rendering of the BSF averaged 96-nm repeat, viewed from the distal end. Extensive connection of the RS3 base to the A-tubule and inner junction is shown. No connection between the NDRC and the OAD is observed. Red arrow points to connection between f-IC/LC and OAD.
Figure 3—figure supplement 4
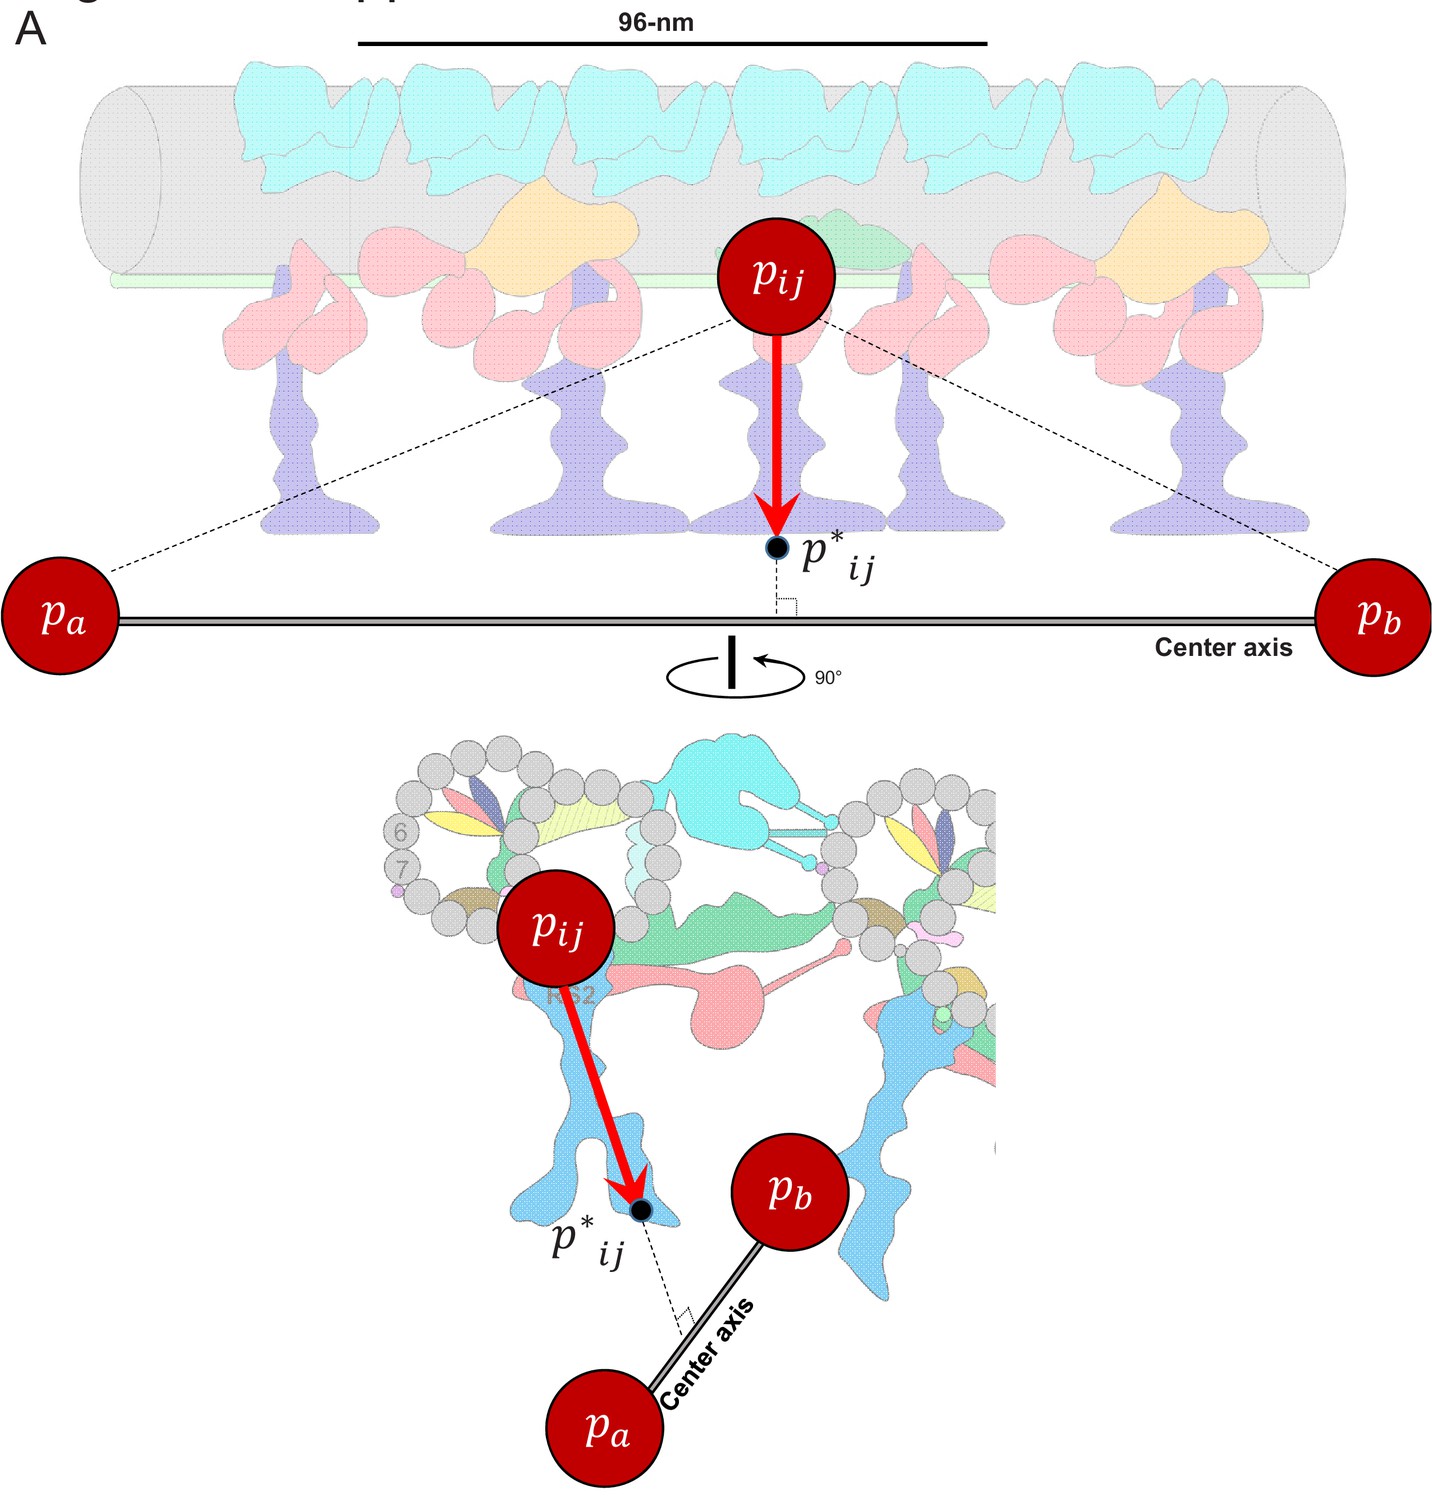
Illustration of the principles of autoPicker.
(A) is the intersection point of a DMT with the middle of the three radial spokes, RS2, along each particle’s 96-nm unit length; The first two points, and , are the center points of the two bases of the cylinder. is perpenticular to , and parallel to the plane defined by the three points of and .
-
Figure 3—figure supplement 4—source code 1
Source code for subtomogram averaging method.
- https://cdn.elifesciences.org/articles/52058/elife-52058-fig3-figsupp4-code1-v3.m
Figure 4
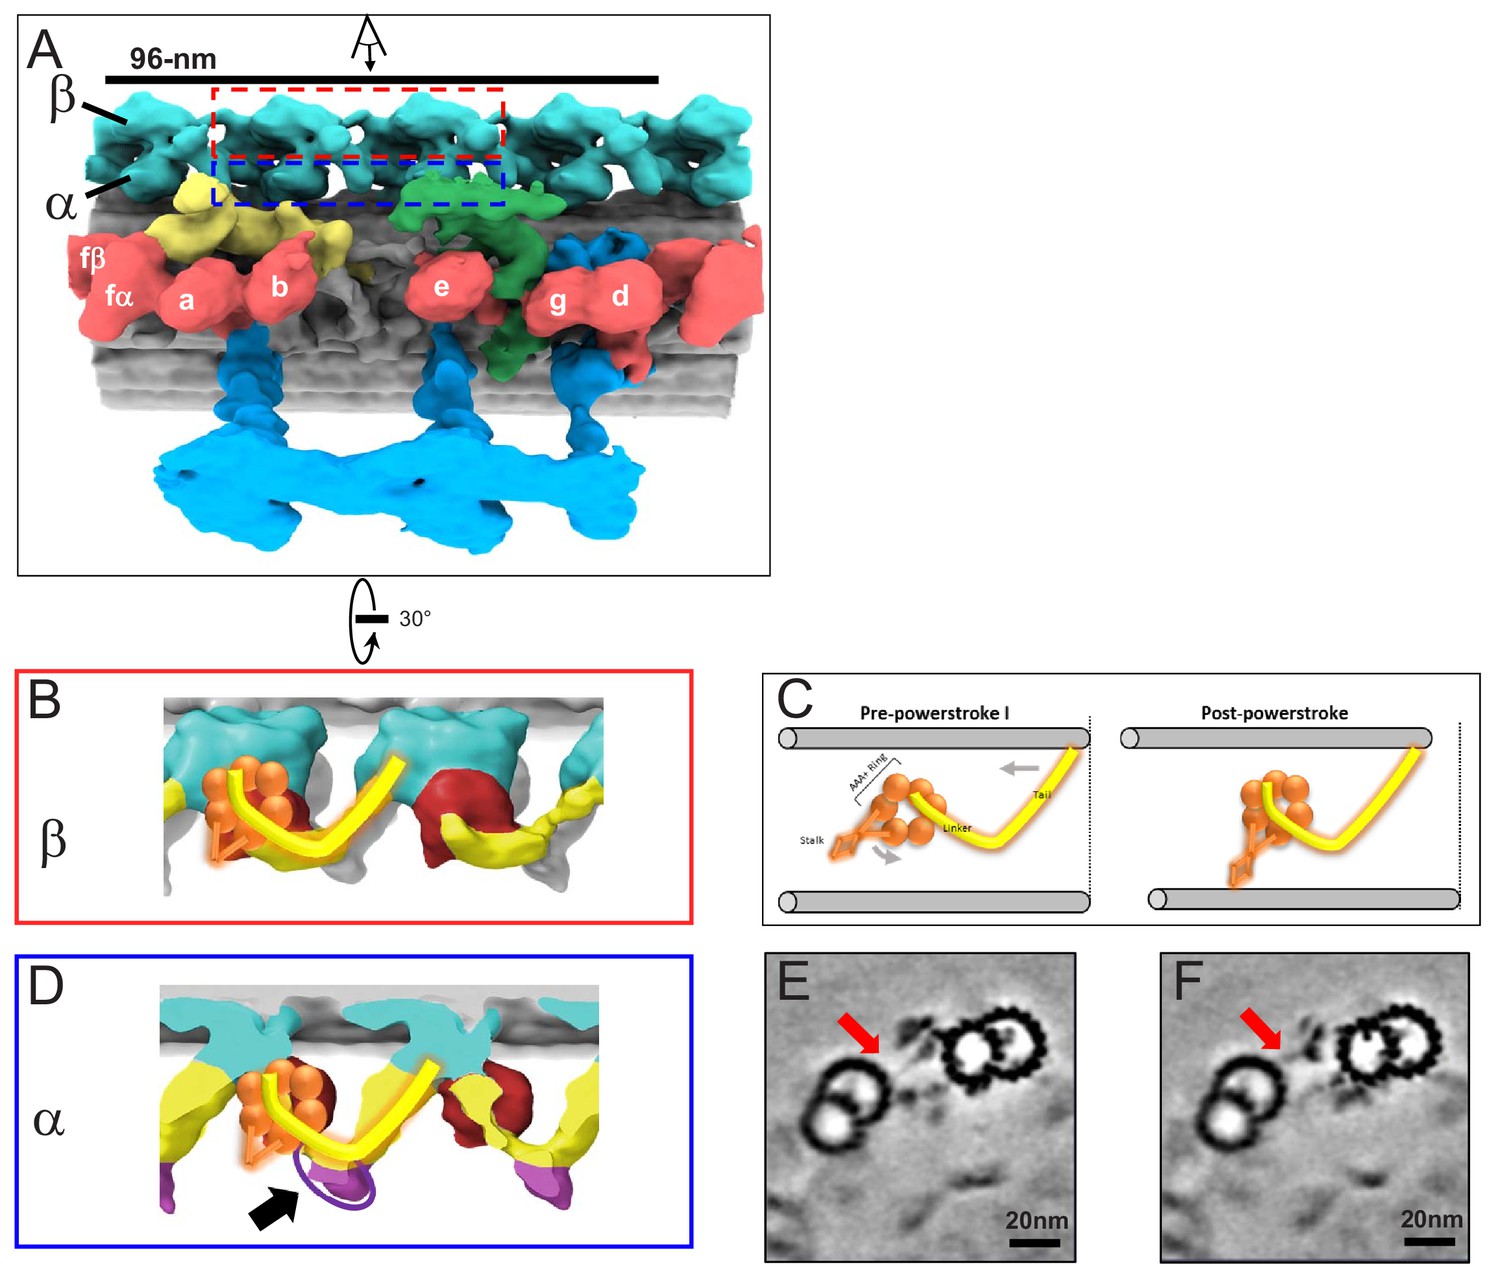
In situ structure of outer arm dyneins and novel OAD-alpha inter-doublet connector in BSF T. brucei.
(A) Shaded surface rendering, longitudinal view of the averaged 96-nm repeat. Coloring as described for Figure 3A. The box around the OAD indicates the region and perspective shown in B (red box) and D (blue box). (B, D) Shaded surface renderings of outer arm dyneins from the averaged 96-nm repeat. (B) Two adjacent OADβ dyneins. The linker and tail domains are colored yellow and the AAA+ ring is red. Cartoon overlay shows the post-powerstroke position of dynein. (D) Top view of two adjacent OADα dyneins. The linker and tail domains are colored in yellow and the AAA+ ring is colored in red. The arrow points to the OADα connector (purple), at the junction between the tail and linker domains. Cartoon overlay shows the post-powerstroke position of dynein. (C) A schematic illustrating relative DMT movement as dynein moves from pre-powerstroke one state (left) to post-powerstroke state (right). (E–F) Density slices of the averaged 96-nm repeat, viewed in cross-section, viewed from the distal tip of the axoneme. Red arrows indicate the dynein stalk domain in (E), and the OADα connector in (F), contacting the neighboring DMT.
Figure 5
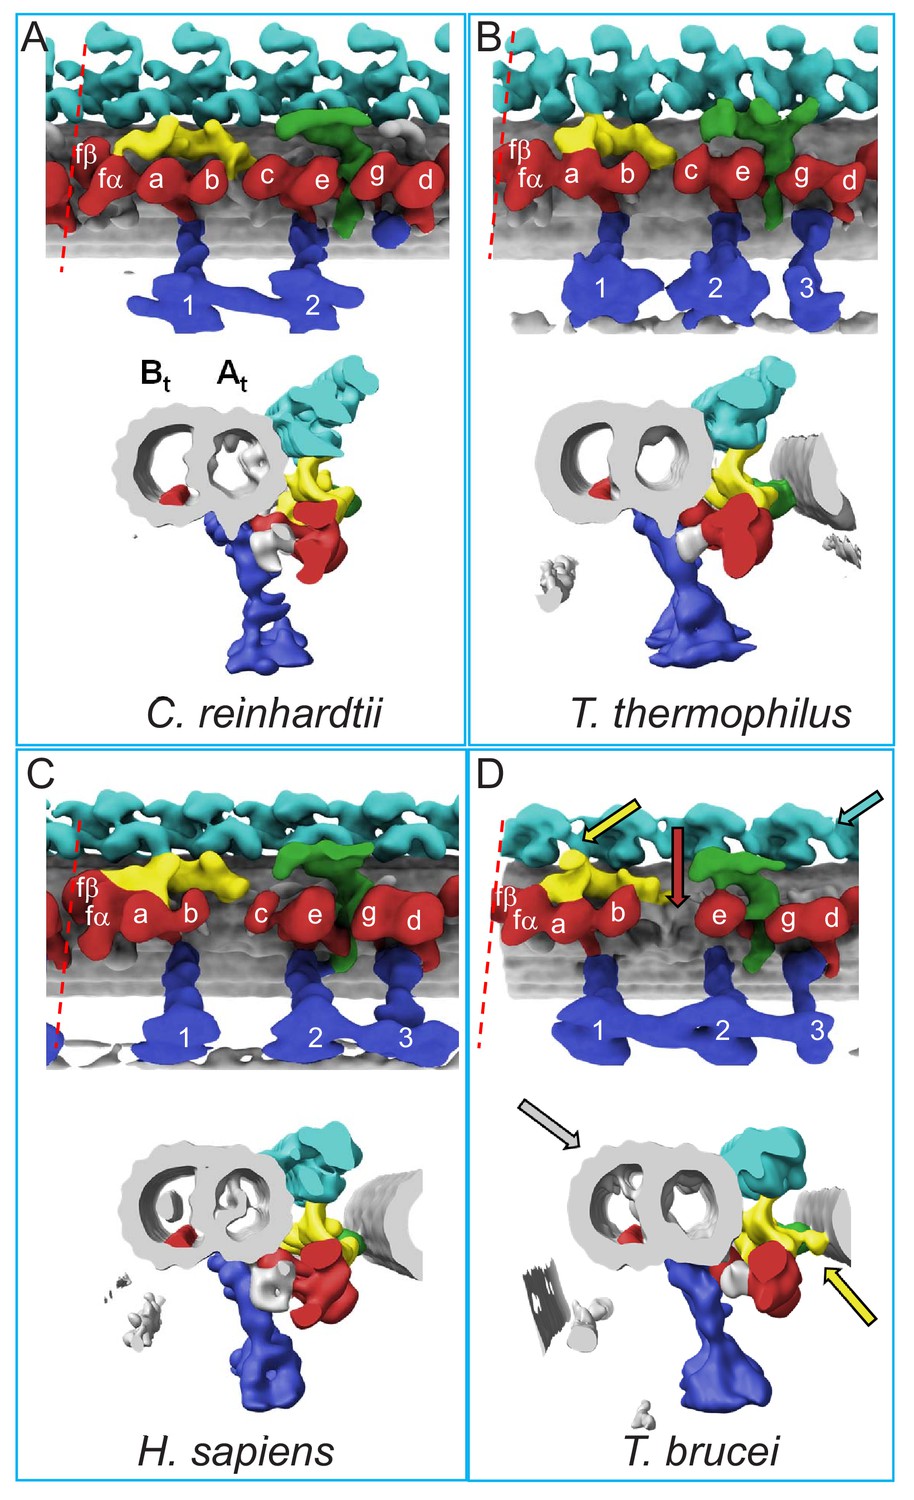
Comparison of 96-nm axonemal repeat structures across species.
(A–D) Structure of the 96-nm axonemal repeat is shown for Chlamydomonas reinhardtii (A) (Owa et al., 2019), Tetrahymena thermophilus (B) (Pigino et al., 2012), Homo sapiens (C) (Lin et al., 2014) and BSF Trypanosoma brucei (D) (this work). Longitudinal (top) and cross-sectional (bottom) views are shown for each. Canonical features of the 96-nm repeat are colored, including outer arm dyneins (cyan), inner arm dyneins (red and numbered according to convention) the IC/LC complex of inner arm dynein f (yellow), the NDRC inter-doublet linkage (green) and radial spokes (blue). The microtubule lattice is gray and the A- and B-tubules are indicated. MIP3 (red) is present in all organisms shown and is colored in the B-tubule for reference. For all structures except that from C. reinhardtii, the surface of the B-tubule from the adjacent DMT is shown. Inner dyneins and radial spokes are labeled for reference. The red dashed line indicates the position of viewing for the cross-section shown. All structures are filtered to resolution of 50 Å. Features that distinguish the T. brucei repeat include the f-connector (yellow arrow), missing dynein-c (red arrow), lineage specific MIPs within the A- and B-tubules (gray arrow), and two OAD motors in a protist (cyan arrow). Other T. brucei-specific structures, such as the OAD-alpha inter-doublet connector and b-connector are not visible in this view.
Figure 6 with 1 supplement
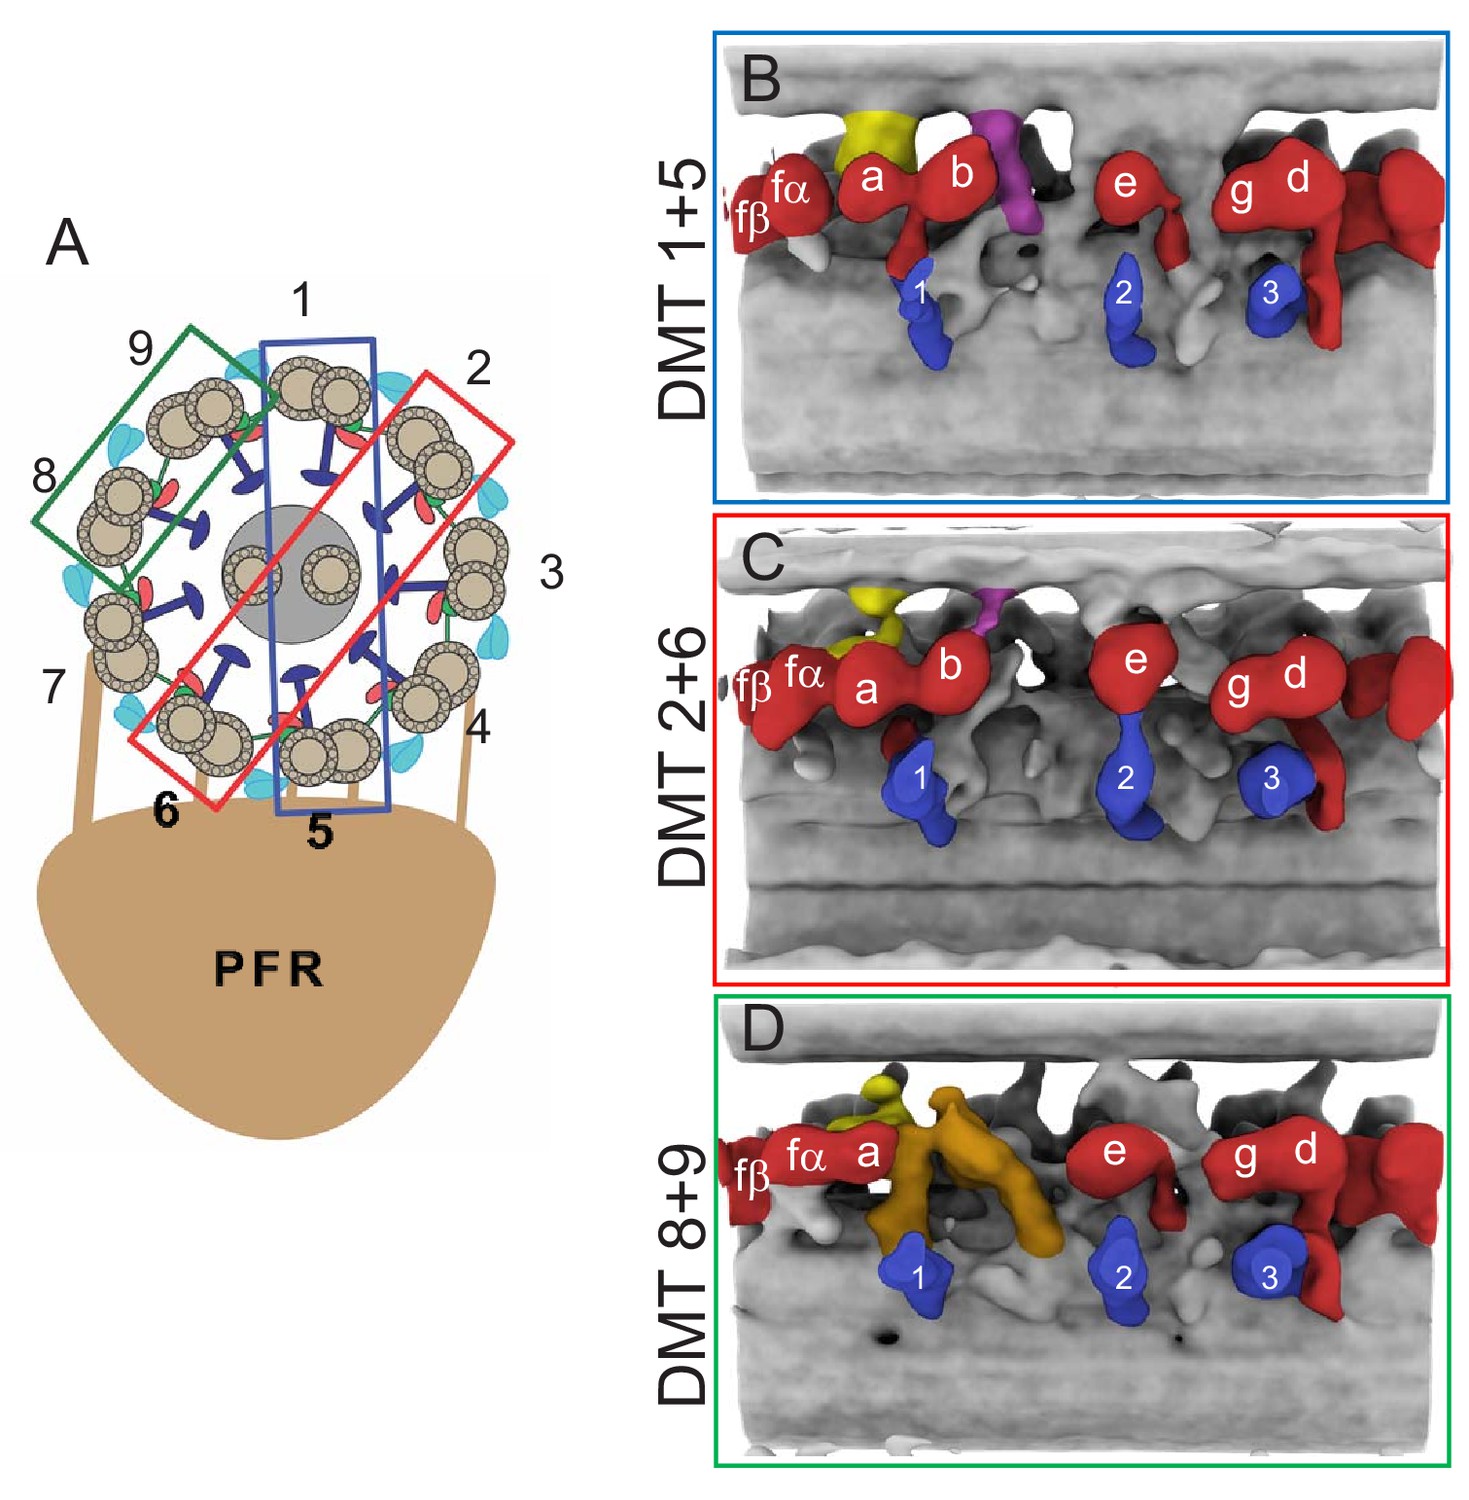
Doublet-specific structures of the BSF T. brucei 96-nm repeat.
(A) Schematic showing the numbering of individual DMTs. Colored boxes indicate the DMT pairs that were used for the averaged structures shown in panels B-D. (B–D) Panels show averaged structures for DMT pairs 1+5 (B), 2+6 (C), and 8+9 (D). Inner arm dyneins (red) and radial spokes (blue) are labeled for reference. The f-connector, b-connector and the arch that distinguish DMTs 8 and 9 are colored yellow, purple and brown, respectively.
Figure 6—figure supplement 1
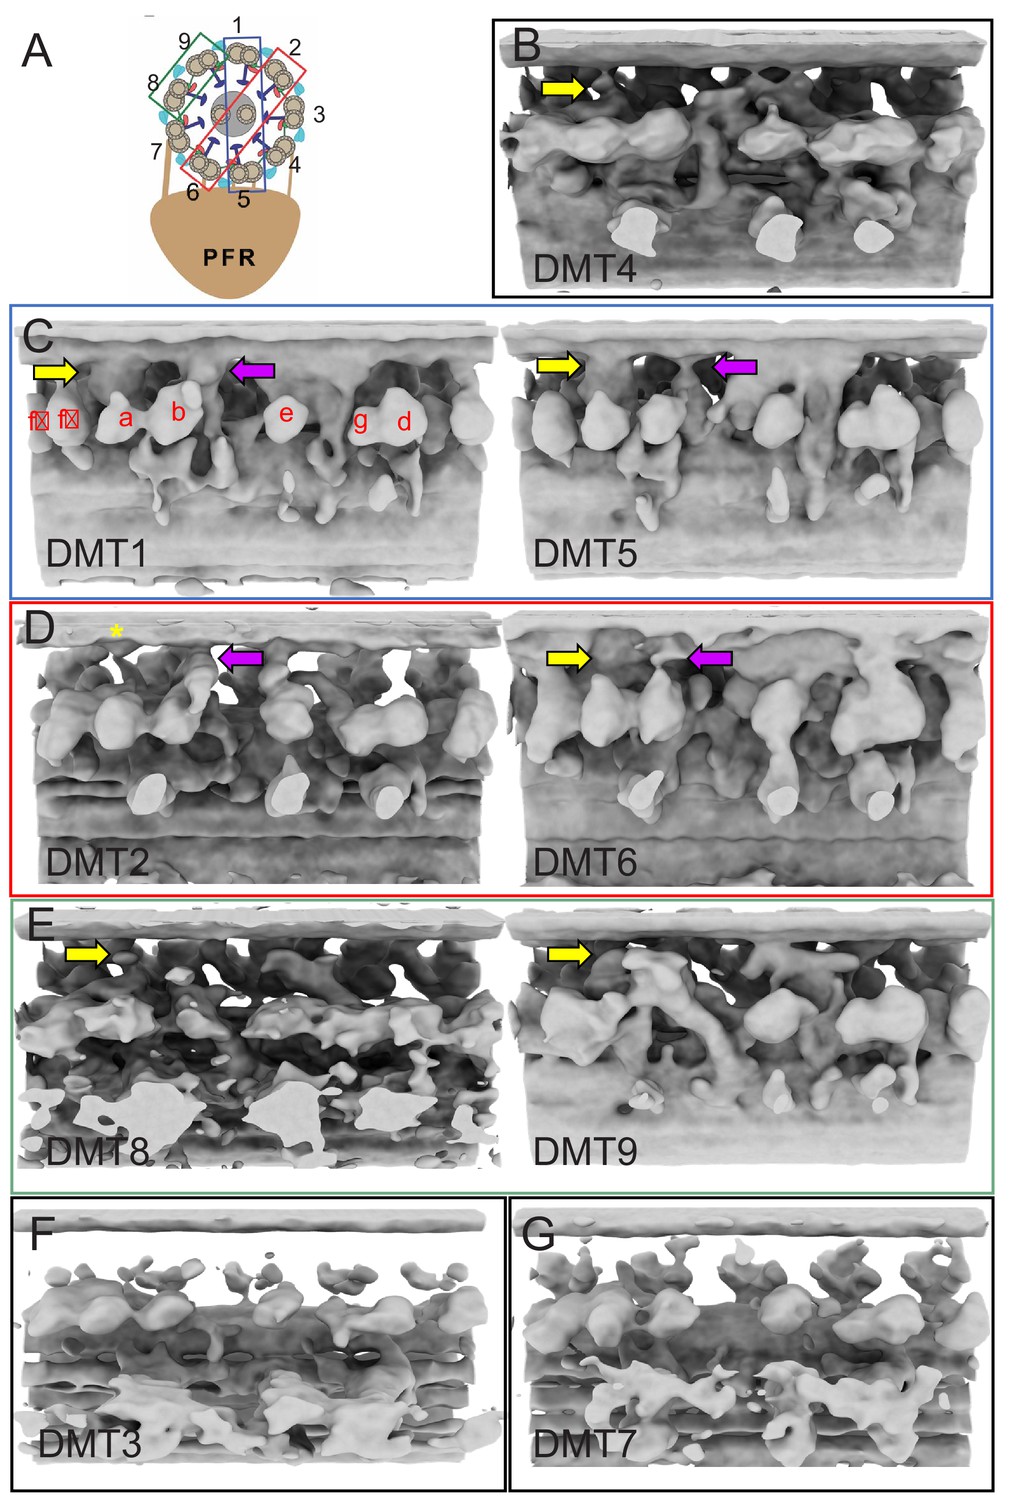
Sub-tomogram averages of the 96-nm repeat of individual DMTs of BSF T. brucei.
(A) Schematic showing the numbering of individual DMTs. Blue, red and green boxes indicate pairs of DMTs used for averaging in Figure 6. (B–G) Images show the 96-nm repeat structure obtained by sub-tomogram averaging of each DMT individually. The f-connector (yellow arrow) and b-connector (purple arrow) are indicated. The asterisk on DMT2 indicates a density at the site where the f-connector typically would contact the B-tubule of the adjacent DMT. Inner arm dyneins are labelled a-f in DMT1 for reference.
Figure 7
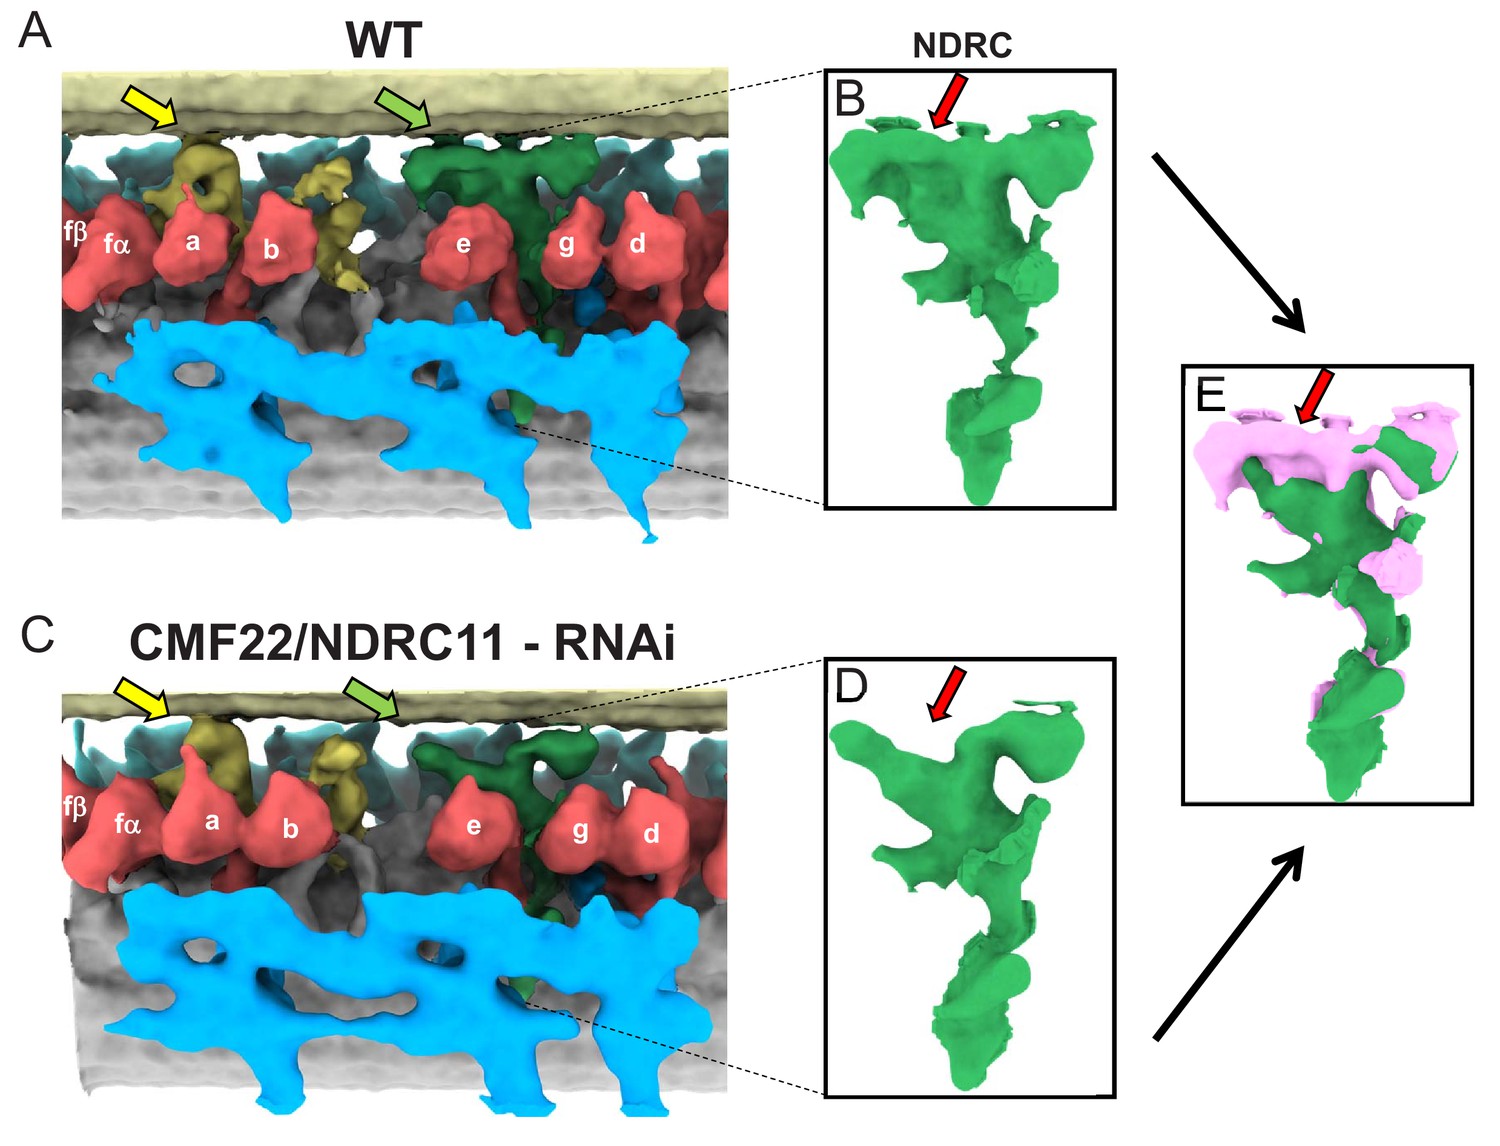
Comparison between averaged 96-nm repeats of wild-type and CMF22/DRC11 knockdown PCF T. brucei.
(A, C) Sub-tomogram averages of the 96-nm repeats of wild-type (A), and CMF22/DRC11 knockdown mutant (C). Yellow and green arrows point to the region of the B-tubule contacted by the f-connector and NDRC, respectively. (B, D) Zoomed-in view of the NDRC from WT (B) and CMF22/DRC11 knockdown (D). The red arrow in each panel denotes the structure most substantially affected in the knockdown. (E) Superposition of the NDRC structures shown in B and D, with WT in pink and the mutant in green. The red arrow indicates the most striking difference, corresponding to inter-doublet contacts made by the NDRC.
Figure 8 with 1 supplement
TbMIP3 and ponticulus in the B-tubule of BSF T. brucei.
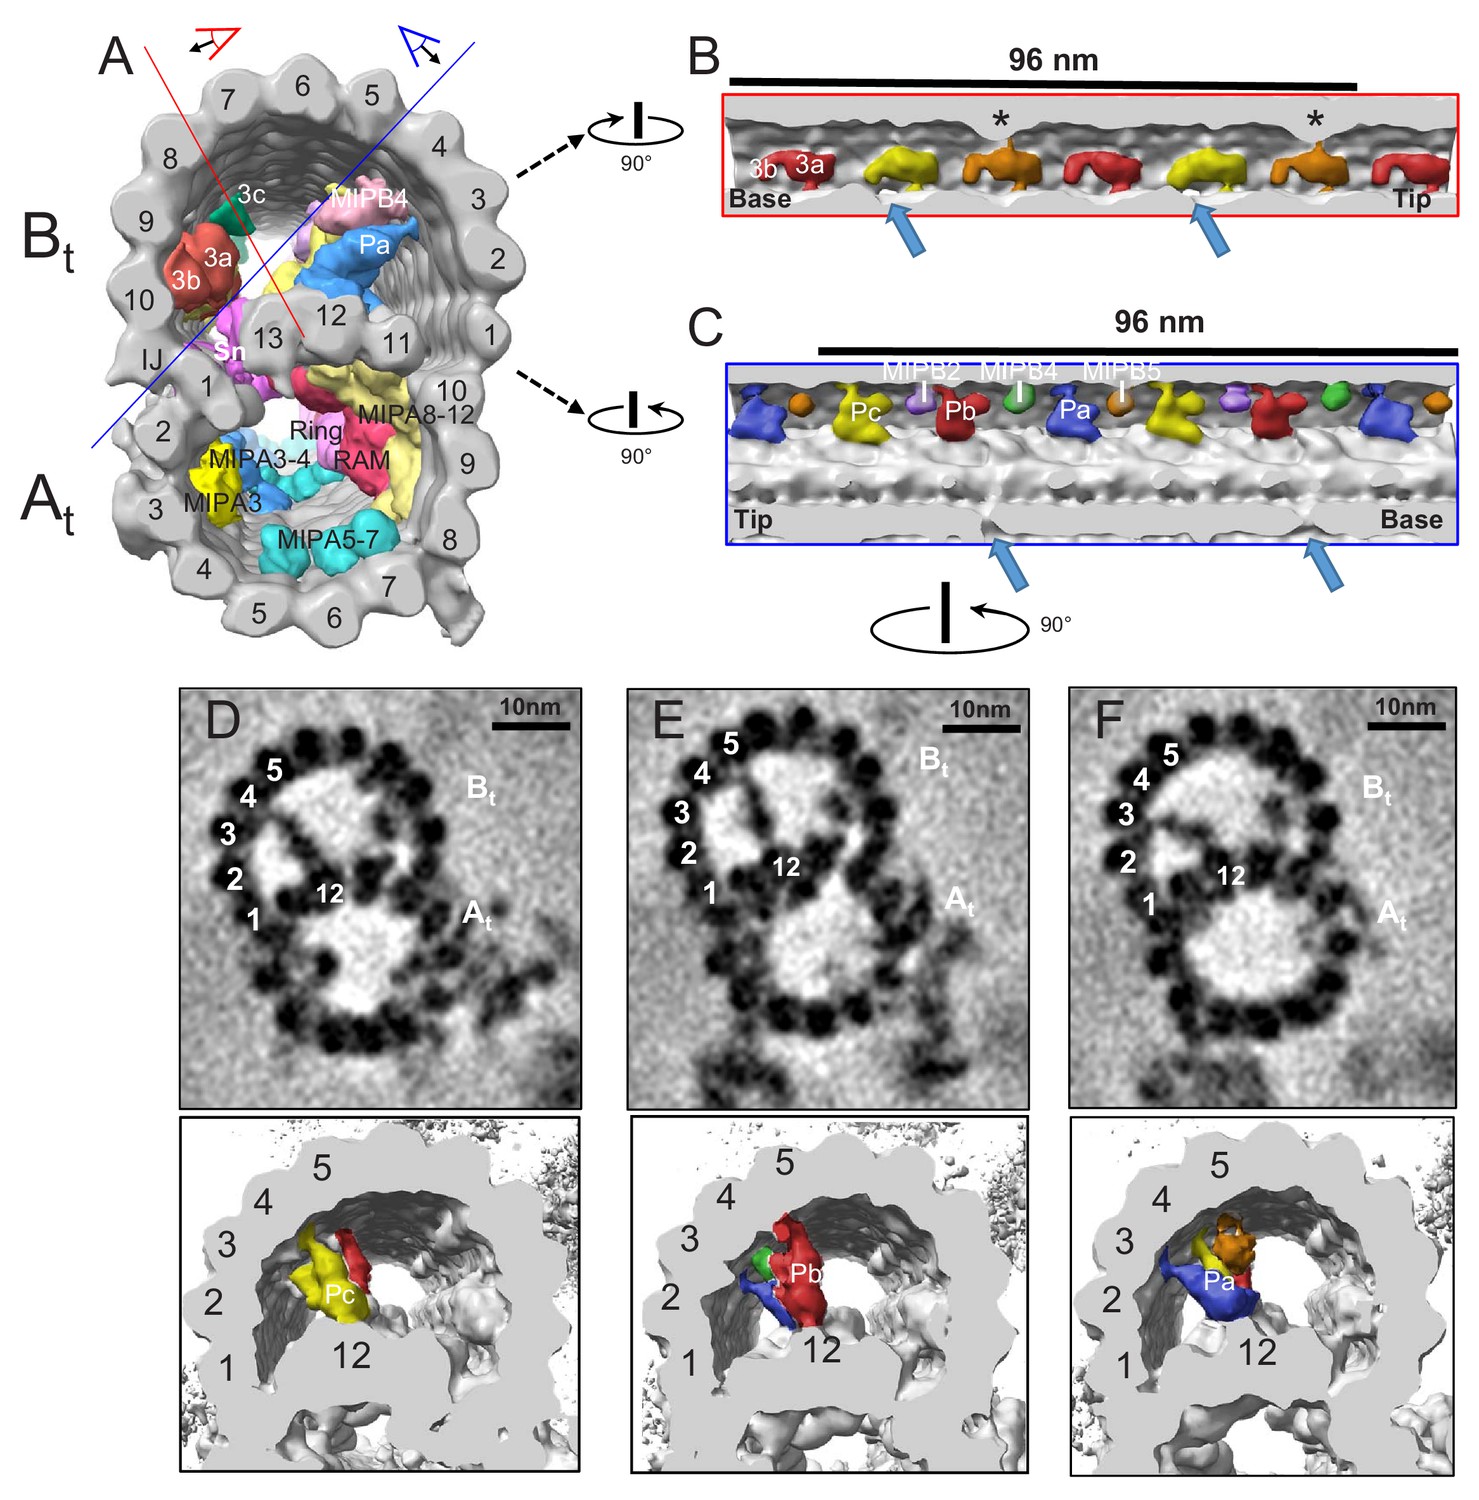
(A) Guide figure showing cross-section view of the averaged 96-nm repeat, viewed from the proximal end of the axoneme with MIPs colored and densities external to the DMT removed. Red and blue lines indicate sections and viewing perspectives shown in panels (B) and (C), respectively. (B) Longitudinal view into the inside of the B-tubule showing structural variations of TbMIP3 (red, yellow and orange) described in the text, with a periodicity of 48 nm. Arrows indicate the proximal and distal holes in the inner junction. Asterisk indicates MIP3a attachment to a structure identified as MIP3c in Chlamydomonas (Owa et al., 2019). Proximal (base) and distal (tip) ends of the repeat are indicated and rotation relative to panel A is shown. (C) Longitudinal view into the inside of the B-tubule showing ponticulus complexes Pa, Pb and Pc with a periodicity of 48 nm. Arrows indicate the distal and proximal holes in the inner junction and rotation relative to panel A is shown. (D–F) Top panels show cross-sections of average density maps viewed from the axoneme's distal tip to proximal end into the DMT. A subset of protofilaments are labeled for reference and rotation relative to panel C is shown. The trypanosome-specific Ponticulus (Pa, Pb and Pc) is seen bridging the entire lumen of the B-tubule from protofilament A12 to protofilaments B3, B5, and B4, respectively. The corresponding 3D isosurface renderings, looking from the same position are shown below, with Ponticulus-Pa, Pb and Pc, colored in blue, red and yellow respectively.
Figure 8—figure supplement 1
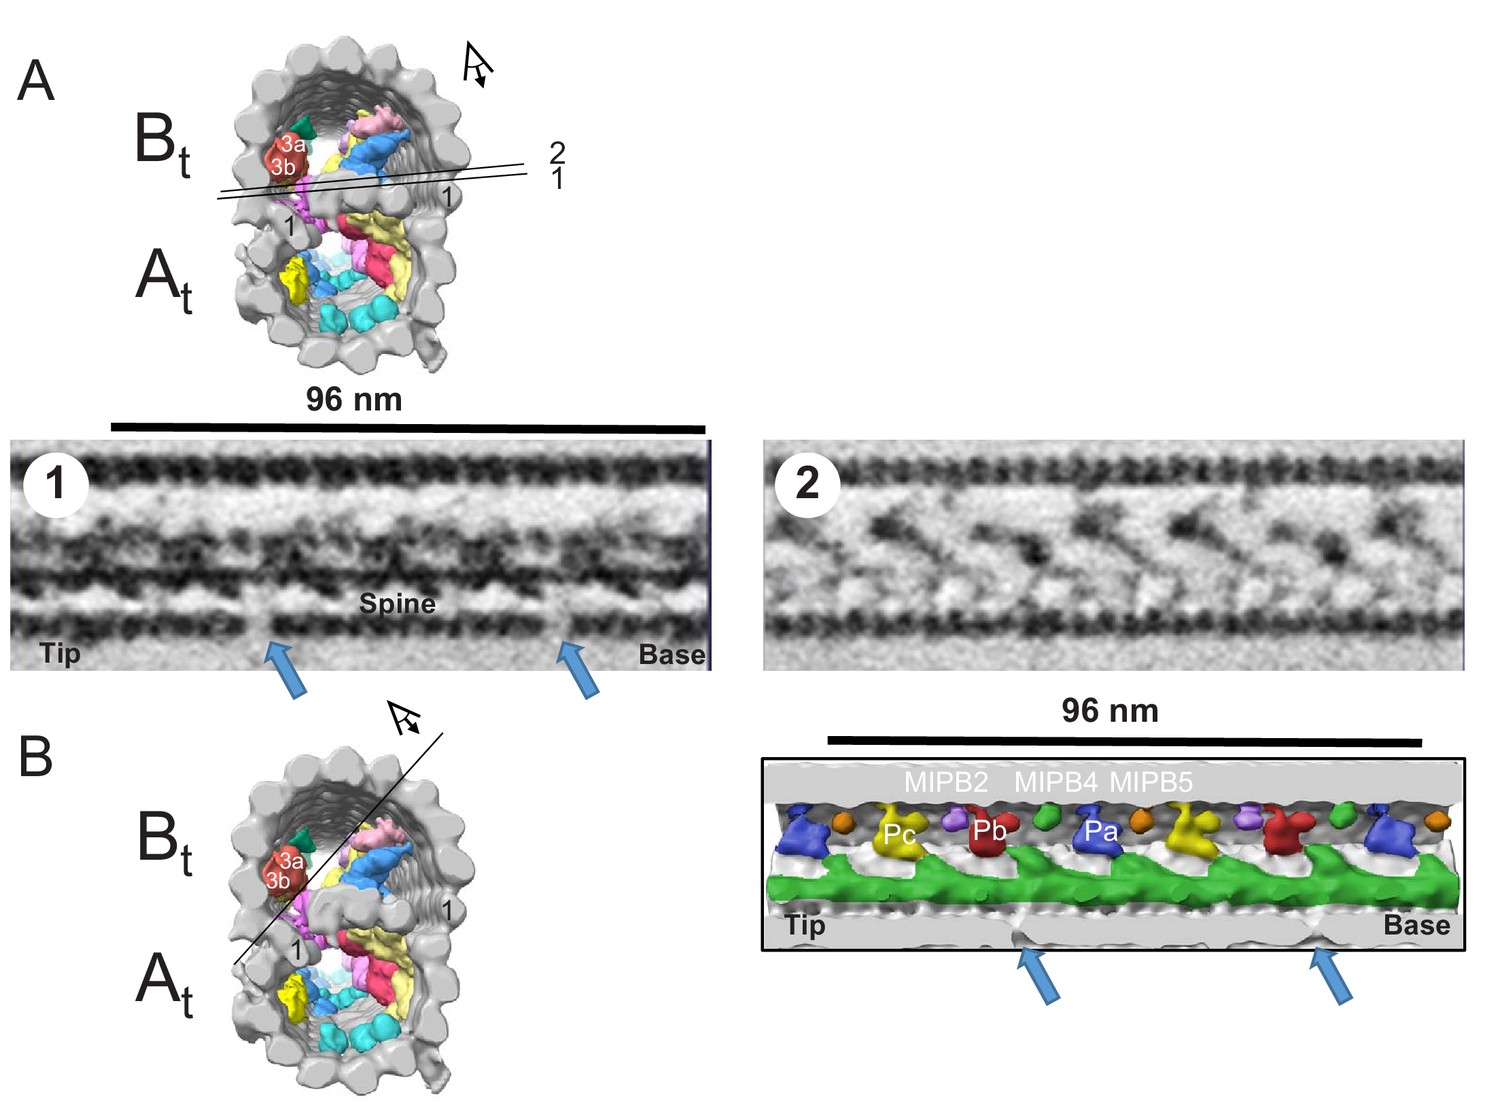
The Spine MIP is a contiguous structure, spanning 48 nm and contacting adjacent MIPs in BSF T. brucei.
(A) Top image is a guide figure showing cross-section view of the averaged 96-nm repeat, viewed from the proximal end of the axoneme with MIPs colored and densities external to the DMT removed. Protofilament number 1 of the A and B-tubules are labeled for reference. Black lines 1 and 2 indicate the section and perspective of the two longitudinal views of the averaged density map shown below. Bottom images show longitudinal views 1 and 2, oriented with the proximal (base) and distal (tip) ends of the axoneme indicated. The spine MIP runs along protofilament A13 and is connected to the ponticulus (Pa, Pb, Pc). The proximal and distal holes of the inner junction are visible in longitudinal view number 1 (blue arrows). (B) Left image is a guide figure showing cross-section view of the averaged 96-nm repeat, viewed from the proximal end of the axoneme with MIPs colored and densities external to the DMT removed. Protofilament number 1 of the A and B-tubules are labeled for reference. Black line indicates section and viewing perspective for the longitudinal surface rendering shown on the right. Right image shows connections of the Spine MIP to the ponticulus (Pa, Pb, Pc) in the B-tubule. The proximal (base) and distal (tip) ends of the axoneme indicated. The proximal and distal holes of the inner junction are visible in longitudinal view number 1 (blue arrows).
Figure 9 with 1 supplement
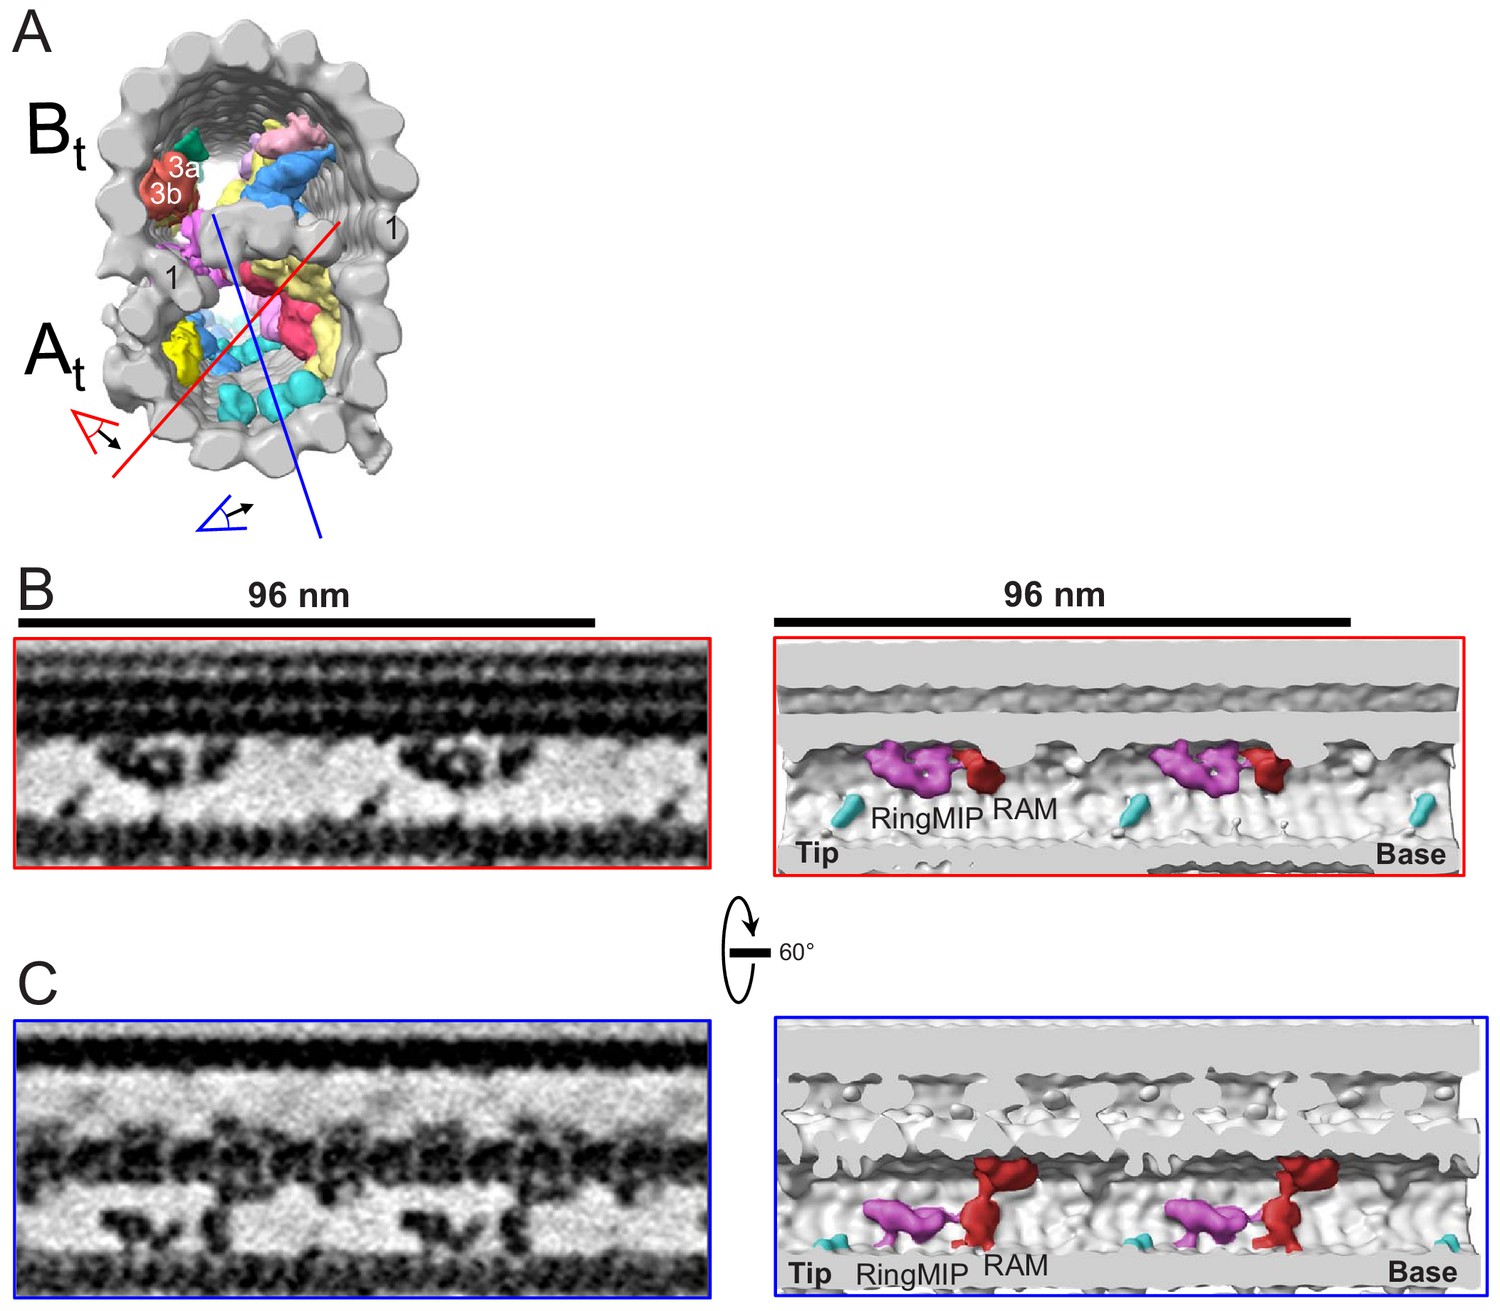
The RingMIP and Ring Associated MIP (RAM) in the A-tubule of BSF T. brucei.
(A) Guide figure showing cross-section view of the averaged 96-nm repeat, viewed from the proximal end of the axoneme with MIPs colored and densities external to the DMT removed. Red and blue lines indicate sections and viewing perspectives shown in panels (B) and (C), respectively. (B–C) Longitudinal view of the A-tubule, showing the RingMIP and RAM. Left panels are sections through averaged density maps and right panels are corresponding isosurface renderings showing the same structures. The RingMIP (fuchsia), as well as its neighboring Ring Associated MIP (RAM) (red) and MIPA5-7 (cyan) are shown. The proximal (base) and distal (tip) ends of the axoneme are indicated and rotation of panel C relative to panel B is shown.
Figure 9—figure supplement 1
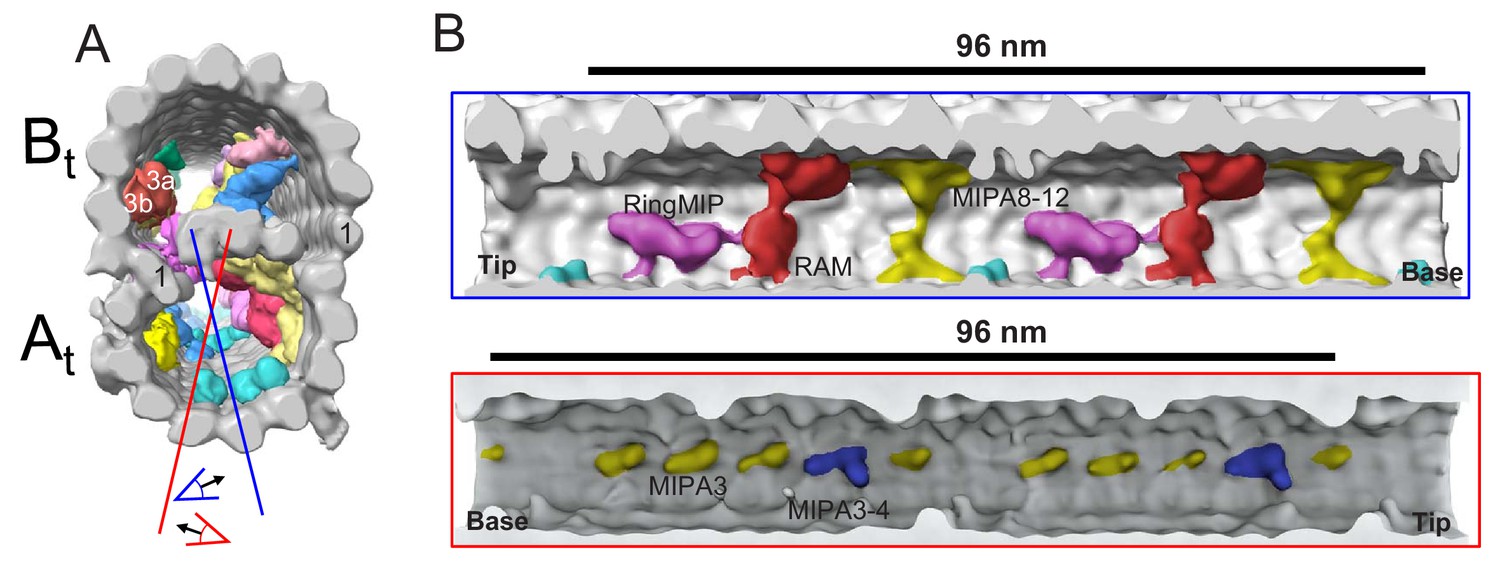
MIPs in the A-tubule of BSF T. brucei.
(A) Guide figure showing cross-section view of the averaged 96-nm repeat, viewed from the proximal end of the axoneme with MIPs colored and densities external to the DMT removed. Protofilament number 1 of the A and B-tubules are labeled for reference. Red and blue lines indicate sections and viewing perspectives shown in B. (B) Shaded surface renderings show two different longitudinal views inside the A-tubule, oriented with the proximal (base) and distal (tip) ends of the axoneme as indicated. A-tubule MIPS: RingMIP, RAM, MIPA8-12, MIPA3 and MIPA3-4, are labeled and exhibit a 48 nm periodicity.
Figure 10
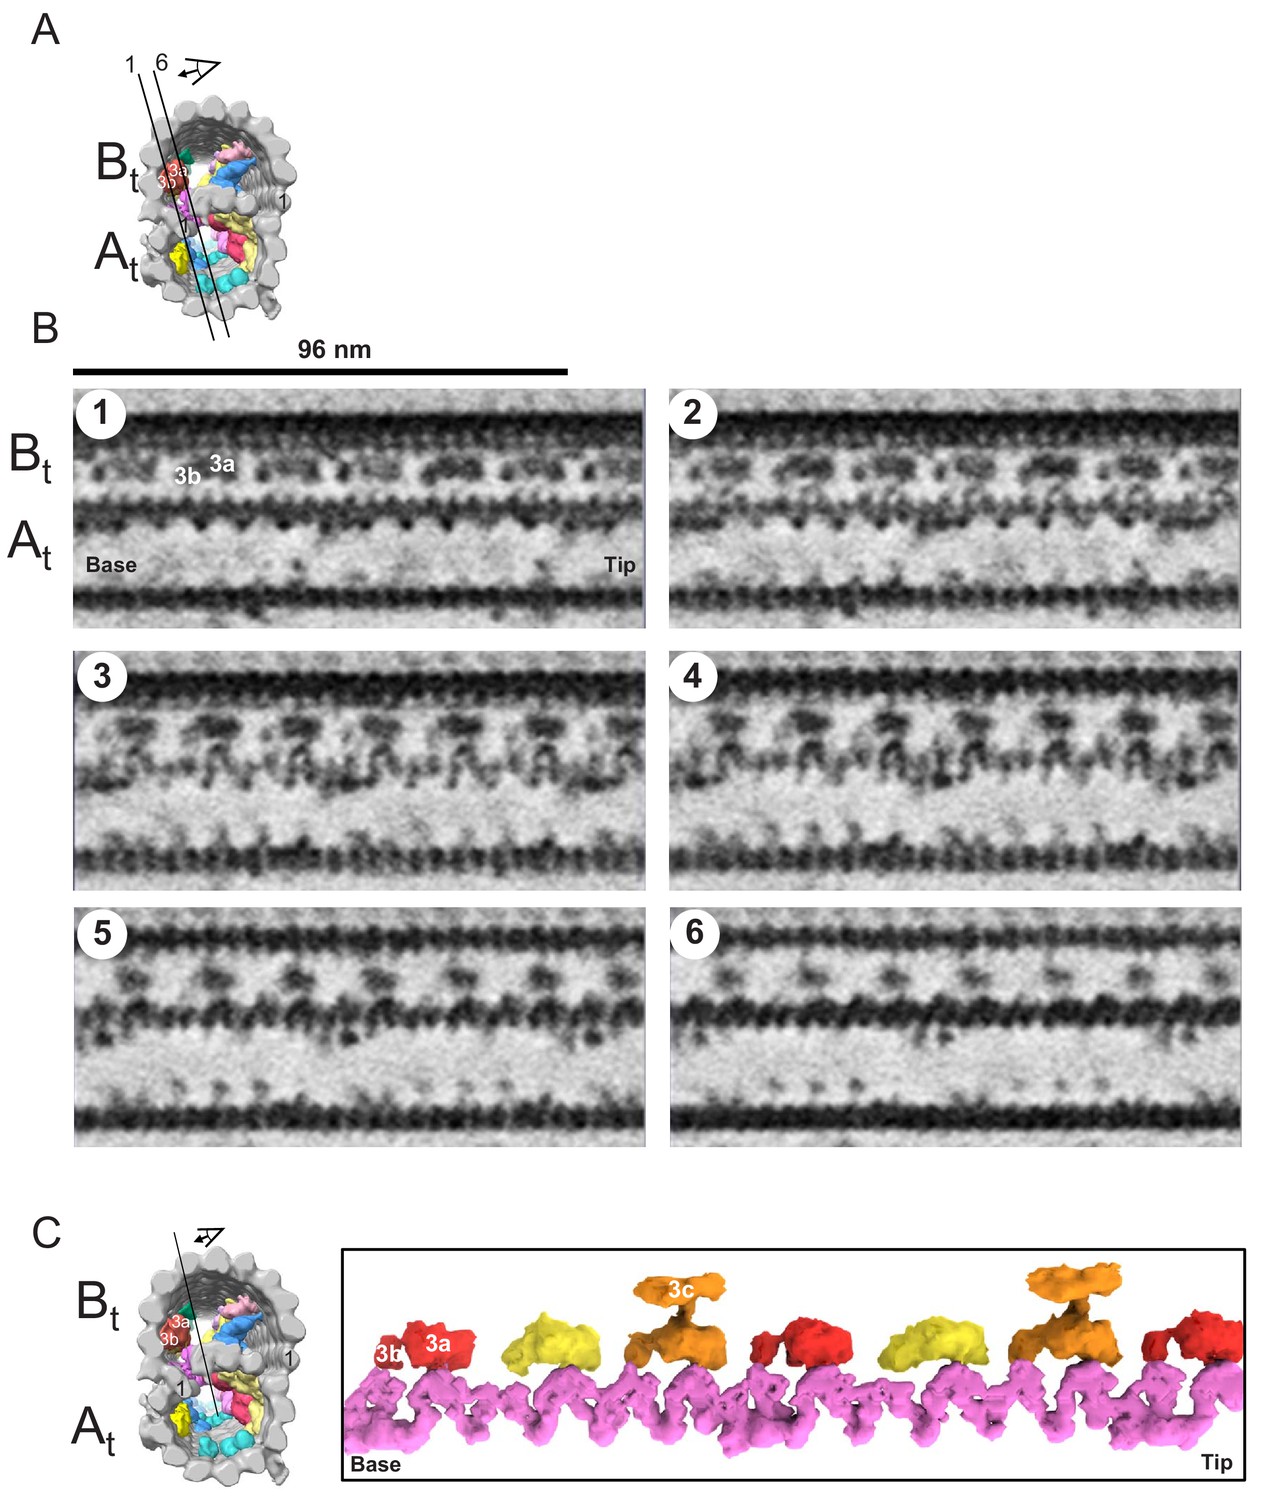
The snake MIP connects the A-tubule and the B-tubule of BSF T. brucei.
(A) Guide figure showing cross-section view of the averaged 96-nm repeat, viewed from the proximal end of the axoneme with MIPs colored and densities external to the DMT removed. Black lines 1 and 6 show the position and perspective of sections shown in B. (B) Longitudinal view of the averaged density map. A and B-tubules are labeled. Panels 1 through 6 show six 6 Å thick, consecutive digital sections (the distance between 2 sections is 6.2 Å) through the snake MIP. (C) Left panel is a guide figure showing cross-section view of the averaged 96-nm repeat, viewed from the proximal end of the axoneme with MIPs colored and densities external to the DMT removed. Black line shows position and perspective for view of snake MIP shown in the right panel. Right panel shows segmented TbMIP3 (red, yellow and orange, as described for Figure 8B) and Snake MIP (mauve). (See also Video 7.).
Figure 11
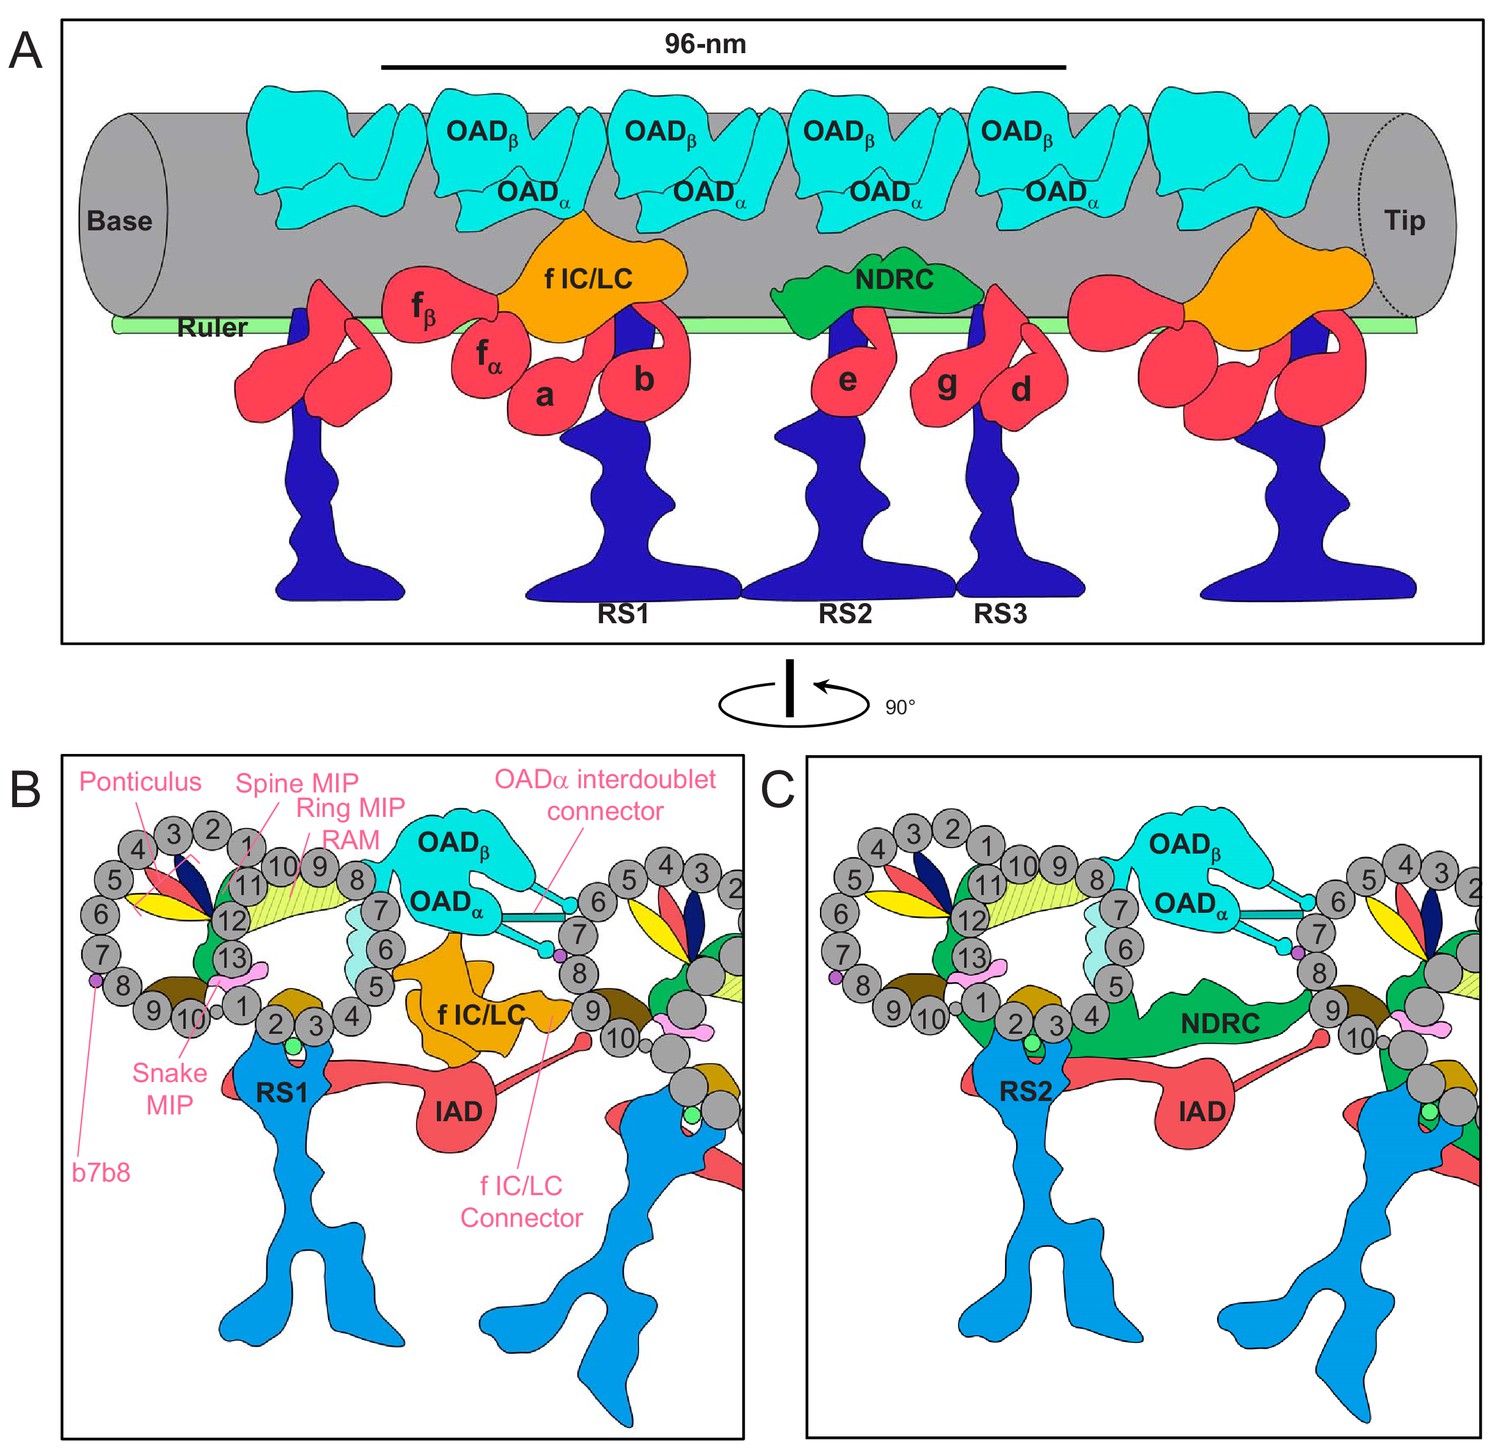
Schematic overview of the trypanosome axoneme.
(A) Cartoon longitudinal view of the entire averaged 96-nm axonemal repeat. Major labeled structures are Outer Arm Dyneins (OAD), Inner Arm Dyneins (IAD), dynein-f IC/LC, Nexin Dynein Regulatory Complex (NDRC), Radial Spokes (RS) and Ruler. Image is oriented with proximal end (base) at the left. (B and C) Cartoon cross-section view of the axoneme (viewed from the proximal end) at roughly the position of RS1 (B) and RS2 (C). Protofilaments are numbered and structures are labelled as for panel A. Major trypanosome-specific structures described in text are labelled in pink. Note that additional T. brucei-specific structures, RingMIP, RAM MIP and b-connector are not visible in this simplified depiction. Summary of MIP structures is provided in Supplementary file 1.
Author response image 1
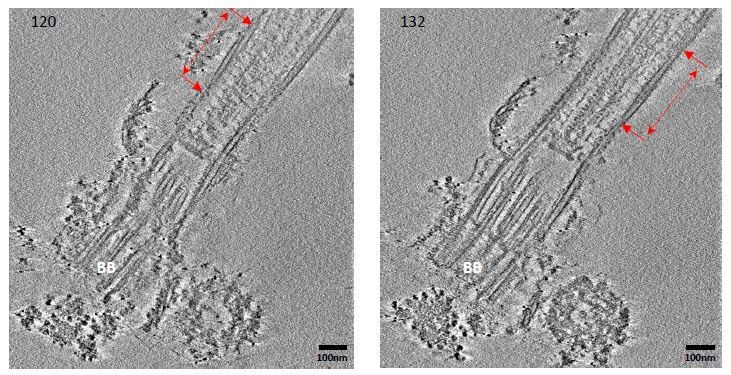
Proximal end of the axoneme is severely twisted.
1‐Å‐thick digital slices from a representative tomogram of the BSF axoneme near the basal body (BB) region. Two different sections, separated by 12 nm, are shown (120 and 132), with example twisted regions of the DMTs indicated by the red arrows.
Videos
Video 1
Real-time video showing two T. brucei BSF parasites in culture medium.
The two parasites collide, illustrating the need for trypanosomes to accommodate interactions with other cells and tissues, which is common in the native environment of the mammalian host and insect vector.
Video 2
Real-time video showing a T. brucei BSF parasites moving in mouse blood, diluted 1:100 with culture medium.
Movement with flagellum tip leading and contact with host red blood cells is evident.
Video 3
Slices through a representative tomogram reconstructed by simultaneous iterative reconstruction technique (SIRT) of BSF T. brucei.
Video 4
3D surface rendering of the averaged 96-nm axonemal repeat from BSF T. brucei, rotated to show the structures of DMT (grey), Radial spokes (blue), NDRC (green), f IC/LC (yellow) and OAD (cyan) and IAD (red).
Video 5
Real-time video showing wild type motility of a PCF T. brucei parasite in culture medium.
The parasite translocates using a helical movement with flagellum tip leading.
Video 6
Real-time video of a CMF22-knockdown PCF T. brucei parasite in culture medium.
The flagellum beats but is unable to drive translocation of the parasite.
Video 7
3D surface rendering of the averaged 96-nm axonemal repeat from BSF T. brucei, rotated to show the structures of DMT (grey), Radial spokes (blue), NDRC (green), f IC/LC (yellow), OAD (cyan) and IAD (red).
Structures other than the Snake MIP (mauve) and TbMIP3 (red, yellow and orange) fade away to emphasize the Snake MIP structure and its connection to TbMIP3 substructures.
Author response video 1
Proximal end of the axoneme is severely twisted.
Video of slices through the tomogram presented in Reviewer Figure R1, indicating twisting of the axoneme near the basal body. Video is compressed using H.265/HEVC MP4 video format.
Additional files
-
Supplementary file 1
List of MIPs identified in this study in BSF T. brucei.
- https://cdn.elifesciences.org/articles/52058/elife-52058-supp1-v3.pptx
-
Transparent reporting form
- https://cdn.elifesciences.org/articles/52058/elife-52058-transrepform-v3.docx
Download links
A two-part list of links to download the article, or parts of the article, in various formats.
Downloads (link to download the article as PDF)
Open citations (links to open the citations from this article in various online reference manager services)
Cite this article (links to download the citations from this article in formats compatible with various reference manager tools)
Cryo electron tomography with volta phase plate reveals novel structural foundations of the 96-nm axonemal repeat in the pathogen Trypanosoma brucei
eLife 8:e52058.
https://doi.org/10.7554/eLife.52058


