Protein phosphatase 1 activity controls a balance between collective and single cell modes of migration
- Division of Biology, Kansas State University, United States
- Lerner Research Institute, Cleveland Clinic, United States
- LBCMCP, Centre de Biologie Intégrative (CBI), Université de Toulouse, CNRS, UPS, France
Figures
Figure 1 with 3 supplements
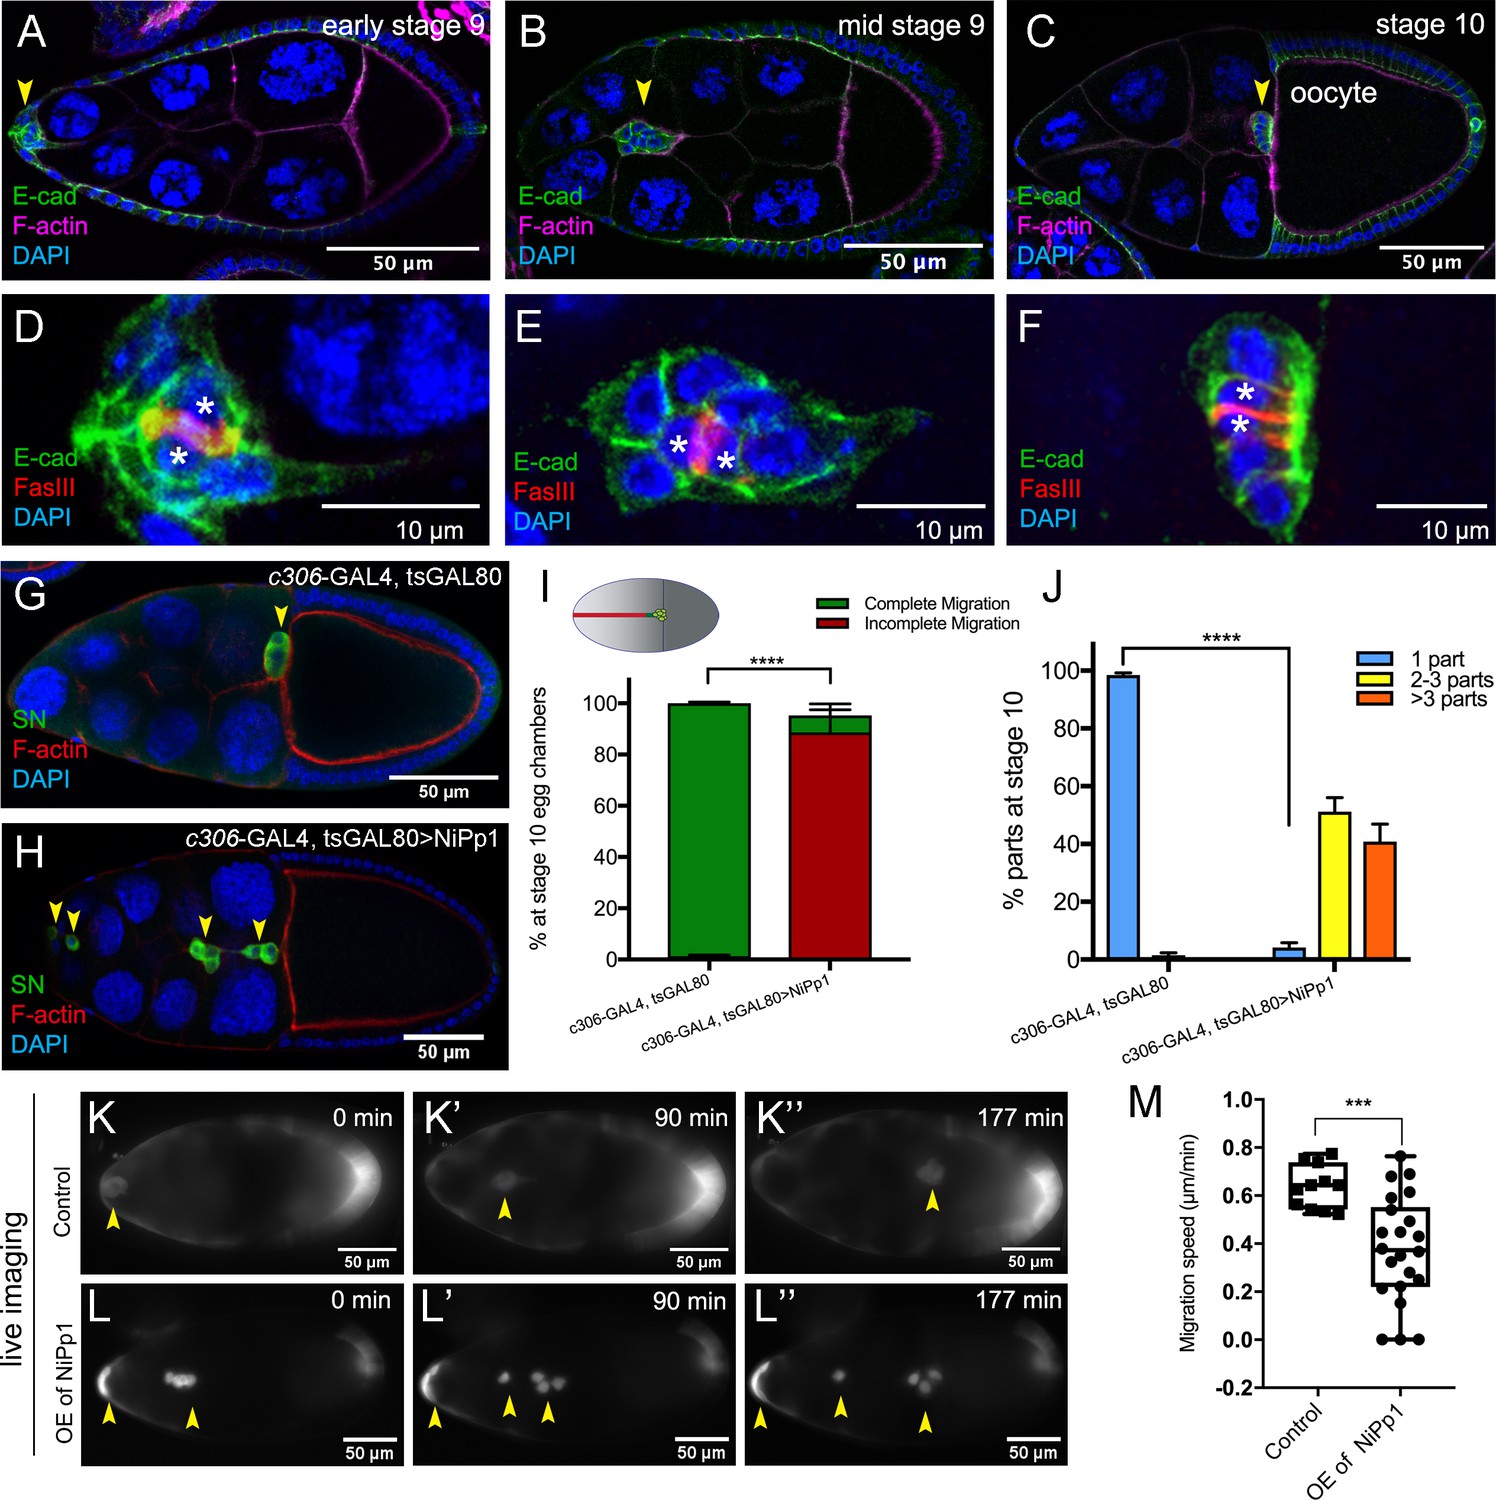
NiPp1 expression causes the border cell cluster to fall apart and disrupts migration.
(A–F) Wild-type border cell migration during oogenesis stages 9 and 10. (A–C) Egg chambers at the indicated stages labeled with E-Cadherin (E-Cad; green), F-actin (magenta) and DAPI (blue). Arrowheads indicate the border cell cluster. (D–F) Magnified views of the same border cell cluster from (A–C), showing FasIII (red) in the polar cells, E-Cad and DAPI. The border cell cluster is composed of two polar cells (marked by asterisks) in the center and four to eight outer border cells that are tightly connected with each other as indicated by E-Cad staining. (G, H) Egg chambers labeled with Singed (SN; green) to detect border cells (arrowheads), phalloidin to detect F-actin (red), and DAPI to detect nuclei (blue). Control border cells (G) reach the oocyte as a single cluster, whereas NiPp1-expressing border cells (H) dissociate from the cluster into small groups, with only a few reaching the oocyte. (I) Quantification of border cell cluster migration for matched control and NiPp1 overexpression, shown as the percentage that did not complete (red), or completed (green) their migration to the oocyte, as indicated in the egg chamber schematic. (J) Quantification of cluster cohesion, shown as the percentage of border cells found as a single unit (one part) or split into multiple parts (2–3 parts or >3 parts) in control versus NiPp1-expressing egg chambers. (I, J) Error bars represent SEM in three experiments, each trial assayed n ≥ 69 egg chambers (total n ≥ 221 egg chambers per genotype). ***p<0.001, ****p<0.0001, unpaired two-tailed t test. (K–L’’) Frames from a control (Video 1; K–K”) and an NiPp1 overexpression (OE; Video 2; L–L”) time-lapse video showing movement of the border cell cluster over the course of 3 hr (time in minutes). Border cells (arrowheads) express UAS-mCherry-Jupiter, which labels cytoplasmic microtubules. (M) Measurement of border cell migration speed from control (n = 11 videos) and NiPp1 overexpression (n = 11 videos; 22 tracked border cell ‘parts’) videos, shown as a box-and-whiskers plot. The whiskers represent the minimum and maximum; the box extends from the 25th to the 75th percentiles and the line indicates the median. ****p<0.0001, unpaired two-tailed t test. In this and all subsequent figures, anterior is to the left and the scale bars indicate the image magnification. All genotypes are listed in Table 2.
Figure 1—figure supplement 1
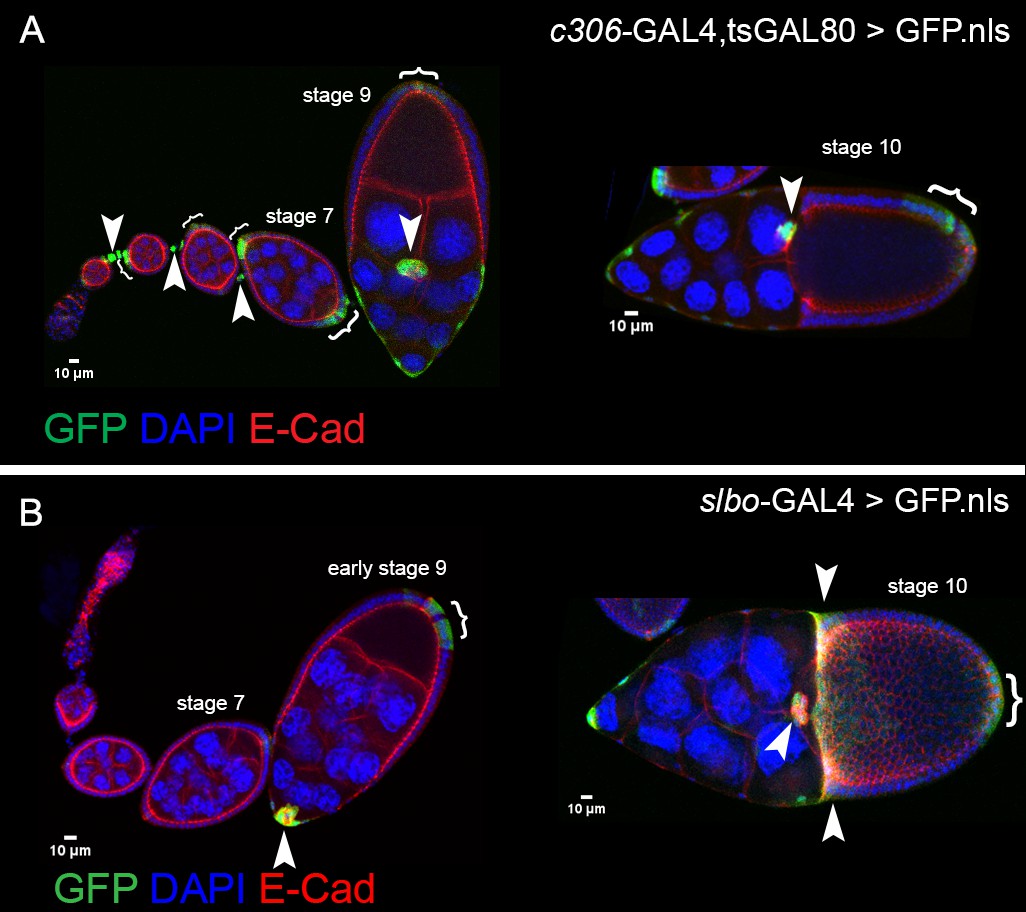
Patterns of GAL4s expressed in border cells.
Expression patterns of c306-GAL4 (A) and slbo-GAL4 (B) during oogenesis, indicated by UAS-GFP.nls (green; arrowheads, brackets). All egg chambers were co-stained with DAPI (blue) to label nuclei and E-cadherin (red) to mark cell membranes. (A) c306-GAL4 drives expression in anterior follicle cells prior to border cell formation (left panel) and continues throughout the whole migration process (left and right panels). c306-GAL4 is also expressed in stalk cells early (left panel) and anterior and posterior follicle cells at most stages. (B) slbo-GAL4 drives expression at early stage nine in early border cells, just before migration starts (left panel). slbo-GAL4 continues in border cells through stage 10, at which point it turns on centripetal cells and posterior follicle cells (right panel).
Figure 1—figure supplement 2
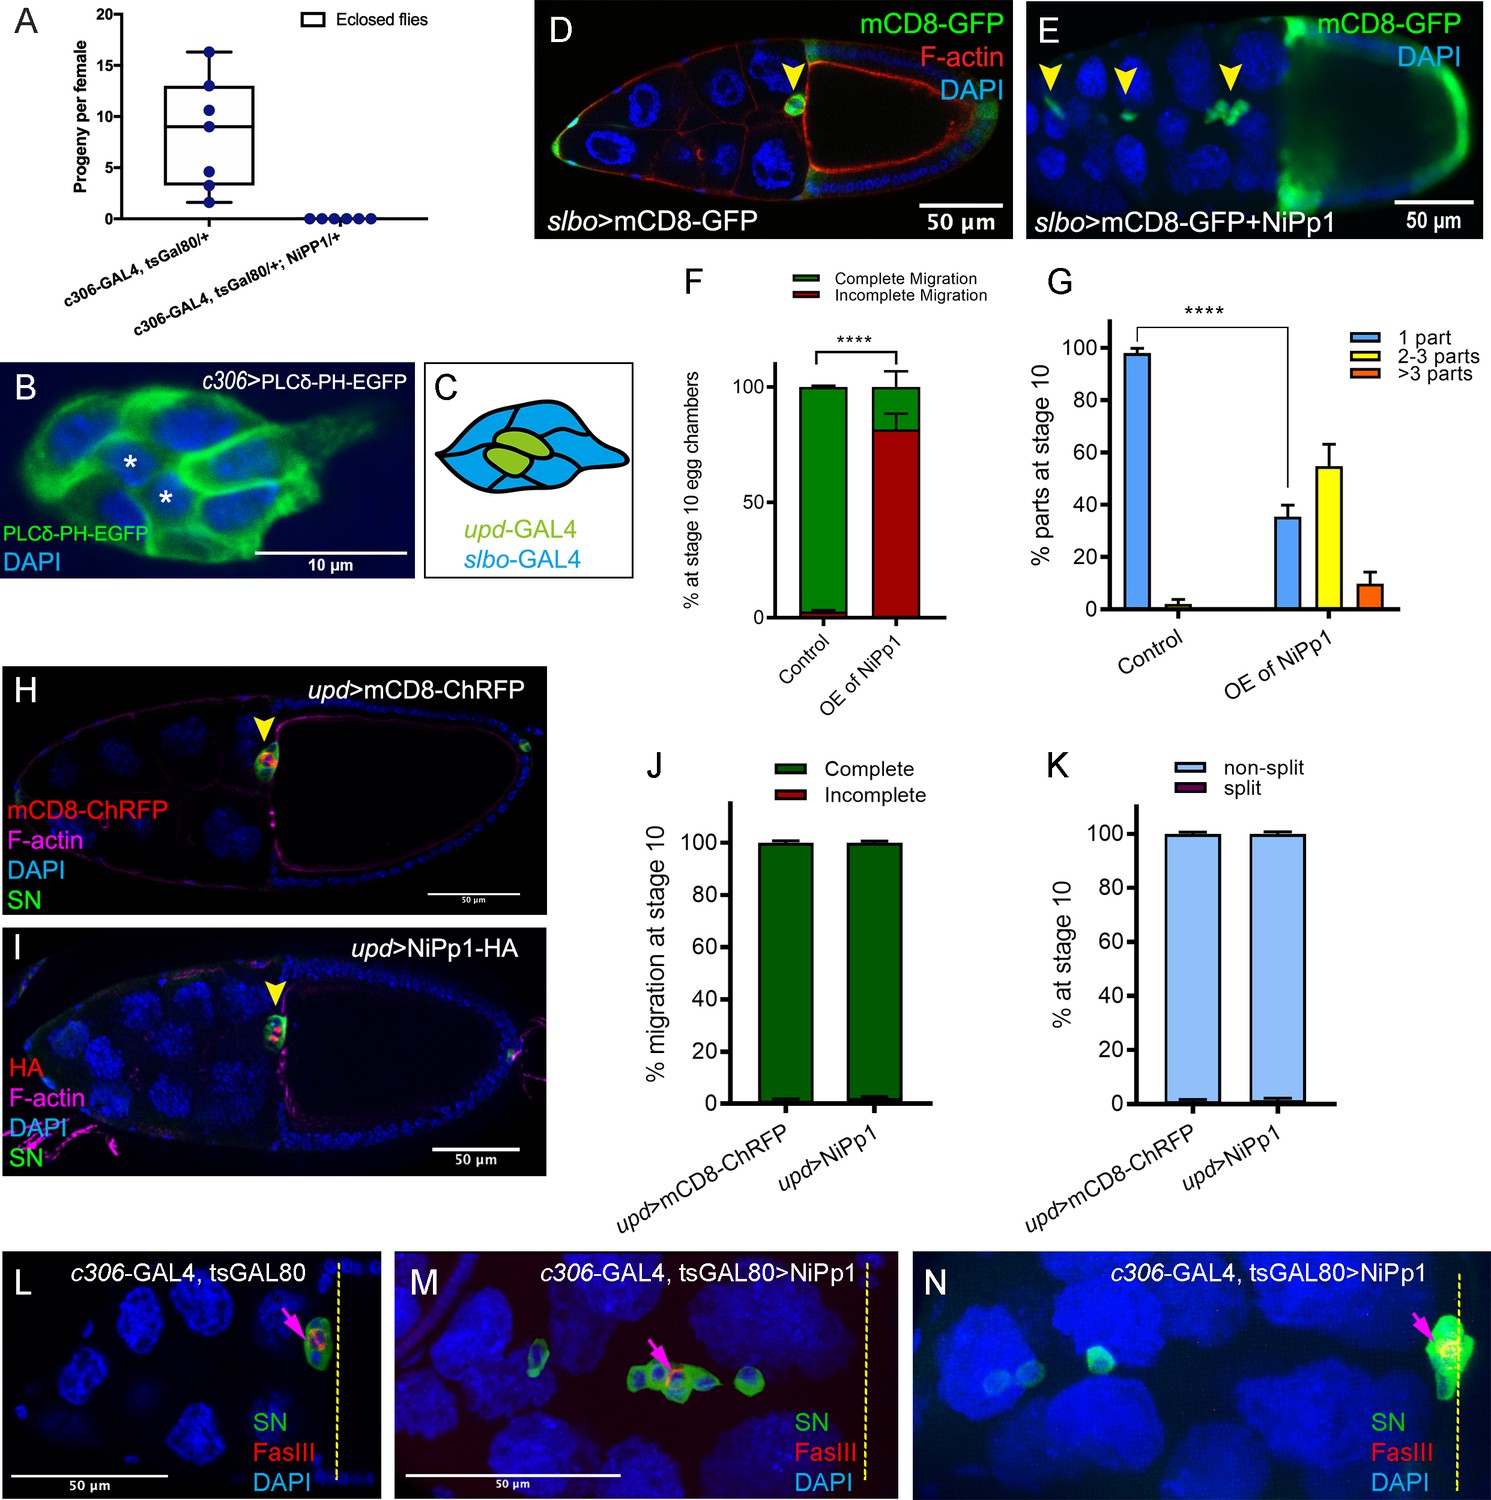
Cell-specific phenotypes induced by NiPp1.
(A) Fertility of control versus NiPp1-expressing females. The average progeny per female in each vial (individual plot points) is shown as a box-and-whiskers plot (see Figure 1 legend for details of plot). (B) Expression pattern of c306-GAL4 in the border cell cluster, as visualized by driving the expression of the membrane marker UAS-PLCδ-PH-EGFP (green). Nuclei are labeled by DAPI (blue). The central polar cells (asterisk) express GFP. (C) Schematic drawing of the border cell cluster showing the patterns of GAL4 drivers. upd-GAL4 (green) is used to drive expression in polar cells; slbo-GAL4 (blue) is used to drive expression in outer border cells but not polar cells. (D–G) Overexpression of NiPp1 in border cells, driven by slbo-GAL4, disrupts border cell cluster migration and cohesion. (D, E) Stage 10 slbo-GAL4 egg chambers expressing mCD8-GFP (green), which is detected in border cells (arrowheads), and stained for DAPI to label nuclei (blue) and phalloidin to label F-actin (red, (D). Control border cells (D) reach the oocyte as a single unit, but NiPp1 overexpressing border cells (E) dissociate from the cluster and fail to reach the oocyte. (F) Quantification of border cell migration for matched control and NiPp1 overexpression, shown as the percentage that did not complete (red), or completed (green) their migration to the oocyte (see Figure 1I for egg chamber schematic). (G) Quantification of cluster cohesion, shown as the percentage of border cells found as a single unit (one part) or split into multiple parts (2–3 parts or >3 parts) in control versus NiPp1-expressing egg chambers. (F, G) ****p<0.0001; unpaired two-tailed t test. Error bars represent SEM in three experiments, each trial assayed n ≥ 62 egg chambers (total n ≥ 201 for each genotype). (H–K) NiPp1 overexpression in polar cells, driven by upd-GAL4, does not impair border cell cluster migration or cohesion. (H, I) Stage 10 upd-GAL4 egg chambers expressing mCD8-ChRFP (red in H) or NiPp1-HA (red in I), which are detected in the polar cells (arrowheads), and co-stained for phalloidin to detect F-actin (magenta), SN to detect border cells (green), and DAPI to label nuclei (blue). (J, K) Quantification of border cell migration (J) and border cell cluster cohesion (K) for matched control and NiPp1 overexpression. Error bars represent SEM in three experiments, each trial assayed n ≥ 80 egg chambers (total n ≥ 313 for each genotype). ****p<0.0001, unpaired two-tailed t test. (L–N) Border cells expressing NiPp1 driven by c306-GAL4 (M, N), can separate from the polar cells, whereas control border cells (L) stay attached to polar cells. Stage 10 egg chambers stained for SN (green) to detect border cells, FasIII (red) to detect polar cells (arrows), and DAPI to label nuclei (blue). Yellow dashed line indicates anterior border of the oocyte. Example of a control (L) and two representative NiPp1 overexpressing border cell clusters (M, N). All genotypes are listed in Table 2.
Figure 1—figure supplement 3
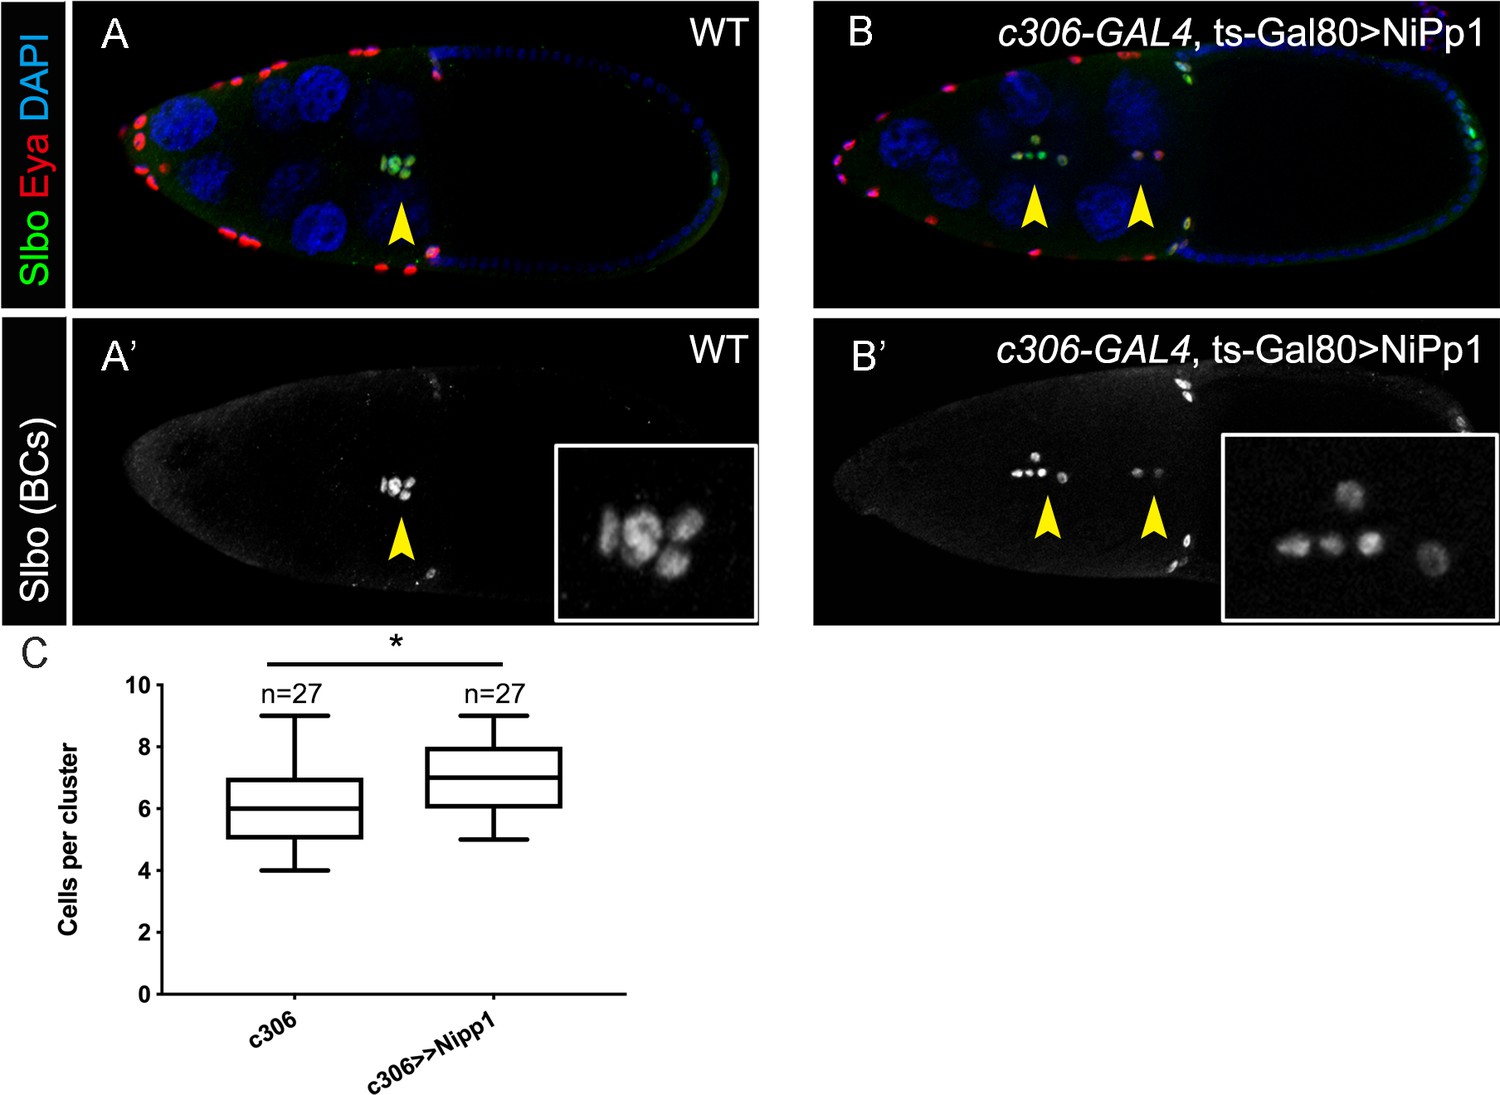
NiPp1 does not greatly alter border cell specification or cell number per cluster.
(A–B’) Stage 10 wild-type (A, A’) and NiPp1-expressing (B, B’) egg chambers stained with anti-Slbo (green in A, B; white in A’, B’), anti-Eya (red in A, B), and DAPI to detect nuclei (blue in A, B). Eya primarily marks the anterior follicle cells with lower levels in border cells but is absent from polar cells. Slbo marks border cells and polar cells (arrowheads). Insets, zoomed-in images of Slbo-expressing cells. (C) Quantification of cell number per cluster in control and NiPp1-expressing border cell clusters. The total number of egg chambers scored for cell number in each genotype is shown and was assayed in three independent trials. Error bars represent SEM, *p<0.05, unpaired two-tailed t test. All genotypes are listed in Table 2.
Figure 2 with 2 supplements
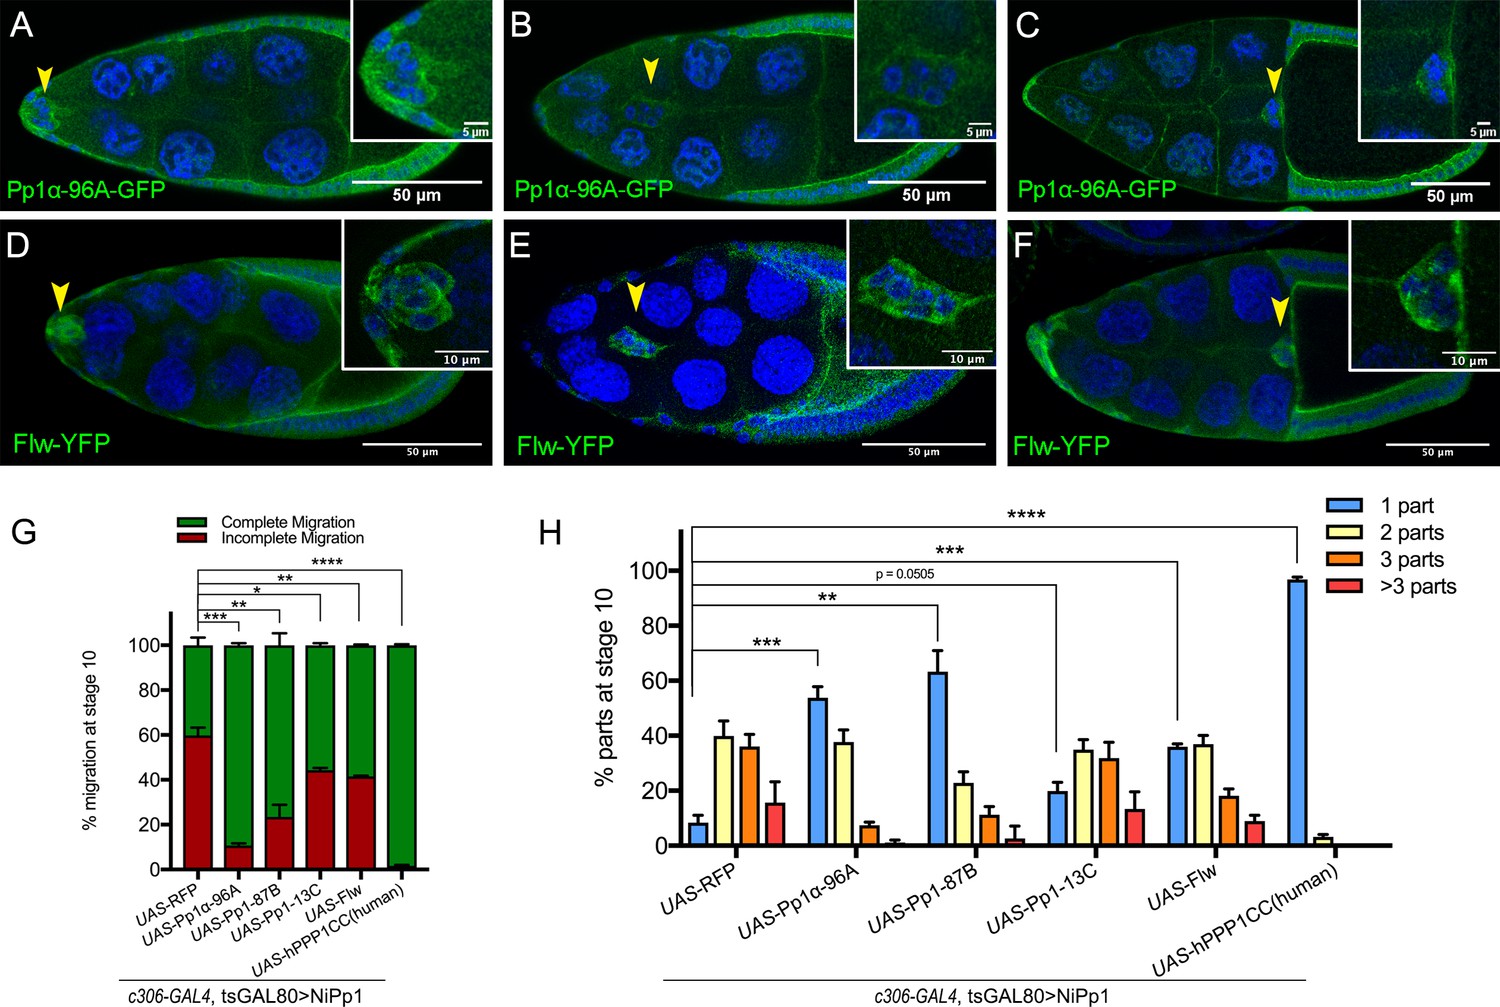
Pp1c expression in border cells and specificity of NiPp1 inhibition of Pp1c activity.
(A–F) Stage 9 and 10 egg chambers showing the endogenous patterns of Pp1c subunits (green) in border cells (arrowheads), follicle cells, and the germline nurse cells and oocyte. DAPI (blue) labels nuclei. Insets, zoomed-in detail of border cells from the same egg chambers. (A–C) Pp1α−96A (green) expression, visualized by a GFP-tagged fly-TransgeneOme (fTRG) line. (D–F) Flw expression (green), visualized by a YFP-protein trap in the endogenous flw genetic locus. (G, H) Overexpression of Pp1c genes rescues the migration (G) and cluster cohesion (H) defects of NiPp1-expressing border cells. (G) Quantification of the migration distance at stage 10 for border cells in NiPp1-expressing egg chambers versus rescue by overexpression of the indicated Pp1c genes, shown as complete (green) and incomplete (red) border cell migration (see Figure 1I for egg chamber schematic). (H) Quantification of cluster cohesion at stage 10, shown as the percentage of border cells found as a single unit (one part) or split into multiple parts (two parts, three parts,>3 parts) in NiPp1-expressing egg chambers versus rescue by overexpression of the indicated Pp1c genes. (G, H) Error bars represent SEM in three experiments, each trial assayed n ≥ 44 egg chambers (total n ≥ 148 per genotype). *p<0.05, **p<0.01; ***p<0.001; ****p<0.0001, unpaired two-tailed t test. All genotypes are listed in Table 2.
Figure 2—figure supplement 1
Rescue of NiPp1 phenotypes by Pp1c genes.
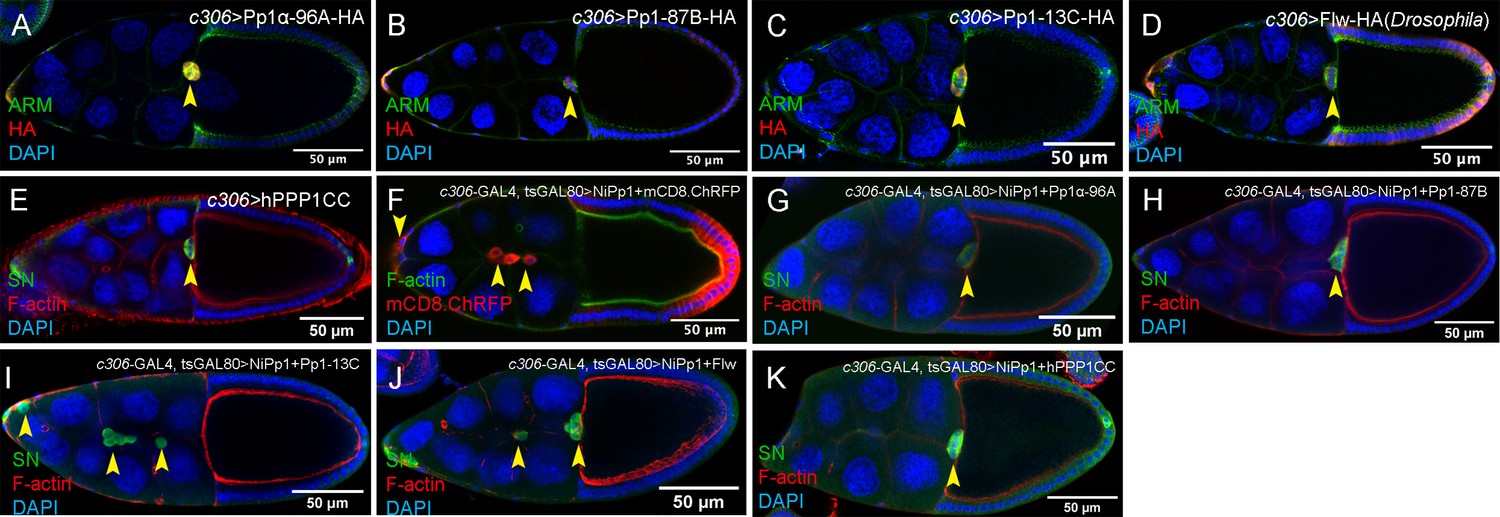
(A–E) Overexpression of Pp1c subunits on their own does not impair border cell migration to the oocyte. Stage 10 egg chambers of the indicated genotypes stained for Armadillo (Arm; β-Catenin) to detect cell membranes (green in A-D) or SN to detect border cells (green in E), HA to detect Pp1c overexpression (red in A-D) and DAPI to label nuclei (blue). (F–K) Overexpression of Pp1c subunits can rescue NiPp1-induced border cell migration defects and cohesion. Stage 10 egg chambers of the indicated genotypes stained for SN to detect border cells (green in G-K) or phalloidin to detect F-actin (green in F, red in G-K), mCD8-ChRFP (red in F), and DAPI to label nuclei (blue). Border cells in all panels are indicated by arrowheads. All genotypes are listed in Table 2.
Figure 2—figure supplement 2
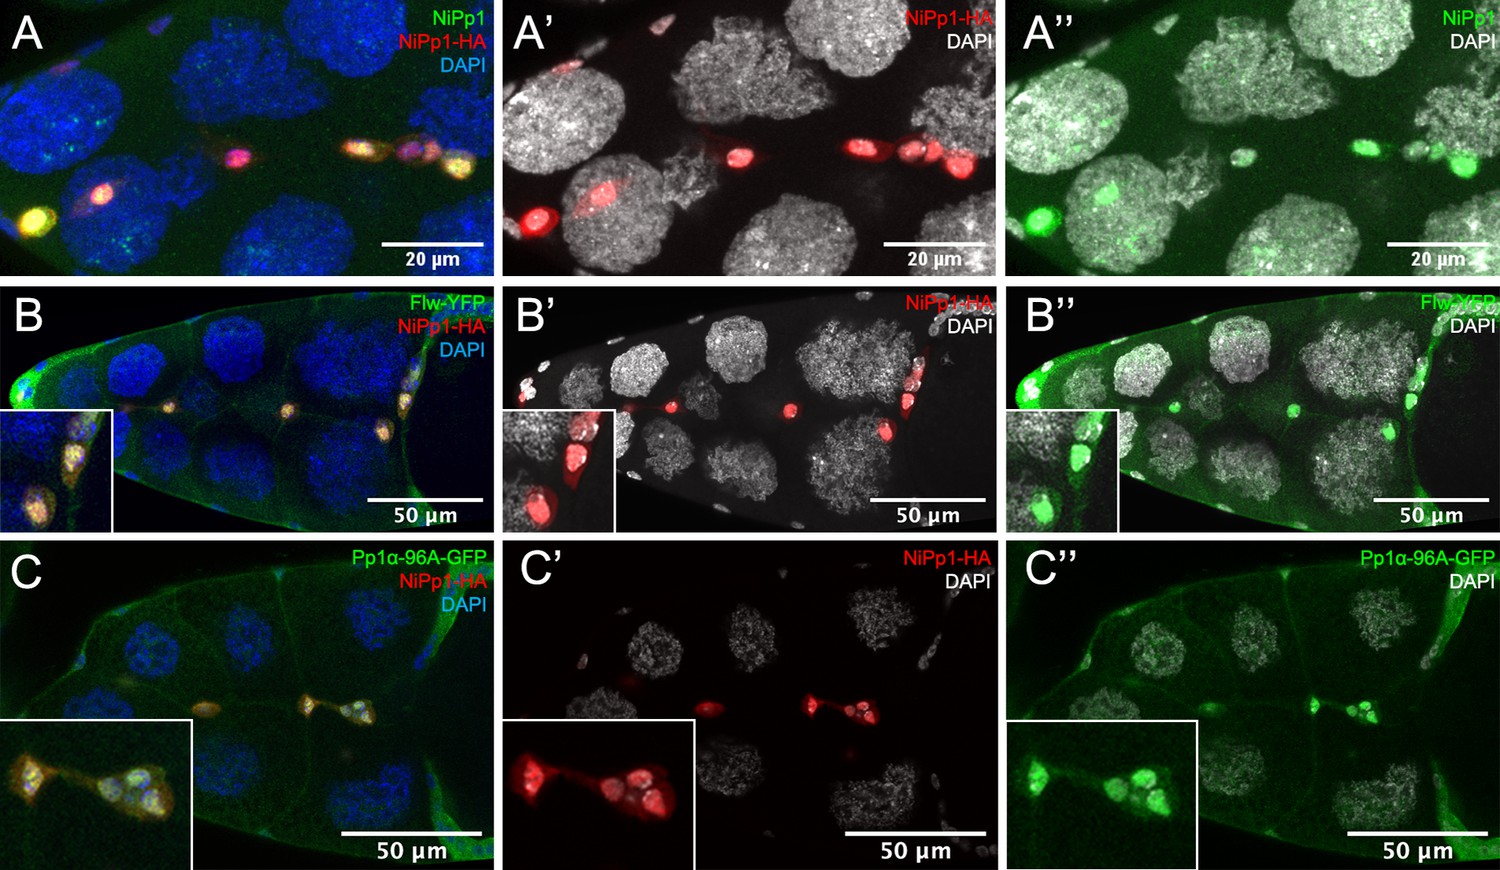
NiPp1 promotes nuclear localization of Pp1c subunits.
(A–A”) NiPp1-HA overexpression alone localizes mainly in the nuclei, revealed by HA antibody (red in A, A’) and human NiPp1 antibody (PPP1R8; green in A, A’’). (B–C”) NiPp1-HA overexpression promotes the nuclear localization of two Pp1c subunits, of Flw and Pp1α−96A. Stage 10 egg chambers co-expressing Flw-YFP (green in B, B”) or Pp1α−96A-GFP (green in C, C”) with UAS-NiPp1 were stained for anti-HA to detect NiPp1 expression (red in B, B’, C, C’) and DAPI to detect nuclei (blue in B, C; white in B’, B”, C’, C”). Insets, zoomed-in images of border cells.
Figure 3 with 1 supplement
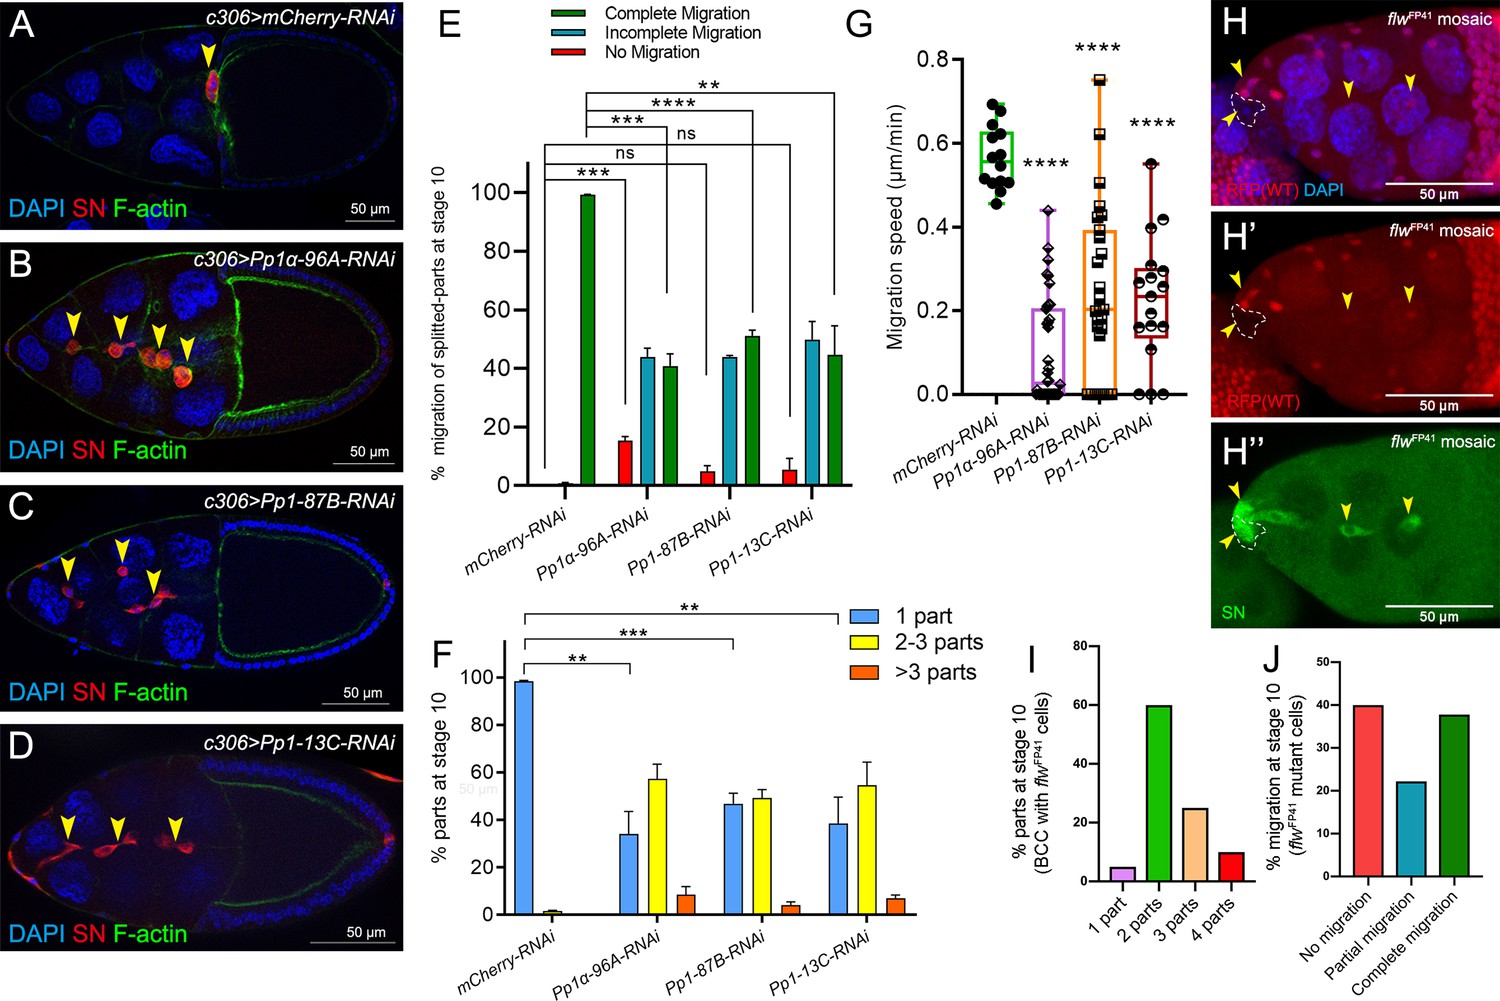
Pp1c genes are required for normal border cell migration and cluster cohesion.
(A–F) Knockdown of Pp1c genes by RNAi disrupts border cell cluster migration and cohesion. (A–D) Stage 10 egg chambers expressing RNAi against the indicated genes were stained for SN (red) to label border cells (arrowheads), phalloidin to label F-actin (green) and DAPI to label nuclei (blue). (E) Quantification of border cell cluster migration for matched control and RNAi knockdown of the indicated Pp1c genes, shown as the percentage of egg chambers with complete (green), partial (blue), or no (red) border cell migration. (F) Quantification of cluster cohesion, shown as the percentage of border cells found as a single unit (one part) or split into multiple parts (2–3 parts or >3 parts) in control versus Pp1c RNAi egg chambers. (E, F) Error bars represent SEM in three experiments, each trial assayed n ≥ 58 (total n ≥ 229 per genotype). (G) Measurement of border cell migration speed in the indicated genotypes from individual videos of Pp1c RNAi border cells; n = 14 videos for control, n = 11 videos for Pp1-87B-RNAi (27 split parts were tracked), n = 12 videos for Pp1-13C-RNAi (17 split parts were tracked), n = 16 videos for Pp1α-96A-RNAi (38 split parts were tracked), box-and-whiskers plot (see Figure 1 legend for details of plot). (E–G) *p<0.05, **p<0.01, ***p<0.001, ****p<0.0001, unpaired two-tailed t test. (H–J) flw mutant border cells split from the cluster and often fail to migrate. (H–H’’) Representative image of a stage 10 egg chamber with flwFP41 mutant clones, marked by the loss of nuclear mRFP (dotted outline in H, H’) and stained for SN (green in H’') to mark border cells (arrowheads) and DAPI (blue in H) to mark nuclei. (I, J) Quantification of flwFP41 mutant cluster cohesion (I) and migration (J) at stage 10; n = 20 egg chambers with flwFP41 clones were examined. (I) Quantification of cluster cohesion at stage 10, shown as the percentage of flwFP41 mosaic border cells found as a single unit (one part) or split into multiple parts (2, 3, or four parts). (J) Quantification of the migration distance at stage 10 for flwFP41 mosaic mutant border cells, shown as complete (green), partial (blue), or incomplete (red) border cell migration. All genotypes are listed in Table 2.
Figure 3—figure supplement 1
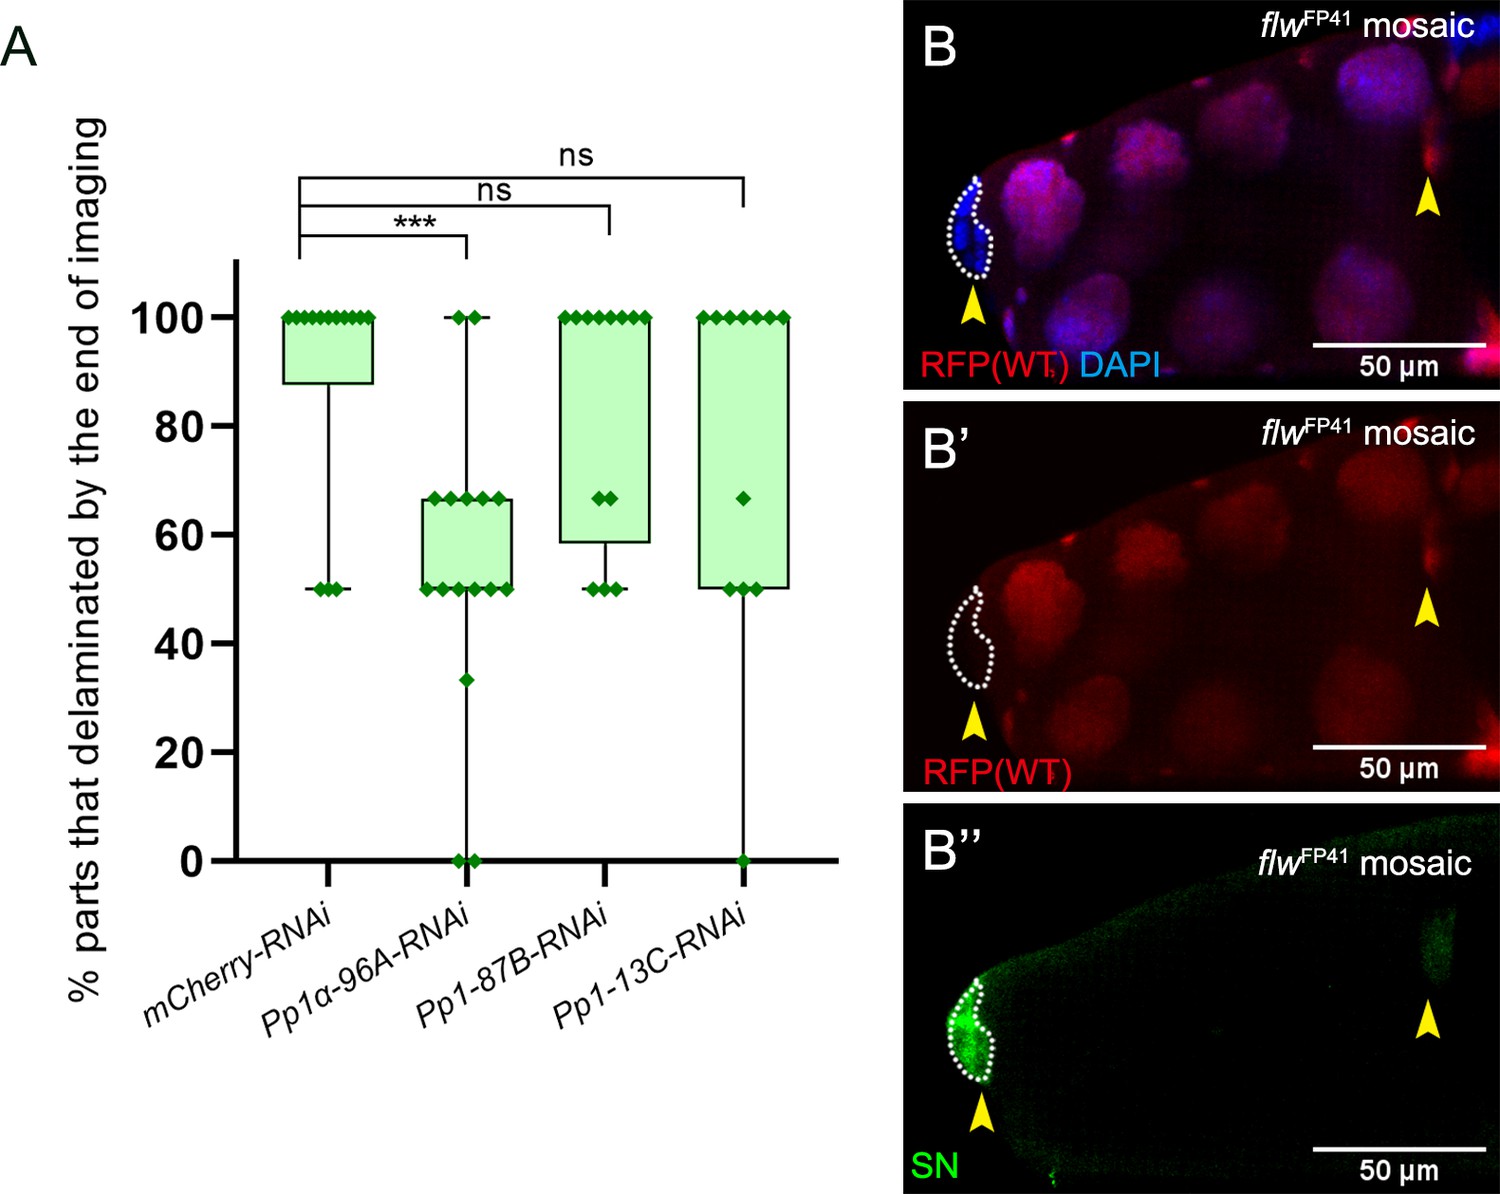
Delamination and migration defects caused by loss of Pp1c.
(A) Quantification of live split border cell cluster parts that completed migration during the movie, for matched control and RNAi knockdown of the indicated Pp1c genes. N = 14 videos for control, n = 13 videos for Pp1-87B-RNAi, n = 12 videos for Pp1-13C-RNAi, n = 16 videos for Pp1α-96A-RNAi, box-and-whiskers plot, ***p<0.001, unpaired two-tailed t test. (B–B”) Example of a stage 10 egg chamber with a flwFP41 mutant clone, marked by the loss of nuclear mRFP (red in B, B’; dotted outline) and stained for SN (green in B’) to mark border cells (arrowheads) and DAPI (blue in B) to mark nuclei. All genotypes are listed in Table 2.
Figure 4 with 1 supplement
The cadherin-catenin complex is required for the collective cohesion of the migrating border cell cluster and is regulated by Pp1.
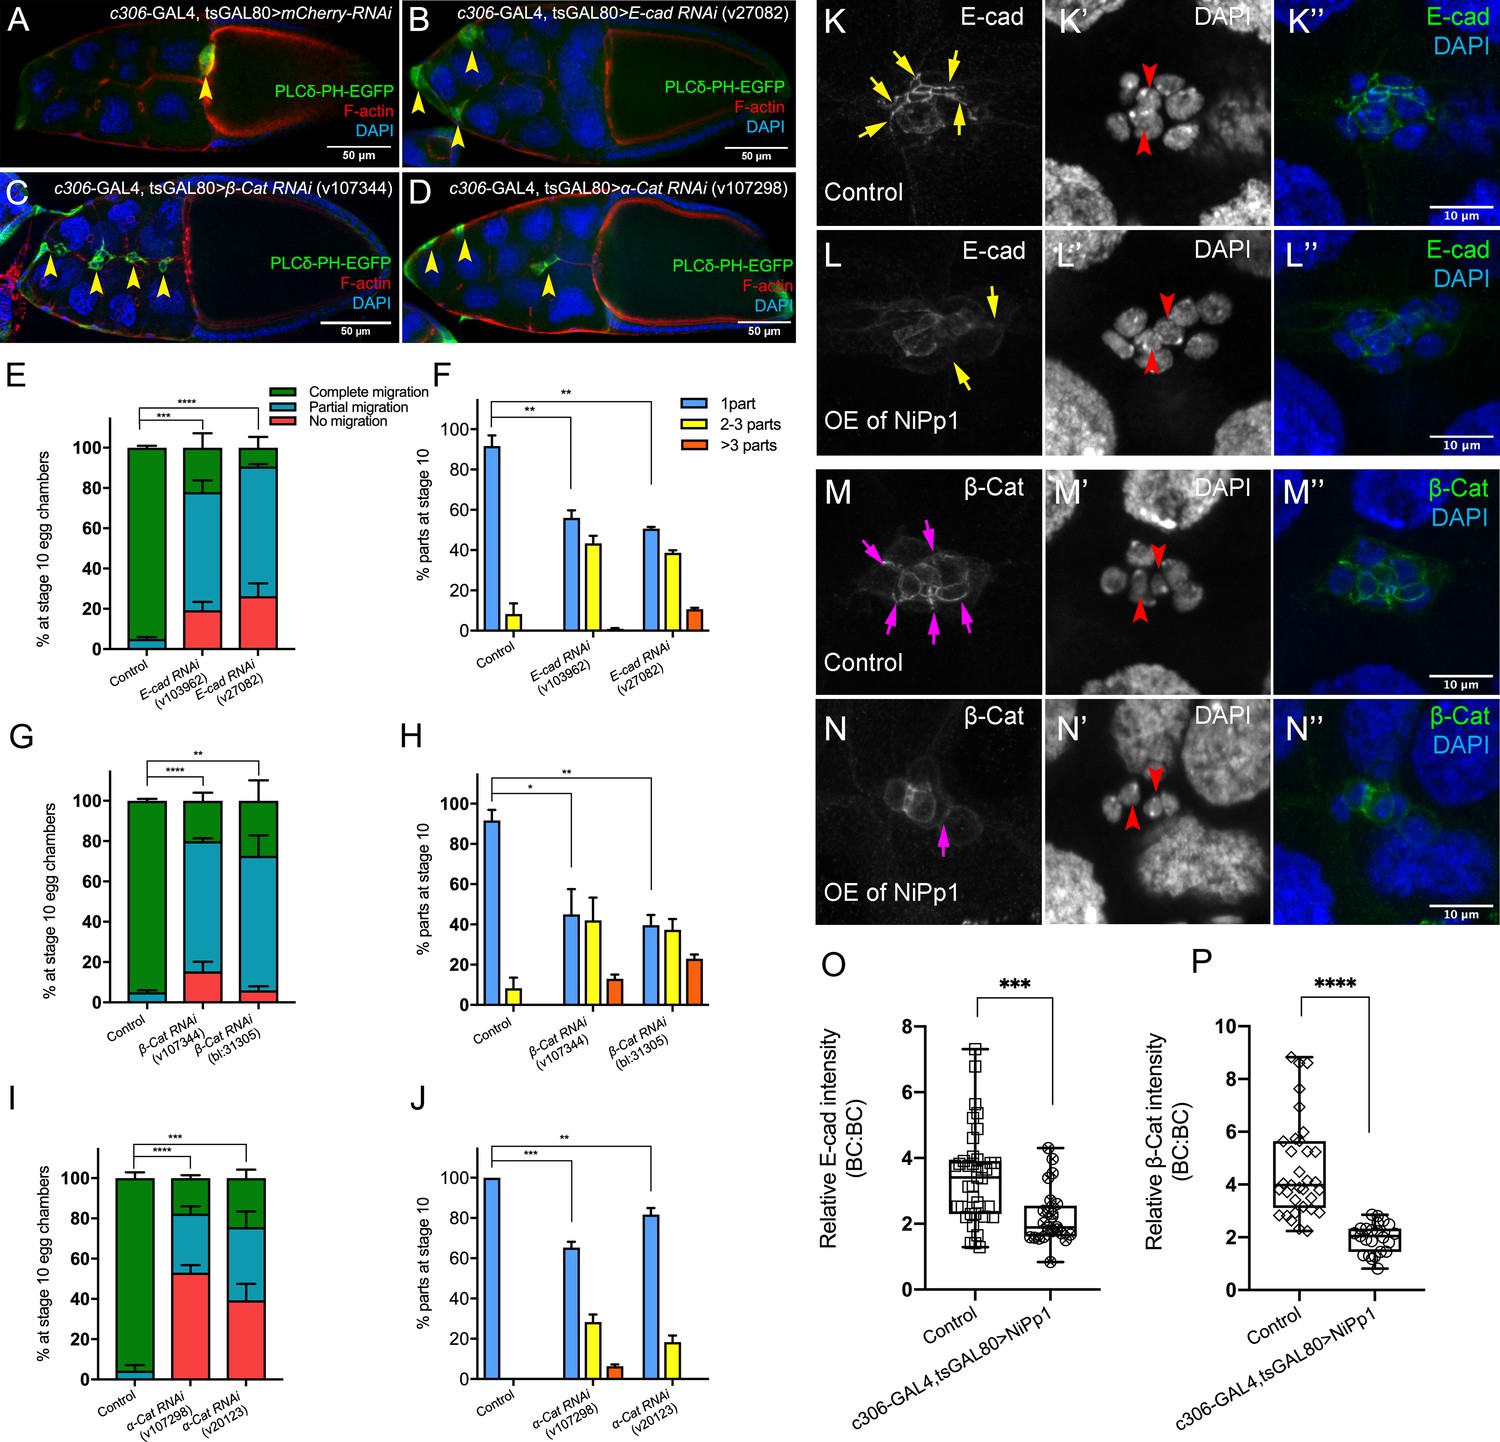
(A–J) Knocking down E-Cad, β-Cat or α-Cat by RNAi disrupts border cell cluster migration and cohesion. Images of stage 10 egg chambers stained for phalloidin to label F-actin (red) and DAPI to label nuclei (blue). Border cells (arrowheads) express the membrane marker PLCδ-PH-EGFP (green). (E–J) Quantification of border cell migration (E, G, I) and cluster cohesion (F, H, J) in stage 10 control and E-Cad-RNAi (E, F), β-Cat-RNAi (G, H) and α-Cat-RNAi (I, J) egg chambers. The controls for E-Cad and β-Cat-RNAi are identical, but shown on separate graphs (E–H) for clarity; a separate matched control is shown for α-Cat RNAi (I, J). Error bars represent SEM in three experiments, each trial assayed n ≥ 27 egg chambers (total n ≥ 93 for each genotype). *p<0.05; **p<0.01; ***p<0.001; ****p<0.0001, unpaired two-tailed t test. (E, G, I) Quantification of border cell migration, shown as the percentage of egg chambers with complete (green), partial (blue), or no (red), border cell migration. (F, H, J) Quantification of cluster cohesion, shown as the percentage of border cells found as a single unit (one part) or split into multiple parts (2–3 parts or >3 parts) in control versus RNAi egg chambers. (K–N’’) Representative images showing the E-Cad (white in K, L; green in K’', L”) and β-cat (white in M, N; green in M’', N”) protein expression pattern in control and NiPp1 overexpressing (OE) border cells. Border cells were co-stained for DAPI to mark nuclei (white in K’, L’, M’, N’; blue in K’', L”, M”, N”). Images were generated from merged z-sections. The enriched levels of E-Cad (K, L) and β-cat (M, N) between border cells (border cell-border cell contacts) are marked by yellow and magenta arrows, respectively. The central polar cells are indicated by red arrowheads (K’, L’, M’, N’). (O, P) Quantification of relative E-Cad (O) and β-Cat (P) protein intensity levels in control and NiPp1 overexpressing border cell clusters shown as box-and-whiskers plots (see Figure 1 legend for details of plot). For E-Cad, 39 border cell-border cell contacts from eight matched control clusters and 24 border cell-border cell contacts from 16 NiPp1 clusters were measured. For β-Cat, 33 border cell-border cell contacts from seven matched control clusters and 23 border cell-border cell contacts from 15 NiPp1 clusters were measured. ***p<0.001, ****p<0.0001, unpaired two-tailed t test. All genotypes are listed in Table 2.
Figure 4—figure supplement 1

RNAi for cadherin-catenin reduces endogenous levels of the specifically targeted gene.
(A–H’) Efficiency of cadherin-catenin RNAi in border cells as detected by antibody staining to the respective proteins. Stage 10 control (A, A’, C, C’, E, E’), E-Cad-RNAi (B, B’), β-Cat-RNAi (line v107344; D, D’), and α-Cat-RNAi (F, F’) egg chambers stained for SN (green), the respective proteins in red (E-Cad in A-B’, β-Cat in C-D’, and α-Cat in E-F’), and DAPI to label nuclei (blue in A, B, C, D, E, F). Border cells are indicated by arrowheads. Insets, zoomed-in views of border cell clusters. (G–H’) Efficiency of matched control (G, G’) and β-Cat-RNAi (line BL-31305; H, H’) in border cells as detected by β-Cat antibody (green) and DAPI (blue). (I, J) Border cell migration (I) and cluster cohesion (J) in control versus α-Cat-RNAi driven by upd-GAL4 in the polar cells. Quantification at stage 10, n ≥ 44 (total n ≥ 192 for each genotype); ns, not significant, **p<0.01, ***p<0.001, unpaired two-tailed t test. (I) Quantification of migration shown as the percentage of egg chambers with complete (green), partial (blue), or no (red), border cell migration. (J) Quantification of cluster cohesion, shown as the percentage of border cells found as a single unit (no split, blue) or split into two or more parts (split, yellow). All genotypes are listed in Table 2.
Figure 5 with 1 supplement
Pp1c is required for normal border cell protrusion dynamics.
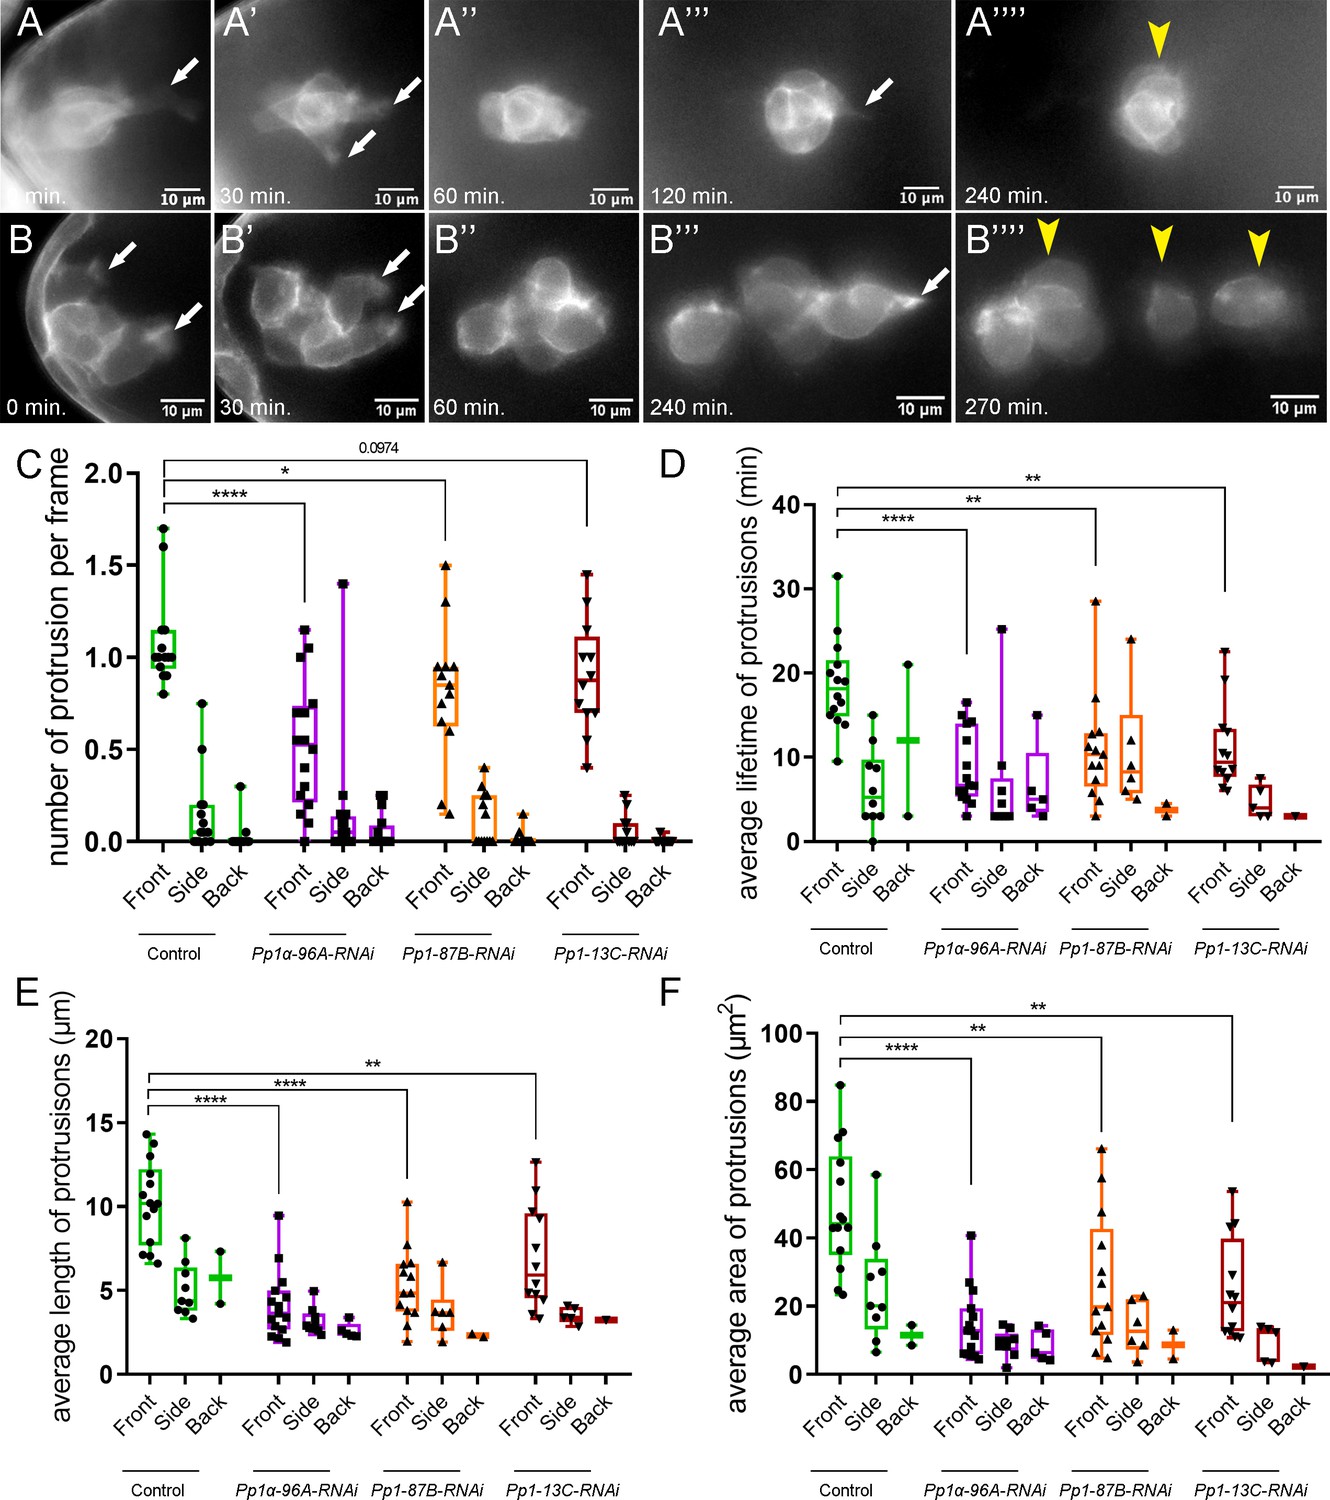
(A–B””) Frames from a matched control (Video 6; A–A””) and a Pp1α-96A-RNAi (Video 8; B–B””) showing the migrating border cell cluster expressing the membrane marker PLCδ-PH-EGFP. Time in min. Arrows indicate protrusions, arrowheads indicate cluster ‘parts’. (C–F) Quantification of the number of protrusions per frame (C), average protrusion lifetime (D), average protrusion length (E), and average protrusion area (F) from videos of the indicated genotypes. Protrusions were defined as in Figure 5—figure supplement 1A and in the Materials and methods. For control, protrusions were measured in 14 videos (n = 51 front-directed protrusions, n = 15 side-directed protrusions, n = 2 back-directed protrusions); for Pp1α-96A-RNAi, protrusions were measured in n = 16 videos (n = 59 front protrusions, n = 19 side protrusions, n = 9 for back protrusions), for Pp1-87B-RNAi, protrusions were measured in 13 videos (n = 67 for front protrusions, n = 10 for side protrusions, n = 3 for back protrusions); for Pp1-13C-RNAi, protrusions were measured in 12 videos (n = 61 front protrusions, n = 9 side protrusions, n = 1 back protrusion). Data are presented as box-and-whiskers plots (see Figure 1 legend for details of plot). *p<0.05, **p<0.01, ***p<0.001, ****p<0.0001, unpaired two-tailed t test. All genotypes are listed in Table 2.
Figure 5—figure supplement 1
Additional quantification of protrusion dynamics and Rac activity in Pp1-inhibited and α-Cat-RNAi border cells.
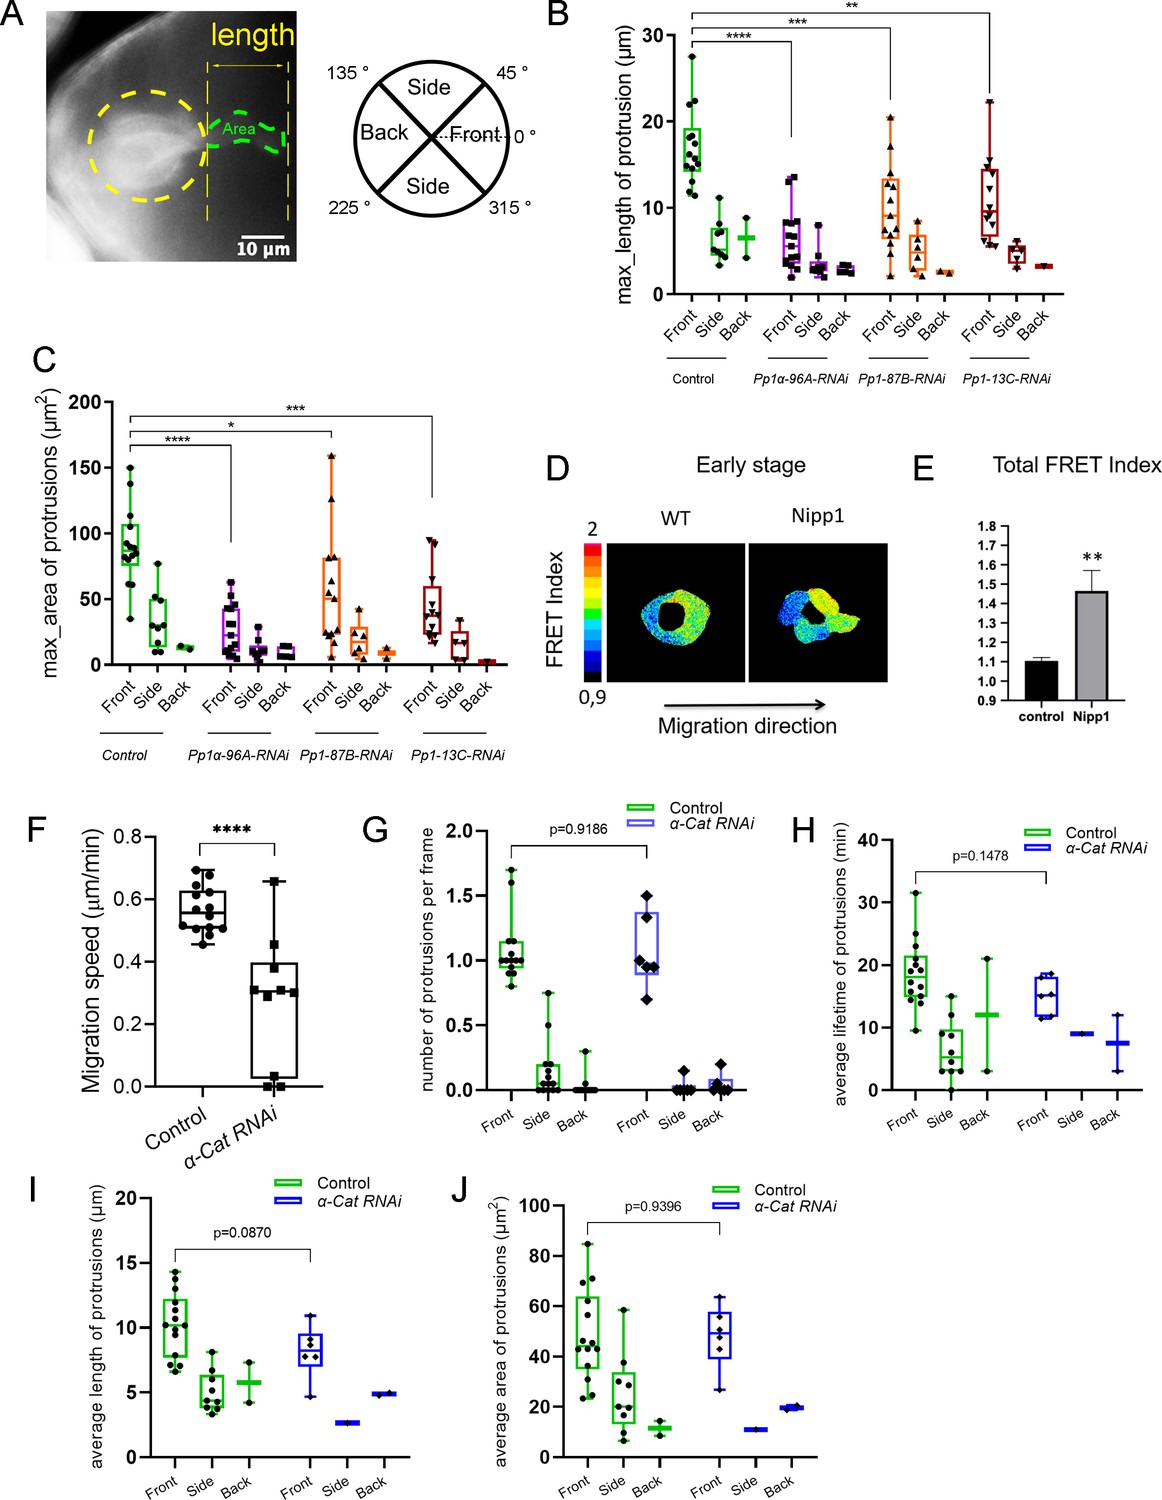
(A) Close-up view of a live border cell cluster depicting how protrusions are measured. The main body of the border cell cluster is outlined (yellow circle). The protrusion length and area (green outline) were defined and measured as a cellular projection extending away from the main cluster or border cell. The schematic indicates how protrusion direction is defined. (B, C) Quantification of protrusion max_length (B) and max_area (C) in control versus Pp1c-RNAi border cells. Data are presented as a box-and-whiskers plot (see Figure 1 legend for details of plot and Figure 5 legend for protrusion numbers for each genotype). *p<0.05; **p<0.01; ***p<0.001; ****p<0.0001; unpaired two-tailed t test. (D, E) Rac-FRET in wild-type versus NiPp1 border cells (n = 22 for control, n = 18 for slbo >NiPp1). (D) Representative FRET images of control and NiPp1-expressing border cells, color-coded according to the heat map and FRET index. (E) Quantification of the total FRET index measured in control and NiPp1 border cells. Error bars represent SEM; p=0.0033 (**), unpaired t test with Welch's correction. (F–J) Quantification of the migration speed (F), number of protrusions per frame (G), average protrusion lifetime (H), average protrusion length (I), and average protrusion area (J) from videos of α-Cat-RNAi versus control border cells. For control, protrusions were measured in 14 videos (n = 51 front-directed protrusions, n = 15 side-directed protrusions, n = 2 back-directed protrusions); for α-Cat-RNAi, protrusions were measured in six videos (n = 29 front protrusions, n = 1 side protrusion, n = 9 back protrusions). Data are presented as box-and-whiskers plots (see Figure 1 legend for details of plot). ****p<0.0001, unpaired two-tailed t test. All genotypes are listed in Table 2.
Figure 6 with 3 supplements
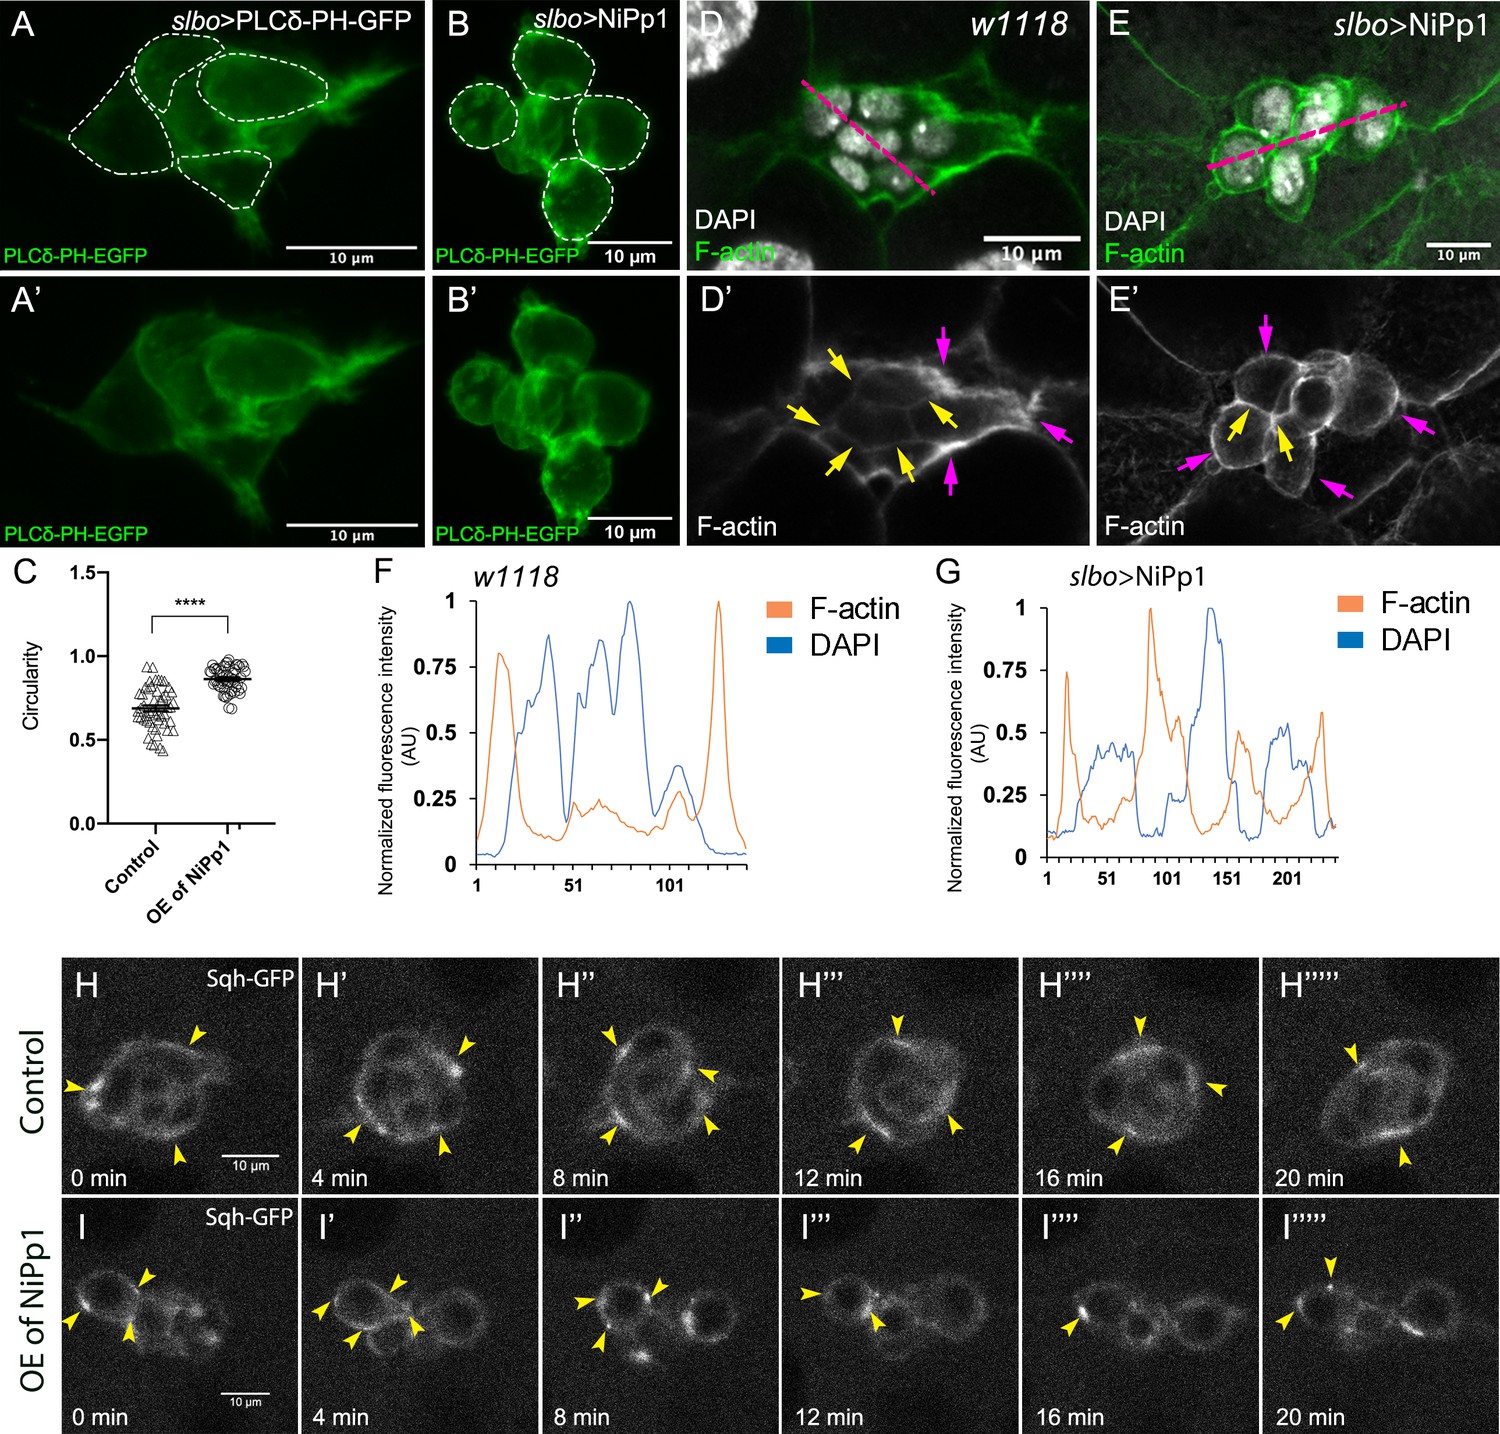
Pp1 activity promotes normal border cell shape and distribution of actomyosin in the border cell cluster.
(A–C) Pp1 is required for border cell shape. (A–B’) Examples of control (A, A’) and NiPp1-expressing border cells (B, B’). Cell shape was visualized using the membrane marker PLCδ-PH-EGFP driven by slbo-GAL4 (green). Cells were outlined (A, B) and measured for circularity (C). (C) Control border cells are more elongated compared to NiPp1-expressing border cells (closer to 1.0, a perfect circle). Quantification of circularity, showing all data points and the mean; 51 control border cells and 57 NiPp1-expressing border cells were measured. ****p<0.0001, unpaired two-tailed t test. (D–G) Pp1 restricts high levels of F-actin to the border cell cluster periphery. Egg chambers were stained for phalloidin to detect F-actin (green in D, E; white in D’, E’) and DAPI to visualize nuclei (white in D, E). (D, D’) Control wild-type border cells (w1118) have higher F-actin at the cluster perimeter (magenta arrows) and low levels at cell-cell contacts inside the cluster (yellow arrows). (E, E’) NiPp1 overexpression increases F-actin inside the cluster at cell contacts between border cells and at cell contacts between polar cells and border cells (yellow arrows). F-actin is relatively high on the outer surfaces of border cells (magenta arrows). (F, G) Plot profiles of normalized F-actin (orange) and DAPI (blue) fluorescence pixel intensity (AU, arbitrary units) measured along the lines shown in (D) and (E); similar results were obtained from additional border cell clusters (n = 11 for control and n = 8 for slbo >NiPp1). (H–I’’’’’) Pp1 restricts Myo-II, as visualized by Sqh-GFP, to the cluster periphery in live border cells. Stills from confocal videos of Sqh-GFP in mid-staged border cells over the course of 20 min. Enriched Sqh-GFP is marked by arrowheads. Imaging gain and other acquisition parameters were the same, except that the range of z-stacks vary slightly. Similar patterns were observed for control in n = 8 movies and n = 10 for NiPp1 overexpression. (H–H””’) Control border cells (Video 16). (I–I””’) NiPp1 overexpression (Video 17) changes the dynamics of Sqh-GFP, with more Sqh-GFP located in individual border cells and at cell contacts between border cells. All genotypes are listed in Table 2.
Figure 6—figure supplement 1
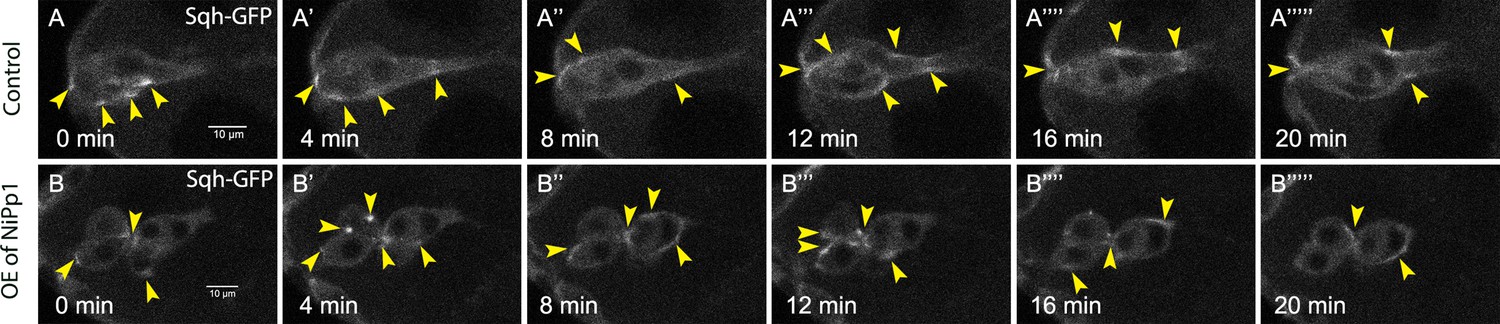
Pp1 restricts the distribution of Myo-II to the cluster periphery during early migration.
(A–B’’’’’) Stills from representative confocal videos of dynamic Sqh-GFP in early-migration borders cells over the course of 20 min. Image gain and other acquisition parameters were the same, except that the range of z-stacks may vary slightly. (A–A’’’’’) Control border cells (Video 14) have dynamic Sqh-GFP, which is mainly restricted to the cluster perimeter. Some signal is found in the central polar cells. (B–B’’’’’) NiPp1 overexpressing border cells (Video 15) alters the localization of Sqh-GFP, with more Sqh-GFP enriched around individual border cells. All genotypes are listed in Table 2.
Figure 6—figure supplement 2
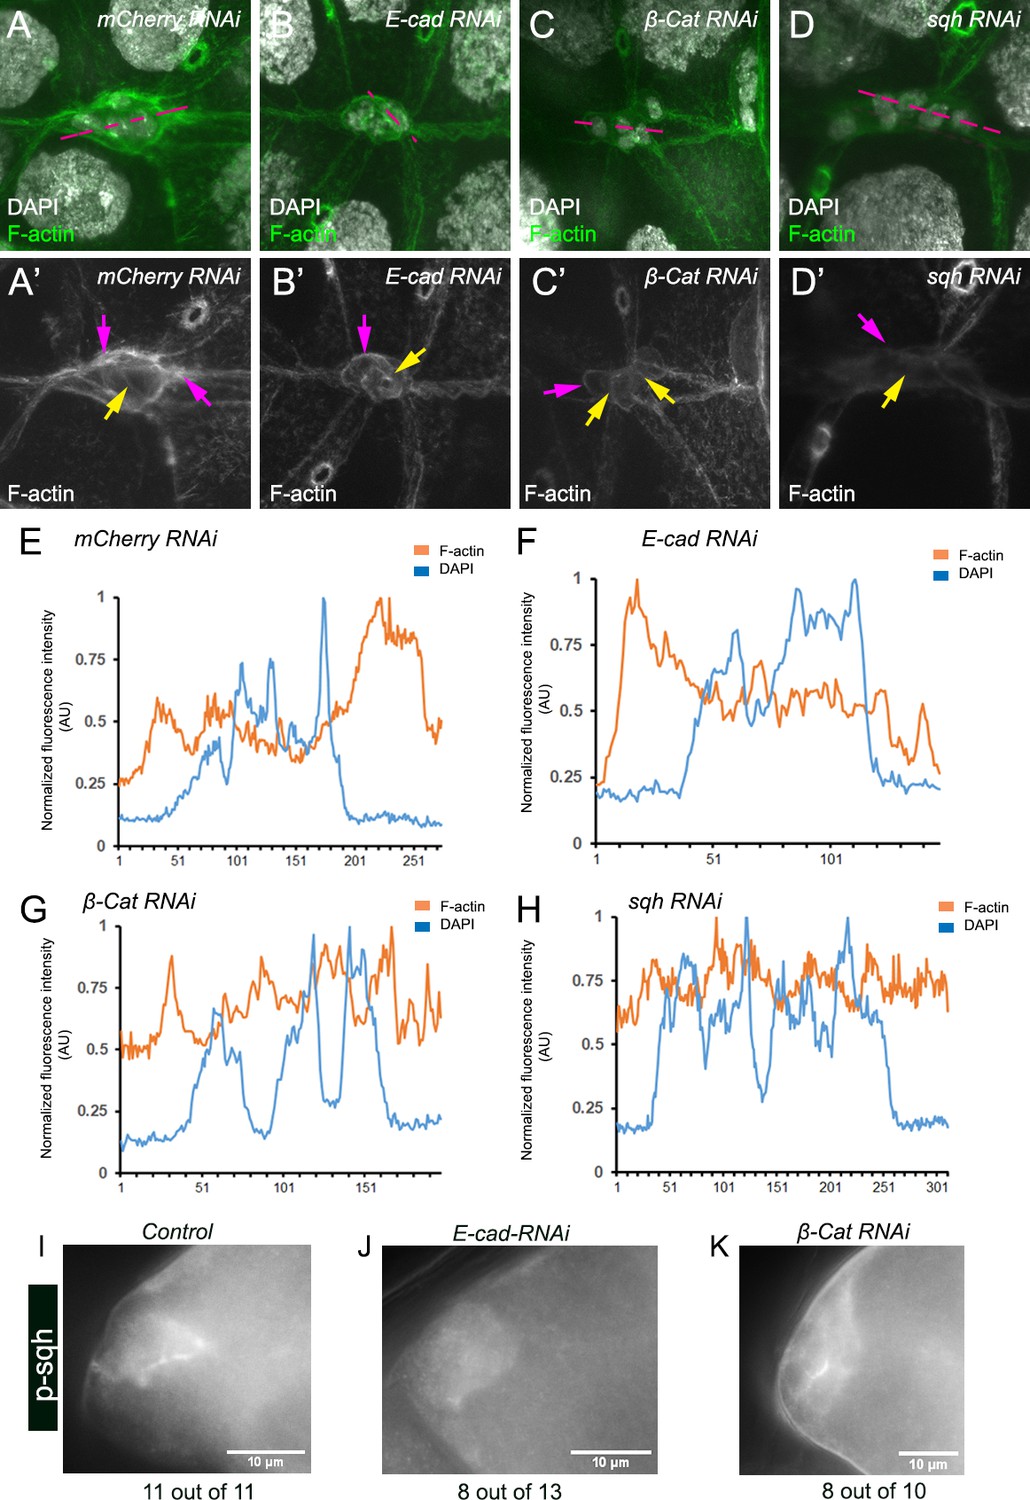
RNAi for cadherin-catenin alters the actomyosin pattern of the border cell cluster.
(A, A’) Control mCherry-RNAi border cell cluster has higher F-actin (magenta arrows) at the periphery of the cluster, but lower levels inside (yellow arrow) the group. (B–D’) Knocking down E-Cad (B, B’), β-Cat (C, C’), or sqh (D, D’) reduces the relatively high F-actin on the outer surfaces of border cells. (E–H) Plot profiles of normalized F-actin (orange) and DAPI (blue) fluorescence pixel intensity (AU, arbitrary units) measured along the lines shown in (A–D); similar results were obtained from additional border cell clusters (n = 11 for control, n = 11 for E-cad RNAi, n = 9 for β-Cat RNAi, n = 10 for sqh RNAi. (I–K) Greyscale images of clusters stained with an anti-phosphorylated Sqh (p-Sqh) antibody in control (I), E-cad RNAi (J), and β-Cat RNAi (K) clusters, p-Sqh is enriched at the periphery and the protrusion of the control cluster (n = 11 out of 11), while knocking down cadherin-catenin complex abolishes this enrichment (E-Cad-RNAi, 8 out of 13 no longer enriched at periphery; β-Cat-RNAi, 8 out of 10 no longer enriched at periphery).
Figure 6—figure supplement 3
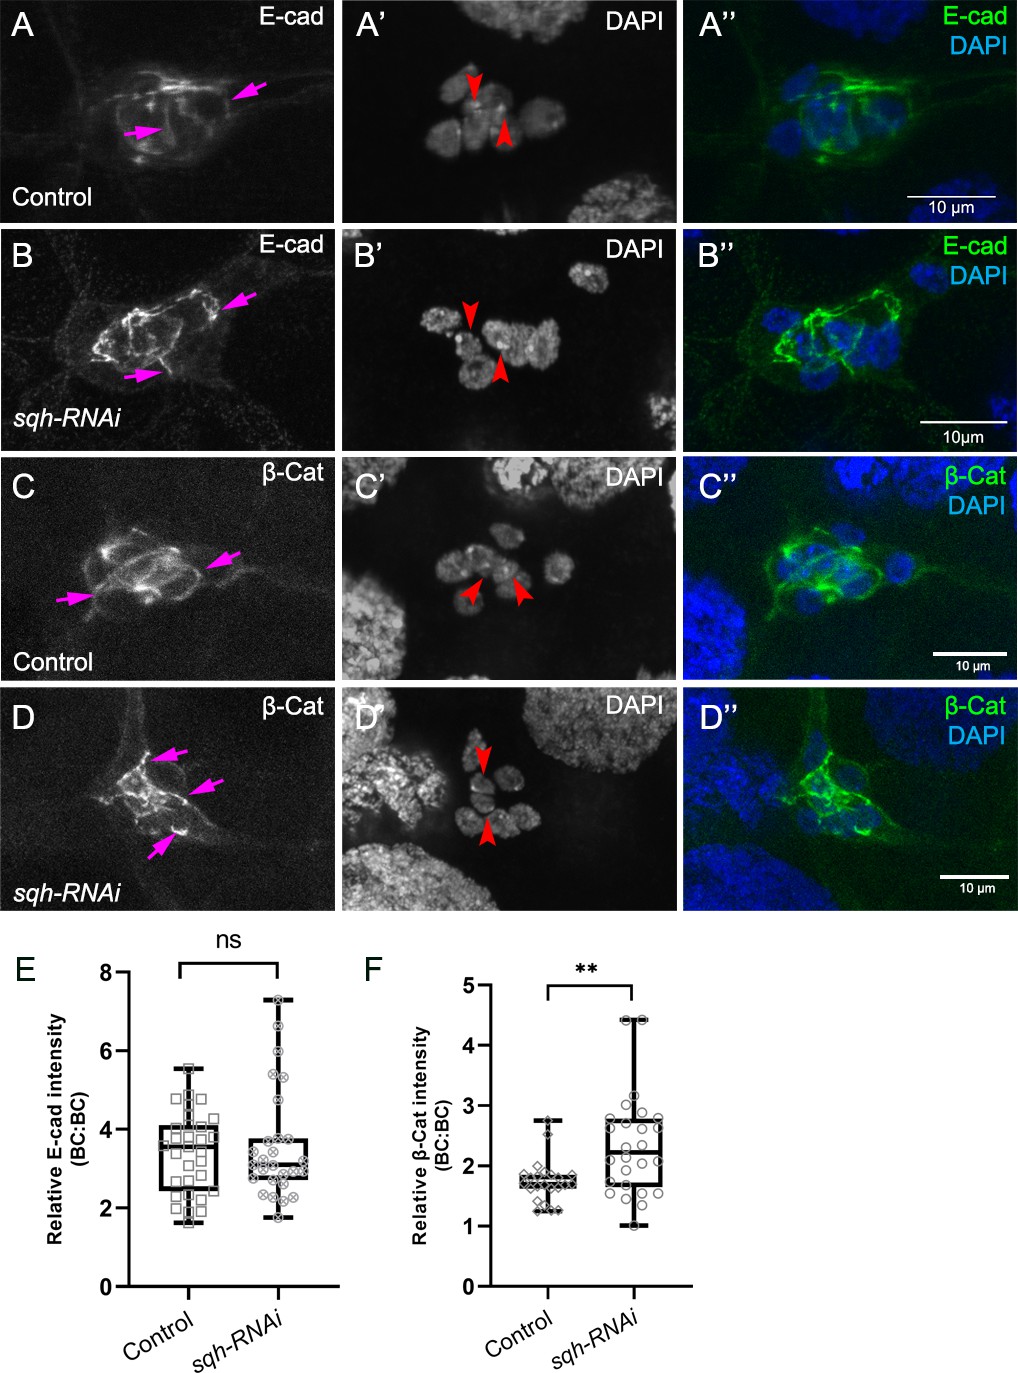
Myo-II is not required for cadherin-catenin enrichment at border cell-border cell contacts.
(A–D) Representative images showing the E-Cad (white in A, B; green in A’, B”) and β-cat (white in C, D; green in C’, D”) protein expression patterns in control (A–A’’, C–C’’) and sqh-RNAi (B–B’’, D–D’’) border cells. Border cells were co-stained for DAPI to mark nuclei (white in A’, B’, C’, D’; blue in A’, (B”, C”, D”). Images were generated from merged z-sections. The enriched levels of E-Cad (A, B) and β-cat (C, D) between border cells (border cell-border cell contacts) are marked by magenta arrows. The central polar cells are indicated by red arrowheads (A’, B’, C’, D’). (E, F) Quantification of relative E-Cad (E) and β-Cat (F) protein intensity levels in control and sqh-RNAi border cell clusters shown as box-and-whiskers plots (see Figure 1 legend for details of plot). For E-Cad, 37 border cell-border cell contacts from nine matched control clusters and 27 border cell-border cell contacts from nine sqh-RNAi clusters were measured. For β-Cat, 23 border cell-border cell contacts from eight matched control clusters and 26 border cell-border cell contacts from nine sqh-RNAi clusters were measured. **p<0.05, unpaired two-tailed t test. All genotypes are listed in Table 2.
Figure 7 with 2 supplements
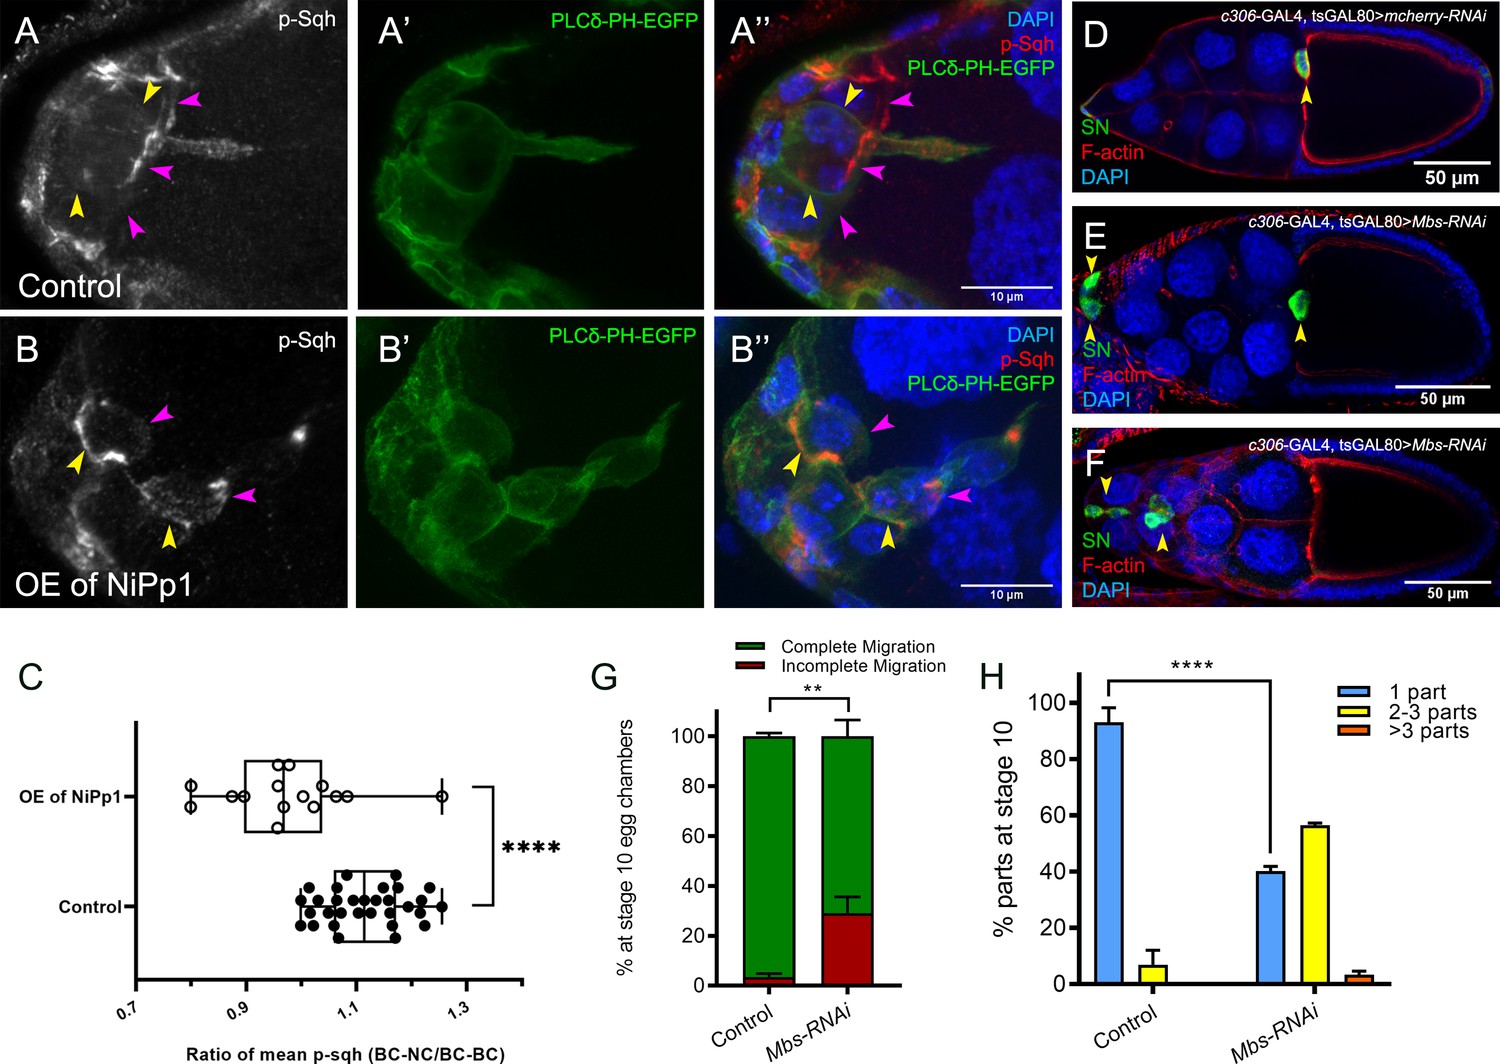
Pp1, through myosin phosphatase, promotes contractility of the cluster.
(A–B’’) Pp1 restricts Myo-II activation to the cluster periphery. Representative images showing p-Sqh localization (white in A, B; red in A’’, (B’’) and membrane GFP (PLCδ-PH-EGFP; green in A’, (A’’, B’, B’’) in control (A–A’’) and NiPp1 overexpressing (B–B’’) border cells; DAPI labels nuclei (blue in A’’, (B’’). There is an increase in p-Sqh levels (arrowheads) at the interface between border cells when NiPp1 is overexpressed. (C) Quantification of the mean pixel intensity of p-Sqh as a ratio of BC:NC/BC:BC. BC:NC stands for border cell-nurse cell interfaces, while BC:BC stands for border cell-border cell interfaces. N = 15 for control and n = 11 for NiPp1 overexpression. (D–H) Knocking down Mbs disrupts border cell migration and cluster cohesion. (D–F) Stage 10 control (D) and Mbs RNAi (E,F) egg chambers stained for SN to label border cells (green), phalloidin to label F-actin (red) and DAPI to label nuclei (blue). (G) Quantification of border cell cluster migration for matched control and Mbs-RNAi, shown as the percentage that did not complete (red), or completed (green) their migration to the oocyte (see Figure 1I for egg chamber schematic). (H) Quantification of cluster cohesion at stage 10, shown as the percentage of border cells found as a single unit (one part) or split into multiple parts (two parts, three parts,>3 parts) in control versus Mbs-RNAi border cells. (G, H) Each trial assayed n ≥ 61 egg chambers (total n ≥ 220 per genotype). **p<0.01; ****p<0.0001; unpaired two-tailed t test. All genotypes are listed in Table 2.
Figure 7—figure supplement 1
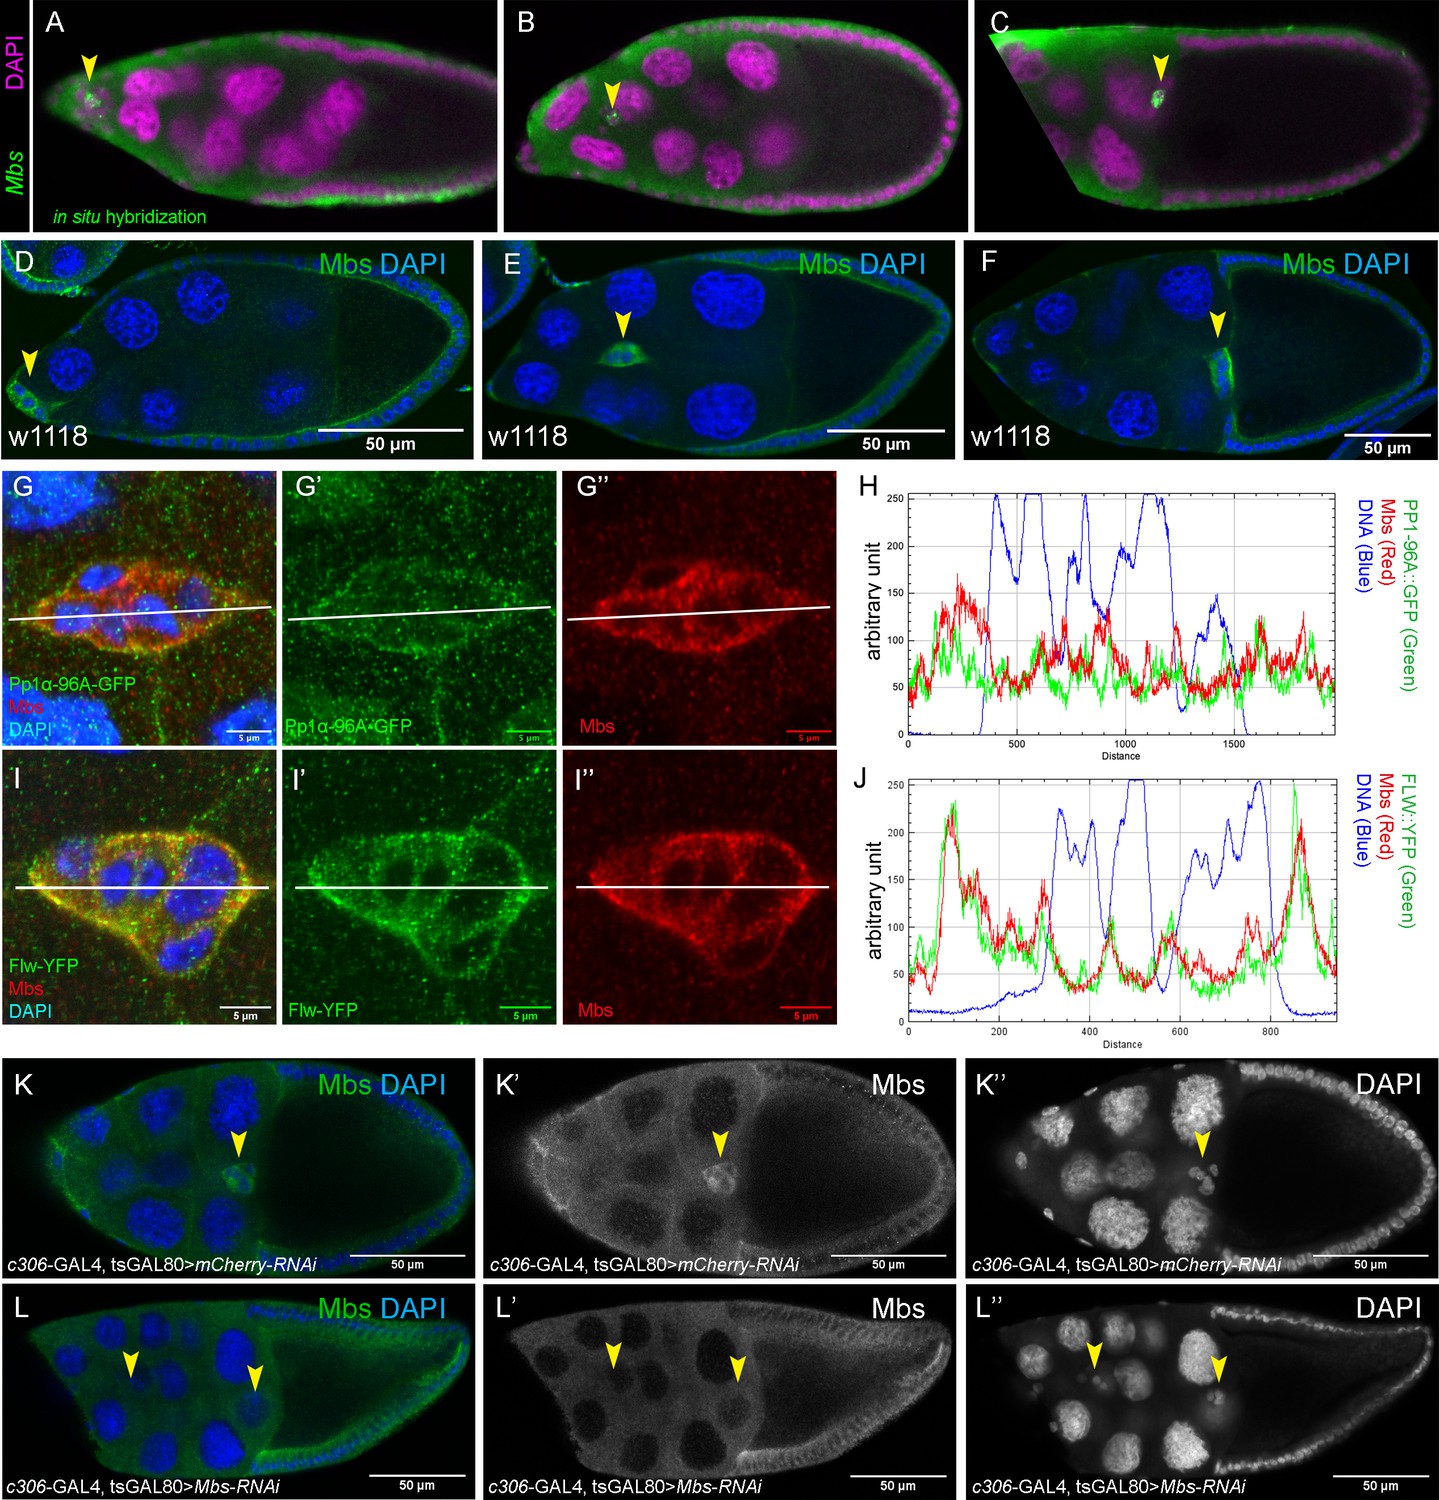
Expression of Mbs during border cell migration and specificity of Mbs-RNAi knockdown.
(A–J) Mbs transcript (A–C) and protein (D–I”) are found in border cells throughout migration (arrowheads, A–F). (A–C) Mbs mRNA pattern as detected by in situ hybridization (green) in stage 9 to 10 egg chambers. Nuclear DNA, stained for DAPI, is shown in magenta. Images are from the Dresden Ovary Table http://tomancak-srv1.mpi-cbg.de/DOT/main (Jambor et al., 2015). (D–F) Wild-type (w1118) egg chambers stained for Mbs protein (green) and DAPI to label nuclei (blue). (G–J) Colocalization of Mbs with Pp1c subunits in border cells. The border cells are co-stained for Mbs (red in G, G”, I, I”) and Pp1α−96A-GFP (green in G, G’) or Flw-YFP (green in I, I’). DAPI labels the nuclei (blue). (H, J) Plot profiles of the fluorescent image intensities of Pp1α−96A-GFP (H), Flw-YFP (J), Mbs, and DAPI across the lines shown (G–G”, I–I”). (K–L’’) Mbs RNAi results in significant reduction of Mbs protein levels in border cells (L–L”) compared to control (K–K”). Stage 10 egg chambers stained for Mbs (green in K, L; white in K’, L’) and DAPI to label nuclei (blue in K, L; white in K’, L”). All genotypes are listed in Table 2.
Figure 7—figure supplement 2

Pp1 promotes moderate levels of RhoA activity in border cells.
(A–B’) Representative processed Rho-FRET images in control (A, A’) and NiPp1 overexpressing (B, B’) border cells. The CFP channel (A, B) is shown. The FRET images (A’, B’) are color-coded as indicated in the heat map. (C) Measurement of the total FRET index in matched control and NiPp1 overexpressing border cells. The total number of border cell clusters assayed is indicated. All genotypes are listed in Table 2.
Figure 8
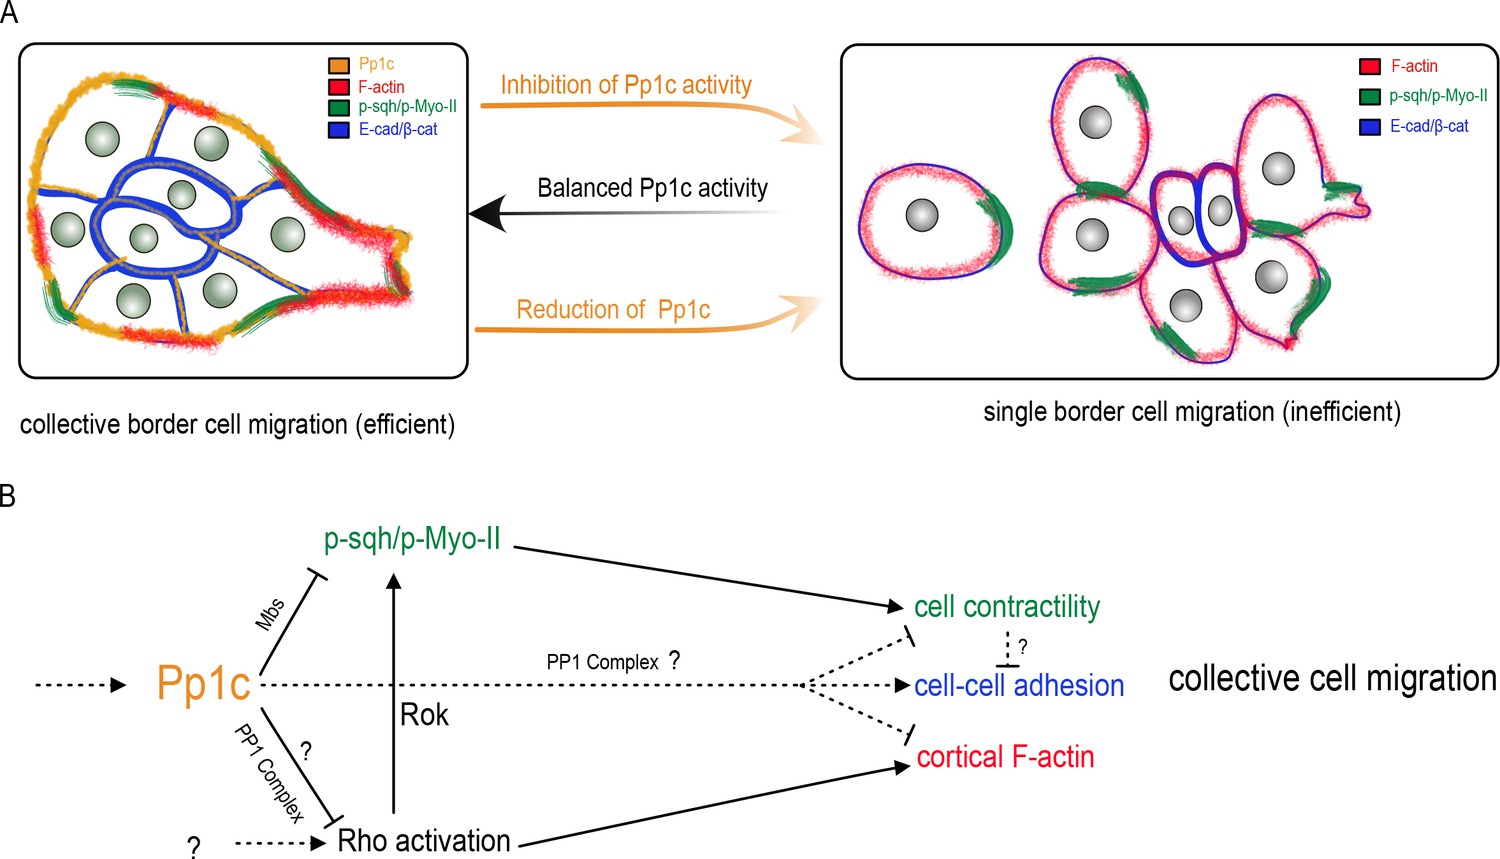
Model for the Pp1 function in border cell migration.
(A) Schematic of the phenotypes and the localizations of Pp1c, F-actin, p-Sqh, and the cadherin-catenin complex during normal and Pp1-inhibited (NiPp1 expression or Pp1c-RNAi) border cell cluster migration. (B) Proposed molecular pathways regulated by Pp1, which together promote cohesive collective border cell migration.
Videos
Video 1
Control (c306-GAL4/+; UAS-mCherry-Jupiter/+) egg chamber showing normal border cell migration.
Frames were acquired every 3 min with a 20x objective. Anterior is to the left.
Video 2
NiPp1 overexpressing (c306-GAL4/+; UAS-mCherry-Jupiter/+; UAS-NiPp1/+) egg chamber showing the migration defect and splitting phenotype.
Frames were acquired every 3 min with a 20x objective. Anterior is to the left.
Video 3
Representative time-lapse video of a stage 9 NiPp1 overexpressing (c306-GAL4,tsGAL80/+; UAS-mCherry-Jupiter/+; UAS-NiPp1/+) egg chamber with DIC channel.
Frames were acquired every 2 min with a 20x objective. Time is in hr:min. Anterior is to the left.
Video 4
Representative time-lapse video of a stage 9 NiPp1 overexpressing (c306-GAL4,tsGAL80/+; UAS- mCherry-Jupiter /+;UAS-NiPp1/+) egg chamber with DIC channel.
Frames were acquired every 2 min with a 20x objective. Time is in hr:min. Anterior is to the left.
Video 5
NiPp1 overexpressing (slbo-GAL4/+; UAS- PLCδ-PH-EGFP/UAS-NiPp1) egg chamber showing the loss of a membrane attachment between one border cell and the rest of the border cell cluster.
Anterior is to the left.
Video 6
Control (c306-GAL4,tsGAL80/+; UAS- PLCδ-PH-EGFP/+) egg chamber showing normal border cell migration.
Frames were acquired every 3 min with a 20x objective. Anterior is to the left.
Video 7
Representative time-lapse video of a stage 9 Pp1α−96A RNAi (c306-GAL4,tsGAL80/+; v27673/+; PLCδ-PH-EGFP /+) egg chamber.
Frames were acquired every 3 min with a 20x objective. Anterior is to the left.
Video 8
Another representative time-lapse video of a stage 9 Pp1α−96A RNAi (c306-GAL4,tsGAL80/+; v27673/+;UAS-PLCδ-PH-EGFP/+) egg chamber.
Frames were acquired every 3 min with a 20x objective. Anterior is to the left.
Video 9
Representative time-lapse video of a stage 9 Pp1-13C RNAi (c306-GAL4,tsGAL80/+;v29058/+;UAS-PLCδ-PH-EGFP/+) egg chamber.
Frames were acquired every 3 min with a 20x objective. Anterior is to the left.
Video 10
Representative time-lapse video of a stage 9 Pp1-87B RNAi (c306-GAL4,tsGAL80/+; v35024/+;UAS-PLCδ-PH-EGFP/+) egg chamber.
Frames were acquired every 3 min with a 20x objective. Anterior is to the left.
Video 11
Representative time-lapse video of a stage 9 α-Cat RNAi (c306-GAL4,tsGAL80/+; v107298/+; UAS-PLCδ-PH-EGFP/+) egg chamber.
Frames were acquired every 3 min with a 20x objective. Anterior is to the left.
Video 12
Control (LifeAct-GFP/+) egg chamber showing the dynamics of F-actin with LifeAct-GFP, Frames were acquired every 2 min with a 40x water immersion objective.
We observed similar dynamics in three videos. Anterior is to the left.
Video 13
NiPp1 overexpressing (slbo-Gal4/+; UAS-NiPp1/LifeAct-GFP) egg chamber showing F-actin dynamics with LifeAct-GFP.
Frames were acquired every 2 min with a 40x water immersion objective. We observed similar dynamics in three videos. Anterior is to the left.
Video 14
Control (c306-GAL4, tsGAL80/+; Sqh-GFP/+) egg chamber showing normal Sqh-GFP dynamics in early migration.
Frames were acquired every 1 min with a 40x water immersion objective, only a single focal plane is shown, with a 3D projection of the entire z-stack at the beginning and the end of the video. Similar patterns were observed in three videos. Anterior is to the left.
Video 15
Representative NiPp1 overexpressing (c306-GAL4, tsGAL80/+; UAS-NiPp1/Sqh-GFP) egg Chamber showing the Sqh-GFP dynamics in early migration.
Frames were acquired every 1 min with a 40x water immersion objective, only a single focal plane is shown, with a 3D projection of the entire z-stack at the beginning and the end of the video. Similar patterns were observed in four videos. Anterior is to the left.
Video 16
Control (Sqh-GFP/+) egg chamber showing normal Sqh-GFP dynamics in mid-migration.
Frames were acquired every 1 min with a 40x water immersion objective, only a single focal plane is shown, with a 3D projection of the entire z-stack at the beginning and the end of the video. Similar patterns were observed in five videos. Anterior is to the left.
Video 17
Representative NiPp1 overexpressing (c306-GAL4, tsGAL80/+; UAS-NiPp1/Sqh-GFP) egg chamber showing the Sqh-GFP dynamics in mid-migration.
Frames were acquired every 1 min with a 40x water immersion objective, only a single focal plane is shown, with a 3D projection of the entire z-stack at the beginning and the end of the video. Similar patterns were observed in six videos. Anterior is to the left.
Tables
Table 1
Summary of the PPP family screen.
Results of the targeted serine-threonine protein phosphatase RNAi screen.
| Gene symbol | Annotation symbol | RNAi line | Migration defect (c306-Gal4) | Expression level in ovary (modENCODE) |
|---|---|---|---|---|
| Pp2B-14D | CG9842 | BDSC:25929 | No | moderate |
| BDSC:40872 | No | |||
| VDRC:46873 | No | |||
| mts | CG7109 | BDSC:27723 | Pupal lethal | moderate |
| BDSC:38337 | No | |||
| BDSC:57034 | No | |||
| BDSC:60342 | No | |||
| Pp4-19C | CG32505 | BDSC:27726 | Pupal lethal | moderate |
| BDSC:38372 | No | |||
| BDSC:57823 | Pupal lethal | |||
| VDRC:25317 | Yes | |||
| CanA-14F | CG9819 | BDSC:38966 | No | moderate |
| PpD3 | CG8402 | BDSC:57307 | No | moderate |
| PpV | CG12217 | BDSC:57765 | No | moderate |
| NiPp1 | CG8980 | BDSC:23711 | Yes | moderate |
| CanA1 | CG1455 | BDSC:25850 | No | low |
| CG11597 | CG11597 | BDSC:57047 | No | very low |
| BDSC:61988 | No | |||
| rgdC | CG44746 | BDSC:60076 | No | very low |
Table 2
Genotypes for figures.
List of genotypes shown in the figures.
| Figure | Panel | Genotype |
|---|---|---|
| Figure 1 | A-F | w1118 |
| G | c306-GAL4,tsGAL80/+ | |
| H | c306-GAL4,tsGAL80/+;UAS-NiPp1/+ | |
| K | c306-GAL4/+; UAS-Cherry:Jupiter / + | |
| L | c306-GAL4/+; UAS-Cherry:Jupiter / +;UAS-NiPp1/+ | |
| Figure 1—figure supplement 1 | A | c306-GAL4,tsGAL80/+;UAS-GFP.nls/+ |
| B | slbo-GAL4/+;UAS-GFP.nls/+ | |
| Figure 1—figure supplement 2 | B | c306-GAL4/+;UAS-PLCdelta-PH-EGFP/+ |
| D-G | slbo-GAL4,UAS-mCD8-GFP/+; | |
| slbo-GAL4,UAS-mCD8-GFP/+;UAS-NiPp1/+ | ||
| H-K | upd-GAL4/+;UAS-mCD8.ChRFP/+ | |
| upd-GAL4/+;UAS-NiPp1/+ | ||
| L-N | c306-GAL4,tsGAL80/+ | |
| c306-GAL4,tsGAL80/+;UAS-NiPp1/+ | ||
| Figure 1—figure supplement 3 | A | c306-GAL4/+ (WT) |
| B | c306-GAL4,tsGAL80/+;UAS-NiPp1/+ | |
| Figure 2 | A-C | FlyFos021765(pRedFlp-Hgr) (Pp1alpha-96A15346::2XTY1-SGFP-V5-preTEV-BLRP-3XFLAG)dFRT |
| D-F | w[1118] PBac{681 .P.FSVS-1}flw[CPTI002264] | |
| G-H | c306-GAL4,tsGAL80/+;UAS-NiPp1/UAS-mCD8.ChRFP | |
| c306-GAL4,tsGAL80/+;UAS-NiPp1/UAS-Pp1α−96A.HA | ||
| c306-GAL4,tsGAL80/+;UAS-NiPp1/UAS-Pp1-87B.HA | ||
| c306-GAL4,tsGAL80/+;UAS-NiPp1/UAS-Pp1-13C.HA | ||
| c306-GAL4,tsGAL80/+;UAS-NiPp1/UAS-Flw.3xHA | ||
| c306-GAL4,tsGAL80/+;UAS-hPPP1CC/+;UAS-NiPp1/ | ||
| Figure 2—figure supplement 1 | A | c306-GAL4/+;UAS-Pp1α−96A.HA/+ |
| B | c306-GAL4/+;UAS-Pp1-87B.HA/+ | |
| C | c306-GAL4/+;UAS-Pp1-13C.HA/+ | |
| D | c306-GAL4/+;UAS-Flw.3xHA/+ | |
| E | c306-GAL4/+;UAS-hPPP1CC/+ | |
| F-K | Same as Figure 2. G-H | |
| Figure 2—figure supplement 2 | A | c306-GAL4,tsGAL80/+;UAS-NiPp1/+ |
| B | slbo-GAL4/+;UAS-NiPp1/Pp1alpha-96A-GFP | |
| C | w1118/Flw-YFP;slbo-GAL4/+;UAS-NiPp1/+ | |
| Figure 3 | A-D | c306-GAL4/+;UAS-mCherry RNAi/+ |
| c306-GAL4/+;UAS-Pp1α−96A RNAi/+ | ||
| c306-GAL4/+;UAS-Pp1-87B RNAi /+ | ||
| c306-GAL4/+;UAS-Pp1-13C RNAi/+ | ||
| G | c306-GAL4,tsGAL80/+;UAS-mCherry RNAi/UAS-PLCdelta-PH-EGFP | |
| c306-GAL4,tsGAL80/+;UAS-Pp1α−96A RNAi/+;UAS-PLCdelta-PH-EGFP/+ | ||
| c306-GAL4,tsGAL80/+;UAS-Pp1-87B RNAi /+;UAS-PLCdelta-PH-EGFP/+ | ||
| c306-GAL4,tsGAL80/+;UAS-Pp1-13C RNAi/+;UAS-PLCdelta-PH-EGFP/+ | ||
| H-H'' | P{w[+mC]=Ubi mRFP.nls}1, w[*], P{ry[+t7.2]=hsFLP}12 P{ry[+t7.2]=neoFRT}19A/flwFP41 FRT 19A | |
| Figure 3—figure supplement 1 | A | Same as Figure 3. G |
| B | P{w[+mC]=Ubi mRFP.nls}1, w[*], P{ry[+t7.2]=hsFLP}12 P{ry[+t7.2]=neoFRT}19A/flwFP41 FRT 19A | |
| Figure 4 | A-J | c306-GAL4,tsGAL80/+;UAS-mCherry RNAi/+ |
| c306-GAL4,tsGAL80/+;UAS-E-cad RNAi (VDRC:103962)/+ | ||
| c306-GAL4,tsGAL80/+;UAS-E-cad RNAi (VDRC:27082)/+ | ||
| c306-GAL4,tsGAL80/+;UAS-β-Cat RNAi (VDRC:107344)/+ | ||
| c306-GAL4,tsGAL80/+;UAS-β-Cat RNAi (VDRC:31305)/+ | ||
| c306-GAL4,tsGAL80/+;UAS-α-Cat RNAi (VDRC:107298)/+ | ||
| c306-GAL4,tsGAL80/+;UAS-α-Cat RNAi (VDRC:20123)/+ | ||
| K-P | w1118(control) | |
| c306-GAL4,tsGAL80/+;UAS-NiPp1/+ | ||
| Figure 4—figure supplement 1 | A,C,E,G | c306-GAL4/+;UAS-mCherry RNAi/+ |
| B | c306-GAL4/+;UAS-E-cad RNAi (VDRC:103962)/+ | |
| D | c306-GAL4/+;UAS-β-Cat RNAi (VDRC:107344)/+ | |
| F | c306-GAL4/+;UAS-α-Cat RNAi (VDRC:107298)/+ | |
| G | c306-GAL4/+;UAS-β-Cat RNAi (BDSC:31305)/+ | |
| I-J | c306-GAL4/+;UAS-mCherry RNAi/+ | |
| upd-GAL4,tsGAL80/+;UAS-α-Cat RNAi (VDRC:107298)/+ | ||
| upd-GAL4/+;UAS-α-Cat RNAi (VDRC:20123)/+ | ||
| Figure 5 | A | c306-GAL4,tsGAL80/+;UAS-mCherry RNAi/UAS-PLCdelta-PH-EGFP |
| B | c306-GAL4,tsGAL80/+;UAS-Pp1α−96A RNAi/+;UAS-PLCdelta-PH-EGFP/+ | |
| C-F | Same as Figure 3. G | |
| Figure 5—figure supplement 1 | B-C | Same as Figure 3. G |
| D-E | yw; slbo-GAL4/UAS-Rac FRET (WT) and slbo-GAL4/UAS-Rac FRET; +/UAS-NiPp1 | |
| F-J | c306-GAL4,tsGAL80/+;UAS-mCherry RNAi/UAS-PLCdelta-PH-EGFP | |
| c306-GAL4,tsGAL80/+;UAS-α-Cat RNAi (VDRC:107298);UAS-PLCdelta-PH-EGFP/+ | ||
| Figure 6 | A | slbo-GAL4/+;UAS-PLCdelta-PH-EGFP/+ |
| B | slbo-GAL4/+;UAS-NiPp1/UAS-PLCdelta-PH-EGFP | |
| D,F | w1118 (control) | |
| E,G | slbo-GAL4/+;UAS-NiPp1/+ | |
| H | c306-GAL4,tsGAL80/+;+/sqh-GFP (VDRC:318484) | |
| I | c306-GAL4,tsGAL80/+;UAS-NiPp1/sqh-GFP (VDRC:318484) | |
| Figure 6—figure supplement 1 | A | Same as Figure 6. H |
| B | Same as Figure 6. I | |
| Figure 6—figure supplement 2 | A,A',E,I | c306-GAL4,tsGAL80/+;UAS-mCherry RNAi/+ |
| B,B',F,J | c306-GAL4,tsGAL80/+;UAS-E-cad RNAi (VDRC:103962)/+ | |
| C,C',G,K | c306-GAL4/+;UAS-β-Cat RNAi (BDSC:31305)/+ | |
| D,D',H | c306-GAL4,tsGAL80/+;UAS-sqh RNAi (VDRC:7916)/+ | |
| Figure 6—figure supplement 3 | A,C | c306-GAL4,tsGAL80/+;UAS-mCherry RNAi/+ |
| B,D | c306-GAL4,tsGAL80/+;UAS-sqh RNAi (VDRC:7916)/+ | |
| Figure 7 | A-A' | c306-GAL4,tsGAL80/+;UAS-PLCdelta-PH-EGFP/+ |
| B-B' | c306-GAL4,tsGAL80/+;UAS-PLCdelta-PH-EGFP/UAS-NiPp1 | |
| D-H | c306-GAL4,tsGAL80/+;UAS-mCherry RNAi/+ | |
| c306-GAL4,tsGAL80/+;UAS-Mbs RNAi/+ | ||
| Figure 7—figure supplement 1 | D-F | w1118 |
| G-G'' | FlyFos021765(pRedFlp-Hgr) (Pp1alpha-96A15346::2XTY1-SGFP-V5-preTEV-BLRP-3XFLAG)dFRT | |
| I-I'' | w[1118] PBac{681 .P.FSVS-1}flw[CPTI002264] | |
| K | c306-GAL4,tsGAL80/+;UAS-mCherry RNAi/+ | |
| L | c306-GAL4,tsGAL80/+;UAS-Mbs RNAi/+ | |
| Figure 7—figure supplement 2 | A-A' | slbo-GAL4/UAS-Rho FRET; +/UAS-Rho FRET |
| B-B' | slbo-GAL4/UAS-Rho FRET;UAS-NiPp1/UAS-Rho FRET |
Key resources table
| Reagent type (species) or resource | Designation | Source or reference | Identifiers | Additional information |
|---|---|---|---|---|
| Genetic reagent (Drosophila melanogaster) | c306-GAL4 tsGAL80 | Aranjuez et al., 2016 | Laboratory of Jocelyn McDonald | |
| Genetic reagent (D. melanogaster) | slbo-GAL4 | other | FBal0089668 | from D. Montell |
| Genetic reagent (D. melanogaster) | upd-GAL4 | other | FBal0047063 | from D. Montell |
| Genetic reagent (D. melanogaster) | c306-GAL4 | Bloomington Drosophila Stock Center | BDSC Cat# 3743; RRID:BDSC_3743 | |
| Genetic reagent (D. melanogaster) | UAS-NiPp1.HA | Bloomington Drosophila Stock Center | BDSC Cat# 23711; RRID:BDSC_23711 | |
| Genetic reagent (D. melanogaster) | UAS-Pp1-87B.HA | Bloomington Drosophila Stock Center | BDSC Cat# 24098; RRID:BDSC_24098 | |
| Genetic reagent (D. melanogaster) | UAS-Pp1-13C.HA | Bloomington Drosophila Stock Center | BDSC Cat# 23701; RRID:BDSC_23701 | |
| Genetic reagent (D. melanogaster) | UAS-Pp1alpha-96A.HA | Bloomington Drosophila Stock Center | BDSC Cat# 23700; RRID:BDSC_23700 | |
| Genetic reagent (D. melanogaster) | UAS-hPPP1CC | Bloomington Drosophila Stock Center | BDSC Cat# 64394; RRID:BDSC_64394 | |
| Genetic reagent (D. melanogaster) | UAS-mCherry RNAi | Bloomington Drosophila Stock Center | BDSC Cat# 35785; RRID:BDSC_35785 | VALIUM20-mCherry |
| Genetic reagent (D. melanogaster) | UAS-mCD8.ChRFP | Bloomington Drosophila Stock Center | BDSC Cat# 27392; RRID:BDSC_27392 | |
| Genetic reagent (D. melanogaster) | flwFP41 FRT 19A | Bloomington Drosophila Stock Center | BDSC Cat# 51338; RRID:BDSC_51338 | |
| Genetic reagent (D. melanogaster) | Ubi-mRFP.nls, hsFLP, FRT19A | Bloomington Drosophila Stock Center | BDSC Cat# 31418; RRID:BDSC_31418 | |
| Genetic reagent (D. melanogaster) | UAS-PLCδ-PH-GFP | Bloomington Drosophila Stock Center | BDSC Cat# 39693; RRID:BDSC_39693 | |
| Genetic reagent (D. melanogaster) | UAS-Pp1α−96A RNAi | Vienna Drosophila Resource Center | VDRC:27673 | GD-11970 |
| Genetic reagent (D. melanogaster) | UAS-Pp1-87B RNAi | Vienna Drosophila Resource Center | VDRC:35024 | GD-11720 |
| Genetic reagent (D. melanogaster) | UAS-Pp1-13C RNAi | Vienna Drosophila Resource Center | VDRC:29057 | GD-14139 |
| Genetic reagent (D. melanogaster) | UAS-Mbs RNAi | Vienna Drosophila Resource Center | VDRC:105762 | KK-109231 |
| Genetic reagent (D. melanogaster) | UAS-E-cad RNAi | Vienna Drosophila Resource Center | VDRC:103962 | KK-103334 |
| Genetic reagent (D. melanogaster) | UAS-E-cad RNAi | Vienna Drosophila Resource Center | VDRC:27082 | GD-14421 |
| Genetic reagent (D. melanogaster) | UAS-β-cat RNAi | Vienna Drosophila Resource Center | VDRC:107344 | KK-102545 |
| Genetic reagent (D. melanogaster) | UAS-β-cat RNAi | Vienna Drosophila Resource Center | BDSC:31305 | TRiP.JF01252 |
| Genetic reagent (D. melanogaster) | UAS-α-cat RNAi | Vienna Drosophila Resource Center | VDRC:107298 | KK-107916 |
| Genetic reagent (D. melanogaster) | UAS-α-cat RNAi | Vienna Drosophila Resource Center | VDRC:20123 | GD-8808 |
| Genetic reagent (D. melanogaster) | fTRG sqh | Vienna Drosophila Resource Center | VDRC:318484 | fTRG 10075 |
| Genetic reagent (D. melanogaster) | fTRG Pp1α −96A | Vienna Drosophila Resource Center | VDRC:318084 | fTRG 290 |
| Genetic reagent (D. melanogaster) | flwCPTI002264 | Kyoto Drosophila Genomics and Genetic Resources | line 115284 | FBti0143758 |
| Genetic reagent (D. melanogaster) | UAS-Flw.HA | The Zurich ORFeome Project,FlyORF | line F001200 | |
| Antibody | rat monoclonal anti-E-cadherin | Developmental Studies Hybridoma Bank | DCAD2; RRID:AB_528120 | 1:10 |
| Antibody | mouse monoclonal anti-Fasciclin III | Developmental Studies Hybridoma Bank | 7G10; RRID:AB_528238 | 1:10 |
| Antibody | mouse monoclonal anti-Arm | Developmental Studies Hybridoma Bank | N2-7A1; RRID:AB_528089 | 1:75 |
| Antibody | mouse monoclonal anti-Fascin (Singed) | Developmental Studies Hybridoma Bank | sn 7C; RRID:AB_528239 | 1:25 |
| Antibody | rabbit polyclonal anti- Phospho-Myosin Light Chain 2 (Ser19) | Cell Signaling Technology, Inc | #3671; RRID:AB_330248 | 1:10 |
| Antibody | rat monoclonal anti-HA (3F10) | Millipore Sigma | 11867423001; RRID:AB_2314622 | 1:1000 |
| Antibody | rabbit polyclonal anti-Mbs | Ong et al., 2010 | 1:200 from Change Tan | |
| Antibody | rabbit polyclonal anti-GFP | Thermo Fisher Scientific | A11122; RRID:AB_221569 | 1:1000–1:2000 |
| Antibody | chicken polyclonal anti-GFP | Abcam | ab13970; RRID:AB_300798 | 1:1000 |
| Antibody | rabbit polyclonal anti-PPP1R8 (NiPP1) | Millipore Sigma | HPA027452; RRID:AB_1854490 | 1:100 |
| Antibody | Alexa Fluor 488, 568, or 647 | Thermo Fisher Scientific | 1:400 | |
| Chemical compound, drug | Alexa Fluor 488 or 568 Phalloidin | Thermo Fisher Scientific | A12379 or A12380 | 1:400 |
| Chemical compound, drug | Phalloidin-Atto 647N | Millipore Sigma | 65906 | 1:400 |
| Chemical compound, drug | 4’,6-Diamidino-2-phenylindole (DAPI) | Millipore Sigma | D9542 | 0.05 µg/ml |
| Software, algorithm | FIJI | PMID:22743772 | ||
| Software, algorithm | Graphpad Prism 7, Prism 8 | https://www.graphpad.com/ | ||
| Software, algorithm | Adobe Photoshop CC | https://www.adobe.com/ | ||
| Software, algorithm | Adobe Illustrator CC 2018 | https://www.adobe.com/ | ||
| Software, algorithm | Affinity Designer 1.7.1 | https://affinity.serif.com/ | ||
| Software, algorithm | Zeiss AxioVision 4.8 | Zeiss | ||
| Software, algorithm | Zeiss ZEN 3.0 | Zeiss | ||
| Software, algorithm | Final Cut Pro X 10.4.8 | Apple |
Additional files
Download links
A two-part list of links to download the article, or parts of the article, in various formats.
Downloads (link to download the article as PDF)
Open citations (links to open the citations from this article in various online reference manager services)
Cite this article (links to download the citations from this article in formats compatible with various reference manager tools)
Protein phosphatase 1 activity controls a balance between collective and single cell modes of migration
eLife 9:e52979.
https://doi.org/10.7554/eLife.52979


