Chloride channels regulate differentiation and barrier functions of the mammalian airway
- Department of Physiology, University of California, San Francisco, United States
- Chan Zuckerberg Biohub, United States
- Department of Urology, University of California, San Francisco, United States
- Division of Pediatric Urology, University of California, San Francisco, Benioff Children's Hospital, United States
- Department of Cellular and Molecular Physiology, Yale University School of Medicine, United States
- Department of Anesthesia and Perioperative Care, University of California, San Francisco, United States
- Department of Biochemistry and Biophysics, University of California, San Francisco, United States
- Howard Hughes Medical Institute, University of California, San Francisco, United States
Figures
Figure 1 with 3 supplements
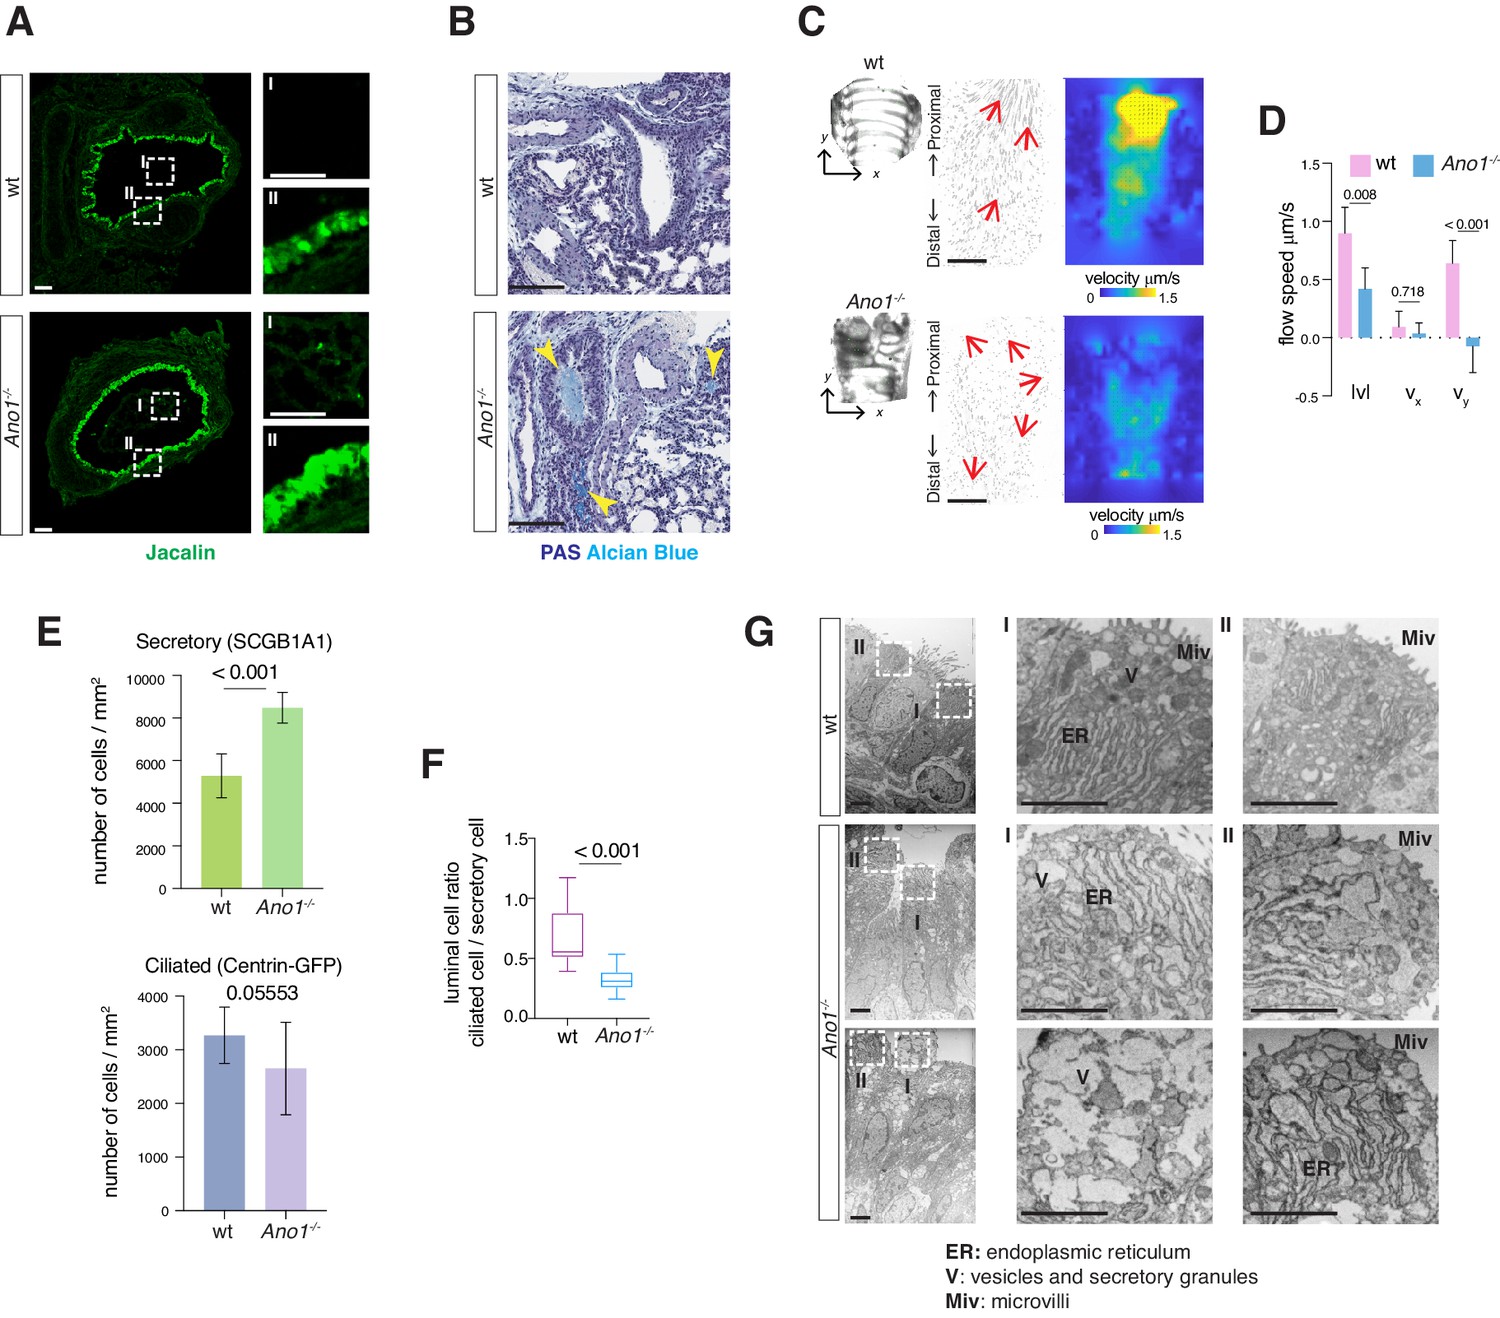
Mucus cell hyperplasia in Ano1 null mutants.
(A) Jacalin-Alexa488 (green) labeling of glycoprotein-producing cells and mucin components in wild-type and Ano1-/- mutant trachea at P0. Inset I shows the tracheal lumen; mucosubstances were apparent in the mutant trachea lumen. Inset II shows glycoprotein-producing cells. Scale bar corresponds to 50 μm. n = 4 for each genotype examined. (B) PAS and Alcian blue staining of airway and mucus in wild-type and Ano1-/- mutant trachea at P3. Yellow arrowheads indicate mucus accumulation in the mutants. Scale bar corresponds to 100 μm. n = 4 for each genotype examined. See Figure 1—figure supplement 1 for additional analysis for pulmonary defects associated with Ano1-/- mutants. (C) Differential interference contrast (DIC) images of flat-mounted trachea, flow path lines, and velocity magnitude of ciliary flow generated by wild-type and Ano1-/- mutant trachea samples at P2. Flow directions are indicated by arrows in red. X represents the medial-lateral axis, while Y represents the anterior-posterior axis. (D) Velocities of ciliary flow at P2. Wild-type trachea showed directional flow at 0.90 ± 0.22 μm/s from the distal to the proximal trachea (Figure 1—video 1). Mutants showed minimal and sometimes reversed flow at a lower speed of 0.42 ± 0.18 μm/s (Figure 1—video 2). n = 3 for each genotype. p values are indicated (multiple t-test). Error bars represent standard deviation (S.D). (E) Quantification of SCGB1A1+ secretory cells and Centrin-GFP+ ciliated cells of wild-type and Ano1-/- mutant trachea samples at P3. n = 5 for each genotype. p-value (unpaired t-test) are indicated. Error bars represent S.D. (F) Ratio of ciliated cells over secretory cells at P3. n = 5 for each genotype. p value is indicated (unpaired two-tailed t-test). Box and whisker plot shows 10–90 percentile. (G) TEM images of wild-type and Ano1-/- mutant tracheal epithelial cells. Mutant secretory cells show reduced microvilli (Miv) and abnormal intracellular organizations, including dilated ER lumen (ER) and accumulation of vesicles (V). Scale bars indicate 2.5 μm. n = 3 for each genotype.
Figure 1—figure supplement 1
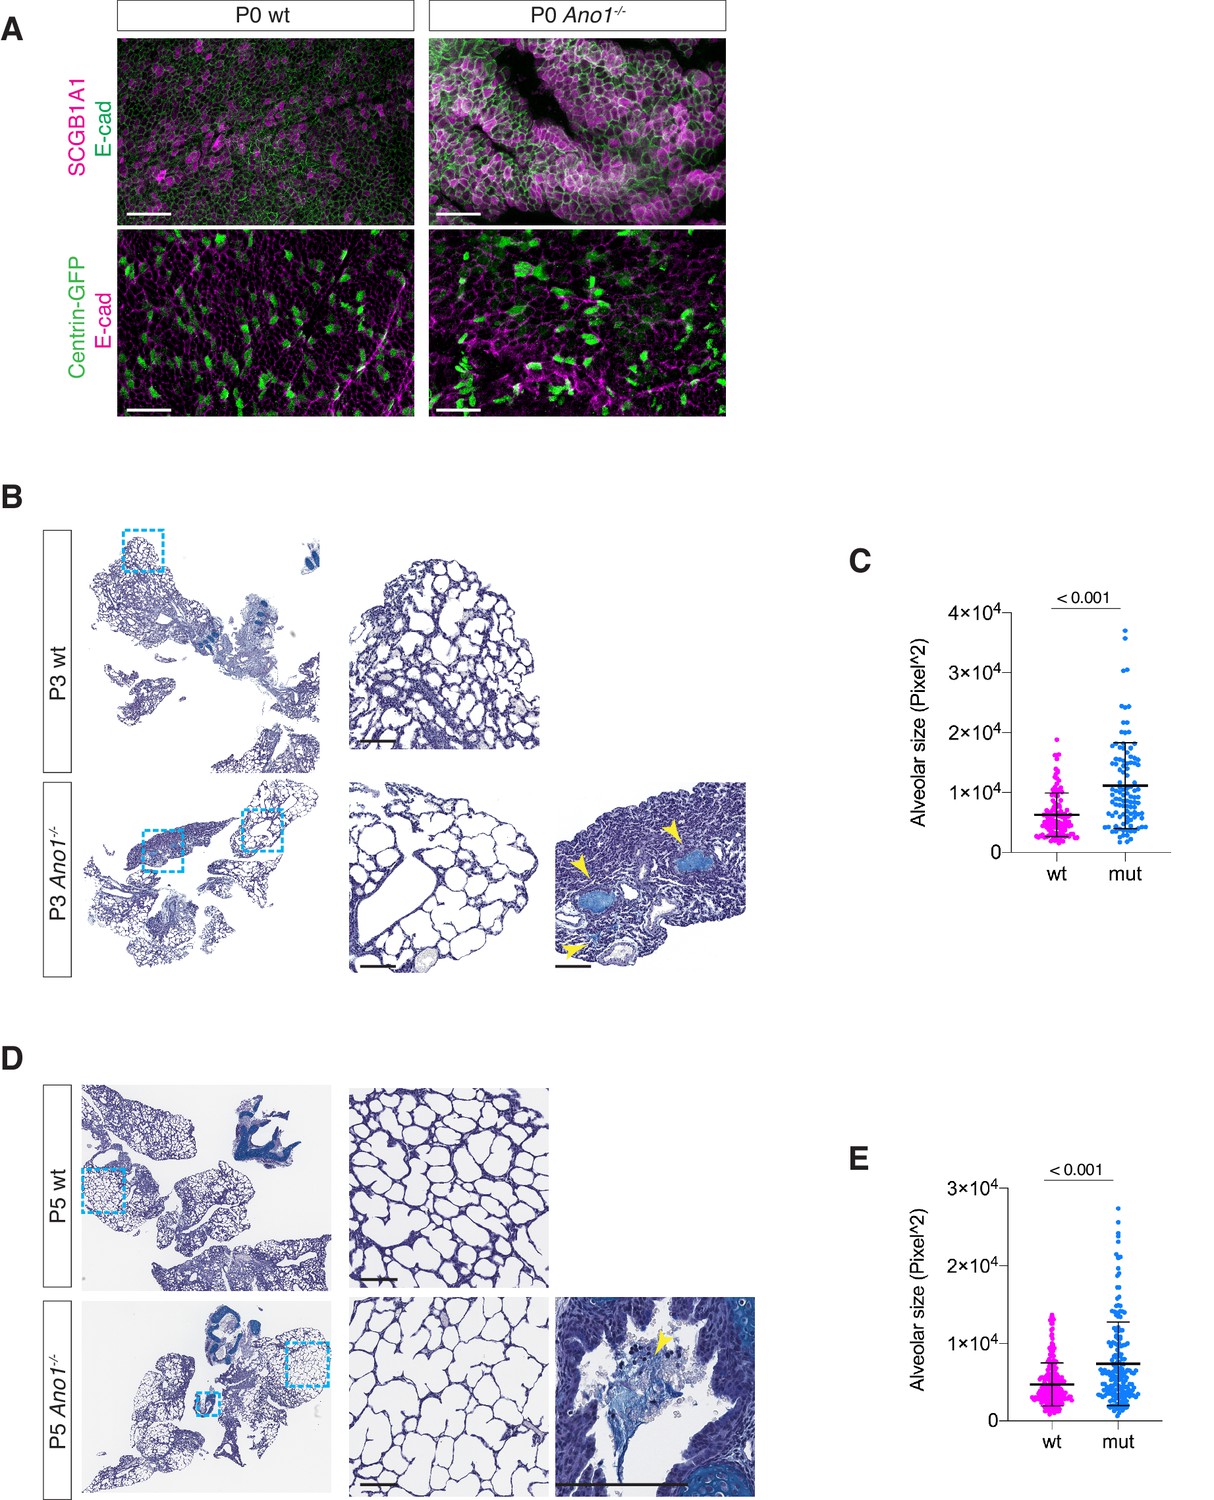
Additional mucus and alveolar defects associated with Ano1 knock-outs.
(A) Upper panel: SCGB1A1 (magenta) labeling of secretory cells in wild-type and Ano1-/- mutant trachea at P0. Cell membrane was marked by E-cad (green). Lower panel: Centrin-GFP labeling of ciliated cells in wild-type and Ano1-/- mutant trachea at P0. Cell membrane was marked by E-cad (magenta). Scale bar corresponds to 40 μm. n = 3 for each genotype examined. (B) Histology sections of wild-type and Ano1-/- mutant lung tissues at postnatal day 3. Samples were stained with Periodic acid–Schiff stain and Alcian blue. Insets highlight alveolar compartments. Mutants exhibit simplified airway and mucus obstruction in distal airways (yellow arrowheads). Scale bar corresponds to 100 μm. n = 4 for each genotype examined. (C) Quantification of alveolar space of P3 wild-type and Ano1-/- mutant lung tissues. n = 4 for each genotype examined and three to four lung lobes from each sample was analyzed. p-value (unpaired t-test) are indicated. Error bars represent S.D. (D) Histology sections of wild-type and Ano1-/- mutant lung tissues at postnatal day 5. Samples were stained with Periodic acid–Schiff stain and Alcian blue. Insets highlight alveolar compartments. Mutants exhibit simplified airway and mucus obstruction in proximal cartilaginous airway (yellow arrowhead). Scale bar corresponds to 100 μm. n = 2 for each genotype examined. (E) Quantification of alveolar space of P5 wild-type and Ano1-/- mutant lung tissues. n = 2 for each genotype examined and three to four lung lobes from each sample was analyzed. p-value (unpaired t-test) are indicated. Error bars represent S.D.
Figure 1—video 1
Flow Movie made from wild-type trachea.
Ciliary flow generated by luminal ciliated cells across the entire trachea. Flow was imaged by Leica SP8 confocal microscopy at 1frame/s for 300 s. Movie is shown at 30 f/s. Fluorescent beads serve as tracer particles. Related to Figure 1C.
Figure 1—video 2
Flow Movie made from Ano1-/- mutant trachea.
Ciliary flow generated by luminal ciliated cells across the entire trachea. Flow was imaged by Leica SP8 confocal microscopy at 1frame/s for 300 s. Movie is shown at 30 f/s. Fluorescent beads serve as tracer particles. Related to Figure 1C.
Figure 2 with 1 supplement
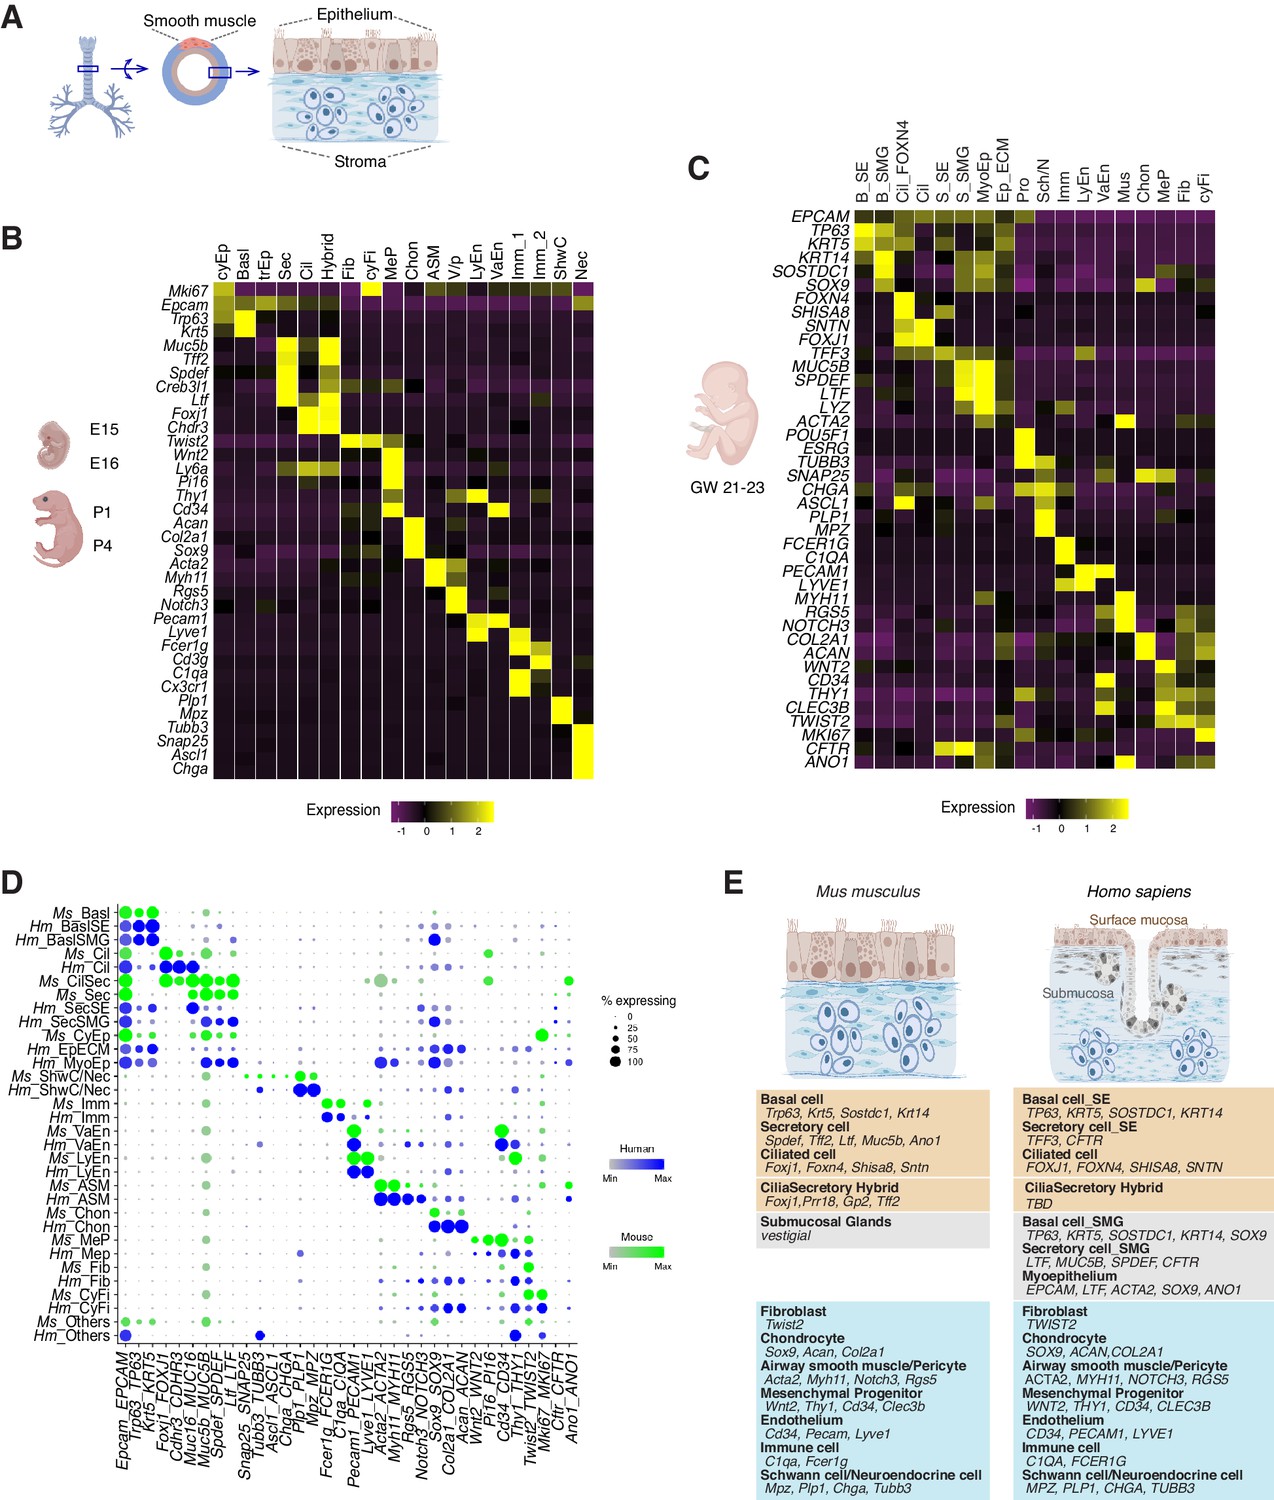
Transcriptomes of the developing mouse and human trachea.
(A) Cartoons of the mammalian trachea anatomy. (B) Four developmental stages are included in this study: embryonic day 15 (E15), E16, postnatal day 1 (P1), and P4. Heat map illustrating the average expression levels of marker genes for each cell cluster identified at E15, E16, P1 and P4. Gene expression has been normalized, log-transformed, and z-score transformed. The proportion of cell types and cell states at different developmental stages are shown in Figure 2—figure supplement 1. A list for differentially expressed genes for all cell types is included in Figure 2—source data 1. (C) Heat map showing the average expression levels of cell identity marker genes for all cell types identified in human fetal trachea of gestation week (GW) 21–23. Gene expression has been normalized, log-transformed, and z-score transformed. (D) Dot plot depicting expression patterns of mouse and human orthologous cell types and states identified from this study. The size of the dot encodes the percentage of cells expressing the gene, while the color encodes the mean of expression level which has been normalized, log-transformed, and z-score transformed. Cell type legends for (B–D) Basl: basal cells; BaslSE: basal_surface epithelium; BaslSMG: basal_submucosal glands; Cil: ciliated cells; CilSec: cilia-secretory hybrid cells; Sec: secretory cells; SecSMG: secretory cells_submucosal gland; Hybrid: cilia-scretory hybrid cells; CyEp: cycling epithelium; EpECM: epithelium_ECM+ ; MyoEp: myoepithelium; Schw: Schwann cell precursors; Nec: neuronal cells; Imm: immune cells; VaEn: vascular endothelium; LyEn: lymphatic endothelium; ASM: airway smooth muscles: Chon: chondrocytes; MeP: mesenchymal progenitors; Fib: fibroblasts; CyFi: cycling fibroblasts; Pro: progenitor (human). (E) Summary of cell types and marker genes reflecting similarity and distinction between mouse embryonic and neonatal trachea and human fetal trachea.
-
Figure 2—source data 1
Gene lists for all cell types identified from the developing mouse airway.
- https://cdn.elifesciences.org/articles/53085/elife-53085-fig2-data1-v2.txt
Figure 2—figure supplement 1
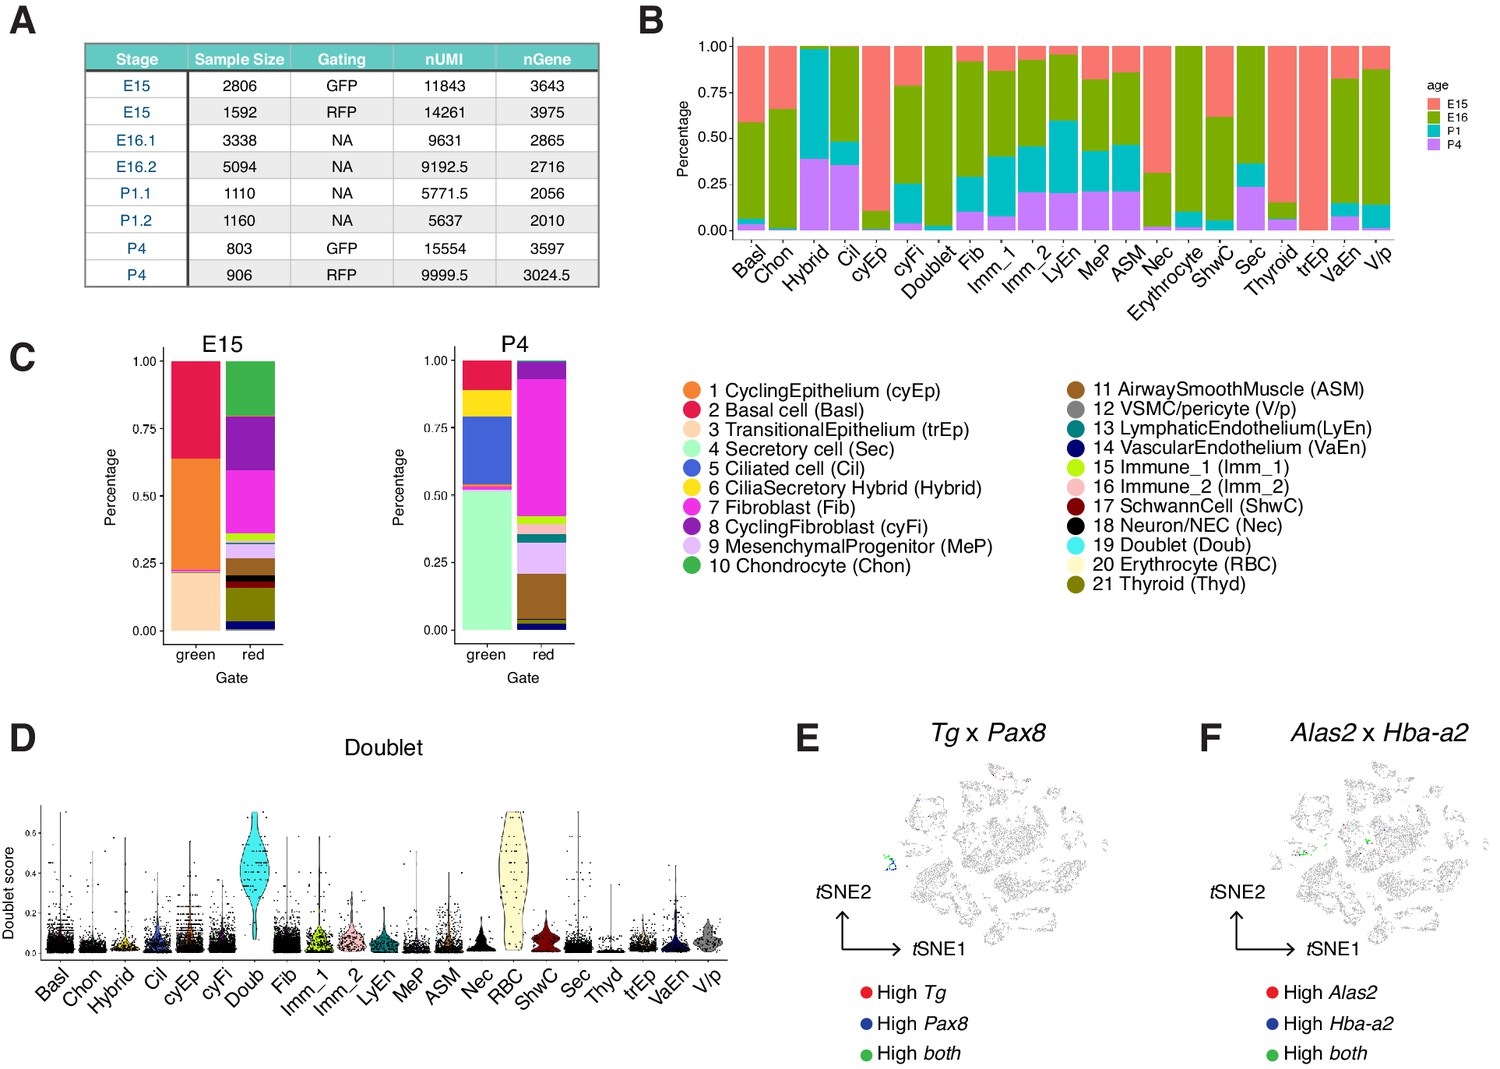
Construction of the developing mouse trachea atlas.
(A) A summary of cell numbers, gating of fluorescence-activated cell sorting (FACS, performed for E15 and P4 samples), median number of unique molecular identifiers (nUMI), and median number of genes (nGene) for each sample in the wild-type mouse trachea atlas presented in Figure 2. (B) Vertical bar graphs showing the proportion of cell types and states from each time point for each tracheal cell type and states colored by developmental stages. The overall representation of stromal cells from our atlas is consistent with those previously published lung atlas (Xie et al., 2018; Guo et al., 2019; Zepp et al., 2017) and reflects the diversity of cell types and states present in the developing airway. (C) The cellular composition of all cell types identified at E15 and P4. FACS was performed for cells from ShhCre/R26mTmG mice before RNA-sequencing to distinguish cells of the Shh-expressing lung endoderm lineage (green) from the rest non-endoderm lineages (red). In agreement with the established lineage relationships of the airway endoderm, GFP+ cells derived from Shh+ endoderm consistently expressed the epithelial marker Epcam. These Epcam+ cells were annotated as 1) basal cells, 2) ciliated cells, 3) secretory cells, and 4) cilia-secretory hybrid cells. RFP+ cells derived from non-Shh expressing lineages consisted of a large collection of mesenchymal cells, muscle cells, endothelial cells, immune cells, Schwann cells, and neuronal cells. Legends for cell types and cell states are shared in B and C D Doublet scores for all cells. Each dot represents a cell. Colors indicate cell clusters. (E) Expressions of thyroid markers Tg and Pax8 projected onto tSNE shown in Figure 2B. (F) Expressions of erythrocyte markers Alas2 and Hba-a2 projected onto tSNE shown in Figure 2B. Our dataset comprises a collection of diverse mesenchymal cell types, many of which have not been characterized at single-cell resolution. Vascular smooth muscle cells and pericytes are identified based on the expression of Notch3 and Rgs5, whereas airway smooth muscle cells express higher levels of Myh11 and Acta2. Endothelial cells express Pecam1 and can be further grouped into lymphatic endothelial cells based on the expression of Lyve1 and Thy1, and vascular endothelial cells based on the expression of Cd34. We identified two immune cell clusters, including a population of Fcerig+/Cd3g+ T cells and a population of Cx3cr1+/C1qa+ monocytes. Our dataset includes a cluster of Wnt2+ mesenchymal cells which persist across all time points included in this study. These cells are marked by Pi16, Cd34, and Ly6a (Sca-1), similar to the molecular signatures of adipose progenitor-like cells. Because Wnt2+ lineages can serve as cardiopulmonary progenitors and define a mesenchymal alveolar niche important for self-renew and repair in the lung, we annotated this Wnt2+/Cd34+/ Ly6a+ cluster as mesenchymal progenitors, which may generate the reservoirs of mesenchymal cell types during development and tissue repair.
Figure 3 with 1 supplement
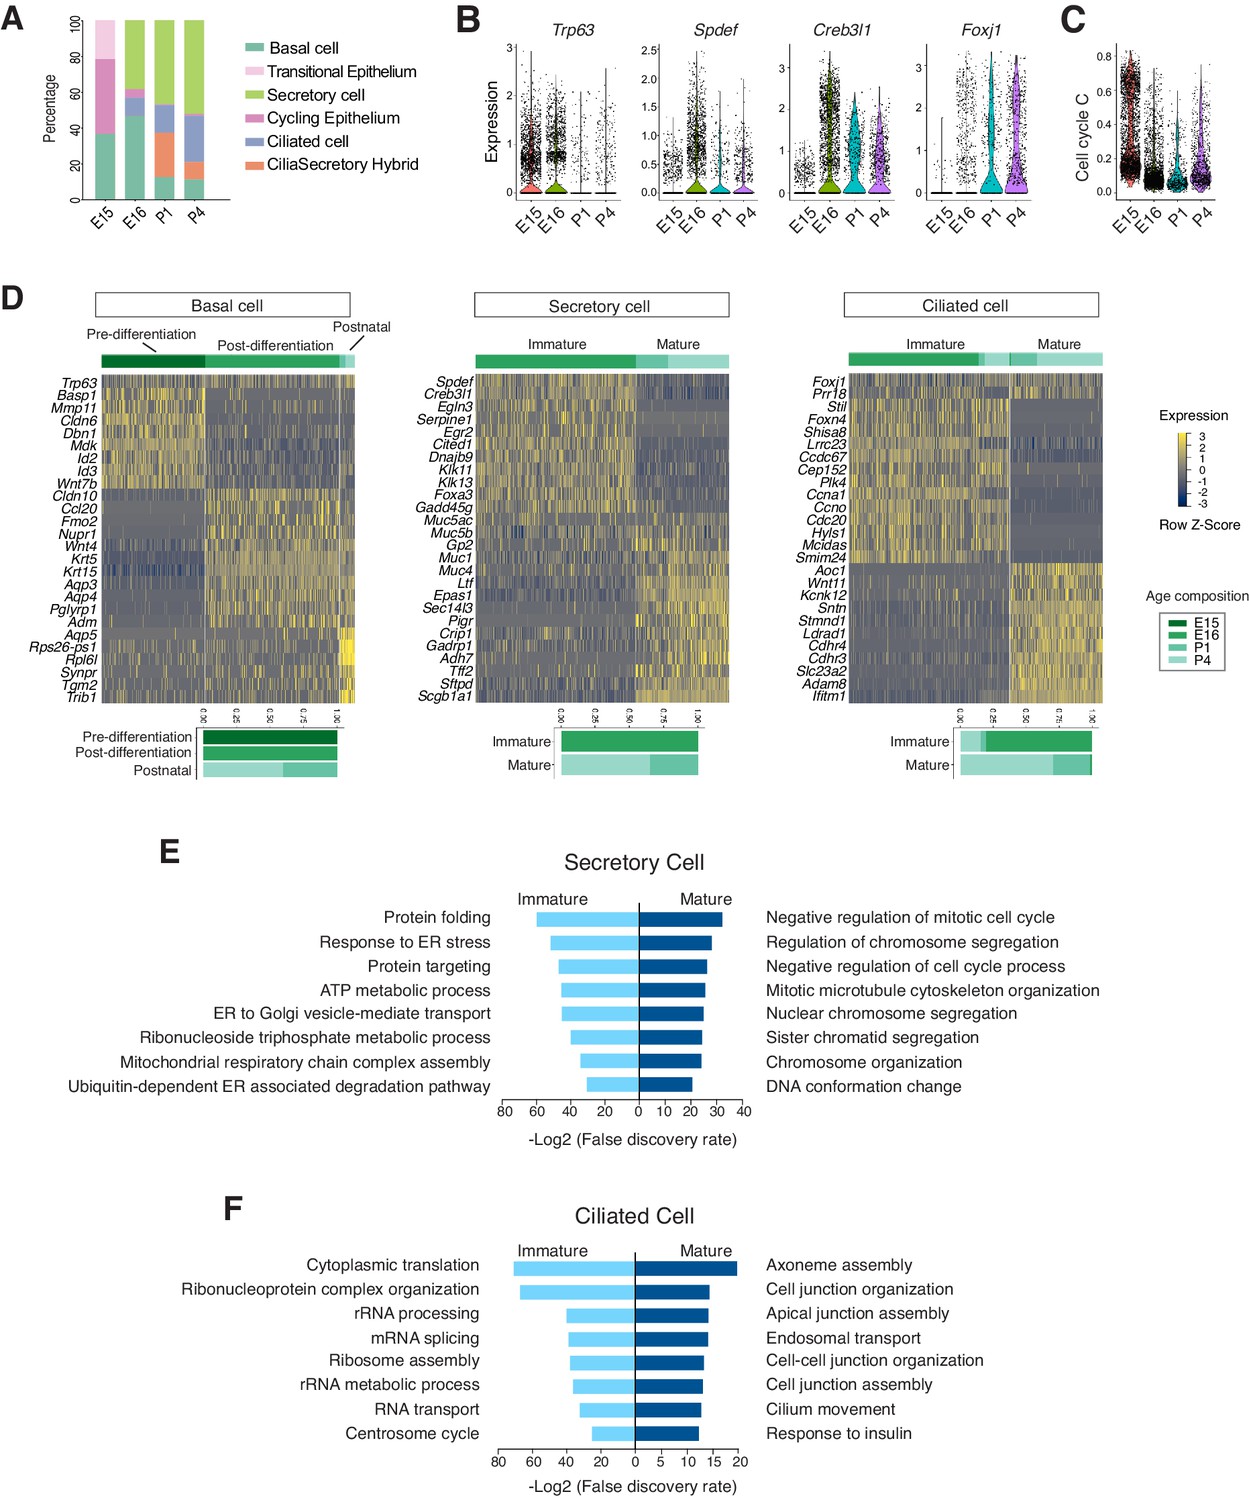
Developmental landscape of tracheal epithelial cells.
(A) Horizontal bar graphs showing the cellular composition of mouse tracheal epithelial cells from different developmental and neonatal time points. (B) Violin plots showing the expression of Trp63, Spdef, Creb3l1, and Foxj1 in epithelial cells at different developmental time points. Gene expression has been normalized and log-transformed. (C) scGPS showing cell-cycle gene expression in epithelial cells at different time points. scGPS (single-cell Geneset Percentile Score) is an expression enrichment analysis that utilizes sets of genes underlying certain biological and pathological processes to infer functional profiles for each cell. The cell cycle gene list can be found in Figure 3—source data 1. (D) Heat maps showing transcriptional profiles of tracheal basal, ciliated, and secretory cells across different developmental time points, with age compositions of corresponding cell states showed in horizontal bar plots. Gene expression has been normalized, log-transformed, and z-score transformed. Cell clusters are not predefined by developmental time-points. (E) Pathways enriched in immature and mature secretory cells revealed by gene ontology analysis. Selected top terms for biological process are shown. (F) Pathways enriched in immature and mature ciliated cells revealed by gene ontology analysis. Selected top terms for biological process are shown.
-
Figure 3—source data 1
Gene Lists for scGPS analysis for cell cycle scoring.
- https://cdn.elifesciences.org/articles/53085/elife-53085-fig3-data1-v2.xlsx
Figure 3—figure supplement 1
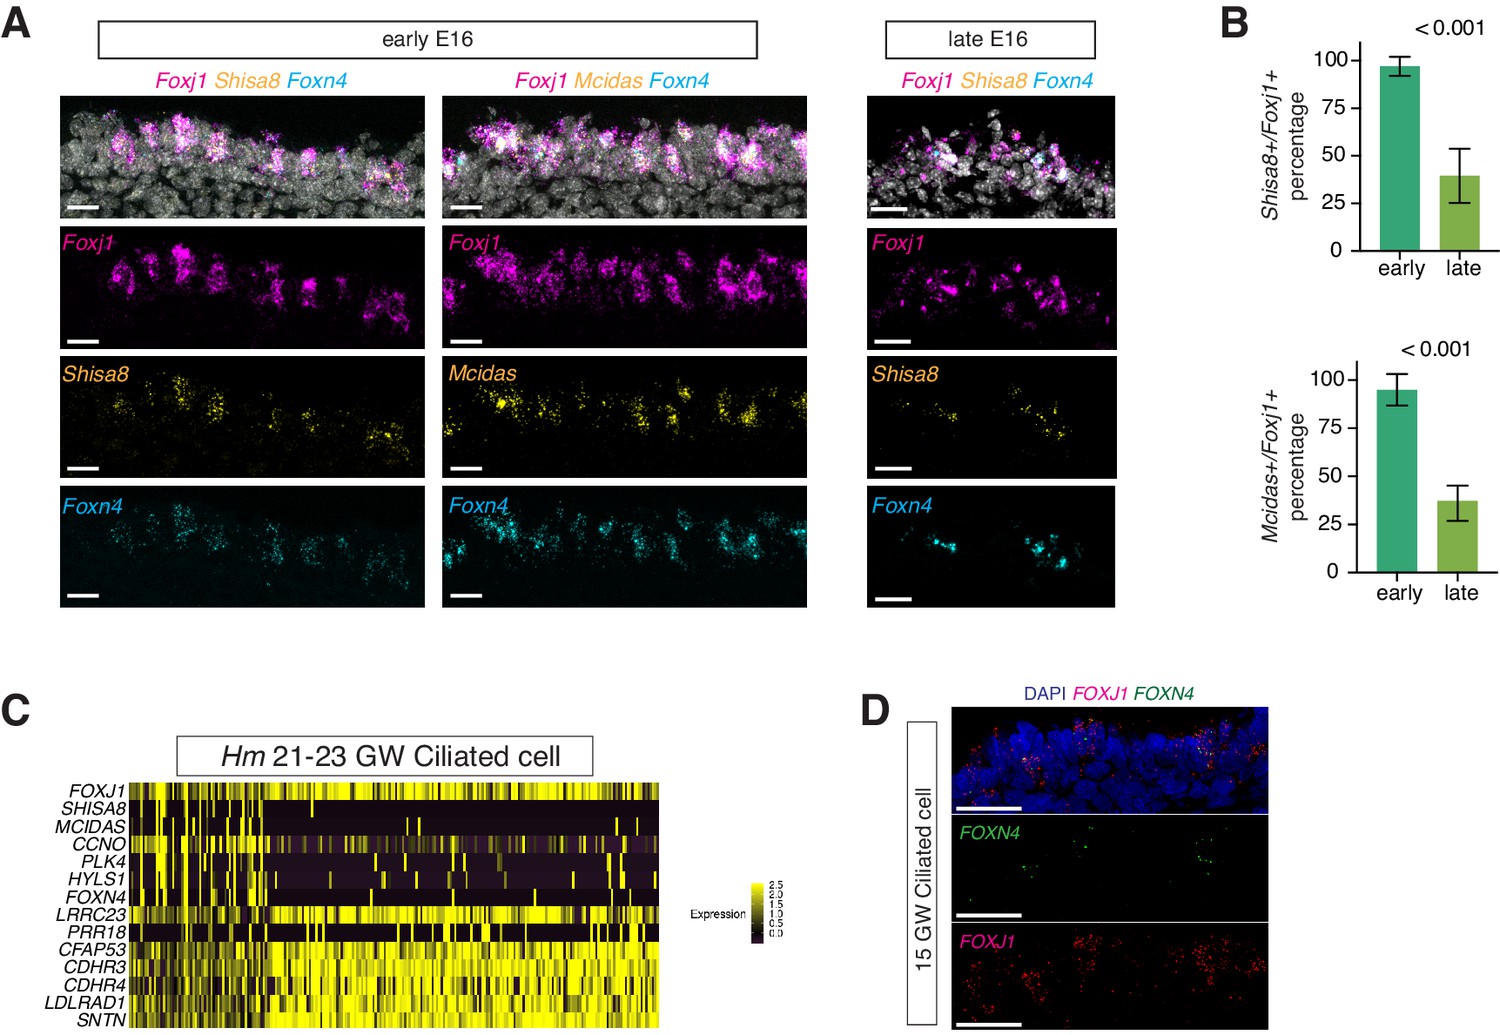
Conserved precursor states of ciliated cells.
(A) Expression of Foxn4, Shisa8, Mcidas, and Foxj1 in early E16 and late E16 tracheal cells detected by RNA FISH. Nuclei are stained by DAPI (white). Scale bar indicates 20 μm. (B) Quantification of Shisa8+ /Foxj1+ cells and Mcidas+/Foxj1+ cells in early (8am dissection) and late (10pm dissection) E16 trachea in the wild-type. Three littermates for each stage were included in analysis. P-value (unpaired t-test) are indicated. Error bars represent S.D. n = 3 for each genotype. (C) A heat map showing state-specific marker genes of ciliated cells at human fetal stage 21–23 GW. Gene expression has been normalized, log-transformed, and z-score transformed. (D) RNA FISH validation of FOXN4 expression, co-localized with a subset of FOXJ1+ cells, in human fetal trachea at 15 GW. Scale bars indicate 20 μm.
Figure 4 with 1 supplement
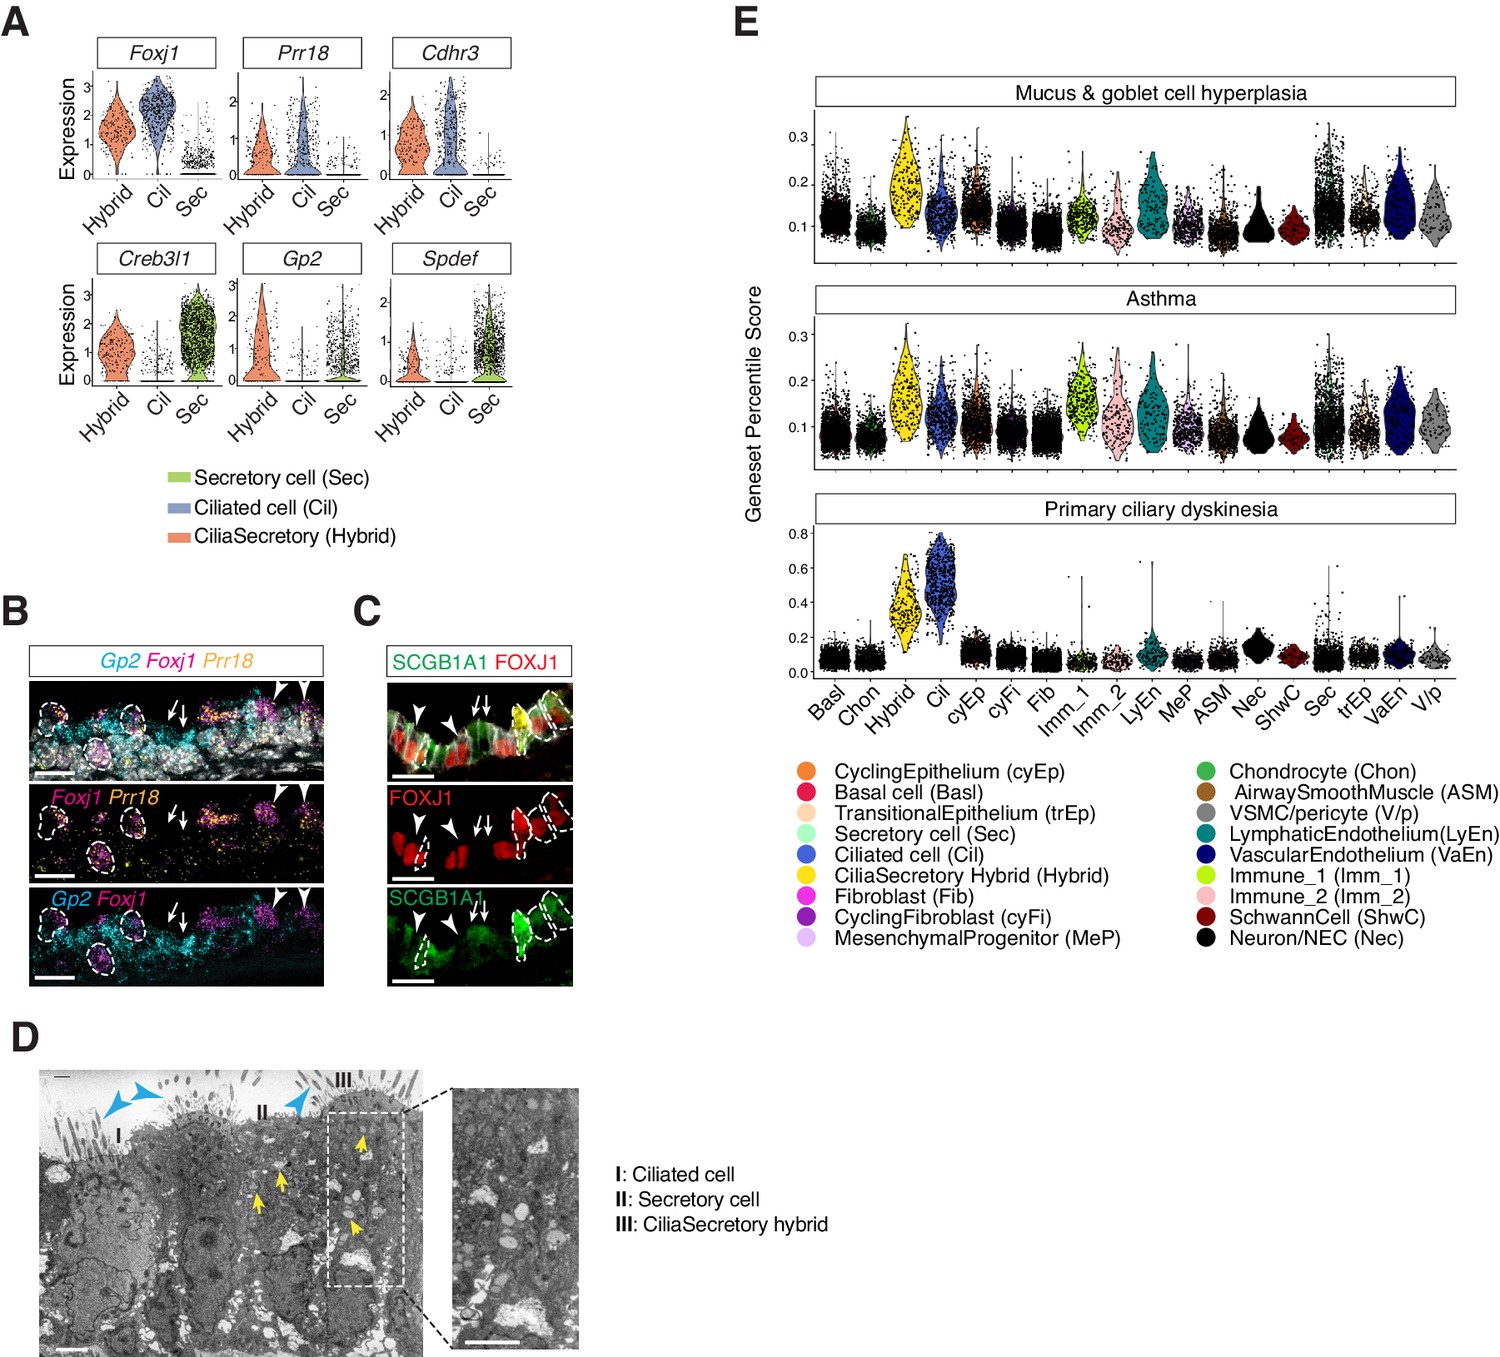
Characterization of neonatal cilia-secretory hybrid cells.
(A) Violin plots showing the expression levels of ciliated cell markers Foxj1, Prr18, and Cdhr3, as well as secretory cell markers Creb3l1, Spdef, and Gp2 in three cell clusters: ciliated cells, secretory cells, and cilia-secretory hybrids. Gene expression has been normalized and log-transformed. (B) RNA FISH analysis of Foxj1 (magenta), Gp2 (blue), and Prr18 (yellow) mRNA in P3 wild-type trachea. Hybrid cells expressing all three markers are indicated by dashed circles. Foxj1+ Prr18+ ciliated cells are indicated by arrowheads. Gp2+ secretory cells are indicated by arrows. Nuclei are marked by DAPI (grey). Scale bar indicates 20 μm. (C) Fluorescent immunostaining of FOXJ1 (red) and SCGB1A1 (red) in P3 wild-type trachea. Hybrid cells expressing both markers are indicated by dashed circles. FOXJ1+ ciliated cells are indicated by arrowheads. SCGB1A1+ secretory cells are indicated by arrows. Cell membranes are marked by E-cadherin (grey). Scale bar indicates 20 μm. (D) Transmission electron microscopy (TEM) images of P0 tracheal epithelial cells. Intracellular vesicles are indicated by arrows in yellow. Motile cilia are indicated by arrowheads in blue. Scale bar corresponds to 2 μm. (E) scGPS of disease-associated genes curated from the Online Mendelian Inheritance in Man (OMIM) database. Each dot represents a cell. Colors indicate cell clusters. Full lists of genes used are in Figure 4—source data 1.
-
Figure 4—source data 1
Gene Lists for scGPS analysis for airway diseases associated genes.
- https://cdn.elifesciences.org/articles/53085/elife-53085-fig4-data1-v2.xlsx
Figure 4—figure supplement 1
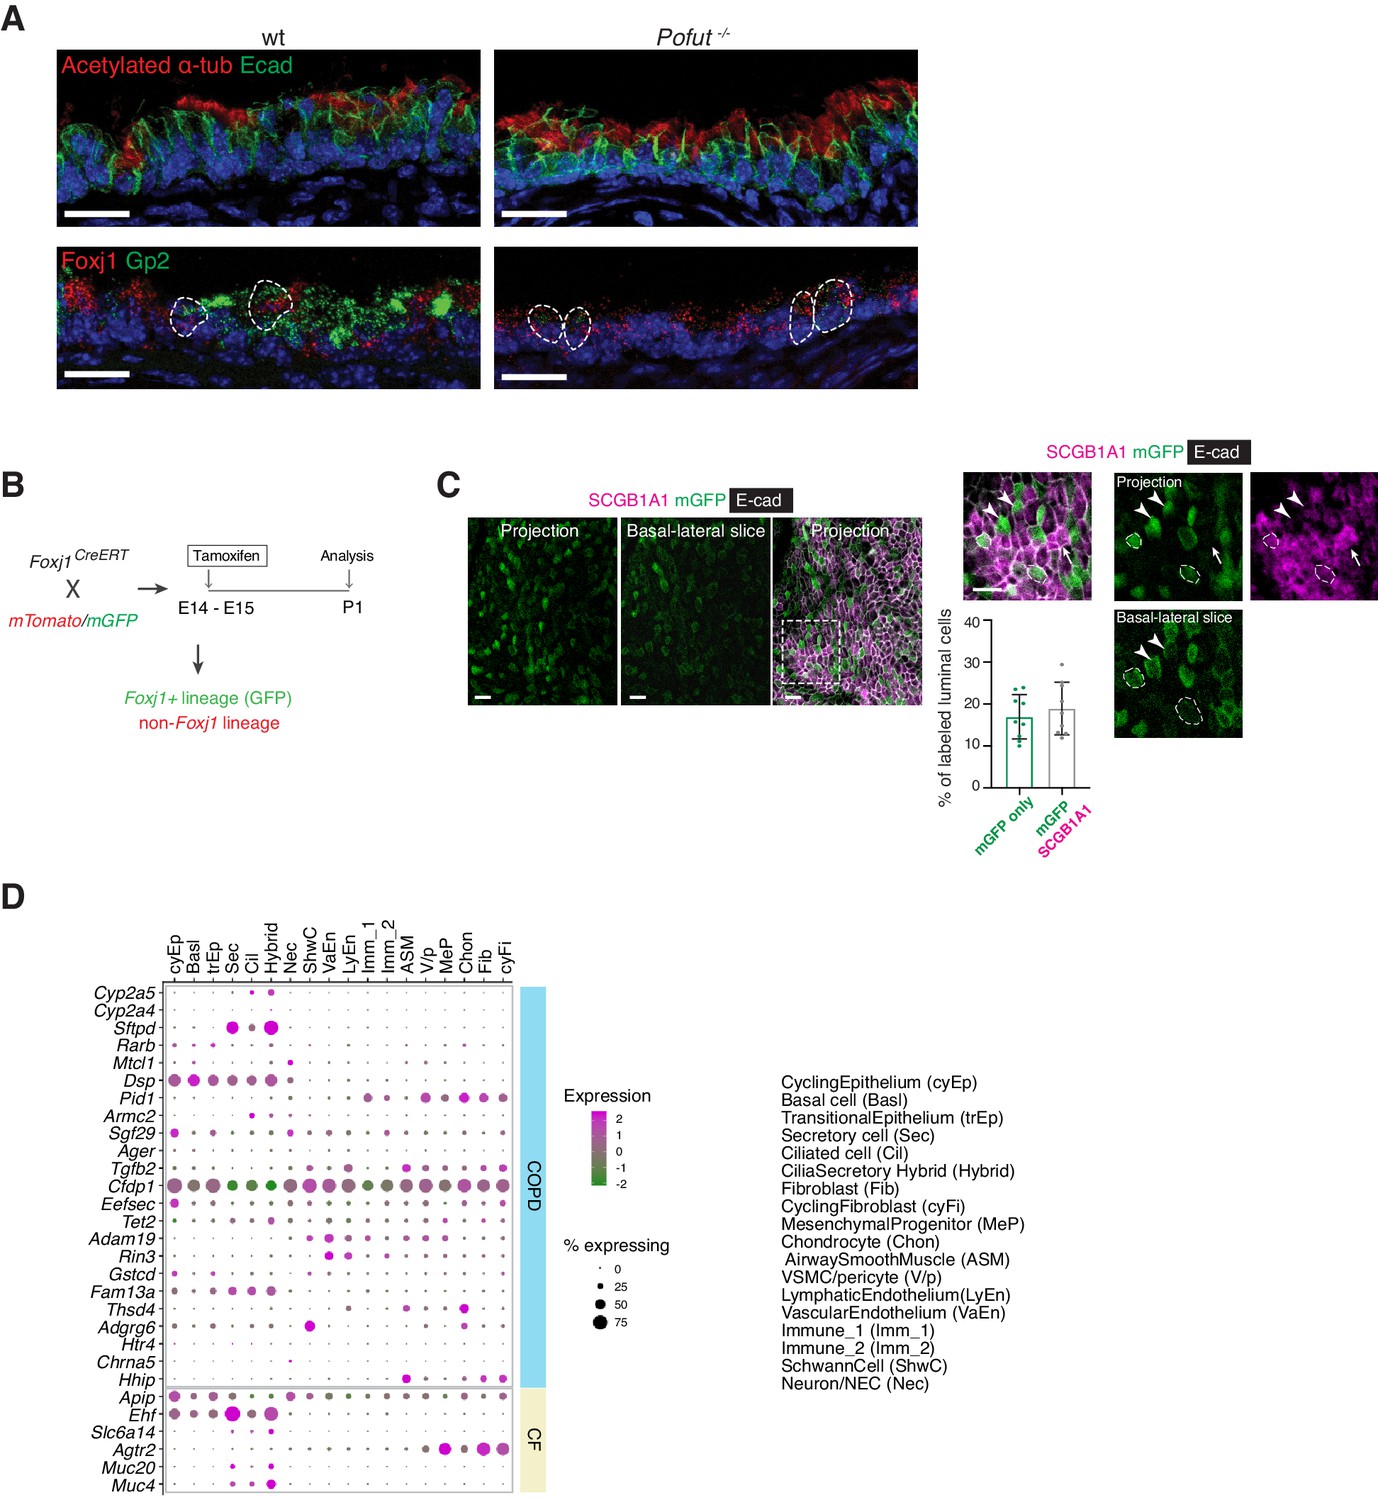
Characterization of cilia-secretory hybrid cells.
(A) Upper panel: Immunostaining of acetylated-α tubulin (red), which labels motile cilia of ciliated cells, shows abundant ciliated cells with motile cilia in Pofut-/- mutants compared to littermate controls. Cell membrane is marked by E-cad (green). Lower panel: RNA FISH analysis shows mRNAs of Foxj1 (red) and Gp2 (green) double positive cells, highlighted by dashed circle, were present in both genotypes. Note that Pofut-/- mutants lack cells that are only Gp2+ . Scale bar indicates 20 μm. (B) Foxj1CreERT2-GFP mice were crossed to Rosa26mT/mG mice for lineage tracing of Foxj1+ cells. Tamoxifen was injected into pregnant females at E14 to E15 to induce Foxj1-CRE expression. Trachea samples from Foxj1-CRE positive pups with mTomato expression and mGFP were examined at P1. (C) Cytoplasmic expression of SCGB1A1 (magenta) labels secretory cells, and mGFP (green) labels Foxj1+ lineage. Because mTomato fluorescence signal was quenched after PFA and methanol fixation, we use E-cadherin to label cell membrane in the red channel and was pseudo-colored in grey. Hybrid cells expressing both markers are indicated by dashed circles. mGFP+ green ciliated cells are indicated by arrowheads. SCGB1A1+ secretory cells are indicated by arrows. Scale bar indicates 20 μm. A quantification of mGFP+ green ciliated cells and mGFP+; SCGB1A1+ double positive yellow hybrid cells in P1 trachea (n = 3) was included. Error bars represent S.D. (D) Dot plot depicting expression patterns of genes implicated in the disease severity of COPD and CF. The size of the dot encodes the percentage of cells expressing the gene, while the color encodes the mean of expression level which has been normalized, log-transformed, and z-score transformed.
Figure 5 with 1 supplement

Ano1 KOs exhibit abnormal immune profiles of the airway mucosal barrier.
(A) Dot plot showing the expression of mucosal barrier regulators and immune mediators. Legends for cell types are indicated. The size of the dot encodes the percentage of cells expressing the gene, while the color encodes the mean of expression level which has been normalized, log-transformed, and z-score transformed. (B) Dot plot showing the temporal expression of airway barrier genes. The size of the dot encodes the percentage of cells expressing the gene, while the color encodes the mean expression level after normalization, log-transformation, and z-score transformation. cyEp: Cyling epithelium, Basl: Basal cells, trEp: Transitonal epithelium, Sec: Secretory cells, Cil: Ciliated cells, Hybrid: Cilia-Secretory hybrid cells, Imm_1: Fcer1g+/Cd3g+ immune cells, Imm_2: Cx3cr1+/C1qa+ immune cells, Others: all other cell types and states (C) Expression of selected airway barrier genes altered in Ano1-/- mutant epithelial cells at P4. The size of the dot encodes the percentage of cells expressing the gene, while the color encodes the mean of expression level which has been normalized, log-transformed, and z-score transformed. Cell type legends for A and B are shown in the figure. (D) Violin plots showing the expression levels of Saa3, Ccl6, and Clec4n in the Fcer1g+ resident immune cells. Gene expression has been normalized and log-transformed.
Figure 5—figure supplement 1
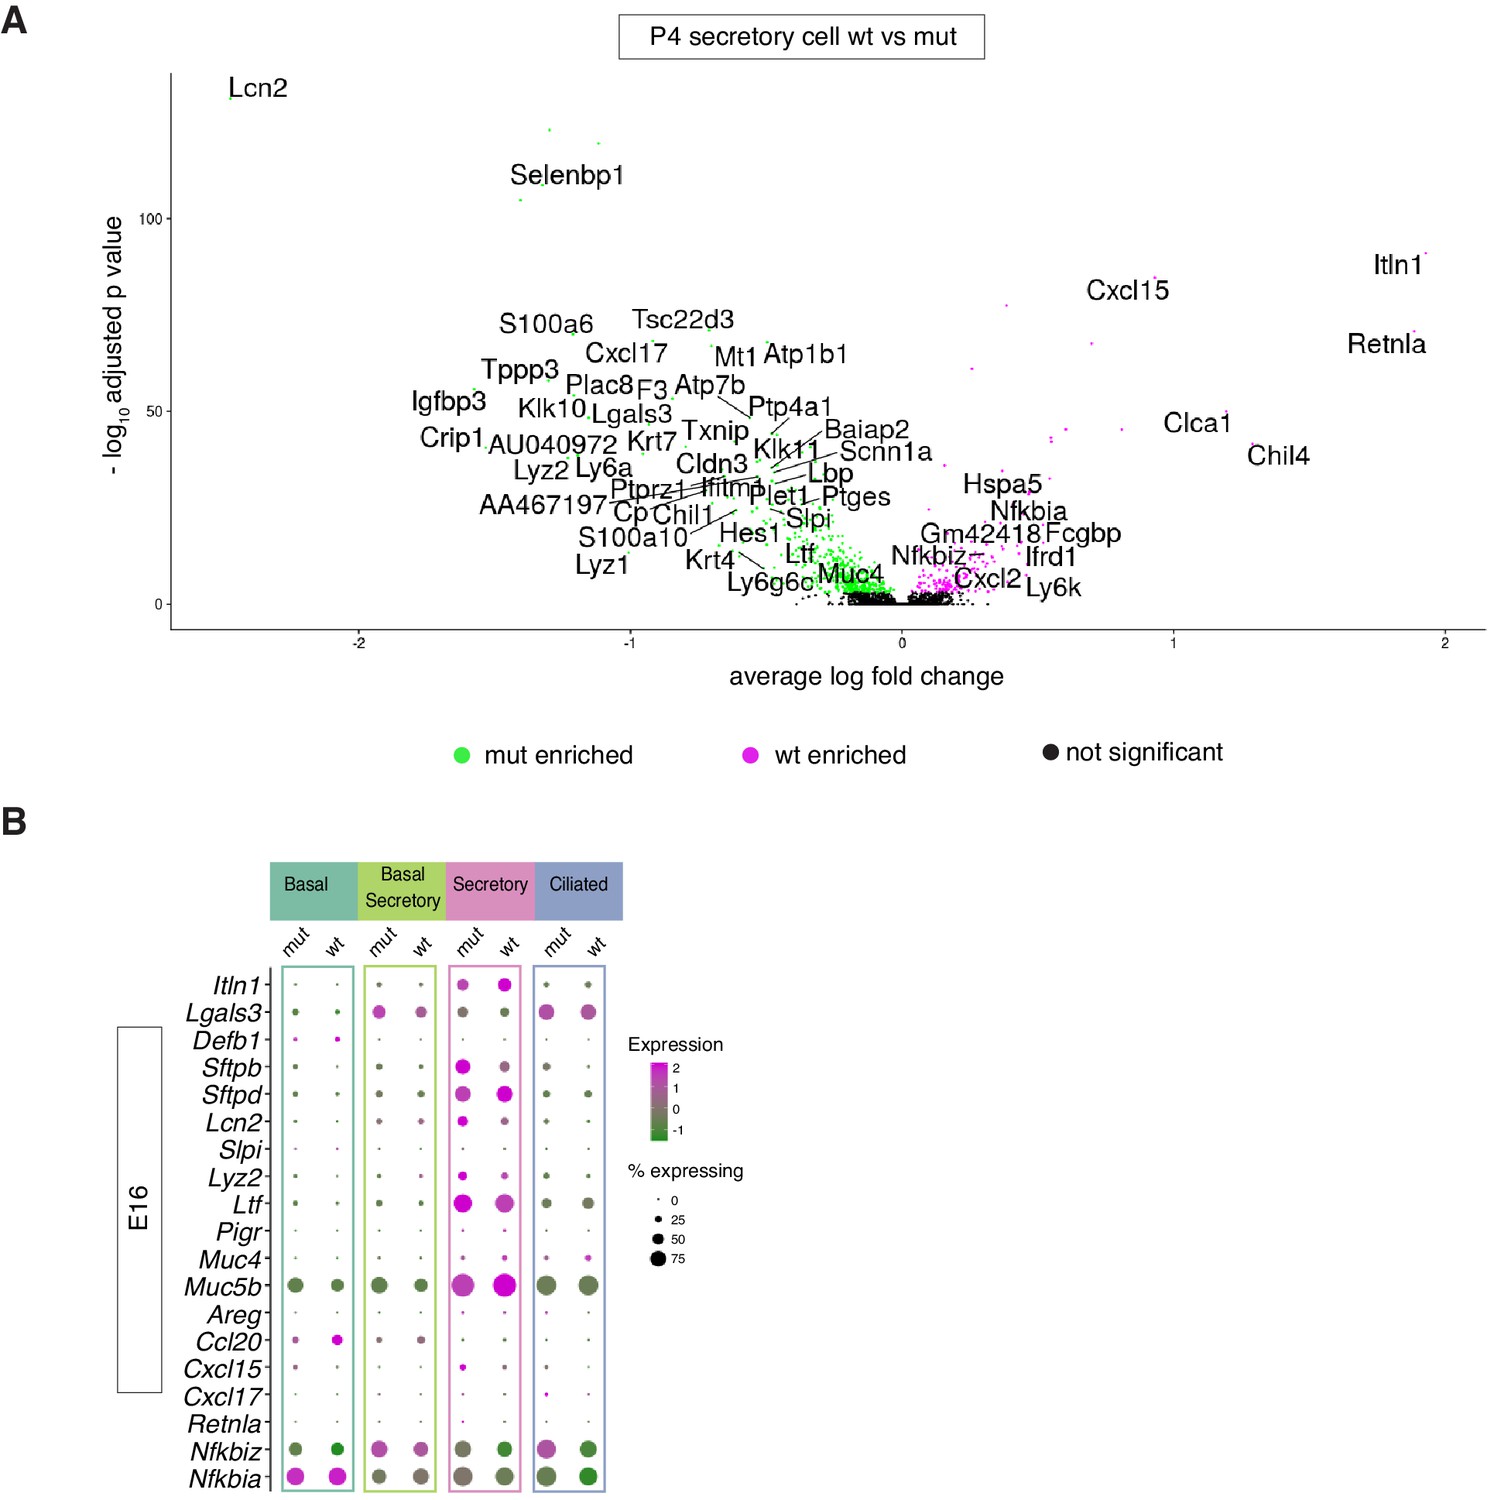
Cell-type-specific expression of barrier function related genes in wild-type and Ano1-/- mutant tracheal epithelial cells.
(A) Volcano plot showing distinct expression profiles for mucosal barrier genes in wild-type and Ano1-/- mutant secretory cells at P4. Labeled genes are differentially expressed. (B) Dot plot showing the expression of mucosal barrier regulators and immune mediators at E16 airway of wild-type and Ano1-/- mutant embryos. Legends for cell types are indicated. The size of the dot encodes the percentage of cells expressing the gene, while the color encodes the mean of expression level which has been normalized, log-transformed, and z-score transformed.
Figure 6 with 1 supplement
Expressions of Ano1 and Cftr in embryonic and fetal airways.
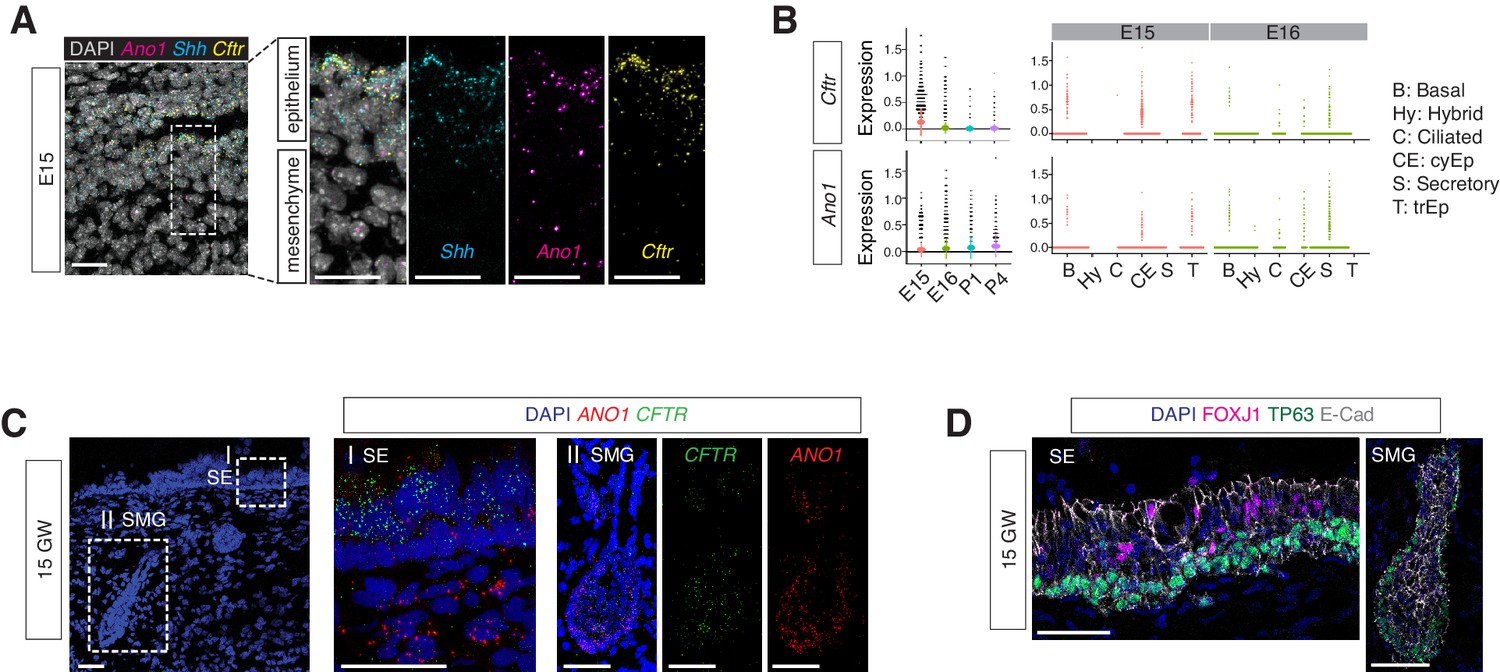
(A) Expression of Shh, Cftr, and Ano1 in E15 trachea examined by FISH. Shh marks tracheal epithelial cells. Nuclei are stained by DAPI (white). Scale bar indicates 20 μm. (B) Expression of Cftr and Ano1 in tracheal epithelial cells at different time points, with a cell type breakdown for E15 and E16. Expressions of Cftr and Ano1 in neonatal tracheal epithelial cells are shown in Figure 6—figure supplement 1. (C) Expression of CFTR and ANO1 in human fetal trachea of GW 15 by FISH. Two areas (I: surface epithelium/SE; II: submucosal glands/SMG) of the fetal tracheal epithelium are enlarged. Nuclei are stained by DAPI (blue). Scale bar indicates 50 μm. (D) Immunofluorescence staining of TP63 (green) and FOXJ1 (magenta) in human fetal tracheal sample at GW 15. SE and SMG are shown. Ciliated cells are only present in the surface epithelial cell layer. Epithelial cells are marked by E-cad in white. Nuclei are stained by DAPI (blue). Scale bar indicates 50 μm.
Figure 6—figure supplement 1
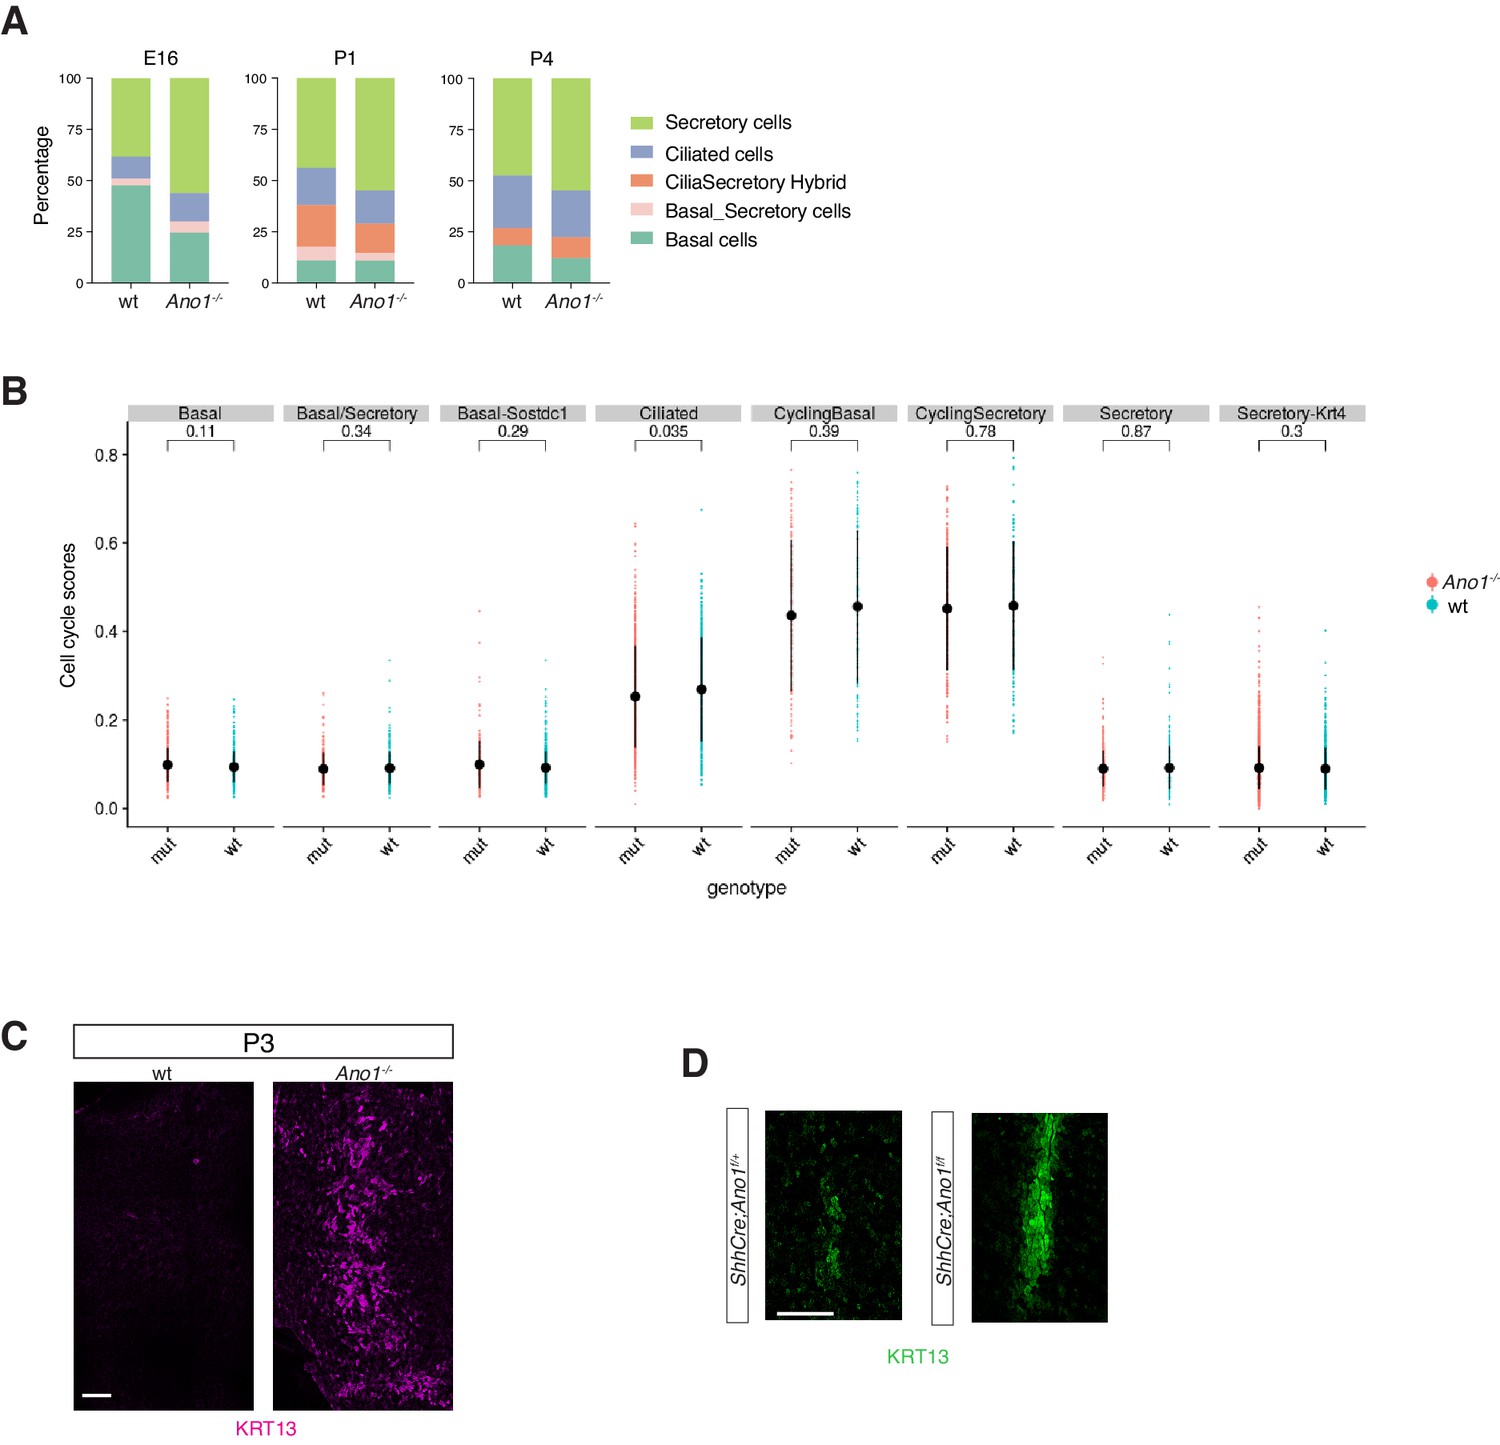
Expansion of the secretory cell lineage in global and conditional Ano1 knockouts.
(A) Cellular composition for tracheal epithelial cells of wild-type littermates and Ano1-/- mutants from different time points. (B) scGPS showing cell-cycle gene expression in every epithelial cell state at E16 in wild-type and Ano1-/- mutant embryos. scGPS (single-cell Geneset Percentile Score) is an expression enrichment analysis that utilizes sets of genes underlying certain biological and pathological processes to infer functional profiles for each cell. Adjusted p-values for the comparison within each cell type (unpaired two-tailed wilcoxon-test between wild-type and mutant) are indicated. (C) Immunofluorescent staining of KRT13 (magenta) in wild-type and Ano1-/- trachea at P3. Scale bar represents 100 μm. (D) Immunofluorescent staining of KRT13 (green) in adult ShhCre; Ano1flox/- and ShhCre; Ano1flox/flox conditional knockouts. n = 4 were analyzed. Scale bar indicates 50 μm.
Figure 7 with 2 supplements
Ano1 inhibits differentiation towards the secretory lineage in development and regeneration.
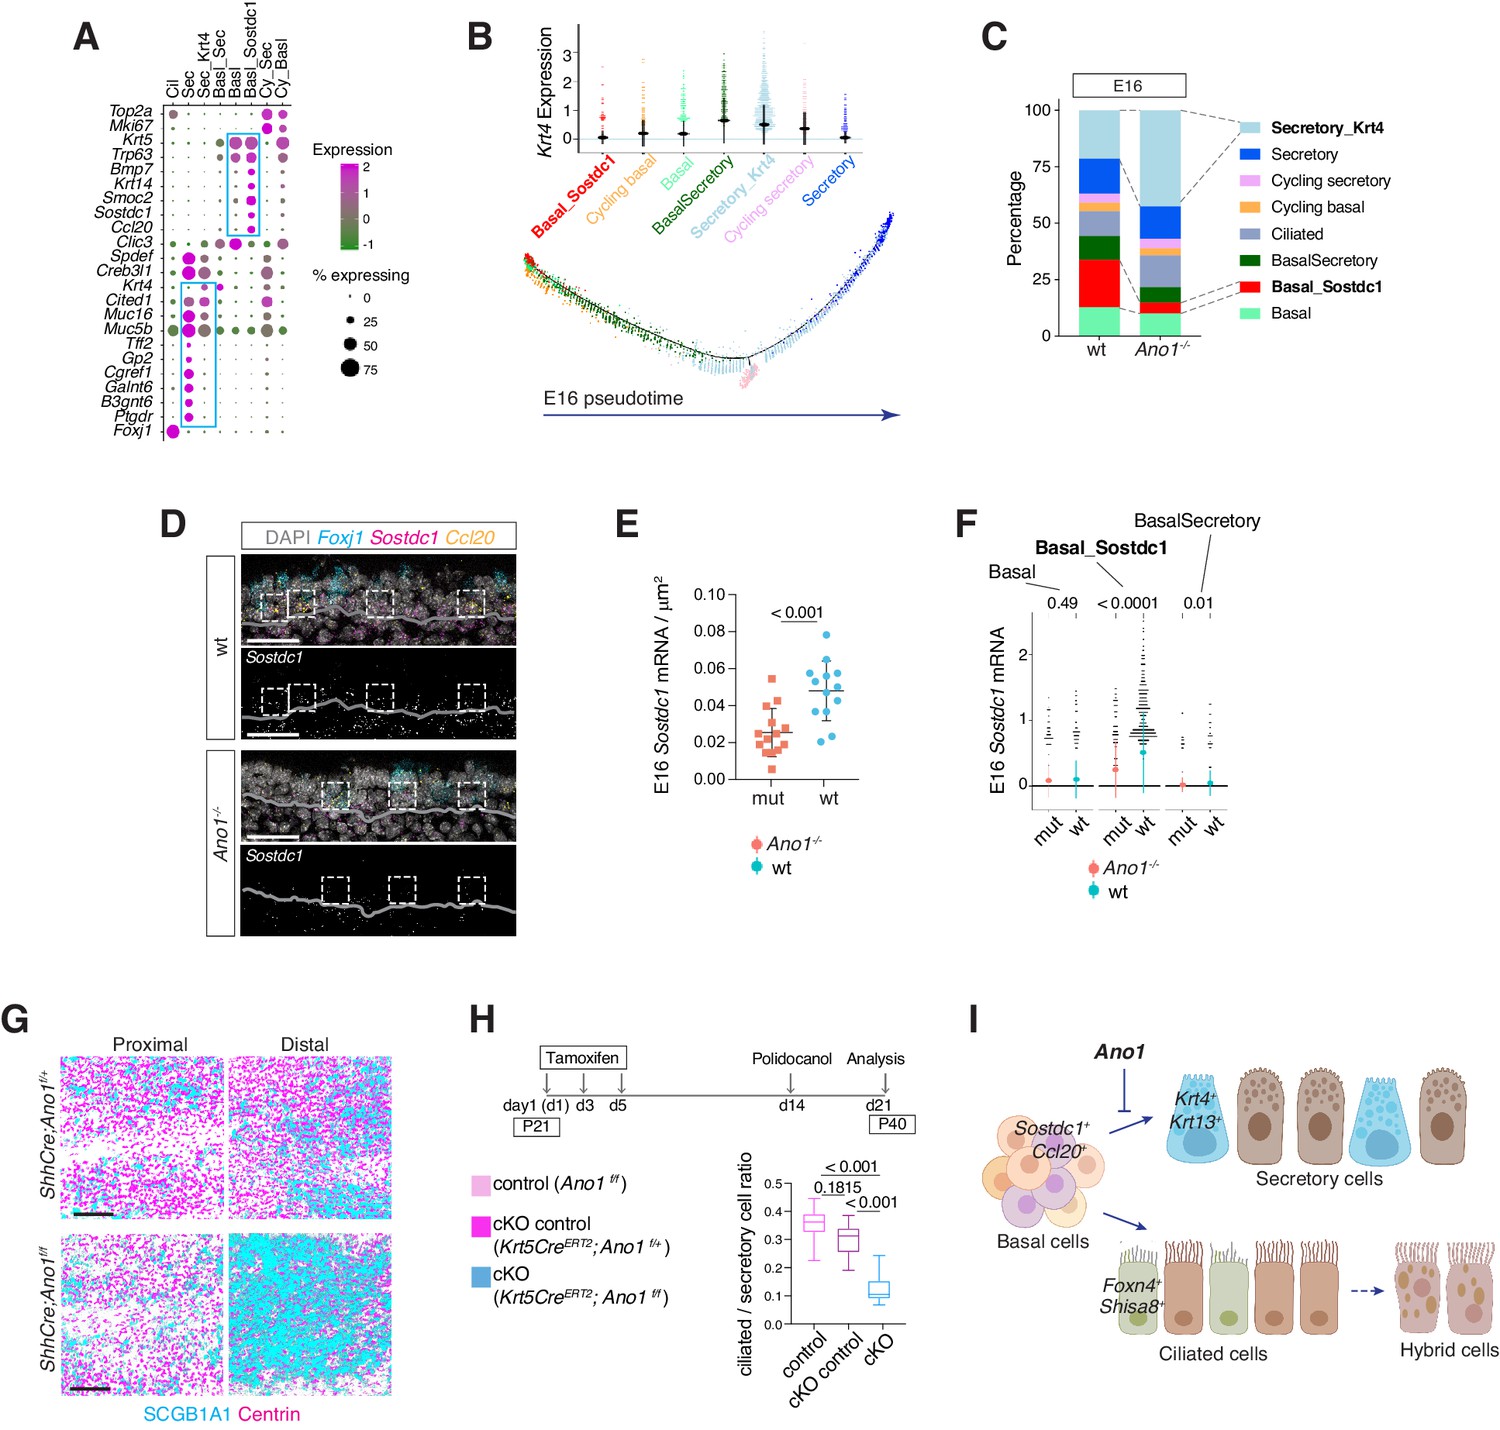
(A) Dot plot depicting expression of marker genes of cell types and states identified from E16 tracheal epithelial cells. Markers for Basal_Sostdc1 and secretory cells are highlighted in blue box. The size of the dot encodes the percentage of cells expressing the gene, while the color encodes the mean of expression level that has been normalized, log-transformed, and z-score transformed. Both wild-type and Ano1-/- mutants are included for this analysis. Cil: ciliated cells; Sec: Secretory cells; Sec_Krt4: Krt4+ immature secretory cells; Basl_Sec: basal-to-secretory transition state; Basl: basal cells; Basl_Sostdc1: Sostdc1+ basal cells; Cy_Sec: cycling secretory cells; Cy_Basl: cycling basal cells. (B) Upper panel: Krt4 expression in all basal and secretory cell states at E16. Expression values have been normalized and log-transformed. Lower panel: pseudotime trajectory of these cell states. Color codes for different cell states are indicated. (C) Cellular composition of tracheal epithelial cells from wild-type and Ano1-/- mutants at E16. (D) Expression of Sostdc1, Ccl20, and Foxj1 in wild-type and Ano1-/- mutant trachea samples at E16 detected by FISH. Sostdc1 single channel images are shown in black and white. Dashed squares indicate Sostdc1+ Ccl20+ double-positive cells. Scale bar indicates 40 μm. (E) Concentration of Sostdc1 RNA probes from wild-type and Ano1-/- mutant trachea samples at E16. n = 3 for each genotype. p-Value (unpaired two-tail t-test) are indicated. Error bars represent S.D. (F) Expression level of Sostdc1 in wild-type and Ano1-/- mutants at E16 in different basal cell states. Each dot represents a cell. Expression values have been normalized and log-transformed. Colored circles indicate mean expression values. Colored vertical lines cover the range of one standard deviation above or below the mean. Adjusted p-values for the comparison within each cell type (unpaired two-tailed wilcoxon-test between wild-type and mutant) are indicated. (G) Distal tracheal epithelial cells exhibit mucous metaplasia in adult ShhCre; Ano1flox/- and ShhCre; Ano1flox/flox conditional knockouts at P25. Ciliated cells are marked by Centrin (magenta). Secretory cells are marked by SCGB1A1 (blue). n = 3 for each genotype. Scale bar indicates 50 μm. (H) Ratio of ciliated cells over secretory cells in regenerating adult trachea. Injection scheme of Tamoxifen and application of Polidocanol were indicated. Ano1flox/flox, Krt5CreERT2; Ano1flox/+ and Krt5CreERT2; Ano1flox/flox were included in this analysis. Both proximal and distal trachea were included in the analysis. n = 3 for each genotype. P-value (Ordinary one-way ANOVA Tukey test and multiple comparisons) are indicated. Box and whisker plot shows 10–90 percentile. (I) Model of Ano1-mediated epithelial cell differentiation of the embryonic trachea.
Figure 7—figure supplement 1
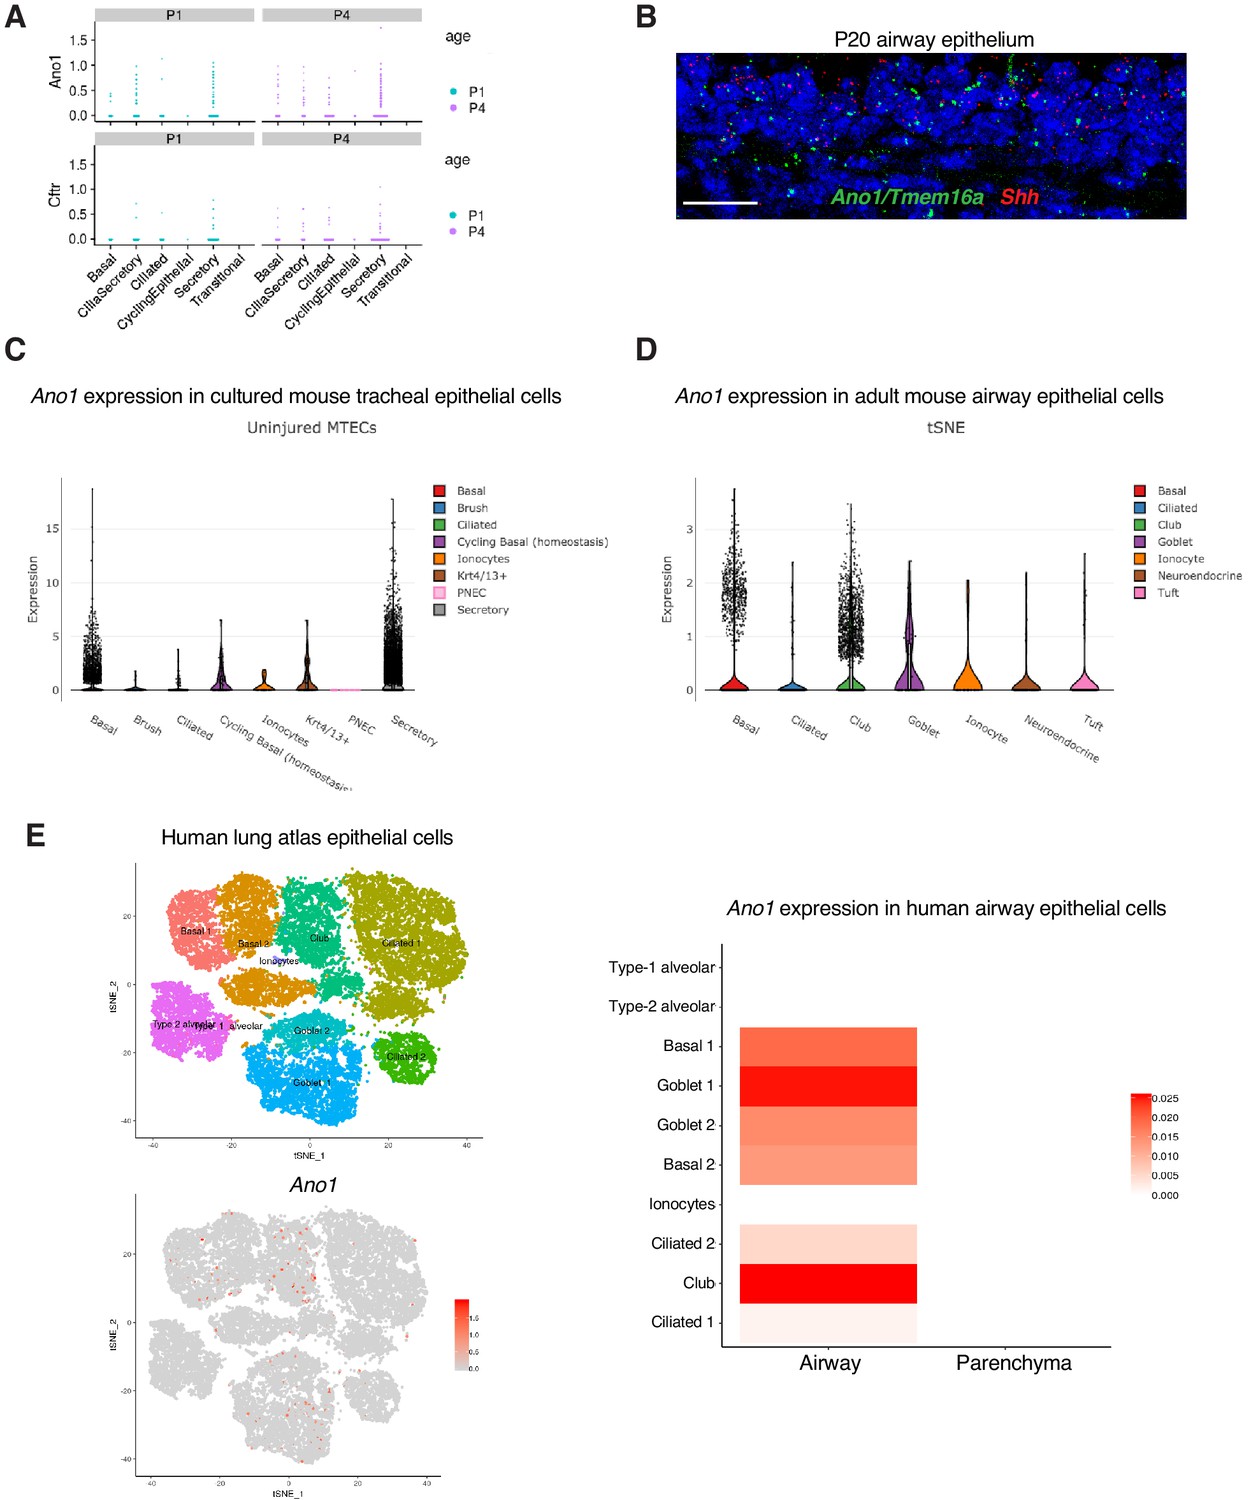
Expression of Ano1 in postnatal airway epithelial cells.
(A) Postnatal expression of Ano1 and Cftr in mouse tracheal epithelial cells, with a cell type breakdown for P1 and P4. (B) Expression of Shh (red) and Ano1 (green) in P20 trachea examined by fluorescent RNA in situ analysis. Shh marks tracheal epithelial cells. Nuclei are stained by DAPI (blue). Scale bar indicates 20 μm. (C) Expression of Ano1 in different cell types from cultured uninjured mouse tracheal epithelial cells (MTEC). Data obtained from https://singlecell.broadinstitute.org/single_cell/study/SCP64/a-single-cell-atlas-of-the-airway-epithelium-reveals-the-cftr-rich-pulmonary-ionocyte#study-visualize (D) Expression of Ano1 in different cell types from adult mouse tracheal epithelial cells at homeostatic state. Data obtained from https://singlecell.broadinstitute.org/single_cell/study/SCP163/airway-epithelium#study-visualize (E) Expression of Ano1 in different cell types from adult human airway epithelial cells at homeostatic state. Data obtained from https://asthma.cellgeni.sanger.ac.uk/.
Figure 7—figure supplement 2
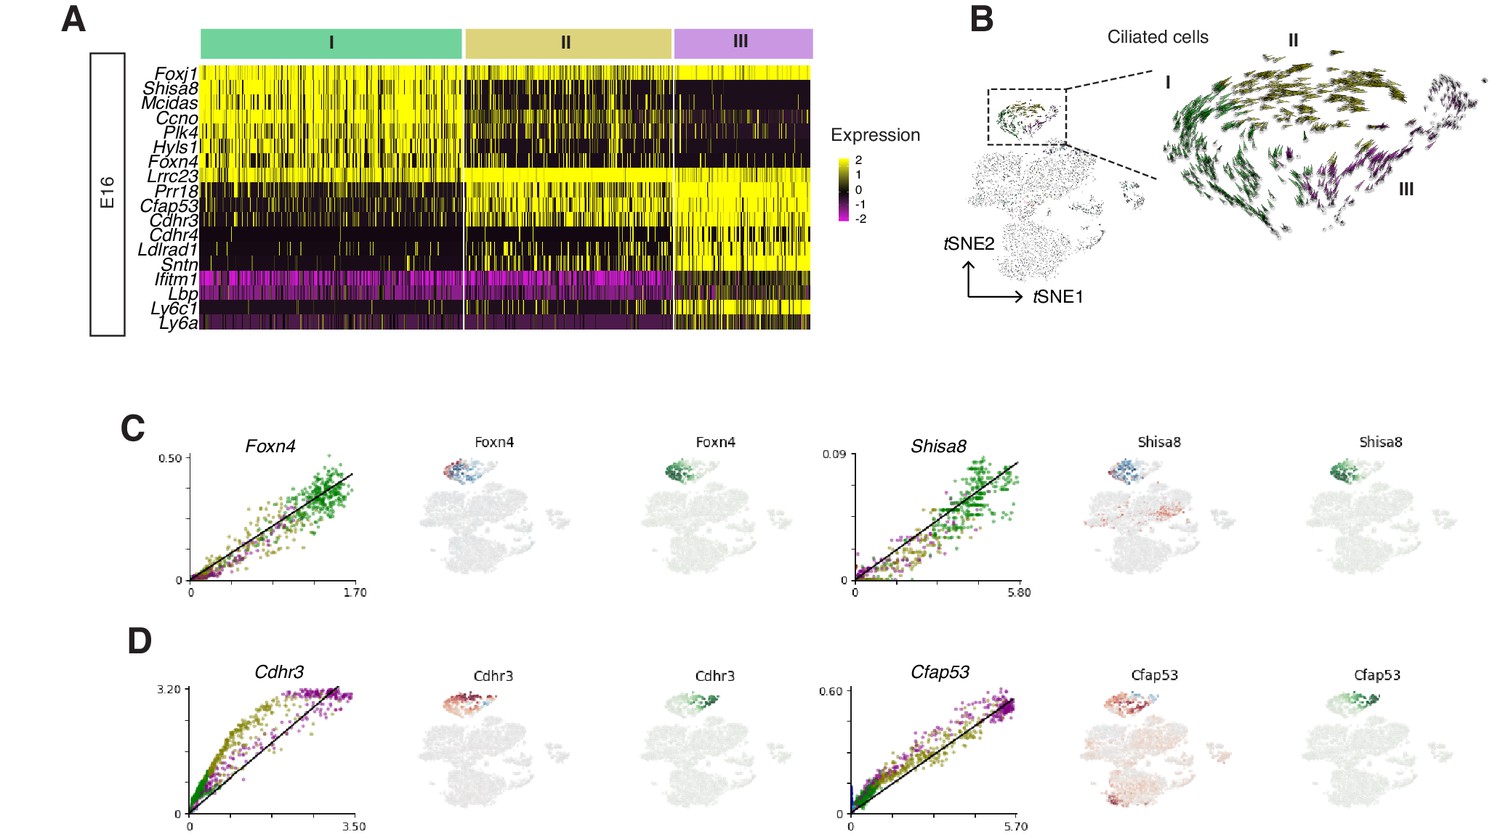
Single-cell velocity estimates for individual ciliated cells at E16.
(A) A heat map showing state-specific marker genes of ciliated cells at E16. Gene expression has been normalized, log-transformed, and z-score transformed. Both wild-type and Ano1-/- mutant cells are included. (B) Single-cell velocity estimates for individual E16 tracheal epithelial cells. Arrows show the extrapolated states projected onto the tSNE plot for both wild-type and Ano1-/- mutant cells. (C) Phase portraits and fits of the equilibrium slope for Foxn4 and Shisa8 at E16. For each gene, the first column shows spliced-unspliced phase portrait with the equilibrium slope fit shown by the line. The second column represents the magnitude of the residuals. The third column shows the expression for the spliced molecules. (D) Phase portraits and fits of the equilibrium slope for Cdhr3 and Cfap53 at E16.
Author response image 1
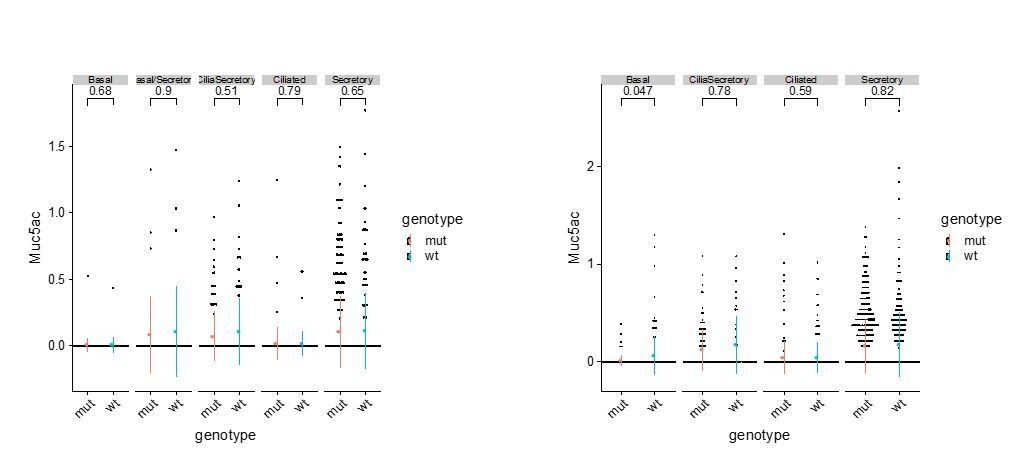
Muc5ac expression.
Author response image 2

tSNE plots of single cell transcriptomes for control and Tmem16a KO mutant tracheal cells at E16, P1, and P4.
Additional files
Download links
A two-part list of links to download the article, or parts of the article, in various formats.
Downloads (link to download the article as PDF)
Open citations (links to open the citations from this article in various online reference manager services)
Cite this article (links to download the citations from this article in formats compatible with various reference manager tools)
Chloride channels regulate differentiation and barrier functions of the mammalian airway
eLife 9:e53085.
https://doi.org/10.7554/eLife.53085


