Recurrent circuitry is required to stabilize piriform cortex odor representations across brain states
- Department of Neurobiology, Duke University Medical School, United States
Figures
Figure 1 with 7 supplements
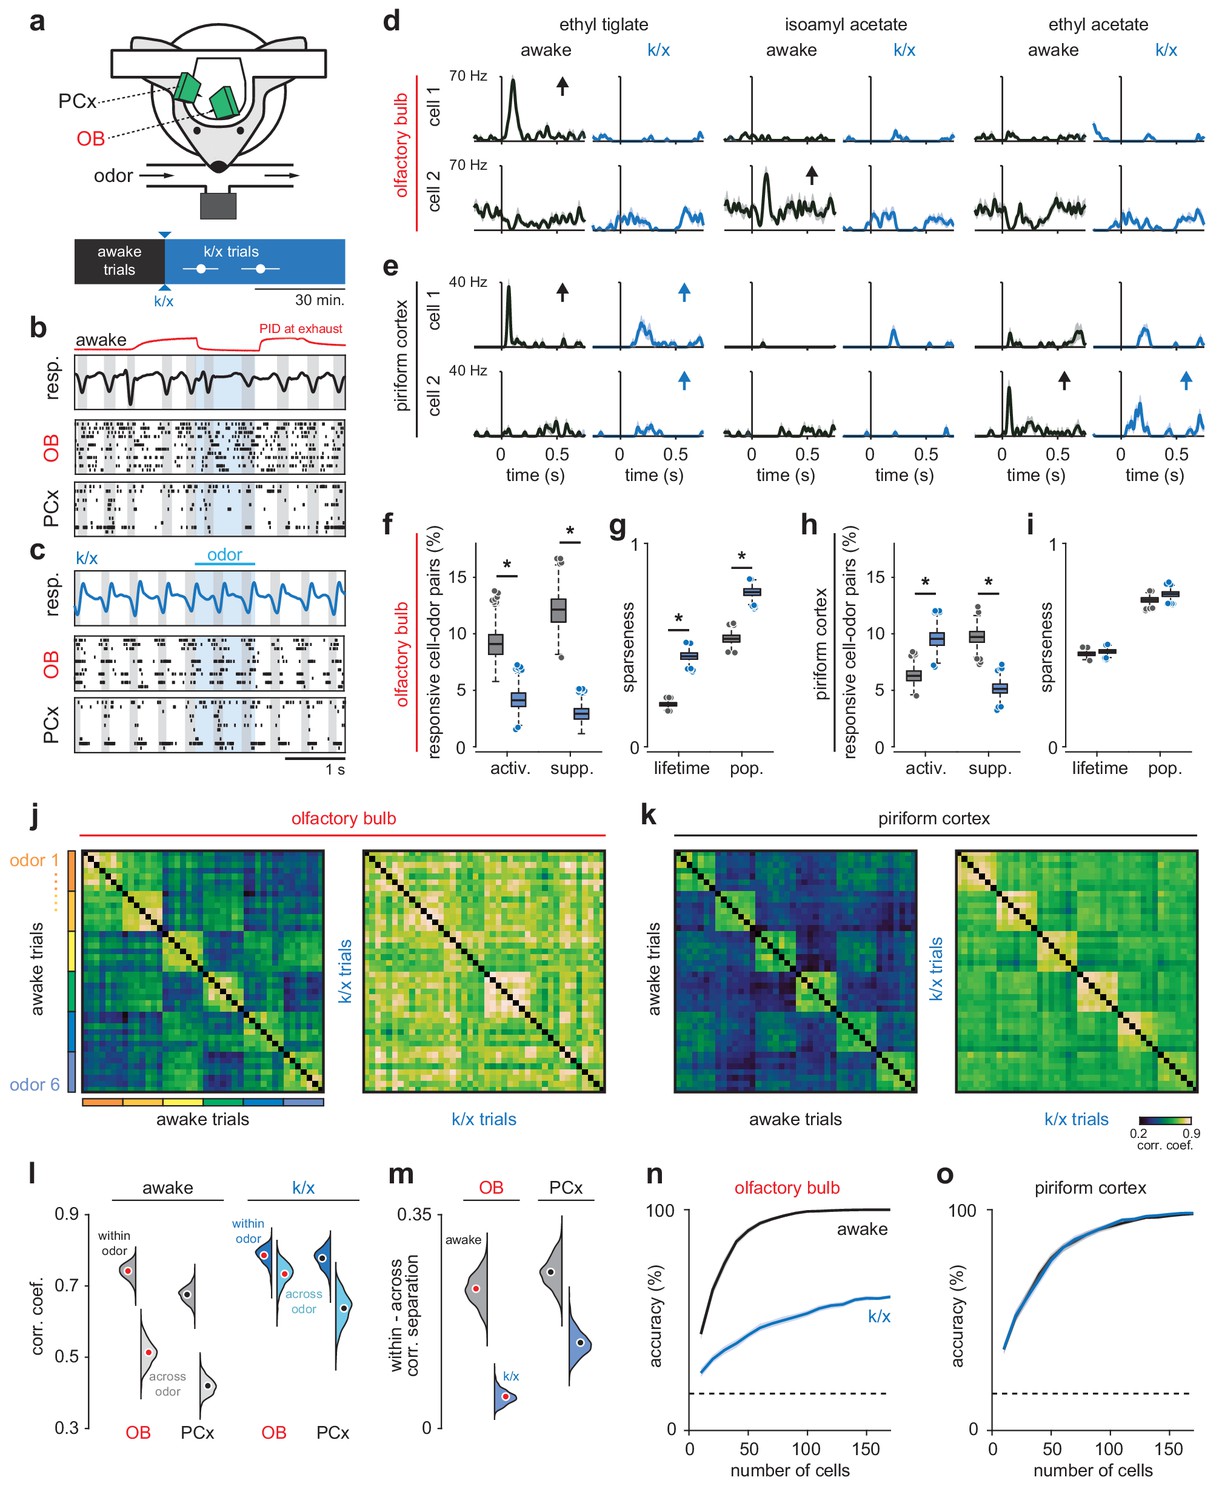
Odor responsivity is state-dependent in OB but not PCx.
(a) Recording and experimental schematics. Timing of first and last trials designated as anesthetized for analysis, starting from the onset of behavioral indicators of anesthesia and continuing for 10–15 presentations of all odors (n = 12 experiments in six mice). Error bars are mean ± SEM. (b) Example recording showing irregular respiration (top) and desynchronized spiking in awake OB (middle) and PCx (bottom). Ticks indicate action potentials and each row represents a different cell. Gray shading indicates inhalation, blue shading indicates odor delivery, red trace is an example PID trace monitored at the exhaust port of the switched final delivery valve. (c) Same recording as b after k/x injection. Respiration becomes rhythmic and spontaneous spiking in OB and PCx slows and becomes entrained to respiration under anesthesia. (d) Example OB cell-odor pair responses during awake and k/x trials showing loss of significant odor responses under anesthesia. Arrows indicate significant responses. (e) Example PCx cell-odor pair responses during awake and k/x trials showing preserved odor responses under anesthesia. Arrows indicate significant responses. (f) Percent of OB cell-odor pairs with significant activation or suppression (n = 187 cells, 12 experiments). Asterisks indicate p<0.05 in bootstrap difference test (Activation: p=0.007; Suppression: p<0.001). Boxes indicate quartiles and whiskers indicate ± 2.7 st. dev. from mean. Data points outside this range are shown as circles. (g) Lifetime and population sparseness in OB (bootstrap difference test, p<0.05) across all cells and odors. Asterisks indicate p<0.05 on bootstrap difference test. Lifetime: p<0.001; Population: p<0.001. (h–i) As in f-g, but in PCx (n = 640 cells, 11 experiments). Activation: p=0.003; Suppression: p<0.001; Lifetime: p=0.45; Population: p=0.22. (j–k) Trial-by-trial pseudopopulation correlation matrices sorted by odor within OB (j) and PCx (k) in awake and anesthetized conditions. Odors are (1) ethyl butyrate, (2) isoamyl acetate, (3) 2-hexanone, (4) hexanal, (5) ethyl tiglate, (6) ethyl acetate. (l) Bootstrapped distributions of within- and across-odor trial-to-trial correlations in OB and PCx computed by sampling cells with replacement and computing the mean correlation within and across odors 1000 times. Means are shown as filled circles. (m) Separation (mean within-odor correlations - mean across-odor correlations) of odor representations in OB and PCx over 1000 bootstrap iterations. (n–o) Odor classification accuracy as a function of pseudopopulation size in OB (n) and PCx (o) in awake and anesthetized states using a multiclass linear support vector machine. Mean ± 95% bootstrapped confidence intervals.
Figure 1—figure supplement 1
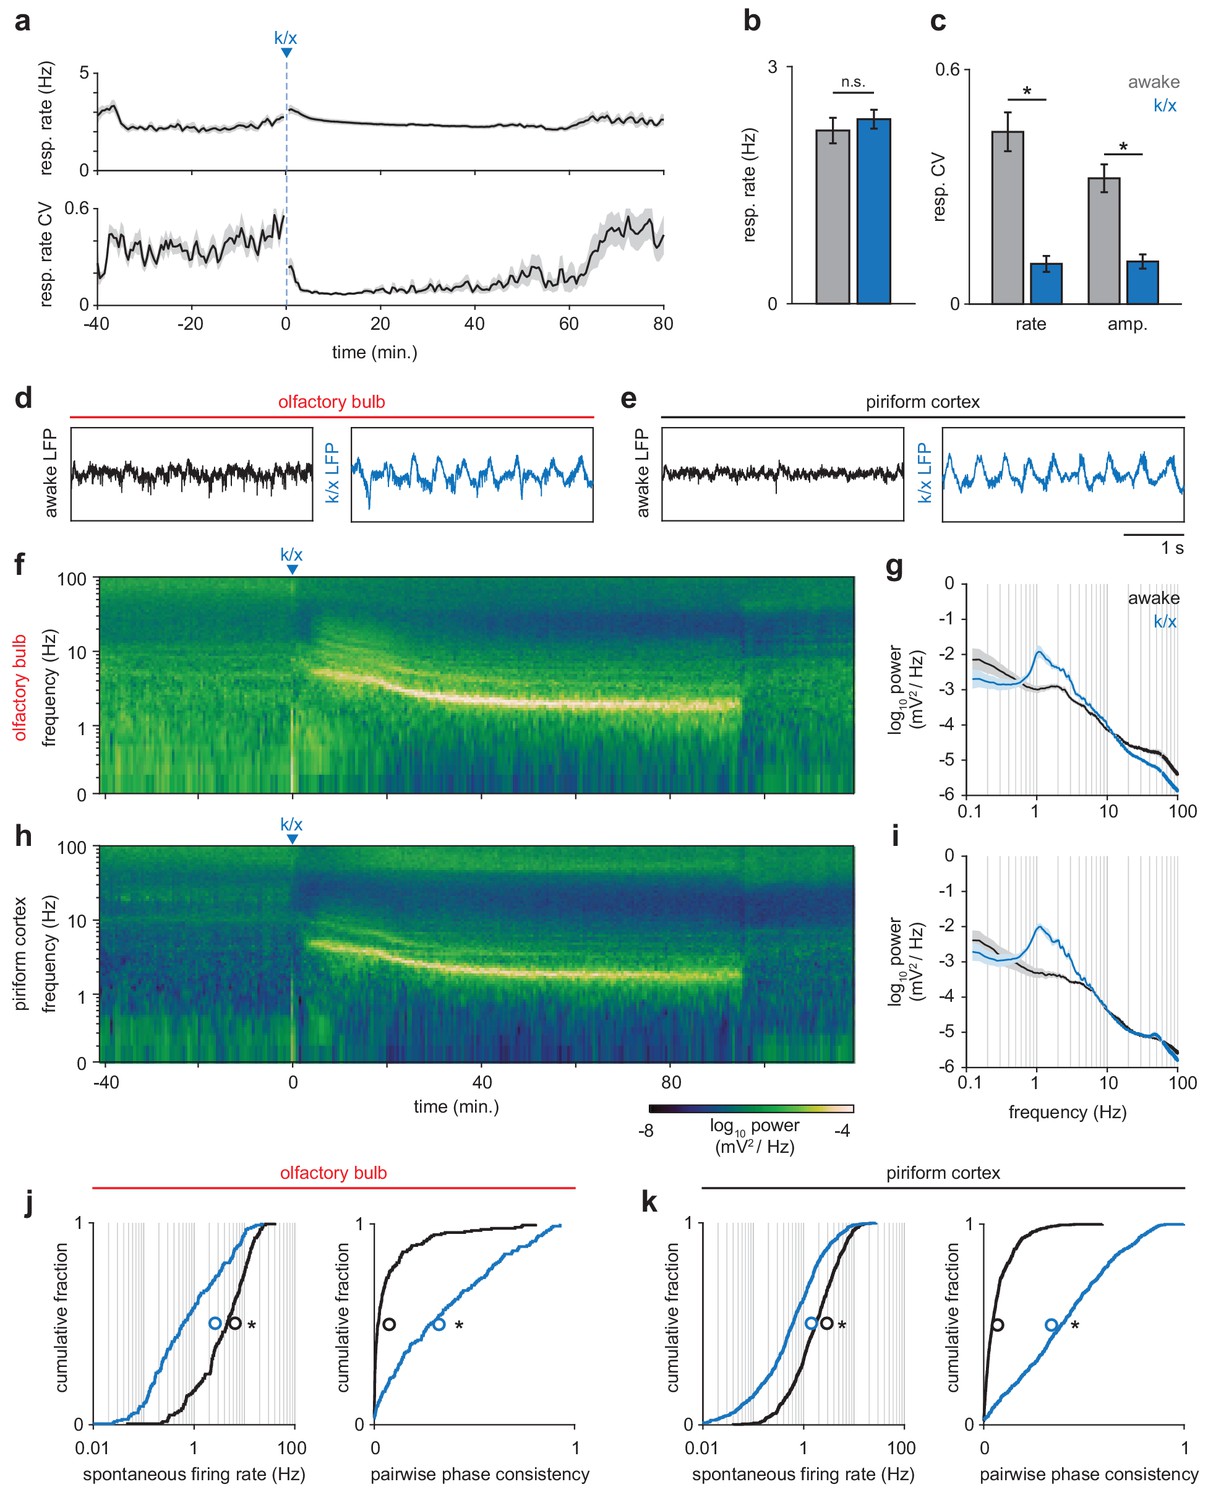
State-dependent changes in respiration, local field potential and spontaneous spiking.
(a) Respiration rate (top) and coefficient of variation (CV, bottom) measured in a sliding 60 s window before and during anesthesia (n = 12 experiments, mean ± sem). (b) Average respiration rate did not differ between awake (gray) and anesthetized periods (blue); paired t-test, t(11) = −1.07, p=0.30. (c) Variability in the rate and amplitude or respiration decreases under anesthesia (paired t-tests; rate: t(11) = 6.93, p=2.48e-5; amplitude: t(11) = 6.98, p=2.32e-5.) Error bars are mean ± sem. (d–e) Example local field potential traces from OB (d) and PCx (e) from awake and anesthetized periods. Awake LFP in both regions is desynchronized, while anesthetized LFP becomes strongly coupled to respiration. (f) Example spectrogram showing LFP power in OB throughout an experiment. After k/x injection, high frequency power rapidly diminishes and is replaced by strong low frequency oscillations. (g) Average power spectra during awake and anesthetized periods in OB (n = 12, mean ± sem). (h–i) As in f and g but for PCx (n = 11, mean ± sem). (j) Spontaneous spiking activity is reduced and more couple to respiration in OB under anesthesia. Left, cumulative distribution of spontaneous firing rates in awake (black) and anesthetized (blue) periods. Mean shown as unfilled circles. Paired t-test, t(186) = 14.46, p=6.22e-34. Right, cumulative distribution of pairwise phase-consistency of spiking relative to respiration phase. Paired t-test, t(186) = −15.03, p=3.07e-32. (k) As in j, but for PCx. Paired t-tests: Spontaneous rate, t(639) = 21.66, p=1.88e-78. Pairwise phase consistency, t(639) = −29.52, p=1.81e-121.
Figure 1—figure supplement 2
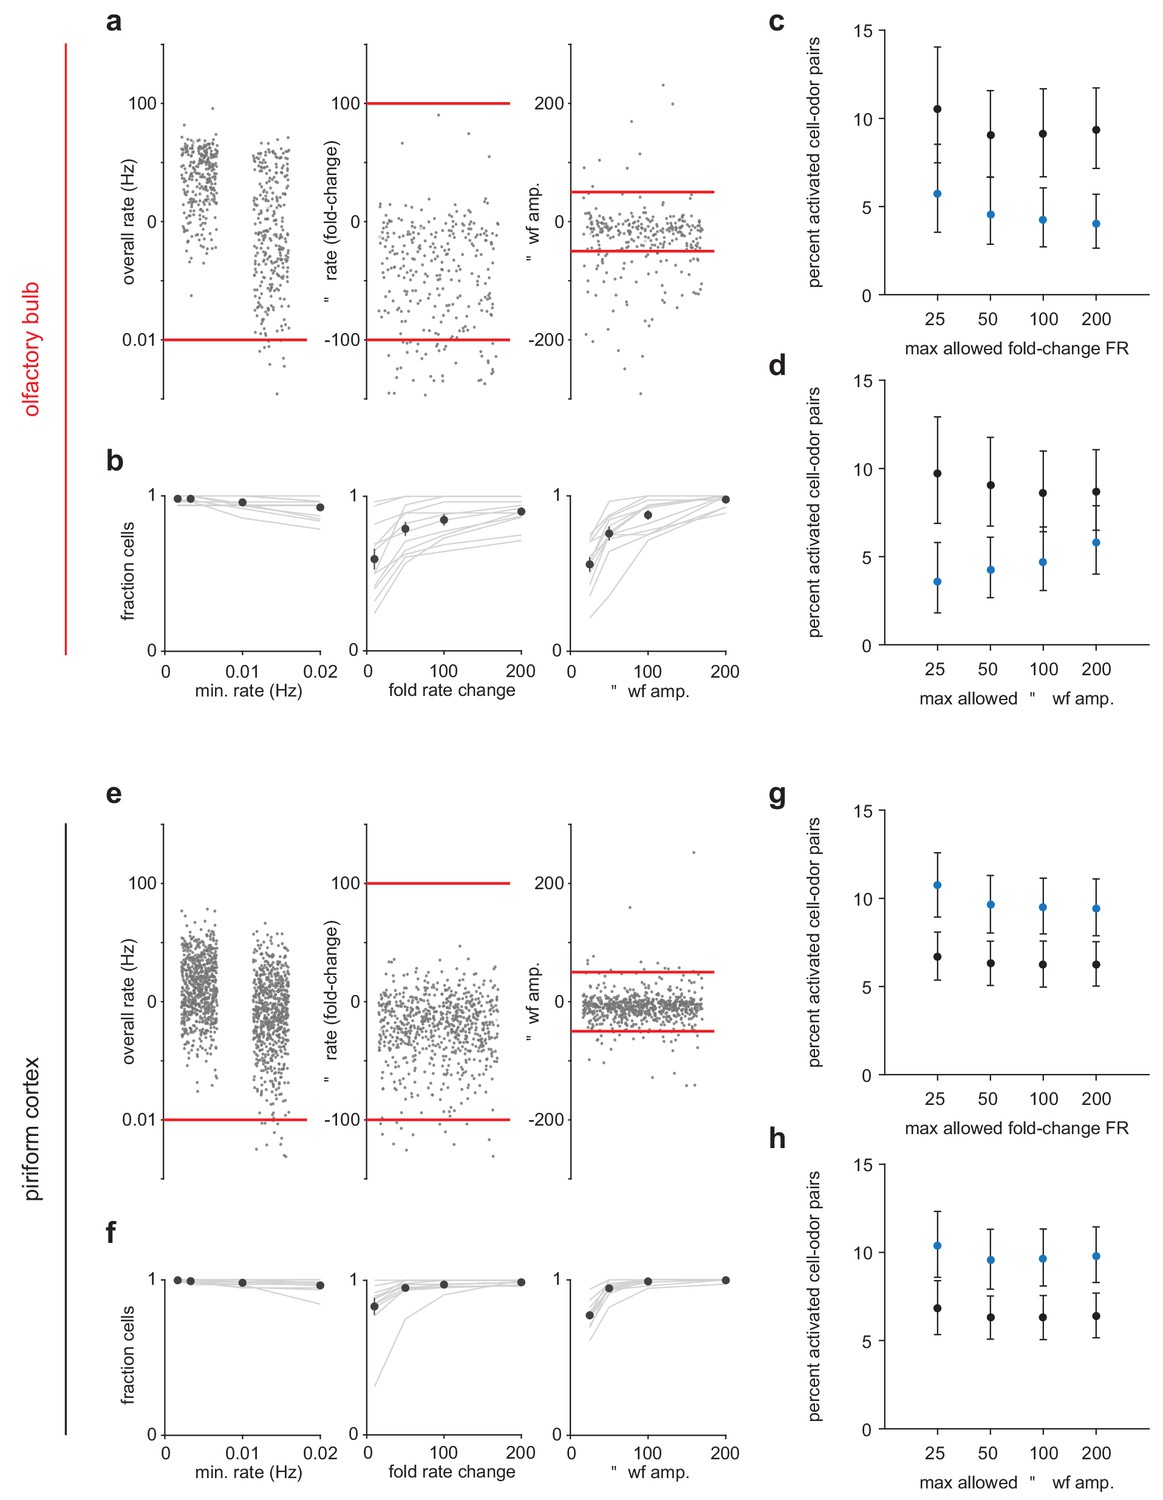
Criteria for maintaining sorted unit identity across states.
(a) Left, Overall firing rates for all sorted OB units. Units falling below one spike in 0.01 Hz in either state were excluded. Middle, Fold-change in overall firing rate across states. Units with a greater than 100-fold change were excluded. Right, Change in waveform amplitude across states. Spike amplitudes for each unit were measured on the channel with the largest peak-to-peak waveforms. Units with greater than 50 μV changes in peak-to-peak amplitude were excluded. (b) Fraction of cells considered stable under varying rate (left), rate-change (middle), and waveform amplitude (right) criteria. (c–d) Primary experimental results do not depend strongly on the choice of stability criteria. The percentage of cell-odor pairs significantly activated by odor in OB is always substantially lower under anesthesia than during awake trials despite varying the rate-change (c) or waveform (d) criteria. Stricter waveform stability criteria tend to enhance the effect. (e–h) As in (a–d) but for PCx.
Figure 1—figure supplement 3
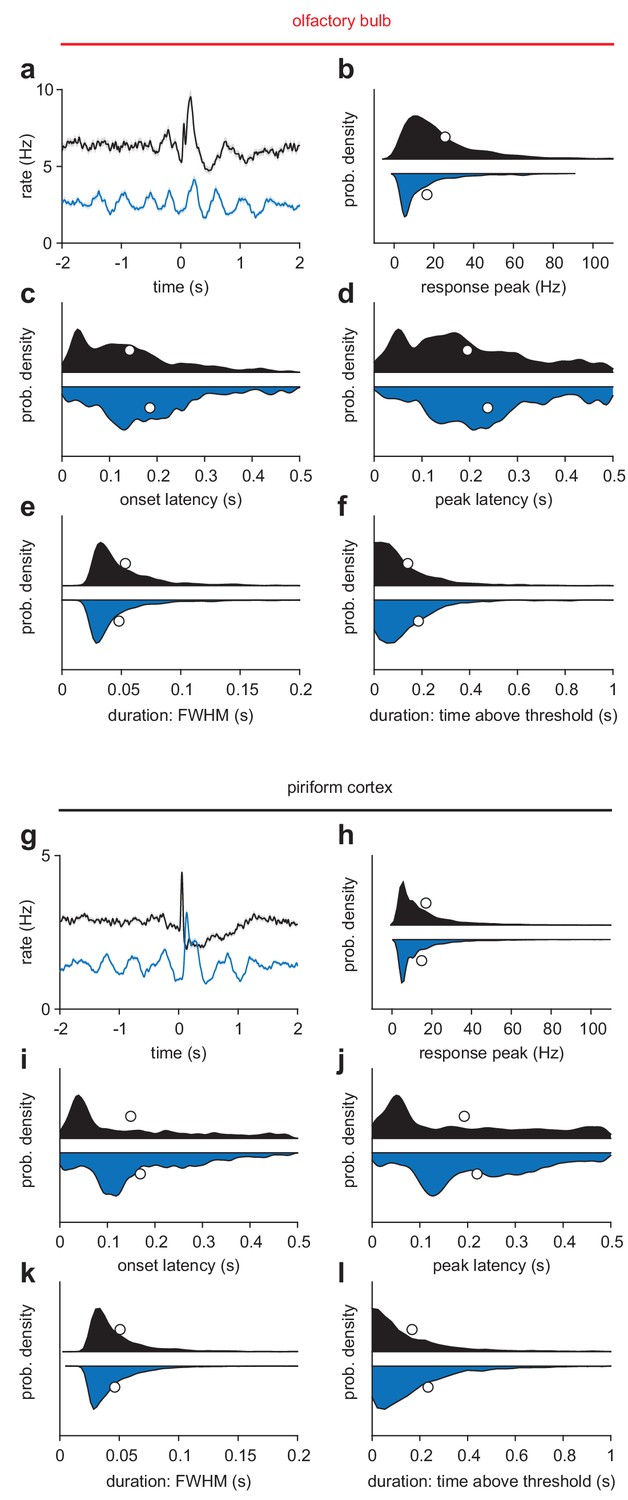
Odor response characteristics during awake and anesthetized trials.
(a) Average odor response for all OB cell-odor pairs during awake (black) or k/x (blue) trials (n = 1122 cell-odor pairs, mean ± sem). (b–f) Responses with any peak in the 500 ms following inhalation were identified and their response features characterized. Awake, n = 1059; K/X, n = 799 cell-odor pairs. (b) Response peak is the maximum of the cell-odor PSTH within 500 ms. (c) Onset latency is the latency to cross a threshold of 2.5 s.d. above the 3 s pre-odor baseline. (d) Peak latency is the time of the maximum of the cell-odor PSTH within 500 ms. (e) Response duration measured as full-width at half-maximum in the first 500 ms. (f) Response duration measures as time above a 2.5 s.d. threshold. This accounts for multiphasic responses that may have sharp initial peaks followed by later, lower amplitude rate increases. Awake responses tended to be larger and lower latency, with slightly wider peaks but shorter overall responses. (g–l) As in a-f, but for PCx.
Figure 1—figure supplement 4
Degraded OB decoding due to weaker odor-evoked responses.
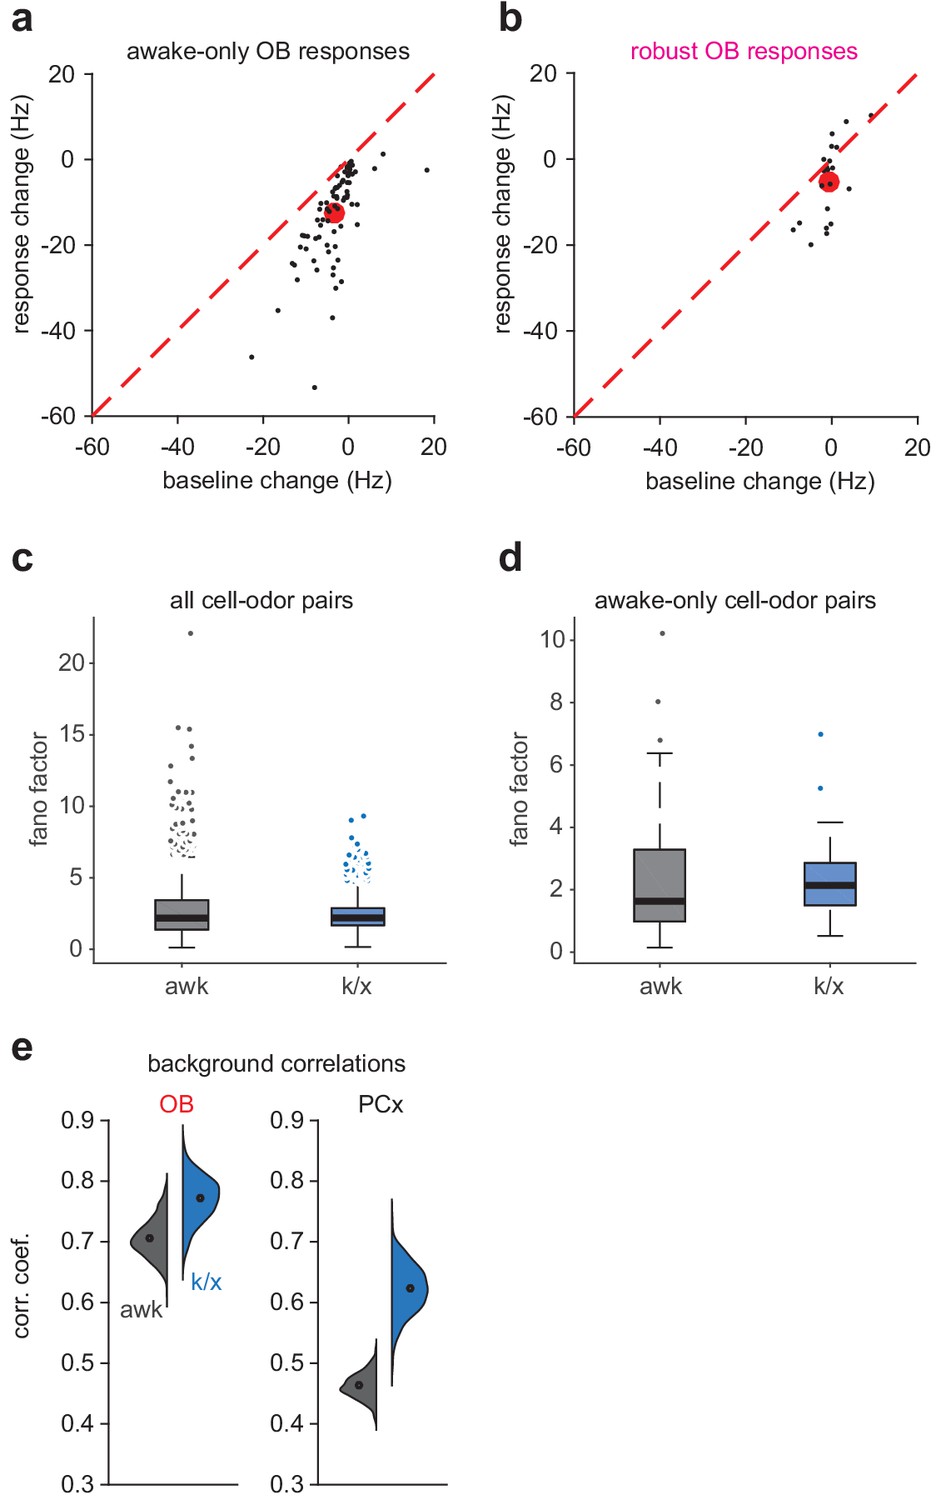
We evaluated three factors possibly contributing to degraded OB decoding under anesthesia: 1)Decreased sensitivity of OB cells to odors under anesthesia 2)Increased variability of OB responses under anesthesia 3)The presence of global background activity pattern under anesthesia (a-b) Change in response magnitude and change in baseline firing rate from awake to anesthetized trials for awake-only (c) or robust (d) OB cell-odor pairs. Black circles are cell-odor pairs. Red circles are means. Mean odor response decreases more strongly for awake-only responses and the decrease is not matched by a decrease in baseline rate. (c-d) Fano factor for odor evoked responses across all awake or anesthetized trials for all cell-odor pairs (e, aw, n = 1082, k/x, n = 785; Unpaired t-test: t(1865) = 3.35, p=8.34e-04) or awake-only cell-odor pairs (f, aw, n = 81, k/x, n = 69, Unpaired t-test: t(148) = 0.49, p=0.63). Fano factors are lower (all pairs) or not significantly changed (awake-only pairs) during anesthetized trials, excluding the possibility that increased variability explains loss of significant responses under anesthesia. (e) Distribution of correlation coefficients for population activity four sniffs prior to odor exposure in awake or k/x conditions. Background correlations increase to a greater extent in PCx than OB, contrasting with the greater degradation of OB decoding accuracy.
Figure 1—figure supplement 5
Trial-trial correlation changes after anesthesia reflect contributions of ‘background’ patterns and reduced reliability of OB odor responses.
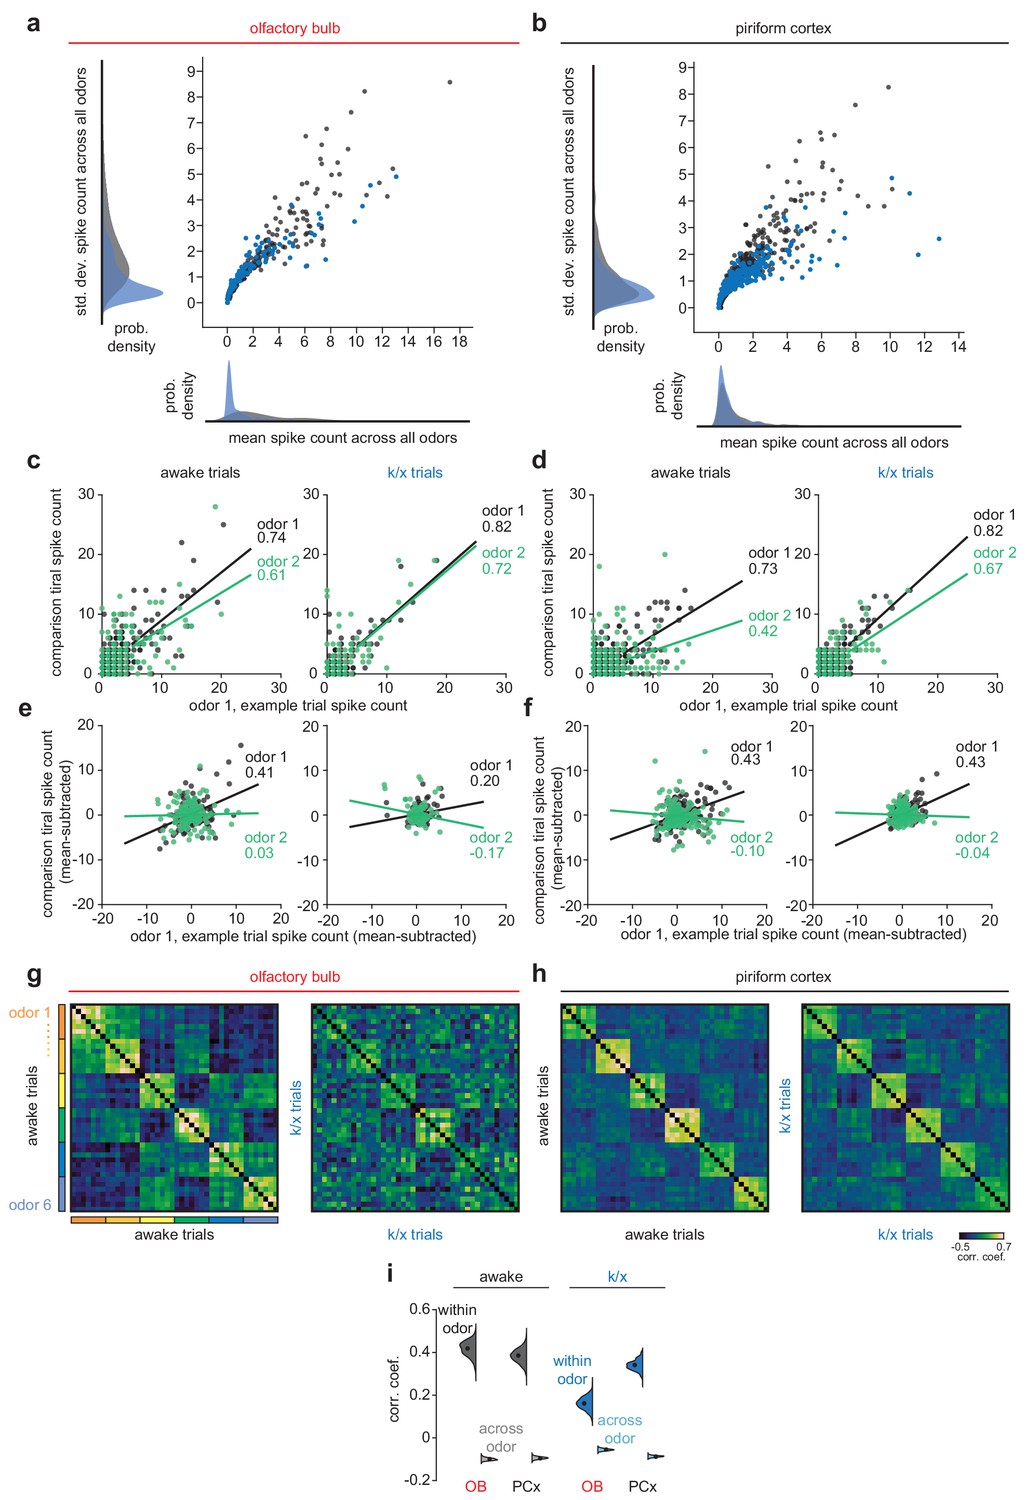
Increases in both within-odor and across-odor correlations observed in OB after anesthesia are not expected given a simple loss of OB responsivity. We therefore investigated the origins of increased OB correlations. Correlations could be driven by imposition of an odor-independent ‘background’ pattern that has a greater influence in anesthetized OB than awake OB or PCx in either state. (a–b) Scatterplot and histograms showing distributions of mean and standard deviation of spike counts across all odors in either state for OB (a) or PCx (b). Anesthetized OB (blue) has a large number of low-rate and low-s.d. responses, indicating a large portion of cells response weakly but very similarly to every trial of every odor. Including these responses in trial-trial comparisons can drive very large correlations within and across odors. (c–d) Illustration of trial-trial correlation calculation for one pair of within-odor trials (black) and one pair of across-odor trials (green) for raw spike counts without background subtraction in OB (c) and PCx (d). Correlation coefficients for these example trial-trial comparisons are indicated to the right of each linear fit line. Note small difference in within and across odor correlations in anesthetized OB. However, all correlations are large and positive, due to large numbers of consistently low-firing cells. (e–f) As in c-d, but for trial-trial comparisons after subtracting mean response across all odors within a state from each trial’s response. In this condition, across-odor correlations are often negative. (g–i) As in Figure 1j–l, but for background-subtracted population responses. After background subtraction, anesthetized OB tends to have weaker within-odor correlations than other conditions indicating reduced reliability of OB odor responses in this condition. Thus, after removing ‘background patterns’, OB responses remain degraded relative to PCx or awake OB responses.
Figure 1—figure supplement 6
Similar outcomes for simultaneously recorded PCx populations and pseudopopulations.
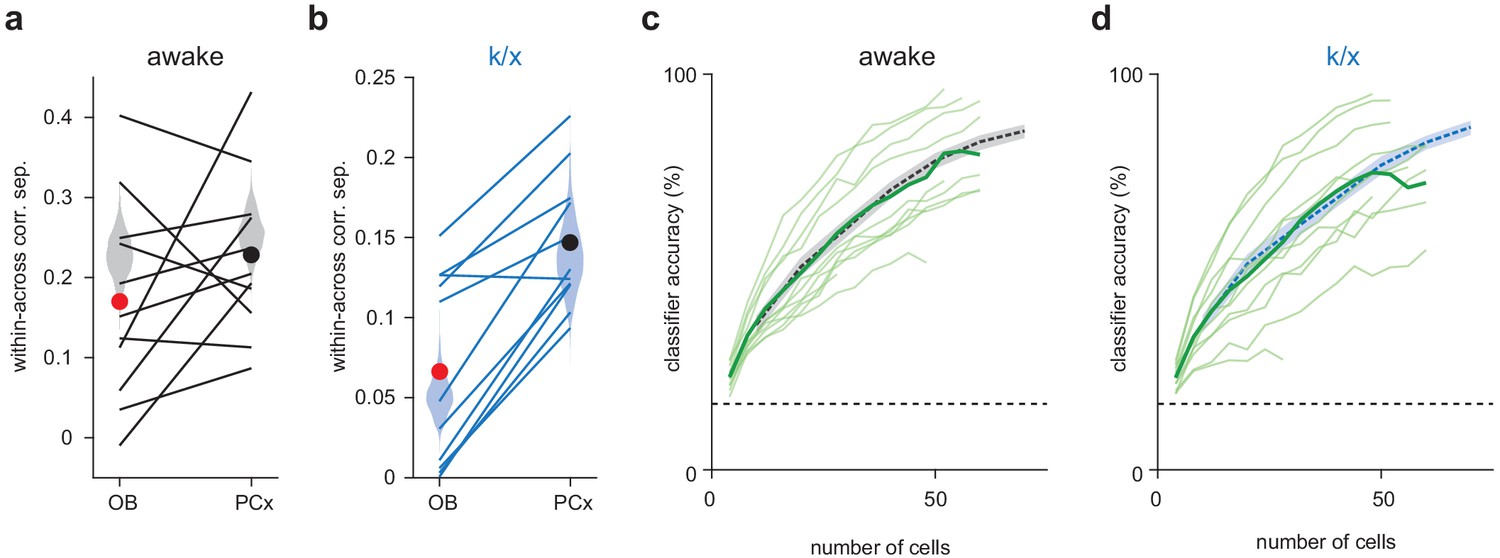
(a–b) Within-across odor population vector correlation difference for awake trials (a) or k/x trials (b) in OB and PCx. Each line is a separate simultaneous OB-PCx recording (n = 11). Circles show means for OB (red) and PCx (black). Pseudopopulation correlations measures from Figure 1 are shown as shaded violin plots for comparison. (c–d) Classifier accuracy for simultaneously recorded PCx populations up to 60 cells in awake (c) or k/x trials (d). Each light green line is a separate PCx recording. The average accuracy across recordings is shown as a bold green line. Classifier performance from Figure 1 is shown as a dashed line for comparison.
Figure 1—figure supplement 7
Background activity or non-specific odor responses do not significantly impair OB decoding under k/x anesthesia.
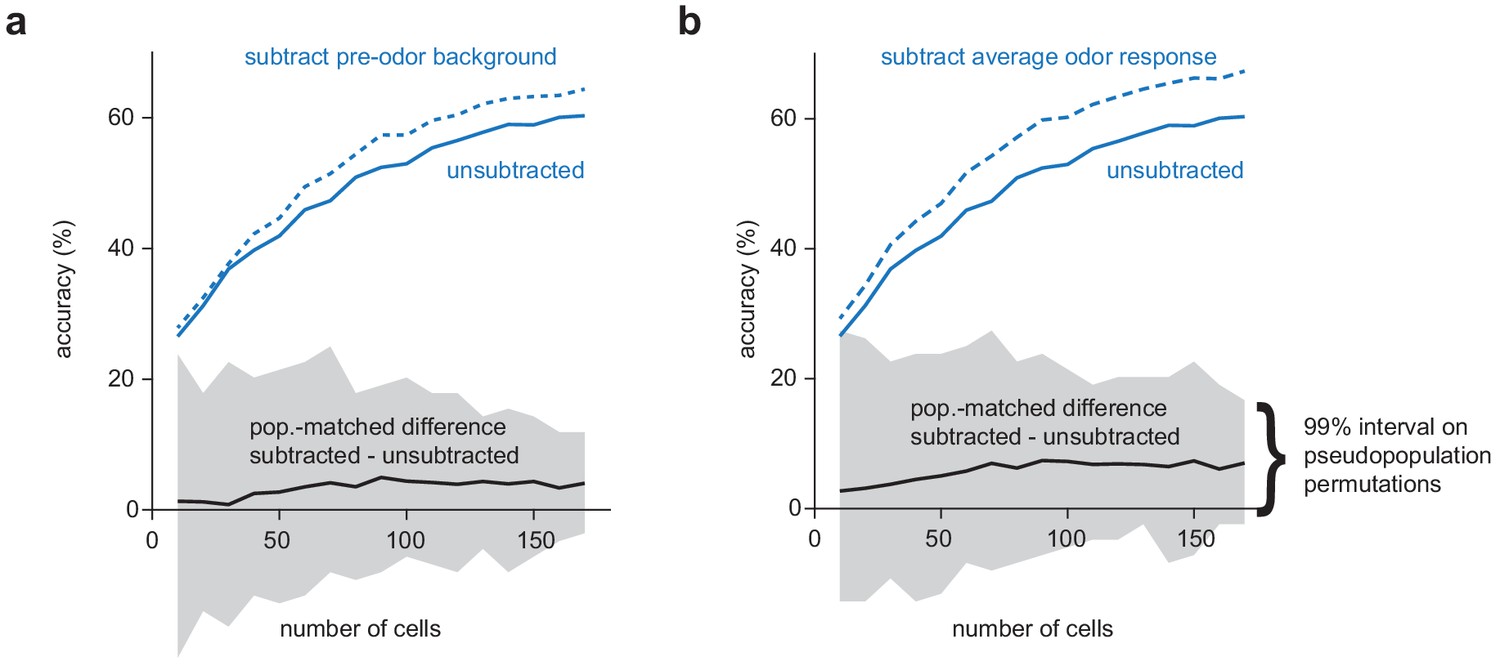
(a) Odor classification accuracy as a function of pseudopopulation size in OB for anesthetized trials using a multiclass linear support vector machine with raw spike counts (solid blue line) or with ‘background activity’ subtracted (dashed blue line). For each permutation, a random pseudopopulation of n cells was selected and differences in classification accuracy using the raw and background-subtracted responses was determined. The solid black line indicates the mean difference across permutations and grey shading indicates 99% confidence intervals across permutations. (b) As in a but with average response across all odors subtracted instead of background activity.
Figure 2 with 1 supplement
PCx stabilizes odor representations across activity regimes.
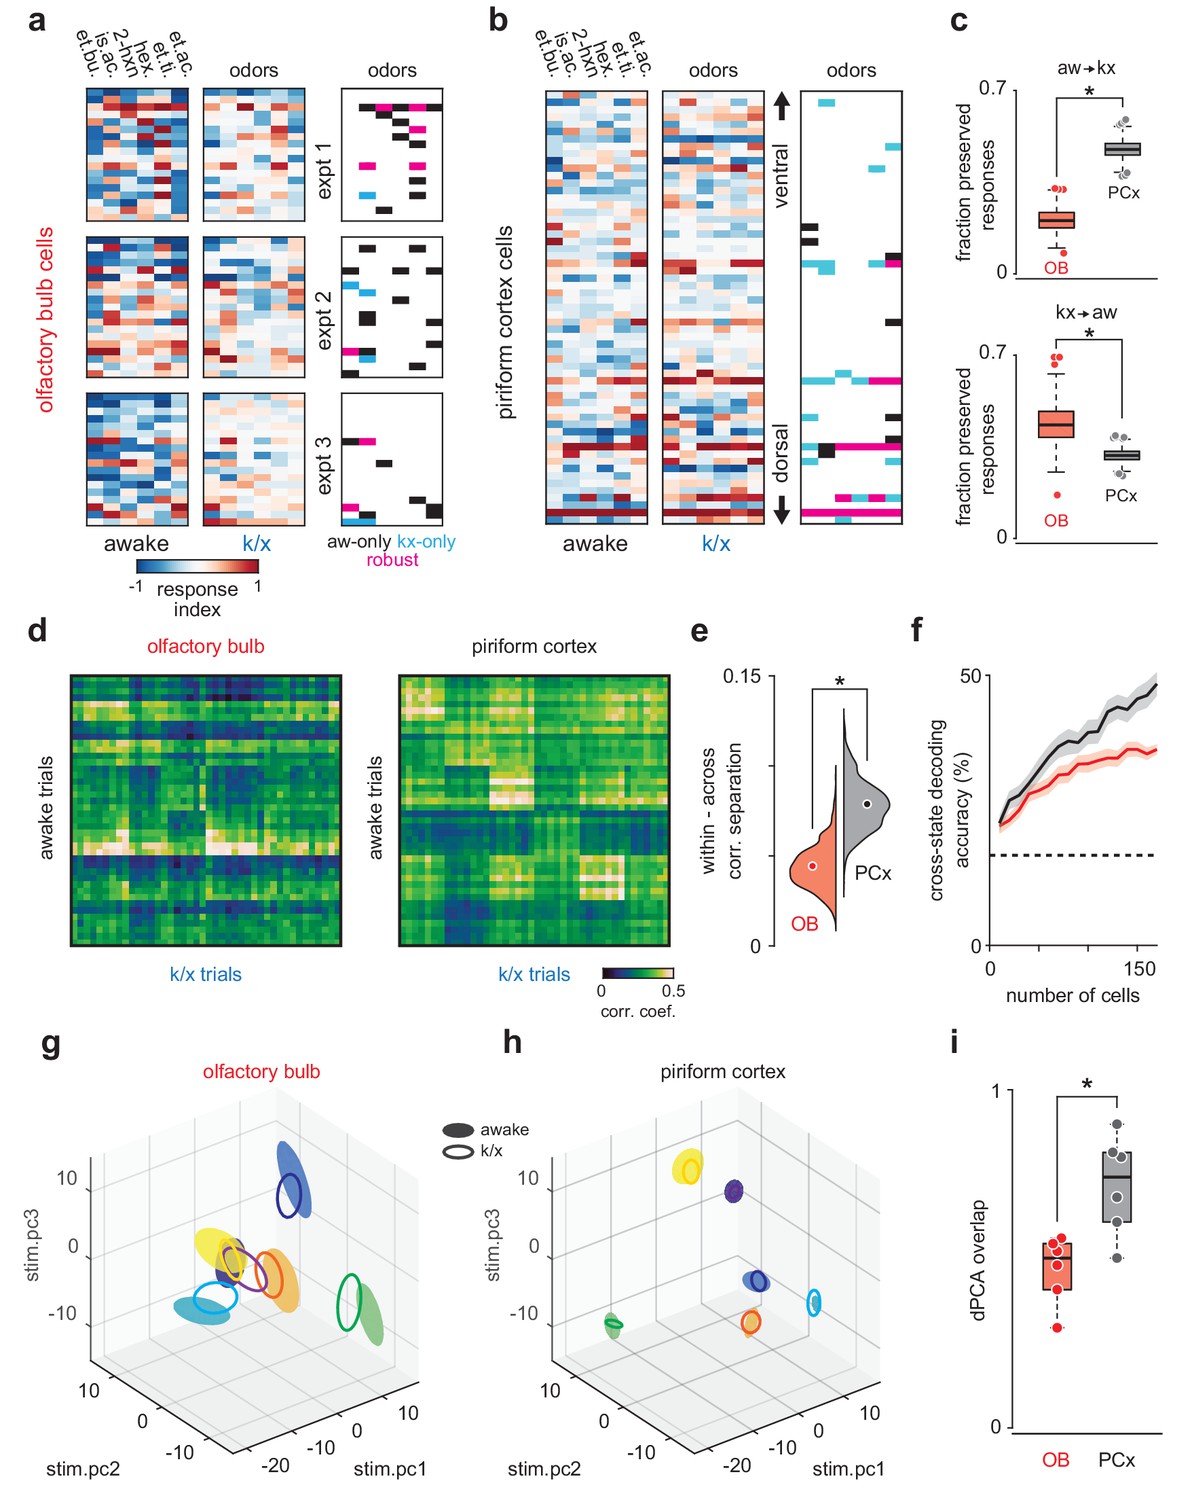
(a–b) Example population responses to six odors for three OB (a) and one PCx recordings (b). The response index indicates the reliability of the difference between pre-odor and odor-evoked spiking (i.e. auROC*2–1). Awake-only (black), k/x-only (cyan), and robust cell-odor pairs (magenta), which were activated in both states ('activated' = p<0.05 rank-sum test), are indicated at right. PCx cells are sorted by their dorsal-ventral location. Note more robust PCx responses in deeper, (i.e. more dorsal) layer II. (c) Top, the fraction of significant awake cell-odor pair responses that are preserved under anesthesia in OB (n = 187 cells, 12 experiments) and PCx (n = 640 cells, 11 experiments). Bottom, the fraction of significant cell-odor pair responses under anesthesia that are observed in awake condition. Asterisks indicate p<0.05 on bootstrap difference test (aw to k/x: p<0.001; k/x to aw: p=0.023). (d) Cross-state trial-by-trial pseudopopulation correlation matrices sorted by odor within OB and PCx illustrate the similarity between awake and anesthetized population responses. The horizontal bands in these matrices indicate awake trials that had consistently high (light bands) or consistently low correlations (dark bands) with k/x responses regardless of odor. Typically, dark bands occur on awake trials with higher firing rates. Note that for these analyses, we used trials 6–13, and the regularity of these bands, especially in OB, reflects the progressive adaptation of responses, which are described in detail in Figure 6e. Separation (mean within-odor correlations - mean across-odor correlations) of cross-state odor representations in OB and PCx over 1000 bootstrap iterations. Asterisks indicate p<0.05 in bootstrap difference test (OB vs PCx, p<0.001). Means are shown as filled circles. (f) Cross-state decoding accuracy (trained on awake trials, tested on k/x trials) in OB and PCx. Mean ± 95% bootstrapped confidence intervals. (g) OB pseudopopulation activity projected onto the first three stimulus-dependent demixed PCA components and shown as mean ± 1 s.d. ellipsoids across trials of the same odor. Different colors correspond to different odors. Filled ellipsoids are awake responses, unfilled ellipsoids are anesthetized responses. (h) As in g, but for PCx. Note both the overall larger separation between odors in either state and the greater overlap of same-odor responses across states. (i) Overlap between awake and k/x trial response distributions projected onto their first three stimulus-dependent components in OB (red) and PCx (black). Dots show overlap scores for individual odors. Overlap is calculated using Matusita’s overlap measure (see Materials and methods). Unpaired t-test, n = 6 odors, t(10) = −3.41, p=0.007.
Figure 2—figure supplement 1
State-dependent low-dimensional representations in OB and PCx.
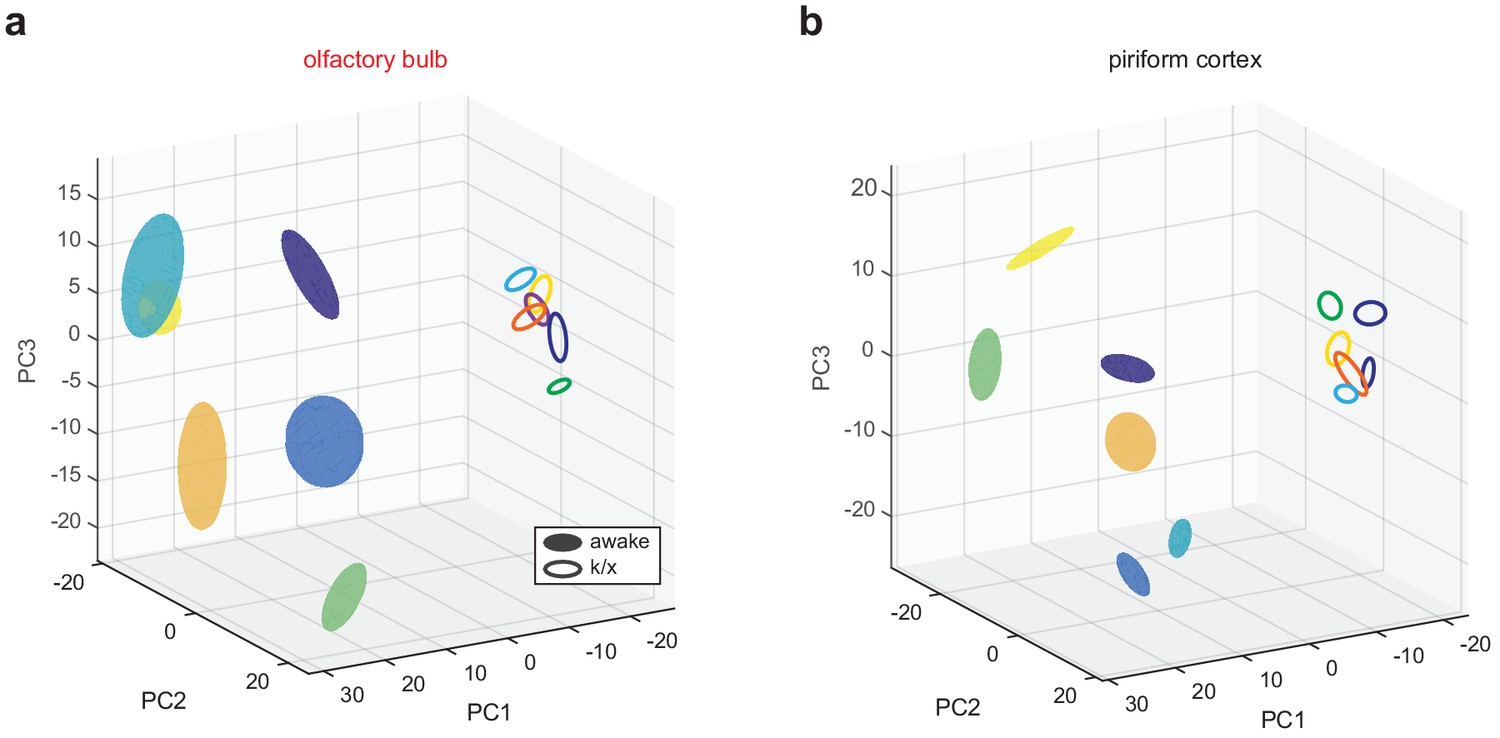
(a) OB pseudopopulation responses to six different odors (different colors) recorded in awake filled spheres) and anesthetized states (open spheres) projected onto the first three principal components. Spheres are centered on response mean and describe ±1 s.d. ellipsoids. (b) As in a, but for PCx.
Figure 3
Robust PCx representations derive from short-latency OB responses.
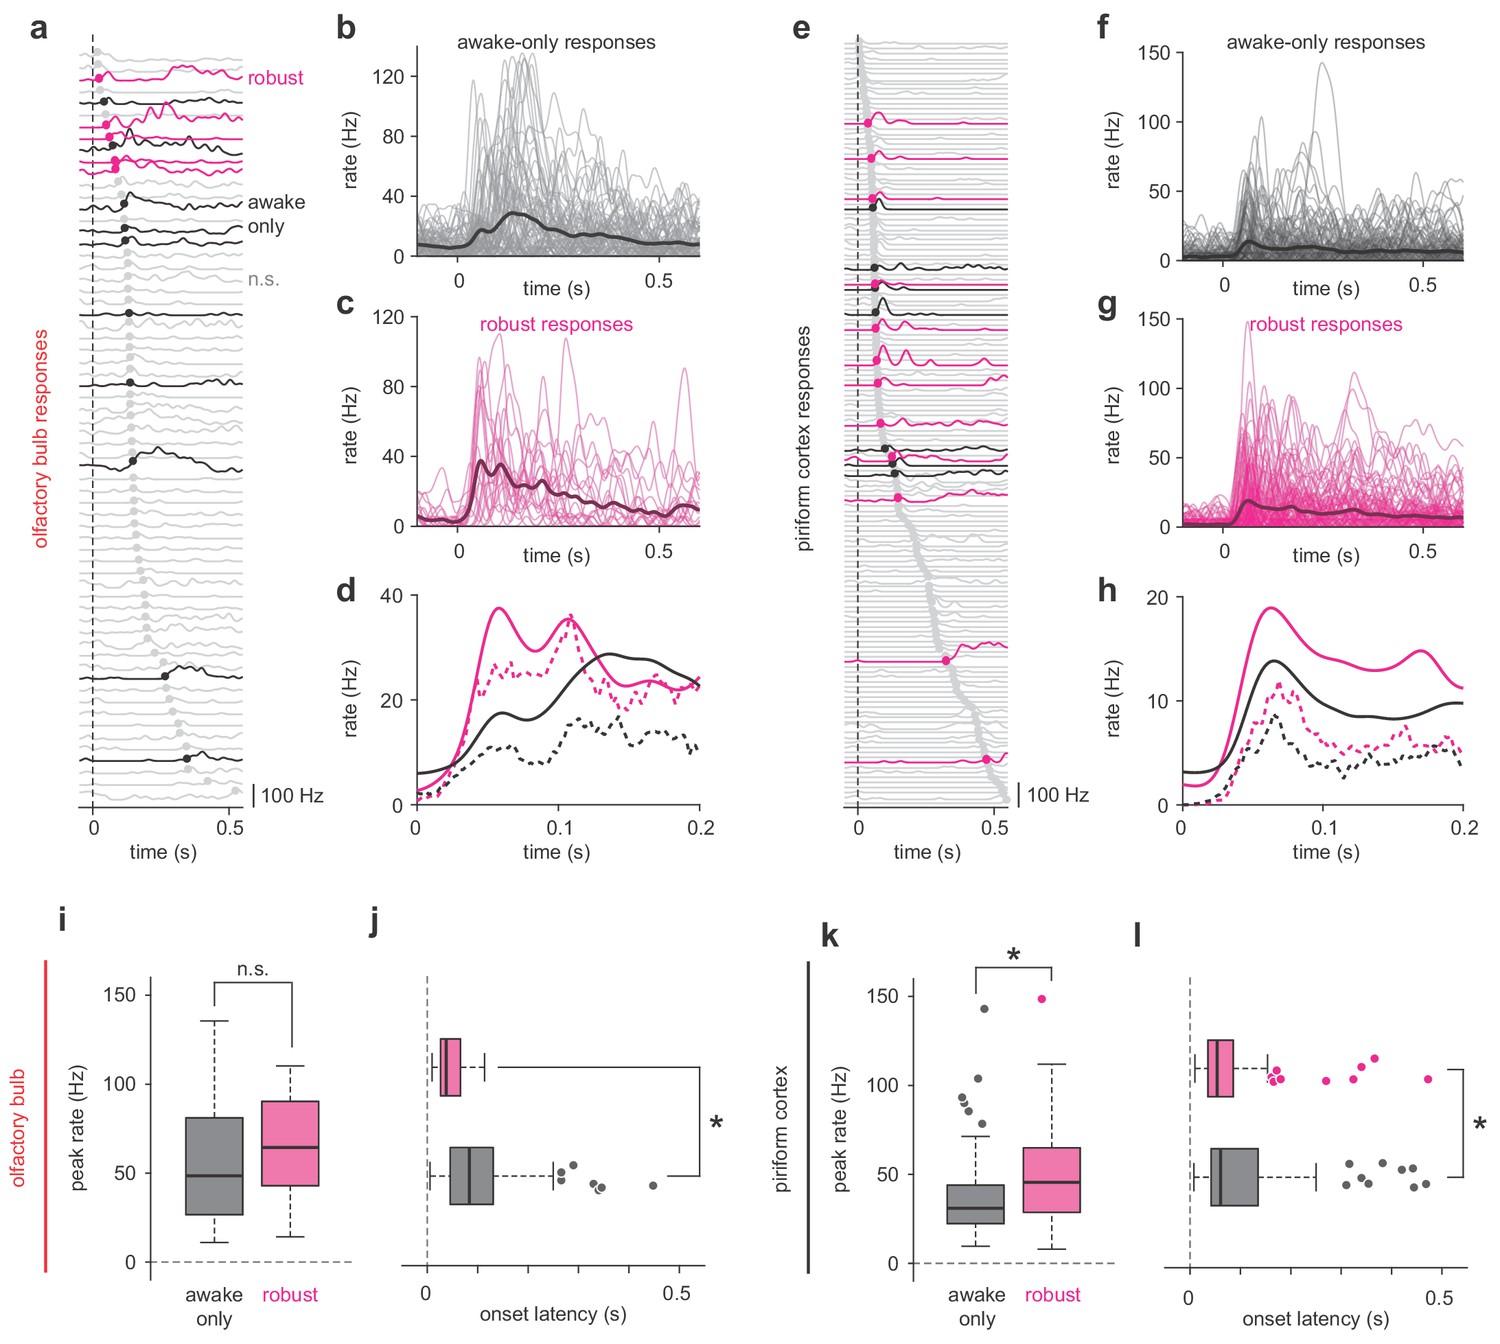
(a,e) All cell-odor pair responses for example simultaneously recorded OB (a) and PCx (e) populations sorted by onset latency determined by 2.5 st. dev. threshold crossing. Latencies are marked with filled circles. Robust, awake-only, and non-significant responses are magenta, black, and gray, respectively. (b–c) Overlay plots of all OB awake-only responses (b) or robust responses (c). The bold line is the mean response. (d) Mean (solid line) and median (dashed line) awake-only (black) and robust (magenta) OB responses. (f–h) As in b-d, but for PCx. (i–j) Peak firing rates (i) and onset latencies (j) for robust vs awake-only responses in OB. Boxes indicate quartiles and whiskers indicate ± 2.7 st. dev. from mean. Data points outside this range are shown as circles. Asterisks indicate p<0.05 in unpaired t-test. n = 81 awake-only OB cell-odor pairs and 21 robust OB cell-odor pairs. Peak: t(100) = −0.82, p=0.42; Latency: t(100) = 3.06, p=0.003. (k–l) As in i-j but for PCx. n = 125 awake-only PCx cells and 116 robust PCx cells. Peak: t(239) = −4.49, p=1.12e-5; Latency: t(236) = 2.47, p=0.01.
Figure 4 with 3 supplements
Pattern recovery requires recurrent circuits.
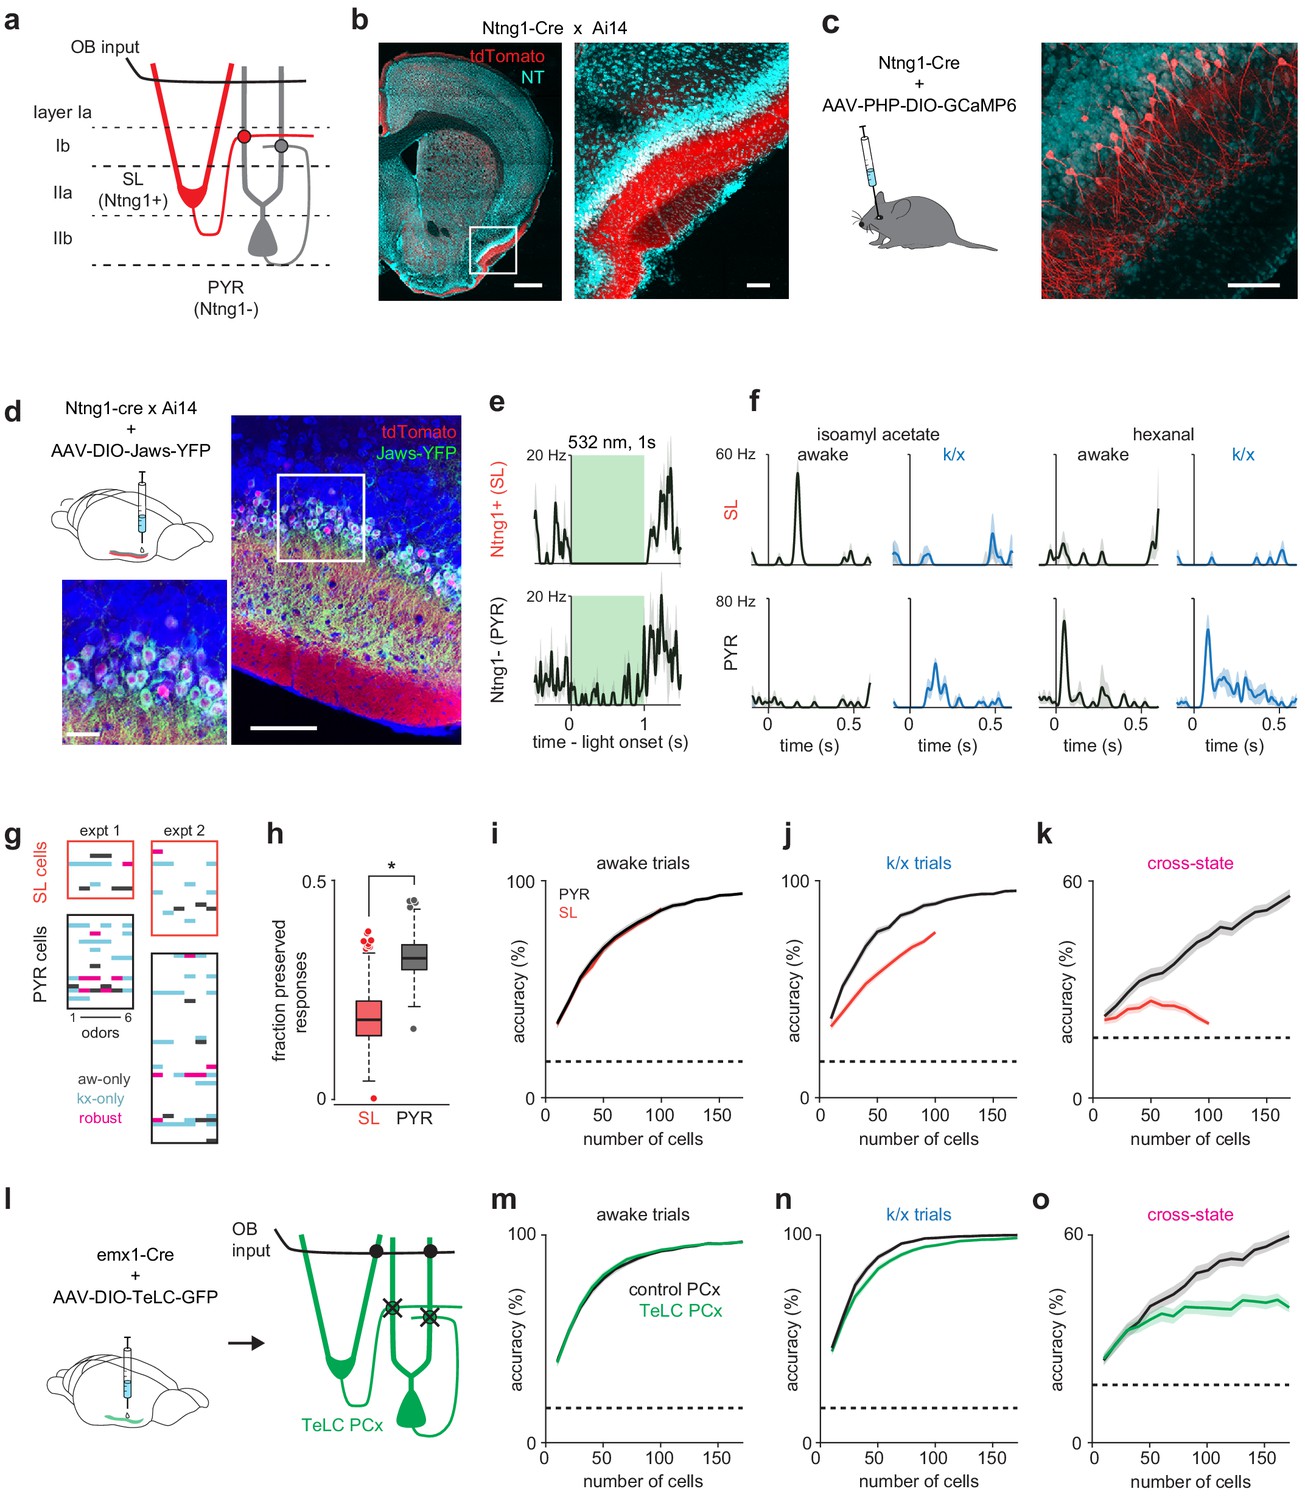
(a) Schematic of inputs to excitatory cell-types in PCx. Semilunar cells only receive OB input; pyramidal cells receive OB and recurrent collateral inputs. (b–c) Selective expression in PCx semilunar cells using the Ntng1-Cre driver line. (b) Strong expression of Cre-dependent tdTomato in PCx layer IIa of Ntng1-Cre X Ai14 mice. Scale bars: 500 μm and 100 μm. (c) Sparse Cre-dependent GCaMP6 expression shows Ntng1+ cells restricted to superficial layer II (i.e. layer IIa) and lacking basal dendrites. Scale bar: 100 μm. (d) Identifying Ntng1+ (semilunar, SL) and Ntng1- (pyramidal, PYR) cells in vivo using optogenetic inhibition. Injection of AAV expressing Cre-dependent Jaws in anterior piriform cortex restricts expression to cells with semilunar localization and morphologies. Scale bars: 100 μm and 20 μm. (e) Simultaneously recorded example cells exhibiting unambiguous suppression (top) or residual spiking (bottom) in response to 1 s, 532 nm light pulses. Traces show mean ± SEM responses over 40 laser pulses. Optogenetic tagging and unit stability criteria identified 108 SL and 234 PYR cells in 12 experiments from seven mice. (f) Odor responses during awake and k/x trials for example SL (top) and PYR cells (bottom). (g) State-specific (black, awake-only; cyan k/x only) and robust (magenta) responses in simultaneously recorded populations of SL and PYR cells from two example experiments. (h) The fraction of significant awake cell-odor pair responses that are preserved under anesthesia in SL and PYR. Asterisk indicates p<0.05 on bootstrap difference test (p=0.036). (i–j) Odor classification accuracy as a function of pseudopopulation size using SL (red) and PYR (black) cells in awake (i) and anesthetized (j) states. Mean ± 95% bootstrapped confidence intervals. (k) Cross-state decoding accuracy using SL (red) and PYR (black) cells. Mean ± 95% bootstrapped confidence intervals. (l) Strategy for disabling recurrent circuits in PCx. Expression of tetanus toxin in all PCx excitatory cells disrupts recurrent connectivity. (m–n) Odor classification accuracy as a function of pseudopopulation size in TeLC-infected (green) and contralateral control (black) PCx in awake (m) and anesthetized (n) states. Mean ± 95% bootstrapped confidence intervals. Pseudopopulations were built from 241 cells recorded in the control hemisphere in 4 experiments with 4 mice and 214 cells from the TeLC hemisphere in 6 experiments with five mice. (o) Cross-state decoding accuracy in TeLC- (green) and control (black) PCx. Mean ±95% bootstrapped confidence intervals.
Figure 4—figure supplement 1
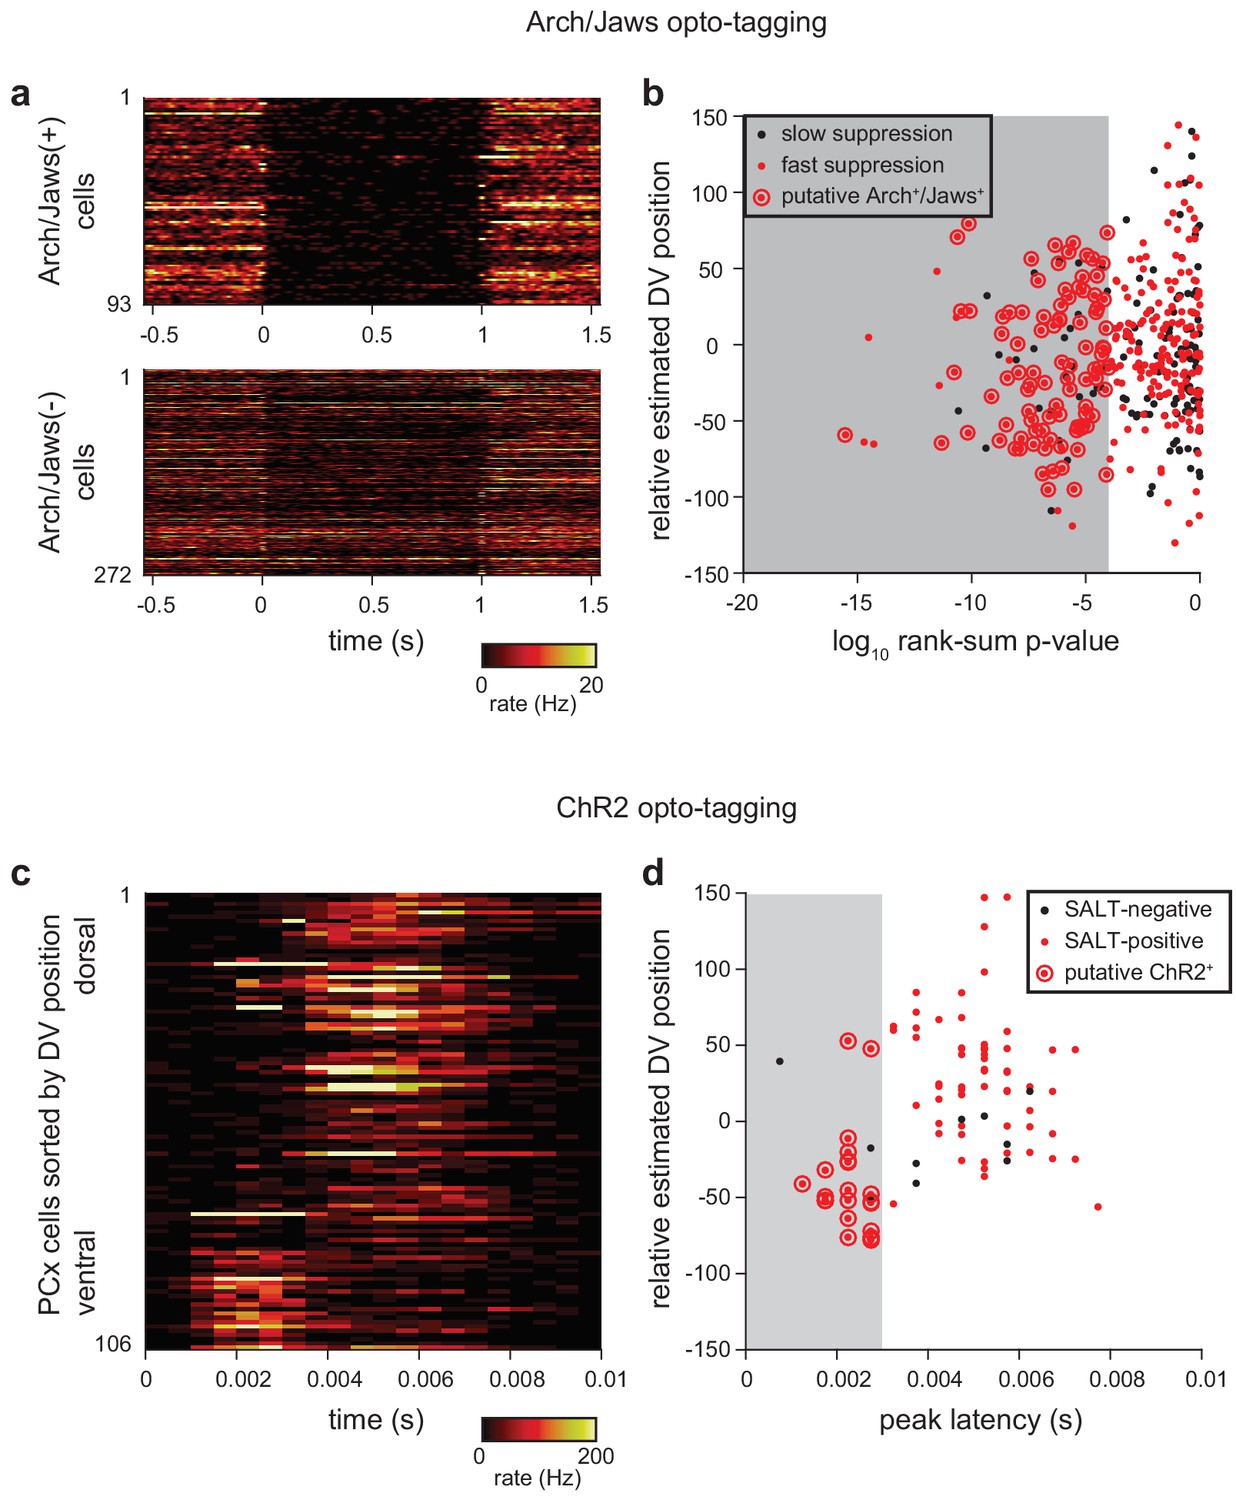
Criteria for identifying opto-tagged Ntng1+ cells.
(a) Heatmaps showing trial-averaged response to 20, 1 s laser pulses in presumptive Arch+/Jaws+ (top) and Arch-/Jaws- (bottom). Arch or Jaws-expressing cells show rapid onset and deep suppression during exposure to 532 nm or 640 nm light, respectively. (b) Two criteria were applied to identify Arch+/Jaws+ cells: 1) p<0.0001 in rank-sum test of spiking in the 1 s preceding and during laser stimulation, 2) median last-spike latency during laser pulse <0.01 ms (shown as red dots). Additionally, cells with overall firing rates < 0.175 Hz or a peak-trough time <0.35 ms in their average waveform were excluded from classification either as Arch+/Jaws+ or Arch-/Jaws- cells. Arch+/Jaws+ cells (red dots circled in red) identified with these criteria were subtly shifted toward more superficial recording locations compared to the total recorded population. (c) Two experiments (out of 12) used excitation with ChR2 for opto-tagging. Heatmaps show trial-averaged responses for all recorded cells to ~200, 1 ms pulses of 473 nm light, delivered at 4 Hz. Cells are sorted within heatmap by estimated DV position. ChR2+ cells show rapid and reliable stimulus-locked spiking. (d) Two criteria were applied to identify ChR2+ cells: (1) p-value<0.001 in Stimulus-Associated spike Latency Test (see Materials and methods), (2) latency-to-peak response in PSTH <0.003 ms. Cells with a peak-trough time <0.35 in their average waveform were excluded from classification as ChR2+ or ChR2-. ChR2+ cells (red dots circled in red) tended toward more superficial recording locations compared to the total recorded population.
Figure 4—figure supplement 2

Across-experiment variability in response preservation depends on preserved spontaneous activity.
Fraction of significant awake PCx cell-odor pair responses that are preserved under anesthesia vs. mean change in spontaneous firing rate in Emx1-cre recordings (black, n = 11 experiments) and NTNG1-cre recordings (blue n = 14 experiments). Dashed lines are linear fits. Solid lines are mean ± s.e.m. All recorded PCx cells are considered in this analysis, rather than dividing SL and PYR responses. Spontaneous rates were more strongly affected by anesthesia in some NTNG1 experiments, accompanied by a lower rate of response preservation.
Figure 4—figure supplement 3

Decoding from TeLC-ipsilateral and contralateral OB populations.
(a–b) Odor classification accuracy as a function of pseudopopulation size in OB ipsilateral (green) or contralateral (black) to TeLC-infected PCx in awake (a) and anesthetized (b) states. Mean ±95% bootstrapped confidence intervals. (c) Cross-state decoding accuracy in TeLC-ipsilateral (green) or contralateral (black) OB. Mean ±95% bootstrapped confidence intervals.
Figure 5
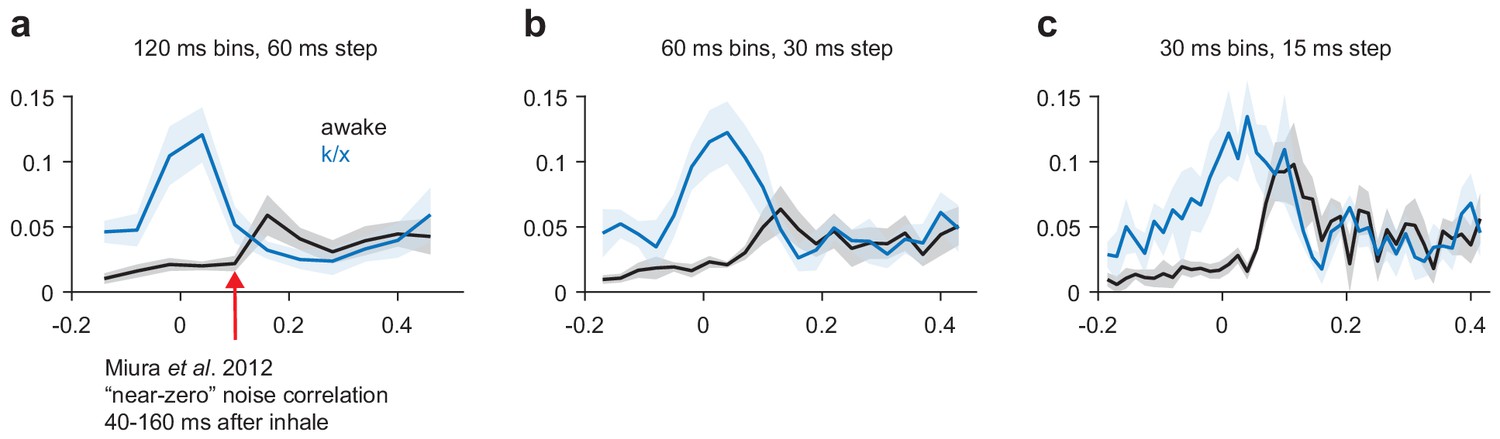
Noise correlations in awake and anesthetized PCx.
(a–c) Average noise correlations in a sliding window surrounding odor inhalation for all awake (black) or k/x (blue) odor trials using a 120 ms (a), 60 ms (b) or 30 ms (c) bin size for spike counts. Mean ± s.e.m, n = 11 experiments.
Figure 6 with 1 supplement
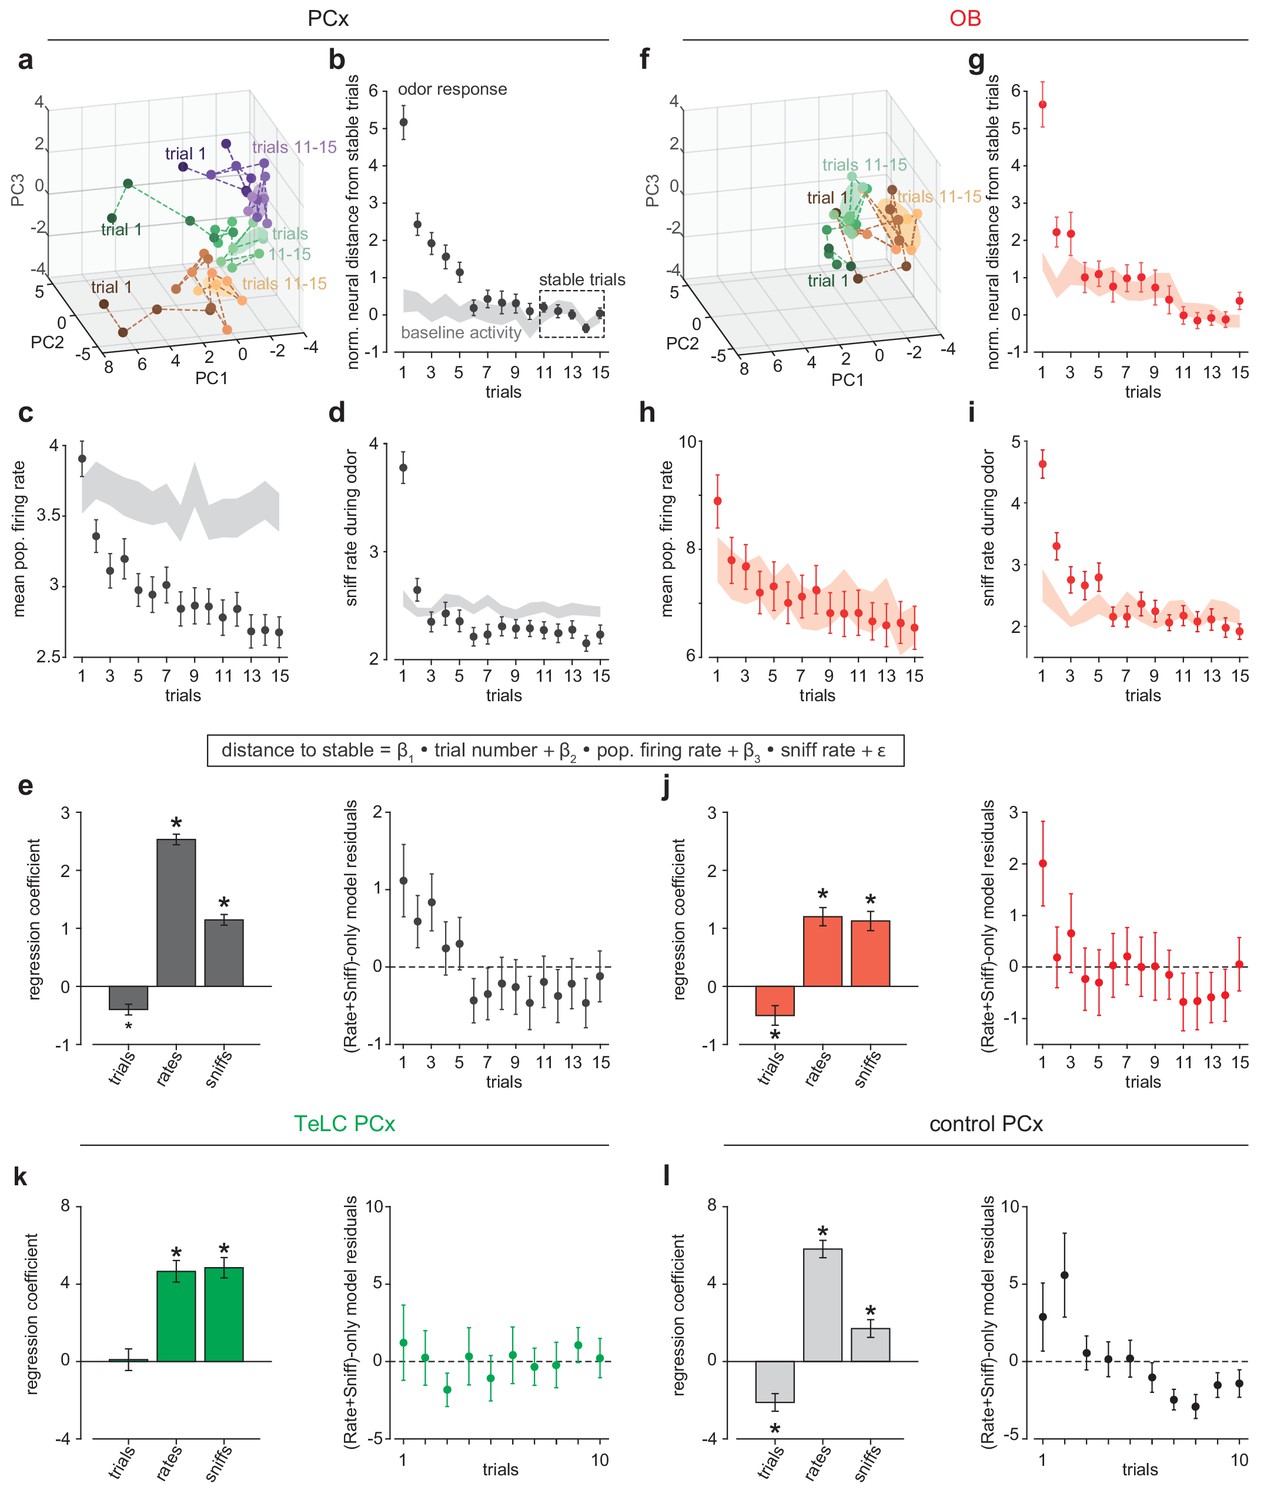
Rapid pattern formation in PCx population responses.
(a, f) PCA trajectories for the first 15 presentations of three odors in an example simultaneous PCx (a) and OB (f) recording. The third odor in OB data occupied overlapping PC space and was omitted for visual clarity. The area occupied during the designated ‘stable’ trials is shown as mean ± 1 s.d. ellipsoids. Different colors correspond to different odors. (b, g) Average Euclidean distance from trial population vectors to stable trials normalized by the average distance between stable trials (b, PCx: n = 132 experiment-odor pairs, g, OB: n = 45 experiment-odor pairs, mean ± SEM). The shaded area shows distances computed using pre-odor baseline activity (mean ± SEM). (c, h) Average population firing rates during odor response (mean ± SEM) or pre-odor baseline (shaded area, mean ± SEM) for PCx (c) or OB (h). (d, i) Average sniffing rates during odor response (mean ± SEM) or pre-odor baseline (shaded area, mean ± SEM) for PCx recordings (d) and OB recordings (i). (e) Left, multiple linear regression coefficients for effects of sniff rate, population firing rate, and trial number on population distance to stable in PCx (mean ± SEM). All main and interaction coefficients are significant (p<0.05). Right, Residuals plot of multiple linear regression on distance-to-stable fit with only sniff rate and population firing rate predictors, showing decreasing distance with trial number independent of these predictors. (j) As in e, but for OB recordings. (k, l) As in e, but for TeLC-infected PCx (k, n = 36 experiment-odor pairs) and contralateral control PCx (l, n = 24 experiment-odor pairs). Distance changes are fully explained by sniff rate and overall population firing rate in TeLC-PCx, but depend on trial number in control PCx.
Figure 6—figure supplement 1
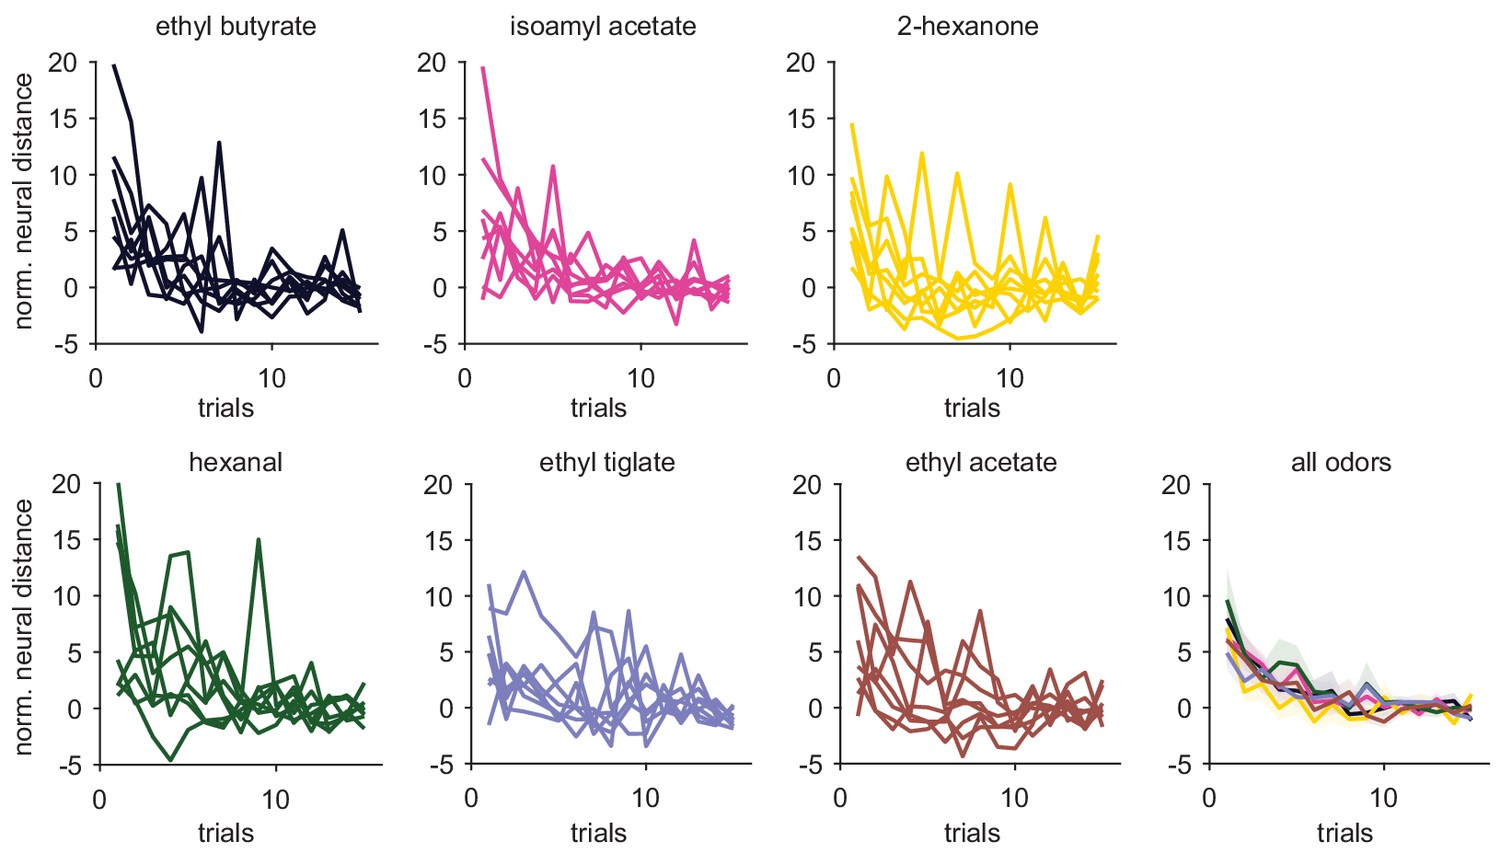
Similar trial-trial population response stabilization across odors.
Normalized neural distance from stable (as in Figure 5) for each PCx experiment-odor pair across trials. Mean ± s.e.m stabilization curves for all odors are shown in the bottom right. Stabilization curves were similar across odors.
Figure 7

Short-term pattern stability in recurrently-connected PCx cells.
(a–c) Average cross-time decoding accuracy for pseudopopulations of 200 cells recorded from control (b) or TeLC-infected (c) PCx. Responses were aligned to the first sniff after odor offset. (a) Decoding accuracy for training and testing on identical time bin at increasing times from odor offset for control (black) and TeLC- (green) PCx. Mean ± 95% bootstrapped confidence intervals. (d) Mean decoding accuracy at increasing temporal distance between the training bin (t = 0) and test bin in control (black) and TeLC- (green) PCx. These data are reflected in the rightmost dashed vertical lines in a and b. Mean ± 95% bootstrapped confidence intervals. (e–h) As in a-d, but for pseudopopulations of 100 SLs (f, red) or PYRs (g, black). (i–l) As in a-d, but for pseudopopulations of 170 OB cells (j, red) or PCx cells (k, black).
Additional files
Download links
A two-part list of links to download the article, or parts of the article, in various formats.
Downloads (link to download the article as PDF)
Open citations (links to open the citations from this article in various online reference manager services)
Cite this article (links to download the citations from this article in formats compatible with various reference manager tools)
Recurrent circuitry is required to stabilize piriform cortex odor representations across brain states
eLife 9:e53125.
https://doi.org/10.7554/eLife.53125


