A single-parasite transcriptional atlas of Toxoplasma Gondii reveals novel control of antigen expression
- Department of Bioengineering, Stanford University, United States
- Department of Microbiology and Immunology, Stanford University School of Medicine, United States
- Department of Applied Physics, Stanford University, United States
- Chan Zuckerberg Biohub, United States
Figures
Figure 1 with 2 supplements
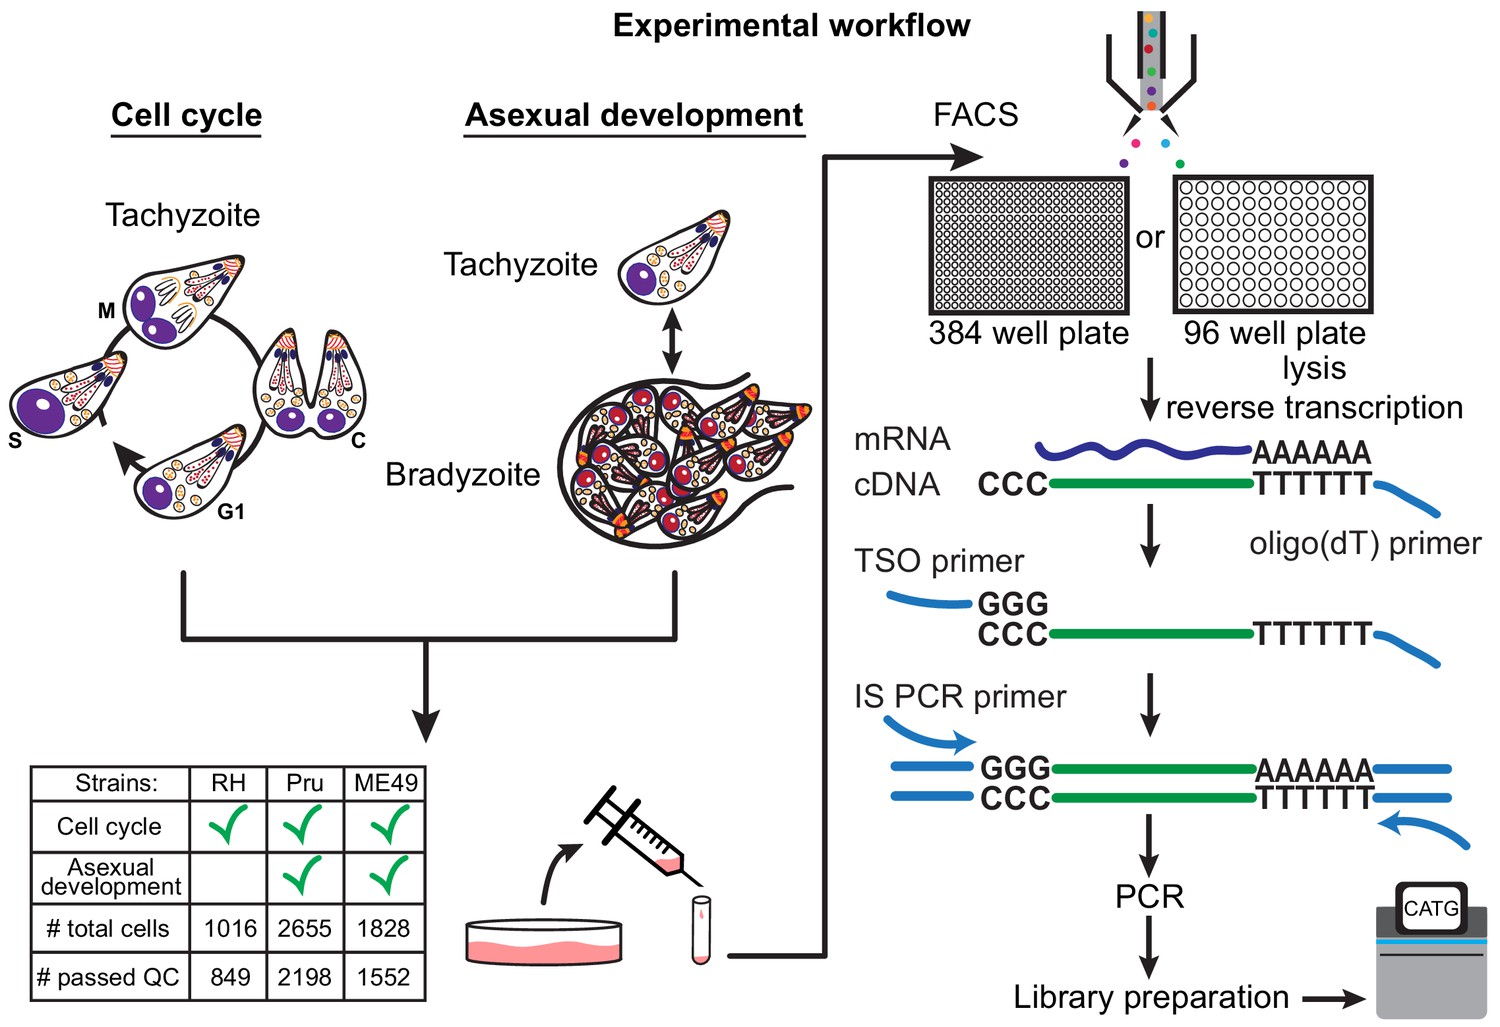
Schematic of single-cell RNA-sequencing (scRNA-seq) based on a modified Smart-seq2 protocol for 384-well or 96-well plate.
A table of strain types with the number of sequenced cells and cells that passed quality checking (QC) is provided.
Figure 1—figure supplement 1
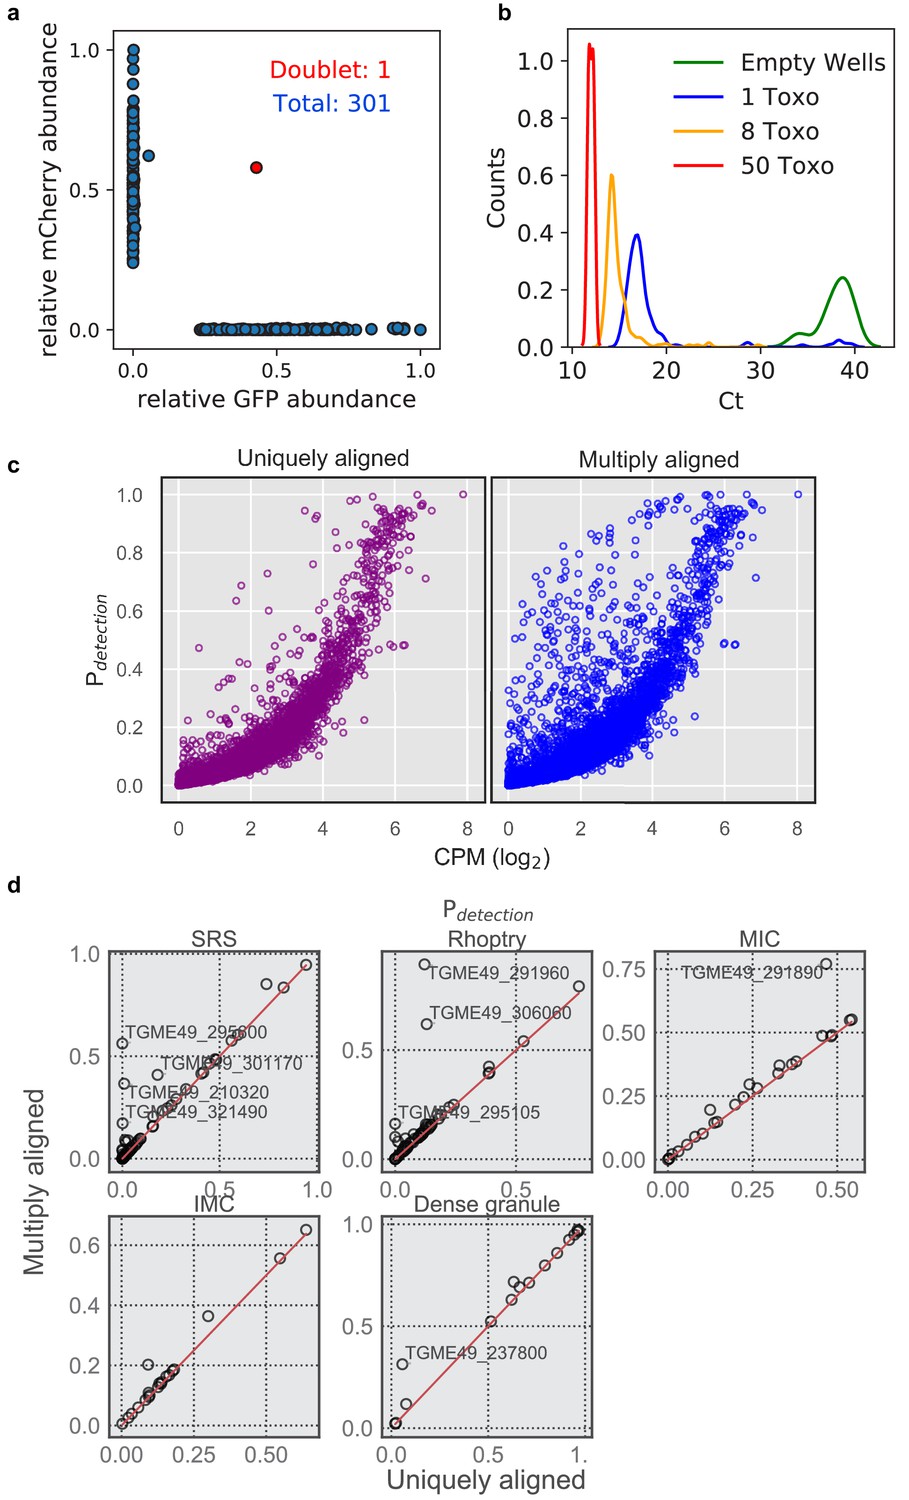
Technical benchmark of extracellular Toxoplasma FACS and modified gene alignment.
(a) qPCR measurement of mRNA expression in 301 transgenic Toxoplasma cells expressing GFP or mCherry mixed at 1:1 ratio. (b) qPCR Ct values of abundant surface protein, SAG1, measured for 374 wells with zero, one, eight, or fifty sorted parasites at 16, 176, 176, and six replicates, respectively. (c) Comparison between ‘uniquely aligned’ (default htseq-count settings) and ‘multiply aligned’ (count each feature with equal read alignment score divided by the number of aligned reads) in the detection rate (>2 read count) in Type I strain, RH. (d) A more detailed comparison of detection rate of several parasite-specific gene sets in Pru (uninduced + induced). Genes that are detected more frequently in ‘multiply aligned’ setting are annotated with their gene IDs in the plot.
Figure 1—figure supplement 2
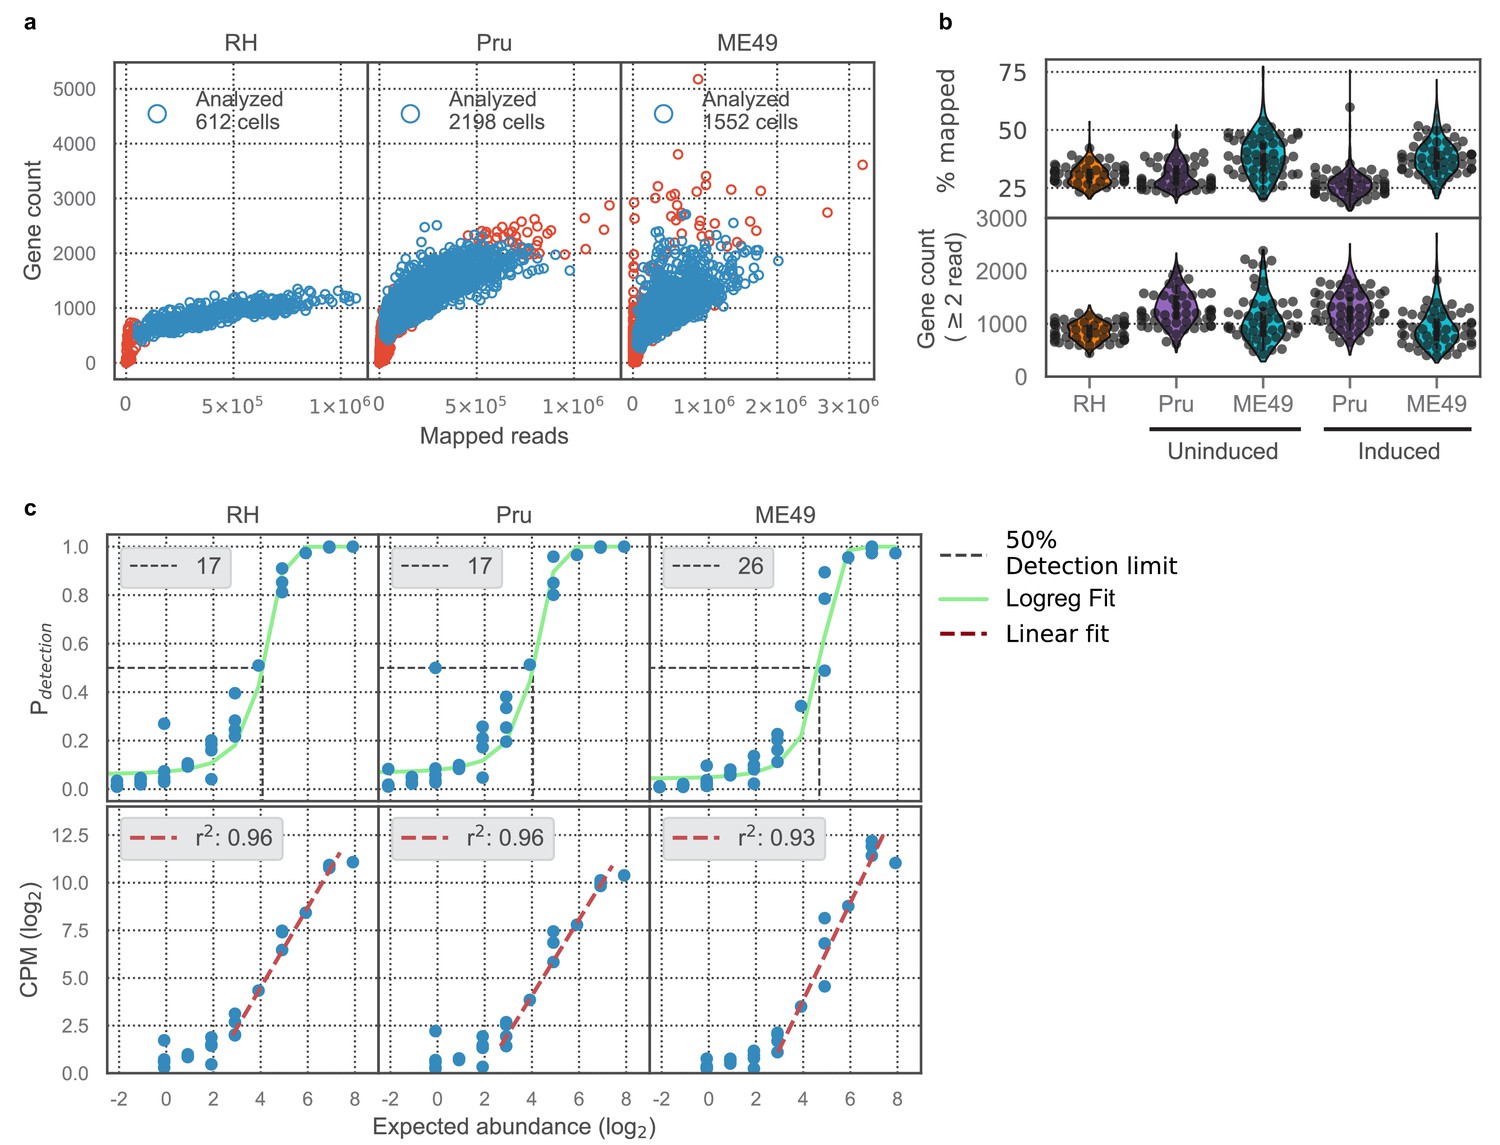
Technical benchmark of scRNA-seq cell recovery, measurement sensitivity, and accuracy.
(a) Comparison of gene counts (>2 read counts) and total mapped read counts for RH, Pru, and ME49 from left to right, respectively. Text in top left corner indicates the number of parasites that passed cell filtering and were analyzed (blue open circles). (b) Top panel: distributions of percentage of reads in the analyzed cells that aligned to Toxoplasma genome references. Bottom panel: distributions of gene counts (>2 read counts) in analyzed cells. Uninduced Pru and ME49 were grown in the absence of alkaline (Day 0), whereas induced Pru and ME49 were grown in the presence of alkaline (Day 3–7). (c) Top panel: Logistic regression modeling (green line) of detection limit (50% detection rate, black dotted line) of ERCC spike-ins. Text on top left of each sub-panel indicates the detection limit in absolute molecular counts. Bottom panel: Linear regression modeling (crimson line) of measurement accuracy fitted on ERCC spike-ins with abundance above the detection limit. Text on top left of each sub-panel indicates the coefficient of determination for the regression fit.
Figure 2 with 1 supplement
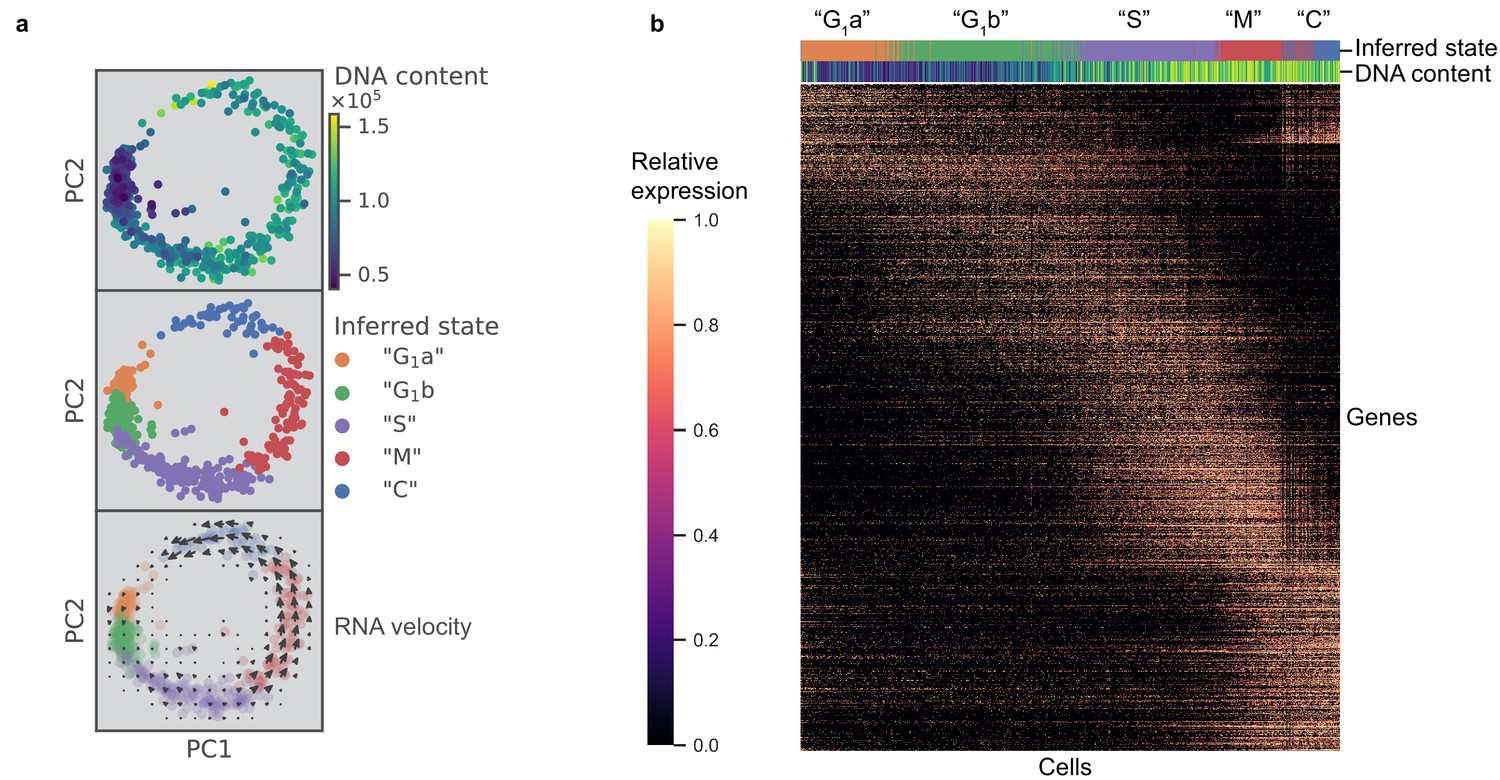
scRNA-seq resolves dynamics of Toxoplasma cell cycle in unsynchronized population.
(a) Projection of the first two principal components in RH data set. Top panel: 612 RH cells are colored by fluorescence measurement (arbitrary unit) of a cell permeable DNA content stain, DyeCycle Violet. Center panel: cells are colored by cluster assignment and labeled by the inferred ‘cell cycle’ state. Bottom panel: RNA velocity vector field is overlaid on top of the inferred state colors, with arrows pointing in the direction of net transcriptional change. (b) Heatmap of the 1465 most variable gene expression are displayed along the rows. Cells areordered by pseudotime assignment in ascending order along the columns of the heatmap (from left to right). Top colorbar reflects the assignment of inferred state and bottom colorbar reflects the relative fluorescence of DNA content using the same color scheme as in (a).
Figure 2—figure supplement 1
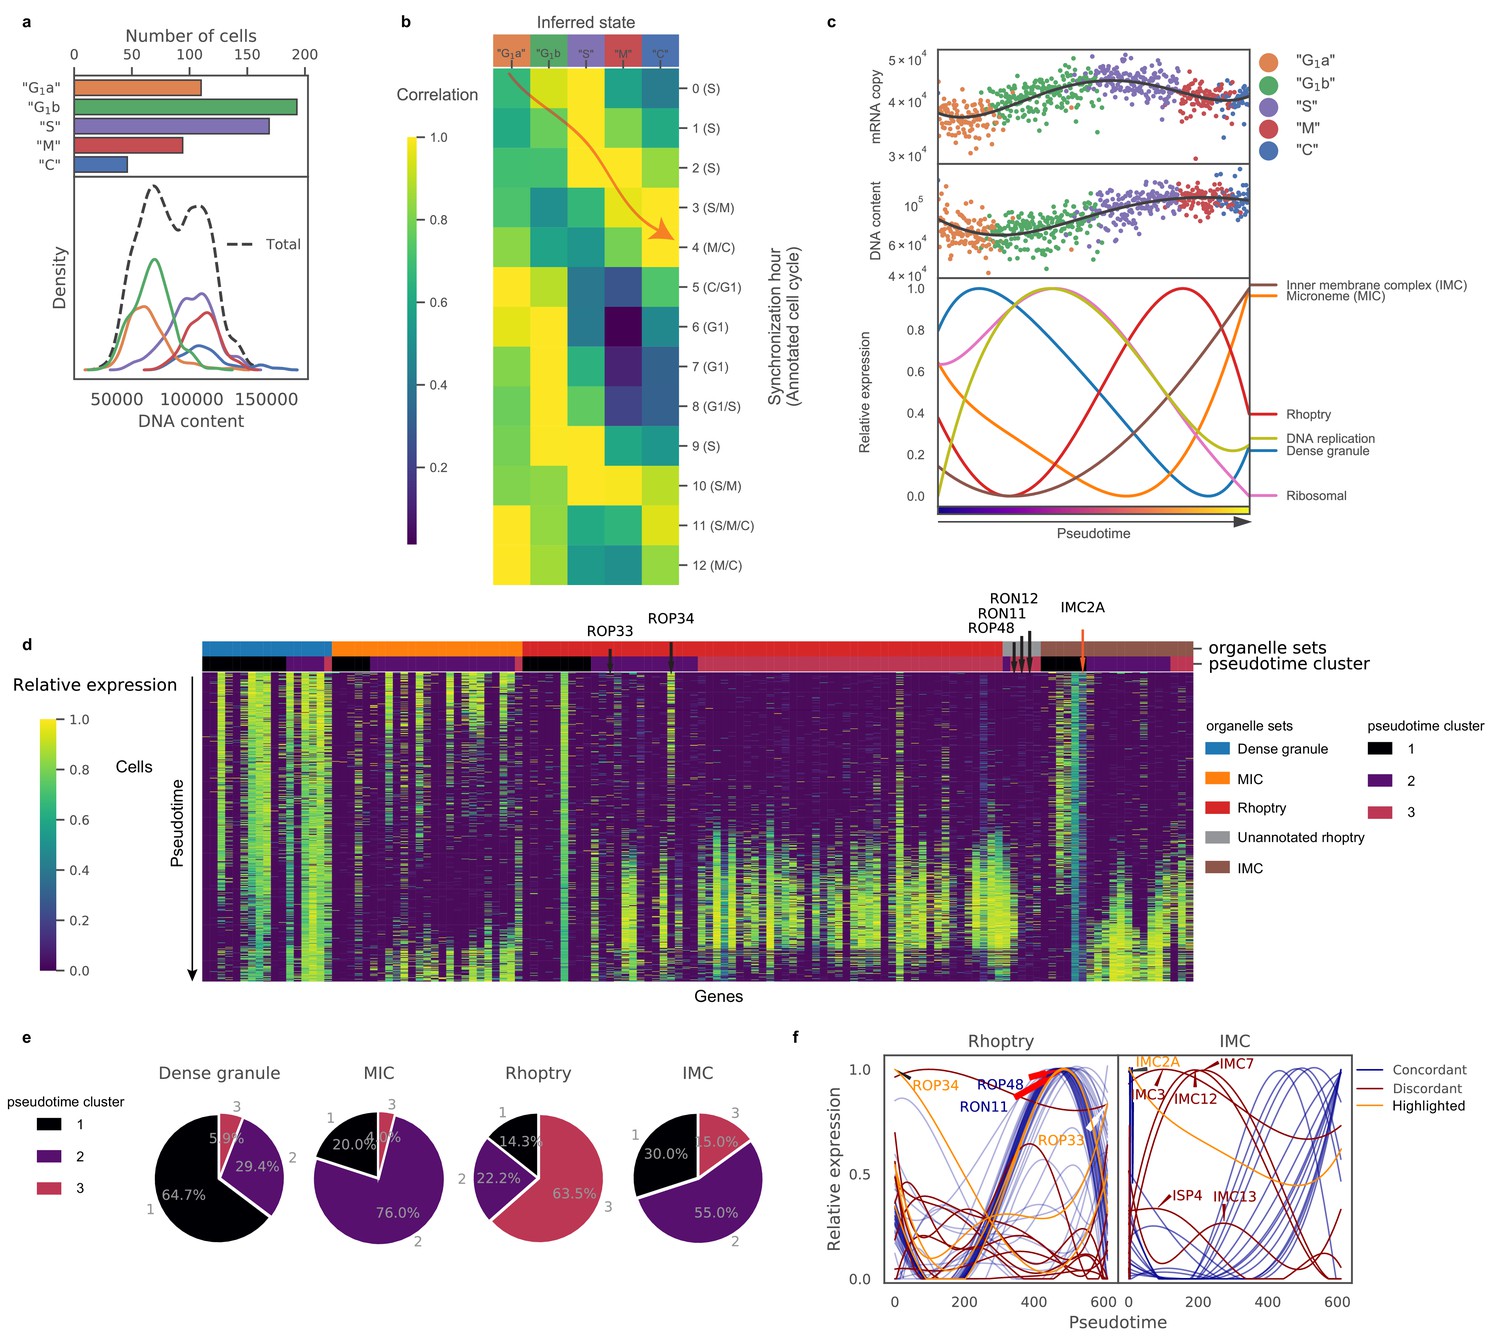
Biological pseudotime analysis reveals phase-dependent expression of genetic modules.
(a) Top panel: Numbers of RH parasites in each inferred ‘cell cycle’ state. Bottom panel: Density plots of DNA content distributions stratified by the inferred state. (b) Heatmap of average expression correlation between each inferred ‘cell cycle’ state of RH and each time-point of bulk transcriptomic measurement based on chemically synchronized parasites. (c) Absolute mRNA abundance (top panel) and DNA content (center panel) ordered by ‘cell cycle’ pseudotime with individual cells colored by their inferred states. A spline smoothing is applied to approximate a rolling average along the pseudotime (black solid line). Average expression of gene sets based on ToxoDB (v.36) annotation of organellar destination of the protein product after double spline smoothing (bottom panel). (d) Heatmap of gene expression ordered by organelle sets (top colorbar) and pseudotime cluster (bottom colorbar). ‘Unannotated rhoptry’ refers to genes not annotated in ToxoDB (v.36) as encoding a rhoptry protein but whose expression pattern is highly concordant with the dominant rhoptry pattern. (e) Pie charts of pseudotime cluster frequency for parasite organelle sets. (f) Expression of annotated rhoptry (left panel) and inner-membrane complex (IMC; right panel) genes along pseudotime with different colors indicating genes concordant (blue) and discordant (crimson and orange) to the major trend of their organelle sets. Discordant genes which are known to be misannotated are highlighted in orange.
Figure 3 with 4 supplements
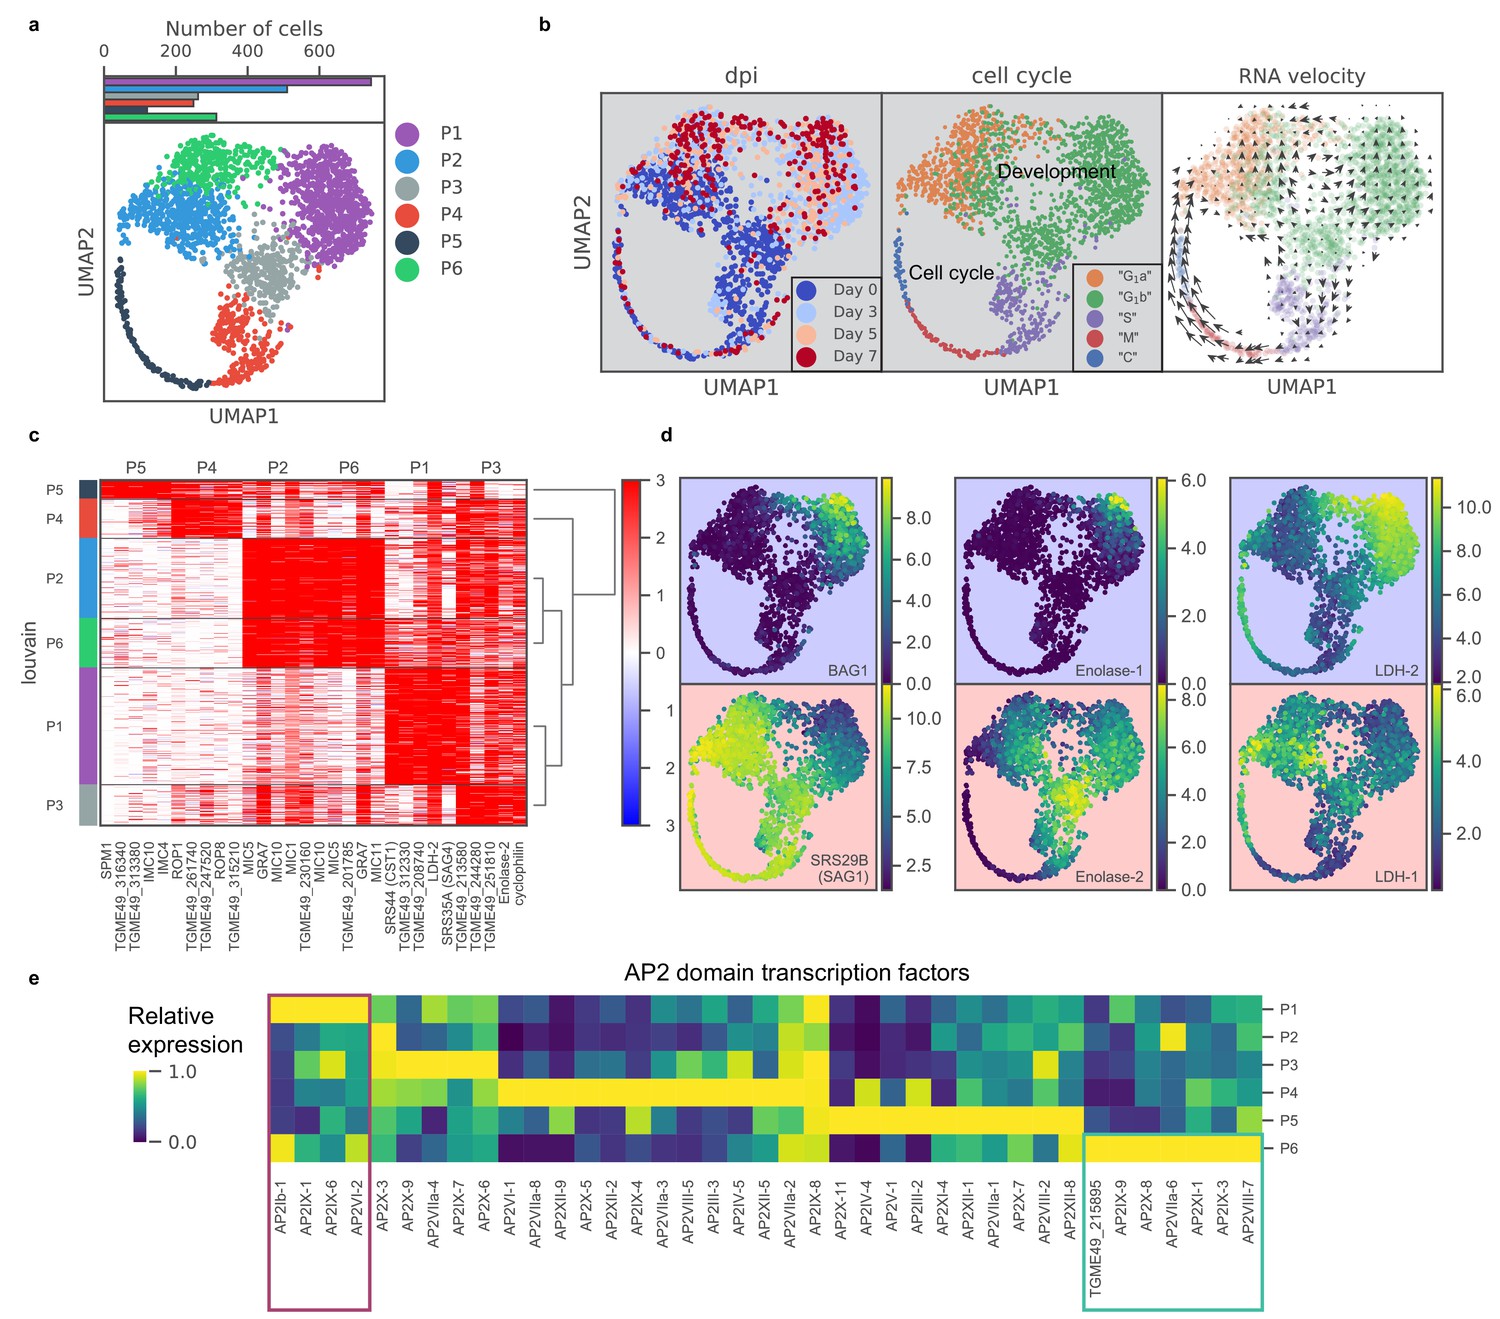
scRNA-seq resolves dynamics of asexual development in vitro.
(a) UMAP projection of 809 uninduced and 1389 induced Pru parasites with colors indicating Louvain cluster assignment. Top panel shows the number of parasites in each cluster. (b) UMAP projections of Pru parasites colored or labeled by days post induction (dpi), inferred cell cycle states, and RNA velocity from left to right. (c) Heatmap of differentially expressed genes (along columns) across Louvain clusters of cells ordered by hierarchical clustering (along rows). The top five most enriched genes from each cluster are presented. (d) UMAP projections of Pru colored by the neighbor-averaged expression (log2 CPM) of bradyzoite (top panels, purple background) and tachyzoite (bottom panels, red background) marker genes. (e) Heatmap of average expression level of AP2 transcription factors for each Louvain cluster, normalized by the maximum cluster expression level within each AP2. Purple and green rectangles highlight AP2s enriched in clusters P1 and P6, respectively.
Figure 3—figure supplement 1
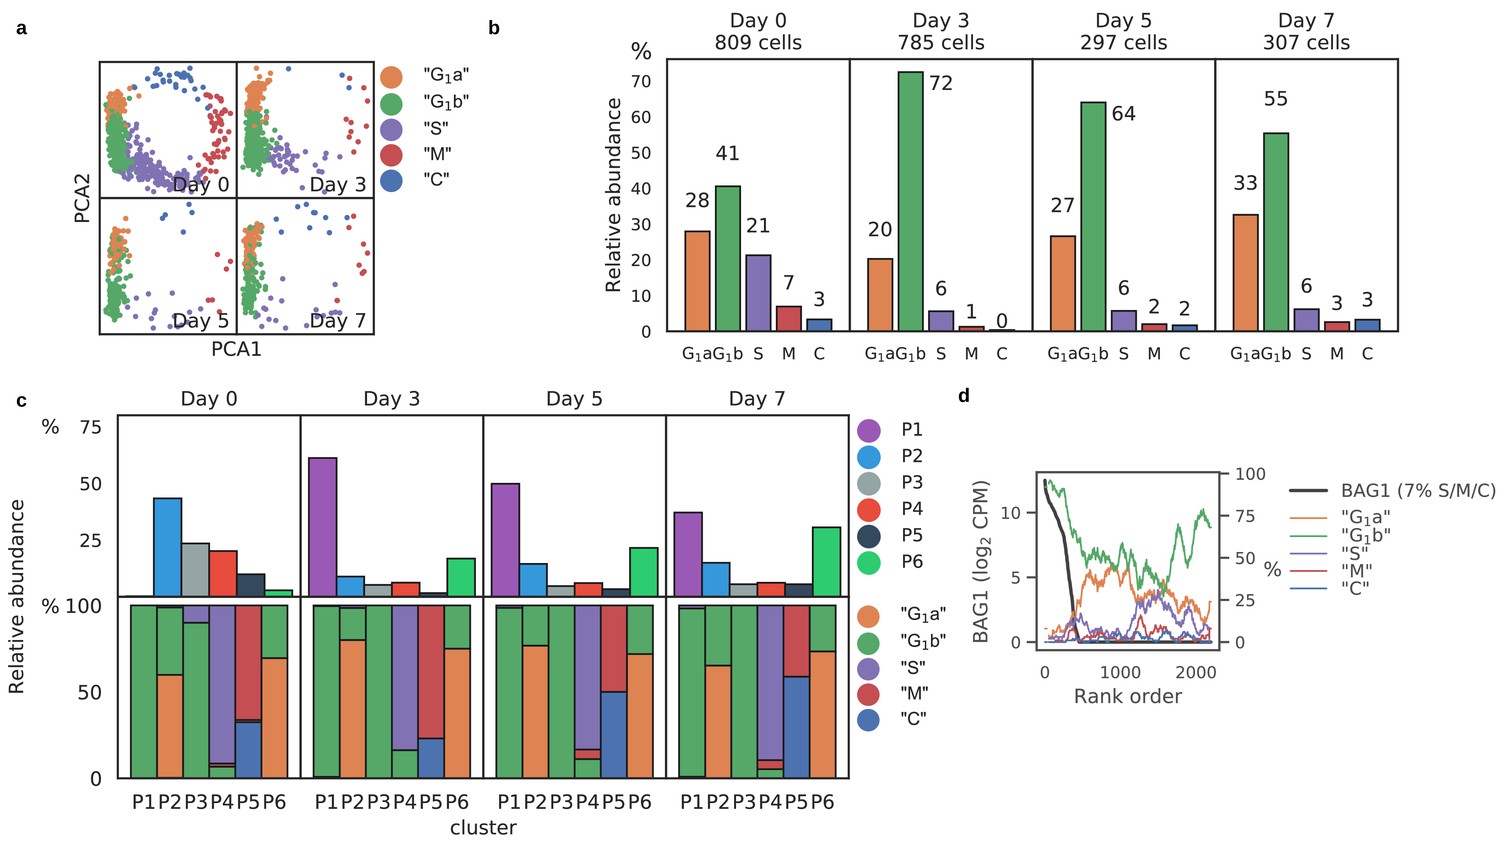
Alkaline induction altered cell-cycle dynamics of Toxoplasma.
(a) PCA projection of Pru stratified by days post induction (dpi) and colored by predicted cell cycle state. (b) Frequency of predicted cell cycle states at different dpi time points. (c) Frequency of Louvain clusters (top panels) and predicted cell cycle states in each cluster (bottom panels). (d) Rolling average frequency of predicted cell cycle states (colored lines) ordered by expression level of the canonical bradyzoite marker, BAG1 (black line).
Figure 3—figure supplement 2
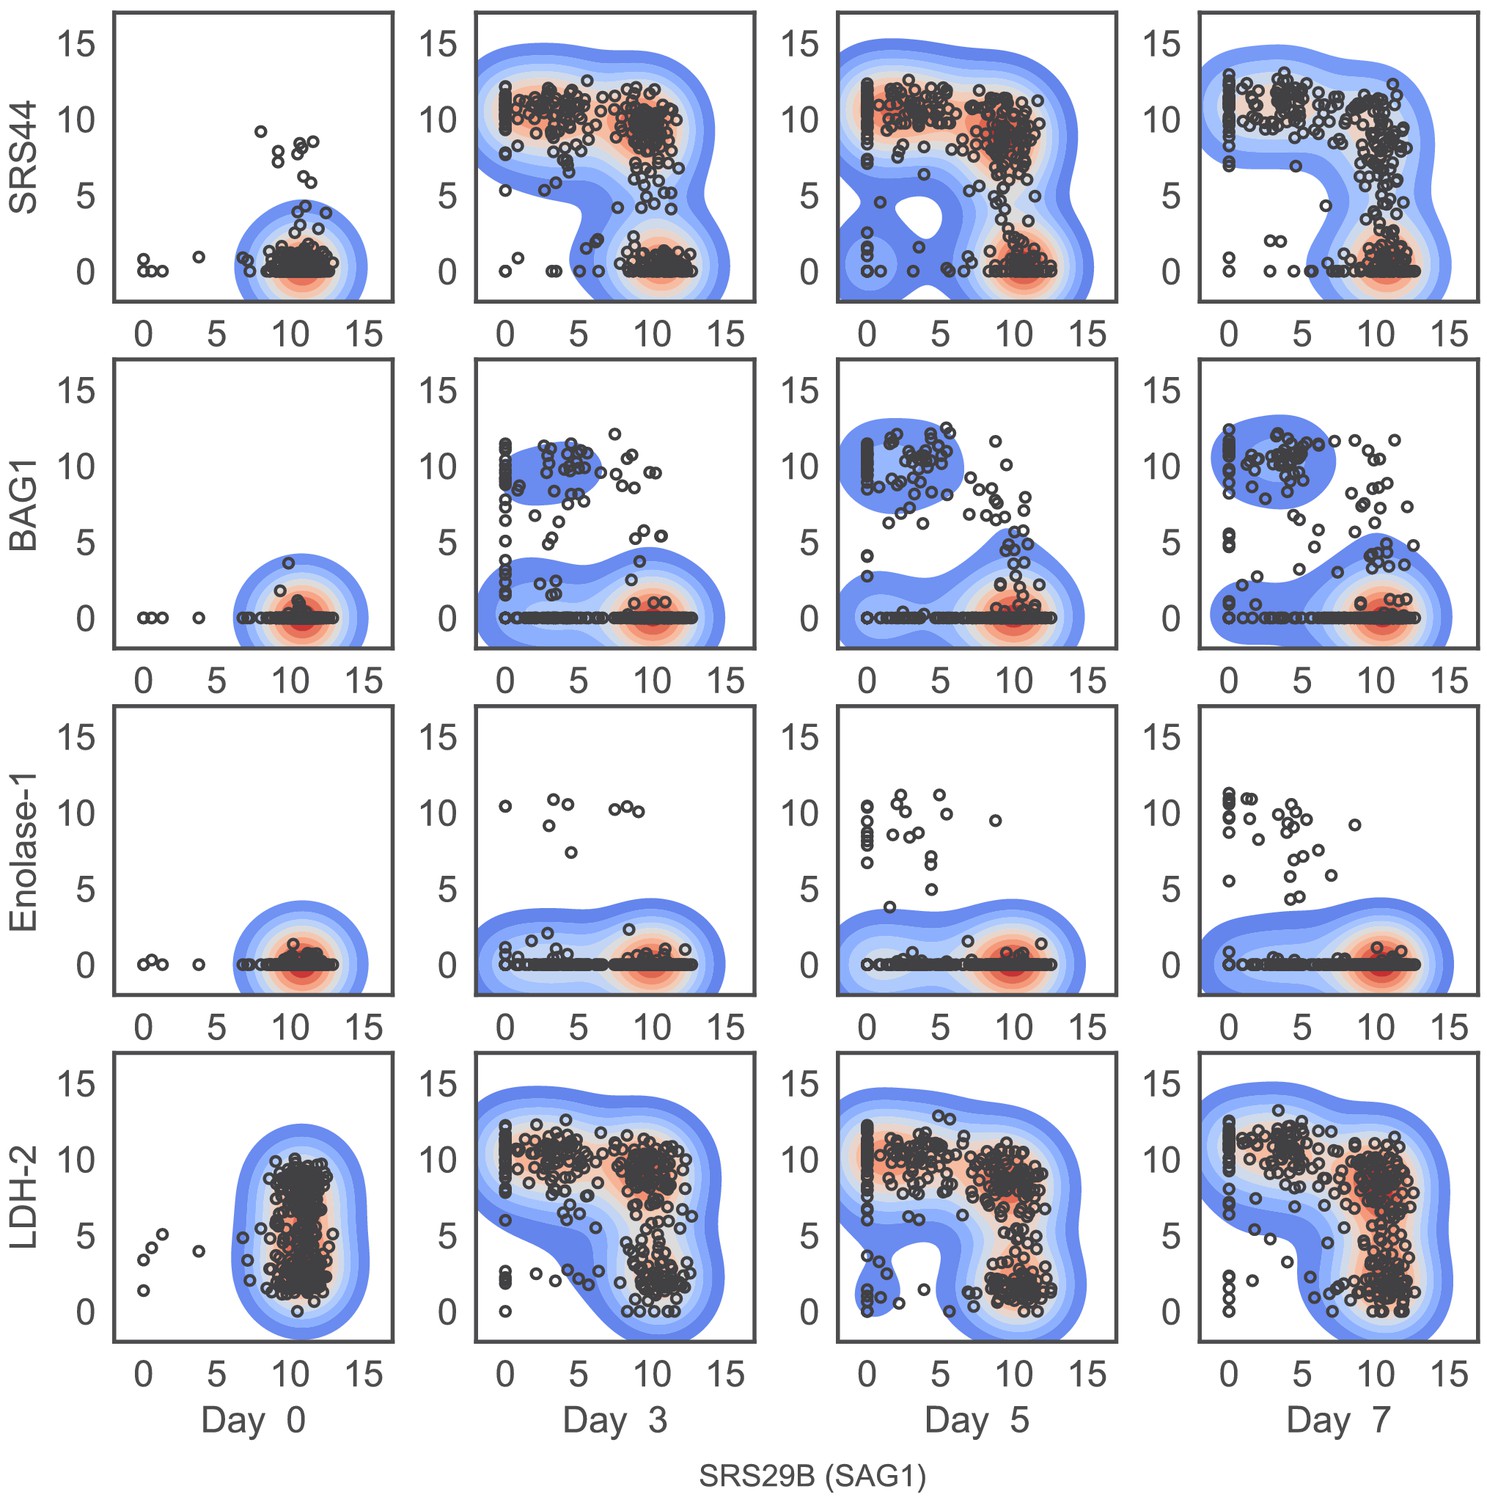
Expression level (log2 CPM) of four ‘bradyzoite-specific’ marker genes compared to that of ‘tachyzoite-specific’ marker gene, SAG1, stratified by days post induction (dpi; columns).
Figure 3—figure supplement 3

Differentially expressed genes in the hidden state of alkaline-induced Pru parasites.
(a) UMAP projections of Pru colored by the neighbor-averaged expression (log2 CPM) of top eight most differentially expressed and enriched genes in P6 cluster relative to P1 and P2, two most closely related clusters. (b) Comparison of P6-specific genes in bulk measurement of tachyzoites, tissue cysts, or enteroepithelial stages (EES1-EES5) (left) and scRNA-seq of Pru Louvain clusters (right).
Figure 3—figure supplement 4
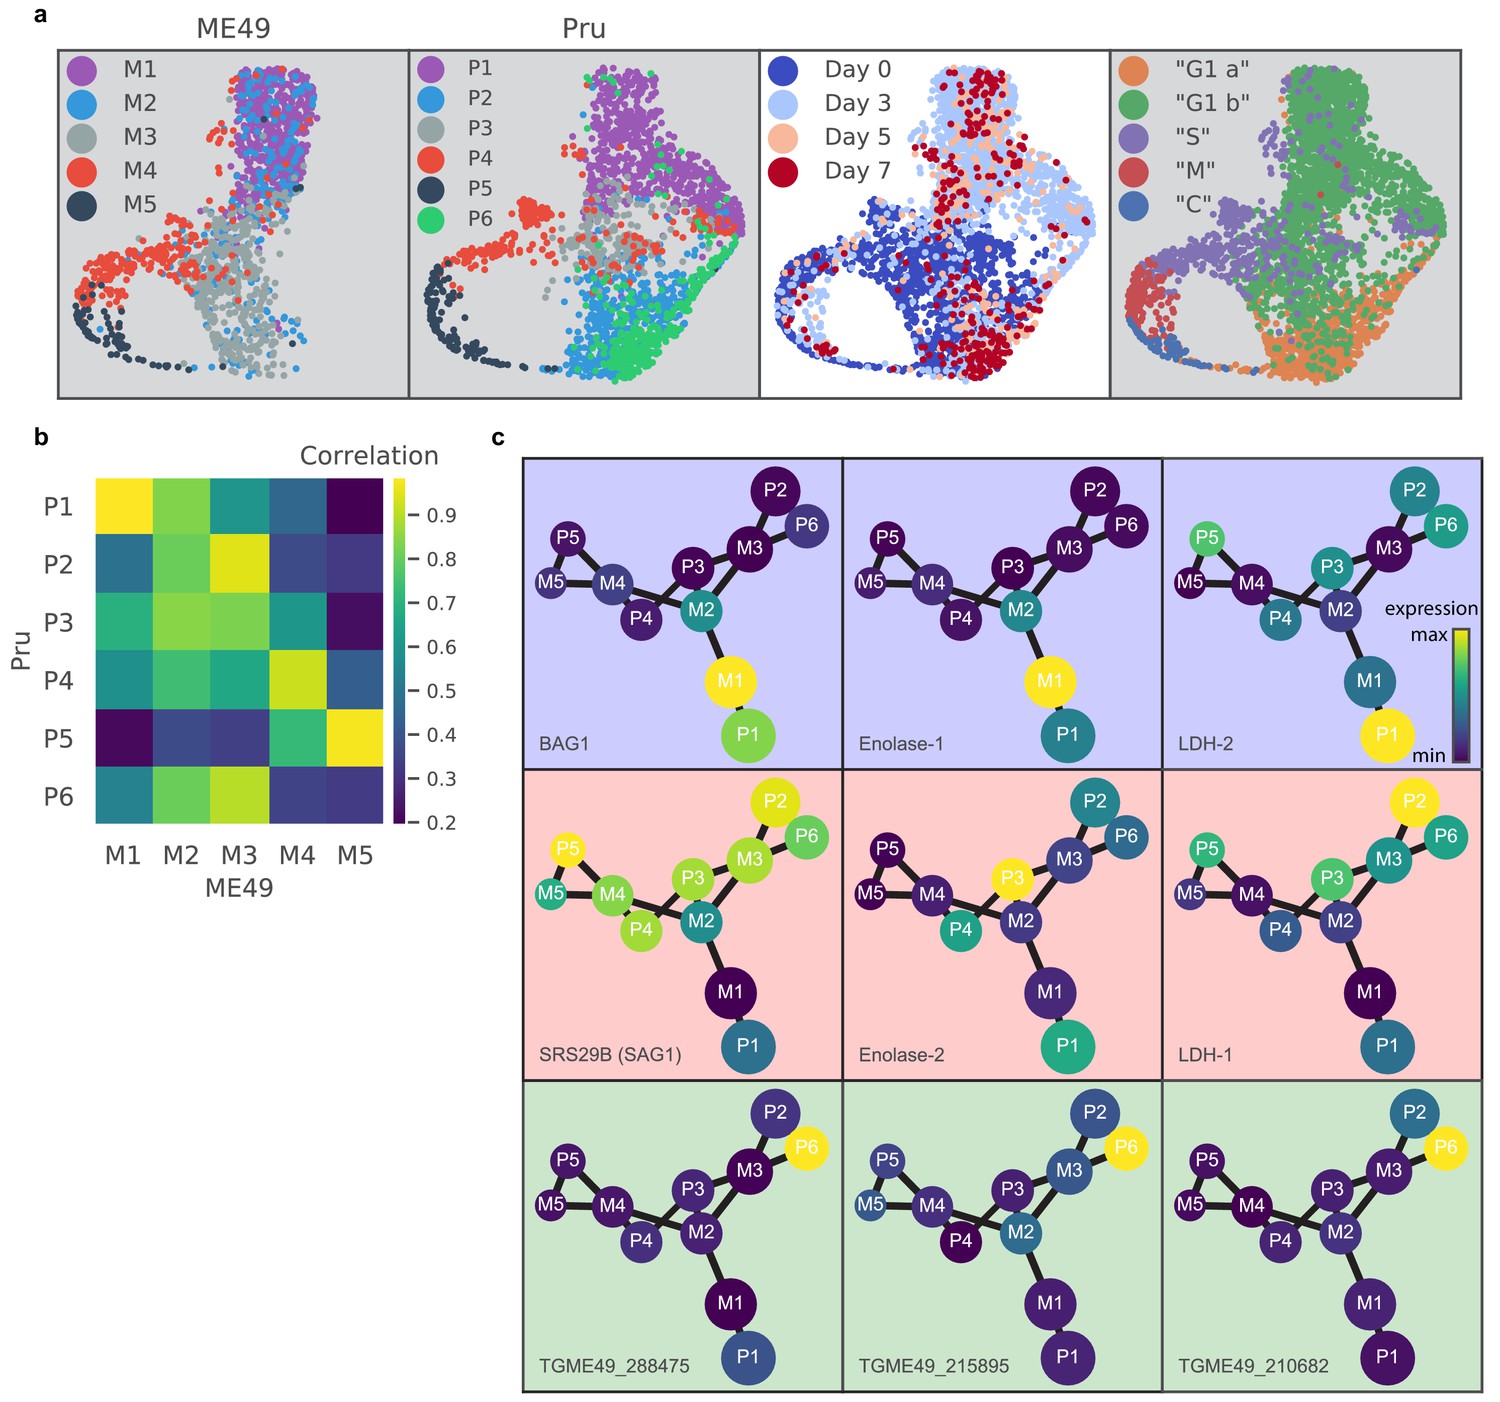
scRNA-seq comparative analysis of asexual development in two commonly studied Toxoplasma strains.
(a) UMAP projections of Pru and ME49 aligned by Scanorama. Cluster assignment was performed independently in each dataset. (b) Matrix correlation of cluster averaged expression between Pru and ME49. (c) Partition-based graph abstraction (PAGA) of aligned clusters with each being represented as a node connected by linkage with a connectivity threshold of 0.8. Node size reflects relative abundance of the cluster. Node colors reflect relative expression level of gene denoted in the bottom left of each panel, normalized to the maximum cluster expression of the corresponding data set (Pru or ME49). Three marker genes that are specific to bradyzoite (blue background), tachyzoite (red background), and Pru P6 cluster (green background) are shown.
Figure 4 with 1 supplement
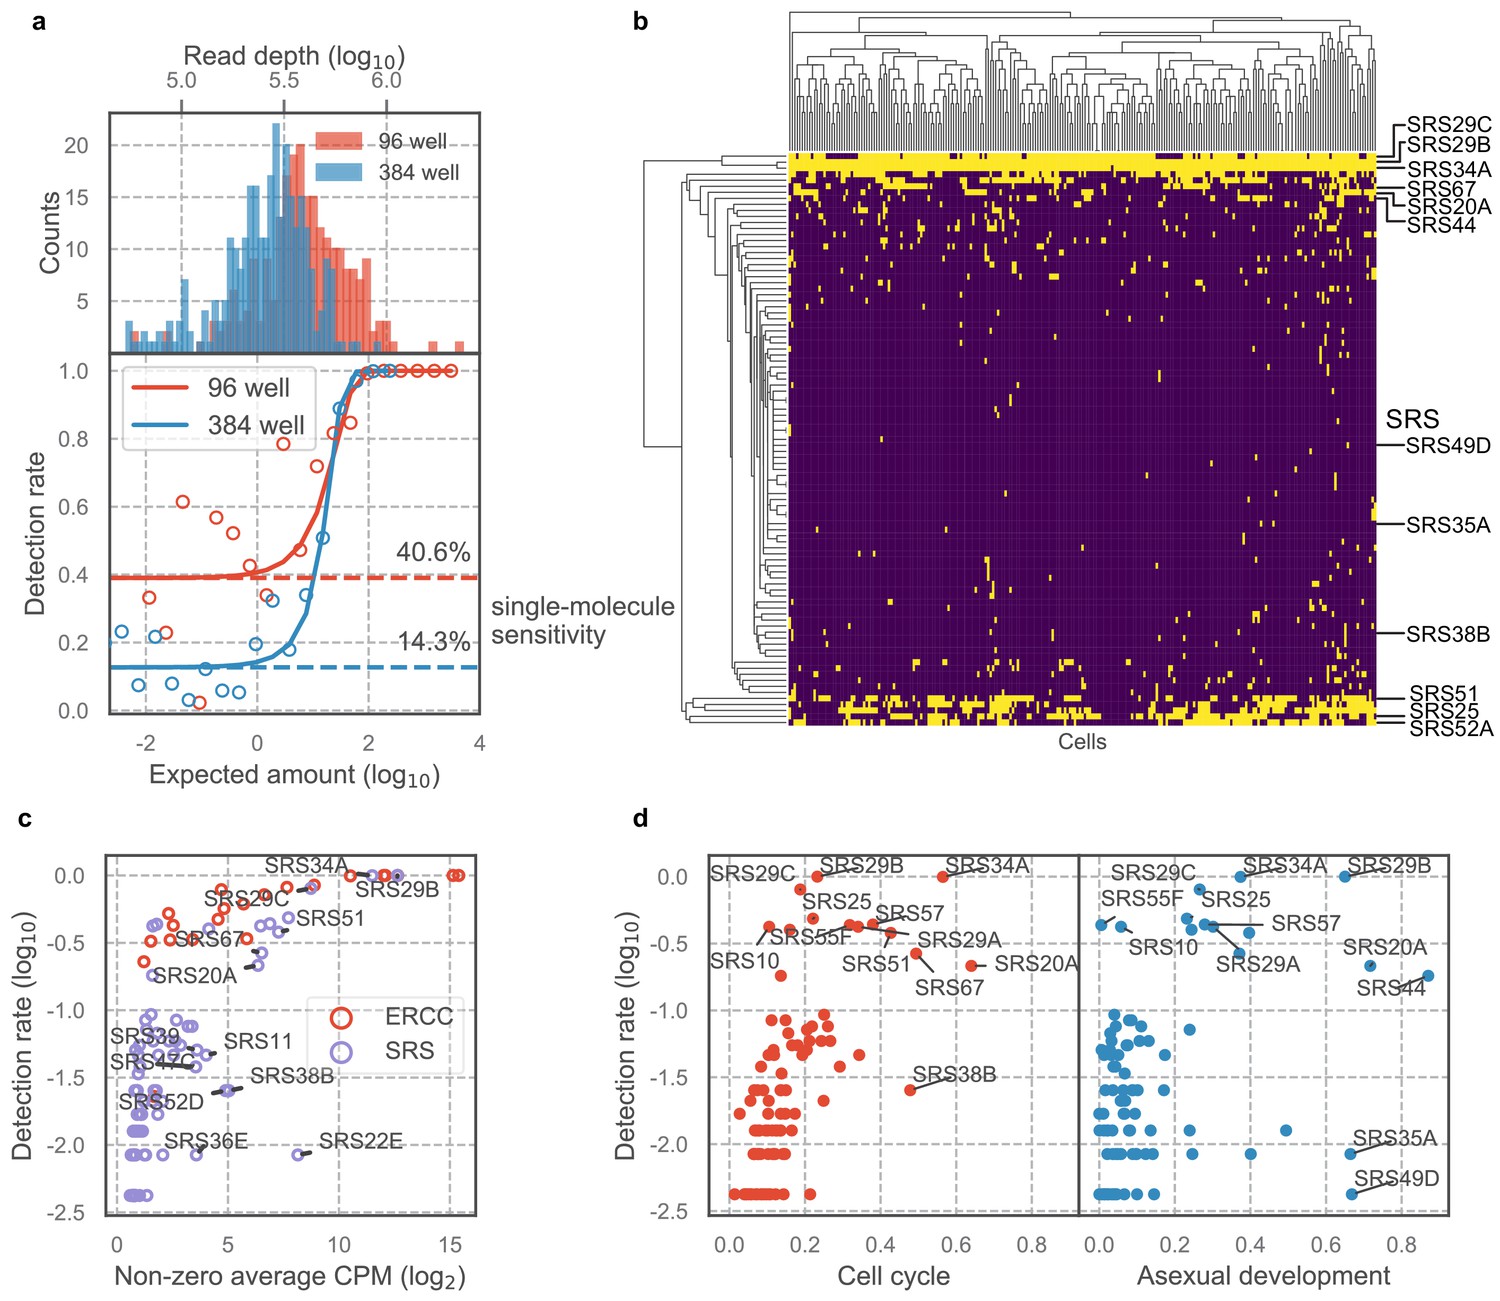
Majority of SAG1-related sequences (SRS) antigens are variably expressed in individual parasites.
(a) Read depth (top) and detection rate of ERCC spike-ins (bottom) reveal higher measurement sensitvity in 96 well plate over 384 well plate format at roughly equivalent sequencing depth. (b) Hierarchical clustering heatmap of binarized expression reveals sparse expression pattern of SRS. SRS gene expression is binarized by converting expression >2 read counts to one and <2 to 0. (c) Comparison of ERCCs with similar mean expression level reveals that low detection rate of SRS cannot be fully explained by measurement dropout. (d) We quantified the projection dependence score of SRS expression to cell cycle projection in 384-well RH or asexual development projection in 384-well Pru, reflecting the degree of co-variation of SRS expression with respect to these two biological processes. The detection rate in 96-well RH dataset is plotted along the y-axis. This analysis reveals that some of the SRS variation cannot be readily explained by either cell cycle or asexual development.
Figure 4—figure supplement 1
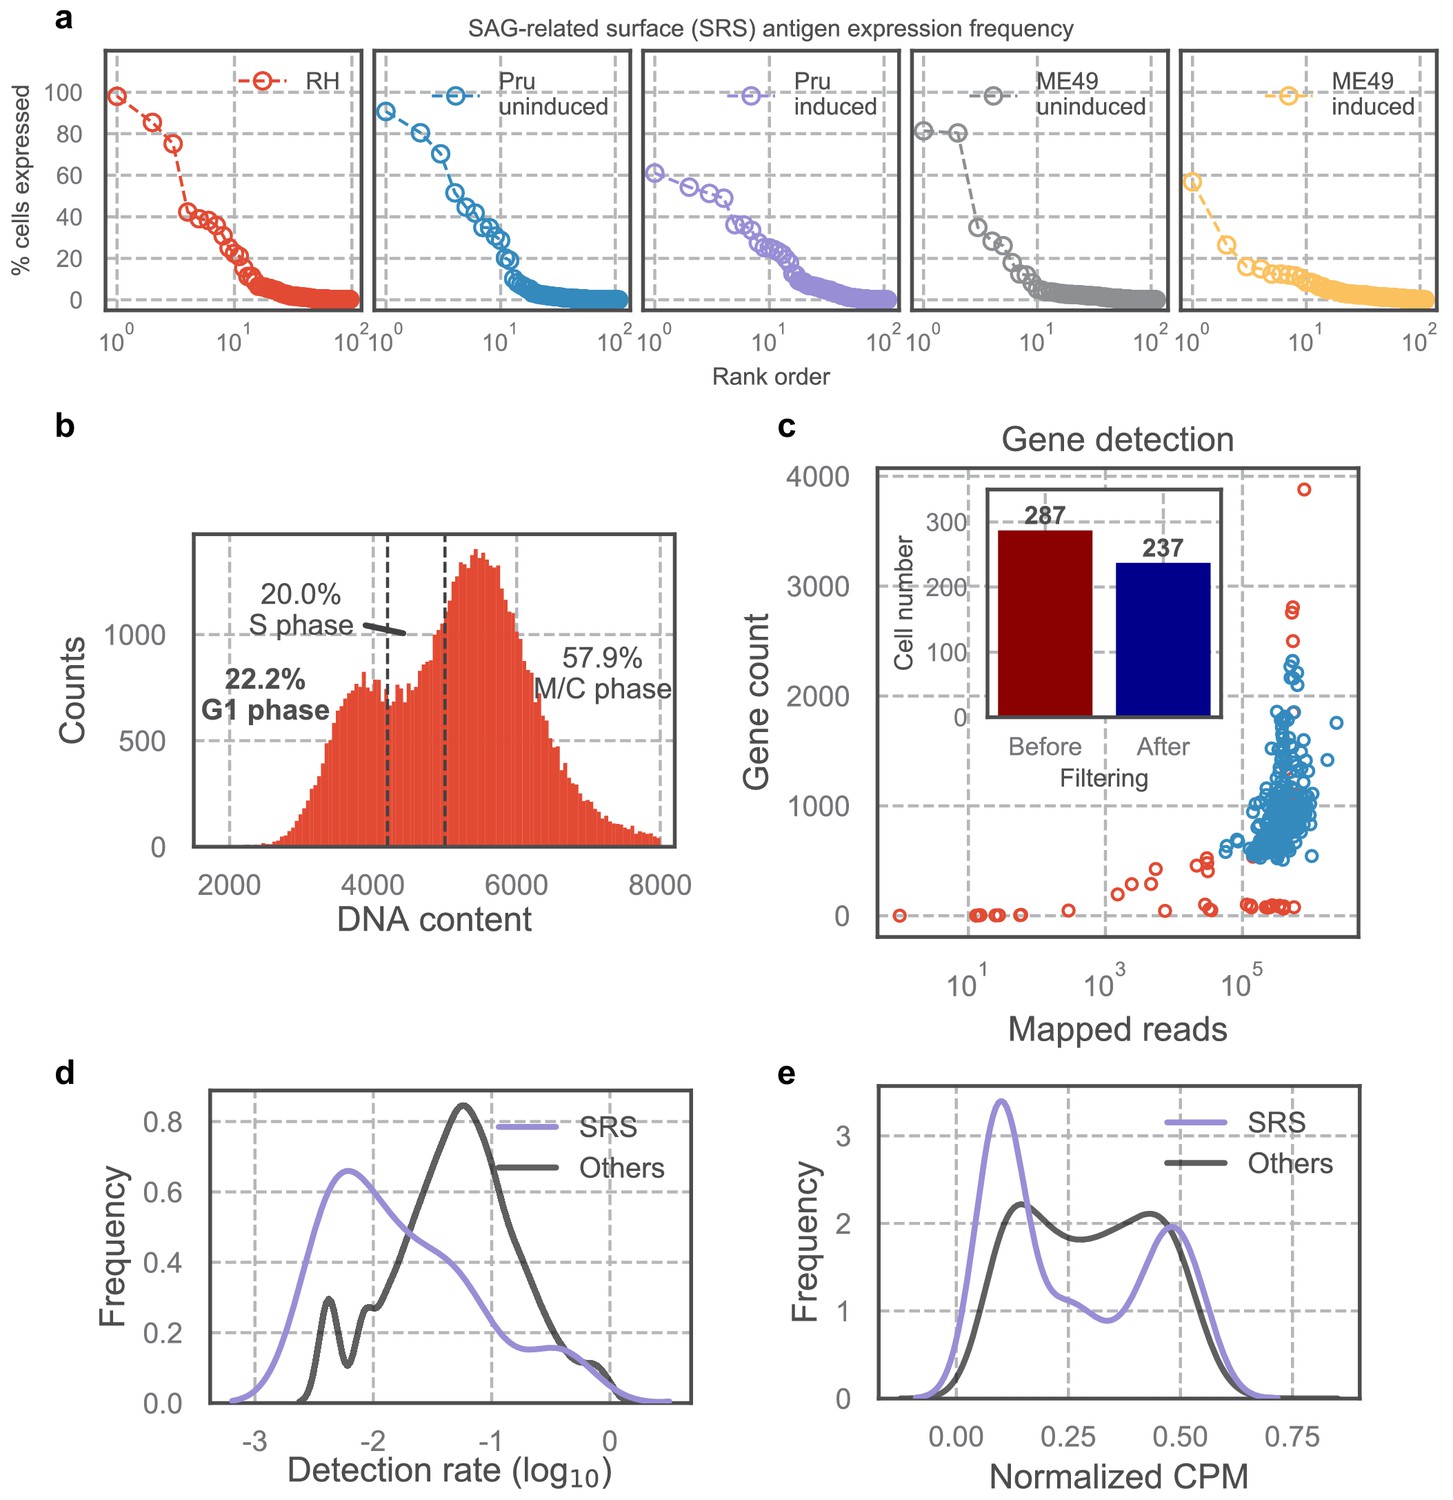
Technical benchmark of 96-well scRNA-seq measurement.
(a) SRSs rank ordered by percent expression in each single-parasite dataset. Each open circle depicts a single SRS in the corresponding dataset. (b) Fluorescence measurement of extracellular RH stained with DNA content stain. G1 sub-population was sorted into 96-well plate for scRNA-seq following Smart-seq two protocol. (c) Gene count (>2 read counts) and read depth of 96-well scRNA-seq for cells that failed (red) or passed (blue) quality checking. Inset bar plot highlights the number of cells before and after filtering, revealing that >82% of cells passed quality checking. Majority of SRS is detected at lower frequency than most other Toxoplasma genes (d) and has low expression level (e).
Figure 5
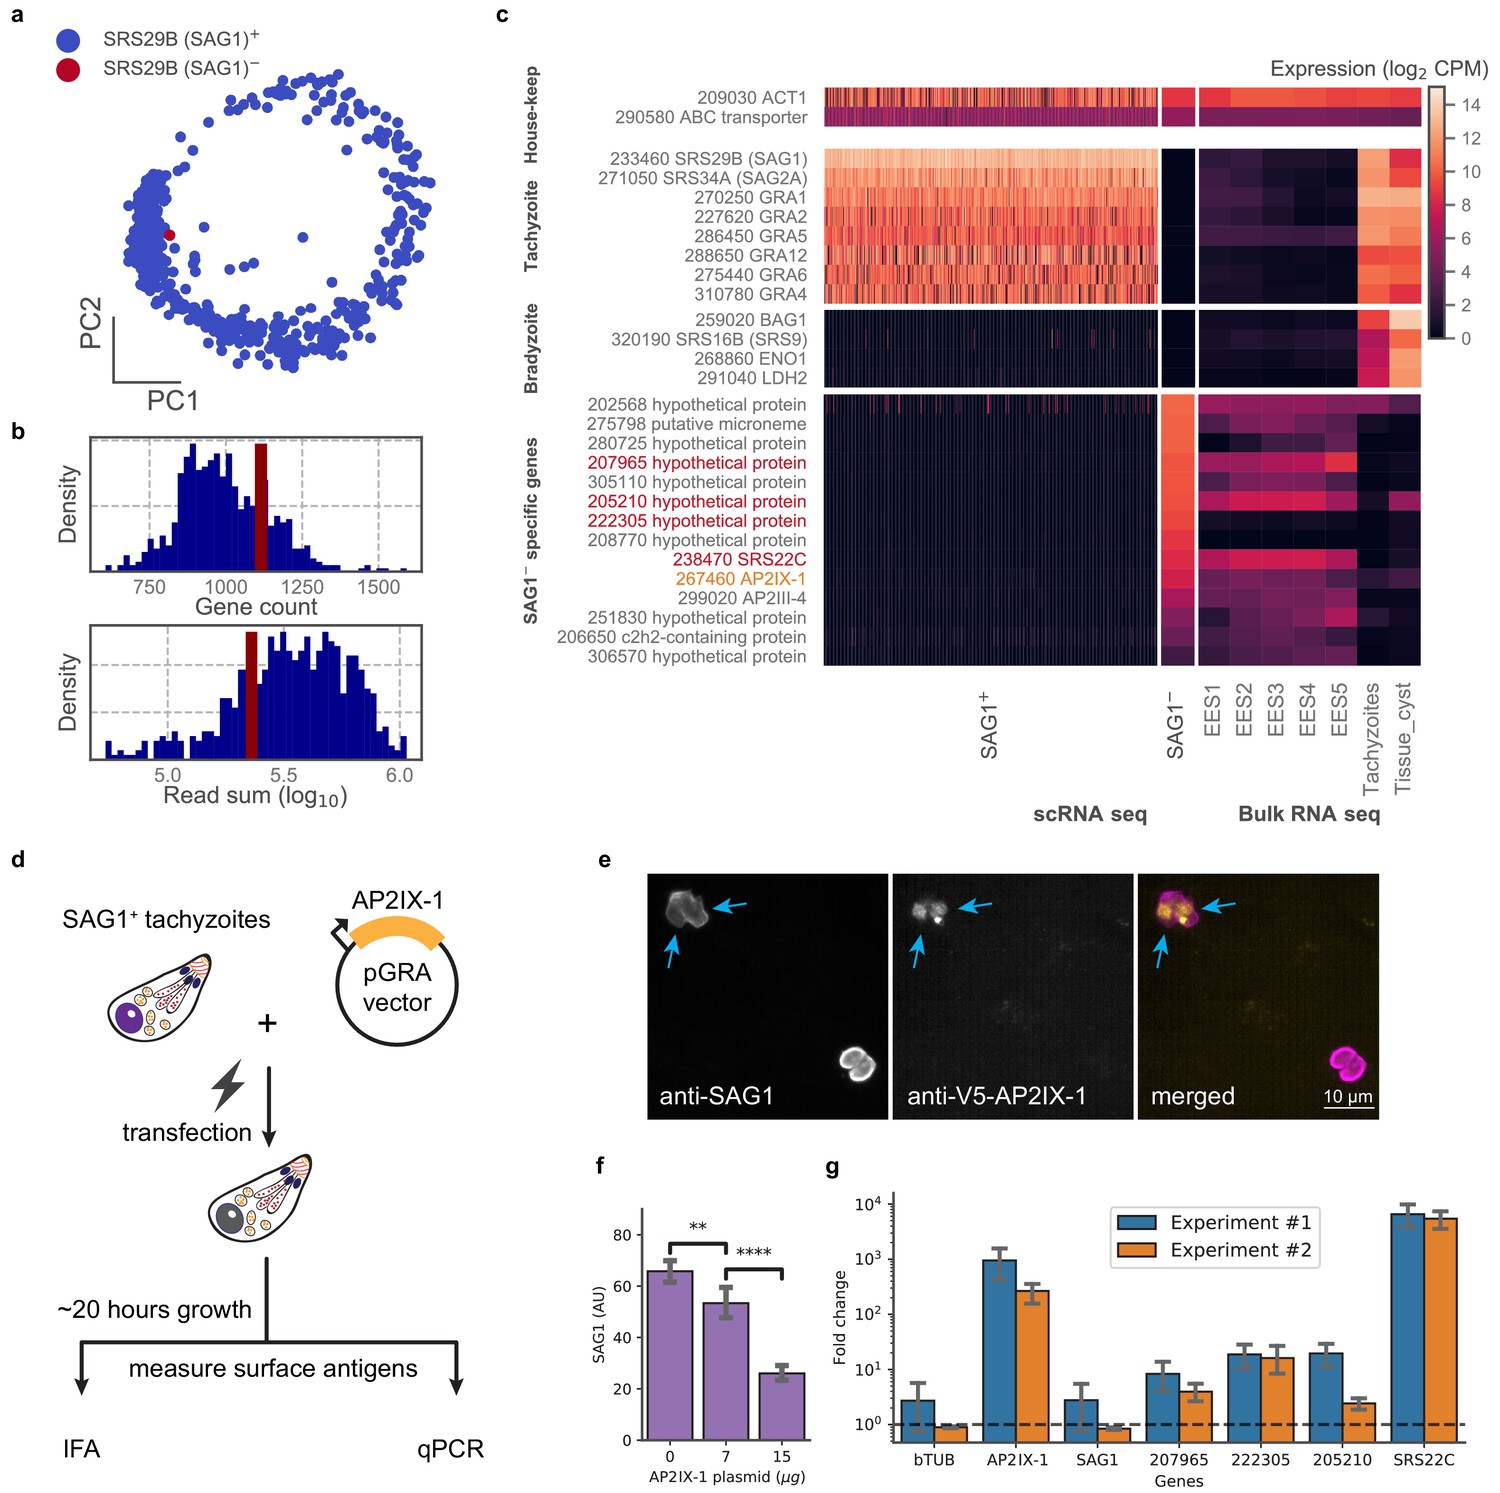
Analysis of a single SAG1- outlier cell reveals regulatory role of AP2IX-1 on cat-stage antigen and genes.
(a) PCA projection of 384-well RH cells colored by the presence (blue) or absence (red) of the SRS29B (SAG1) gene. (b) Gene count and total reads mapped for SAG1+ (blue) and SAG1- (red) cells. (c) Comparison of house-keeping, tachyzoite-specific, bradyzoite-specific, and SAG1- enriched gene expression (log2 CPM) in scRNA-seq to bulk RNA-seq measurement of enteroepithelial stages (EES1-EES5), tachyzoites, and tissue cysts in RH. Genes that were pursued further by qRT-PCR are indicated in red; AP2IX-1 is colored orange. (d) Schematic illustration of transfection experiment. AP-2 IX-1 from genomic DNA of RH was cloned into a pGRA1 backbone vector and expressed constitutively in transfected parasites. Expression level of gene and protein was quantified with immunofluorescence assay (IFA) and qRT-PCR. (e) Representative IFA images showing anti-SAG1 (left), anti-V5-AP2IX-1 (center), and merged channels (right). Blue arrows point at parasites with detected expression of V5-AP2IX-1. (f) IFA quantification of anti-SAG1 signal shows dosage dependence of SAG1 protein expression on amount of AP2IX-1 plasmid transfected, with error bars depicting the standard deviation of quantification and asterisks representing statistical significance of two-tailed t-test for independence. (g) qPCR measurement shows that transfection of 15 µg AP2IX-1 plasmid, compared to no DNA control, induced the expression of AP2IX-1 and several putative surface antigens, including SRS22C, in two independent experiments with each measured in biological triplicates. AP2IX-1 transfection did not lead to increased expression of beta tubulin (bTUB) or SAG1. Error bars depict standard deviation of the measurement.
-
Figure 5—source data 1
Immunofluorescence assay (IFA) quantification results of SAG1 and V5 expression level in AP2IX-1 transfected population.
- https://cdn.elifesciences.org/articles/54129/elife-54129-fig5-data1-v2.csv
-
Figure 5—source data 2
qPCR quantification results of AP2IX-1 transfection.
- https://cdn.elifesciences.org/articles/54129/elife-54129-fig5-data2-v2.csv
Figure 6 with 1 supplement
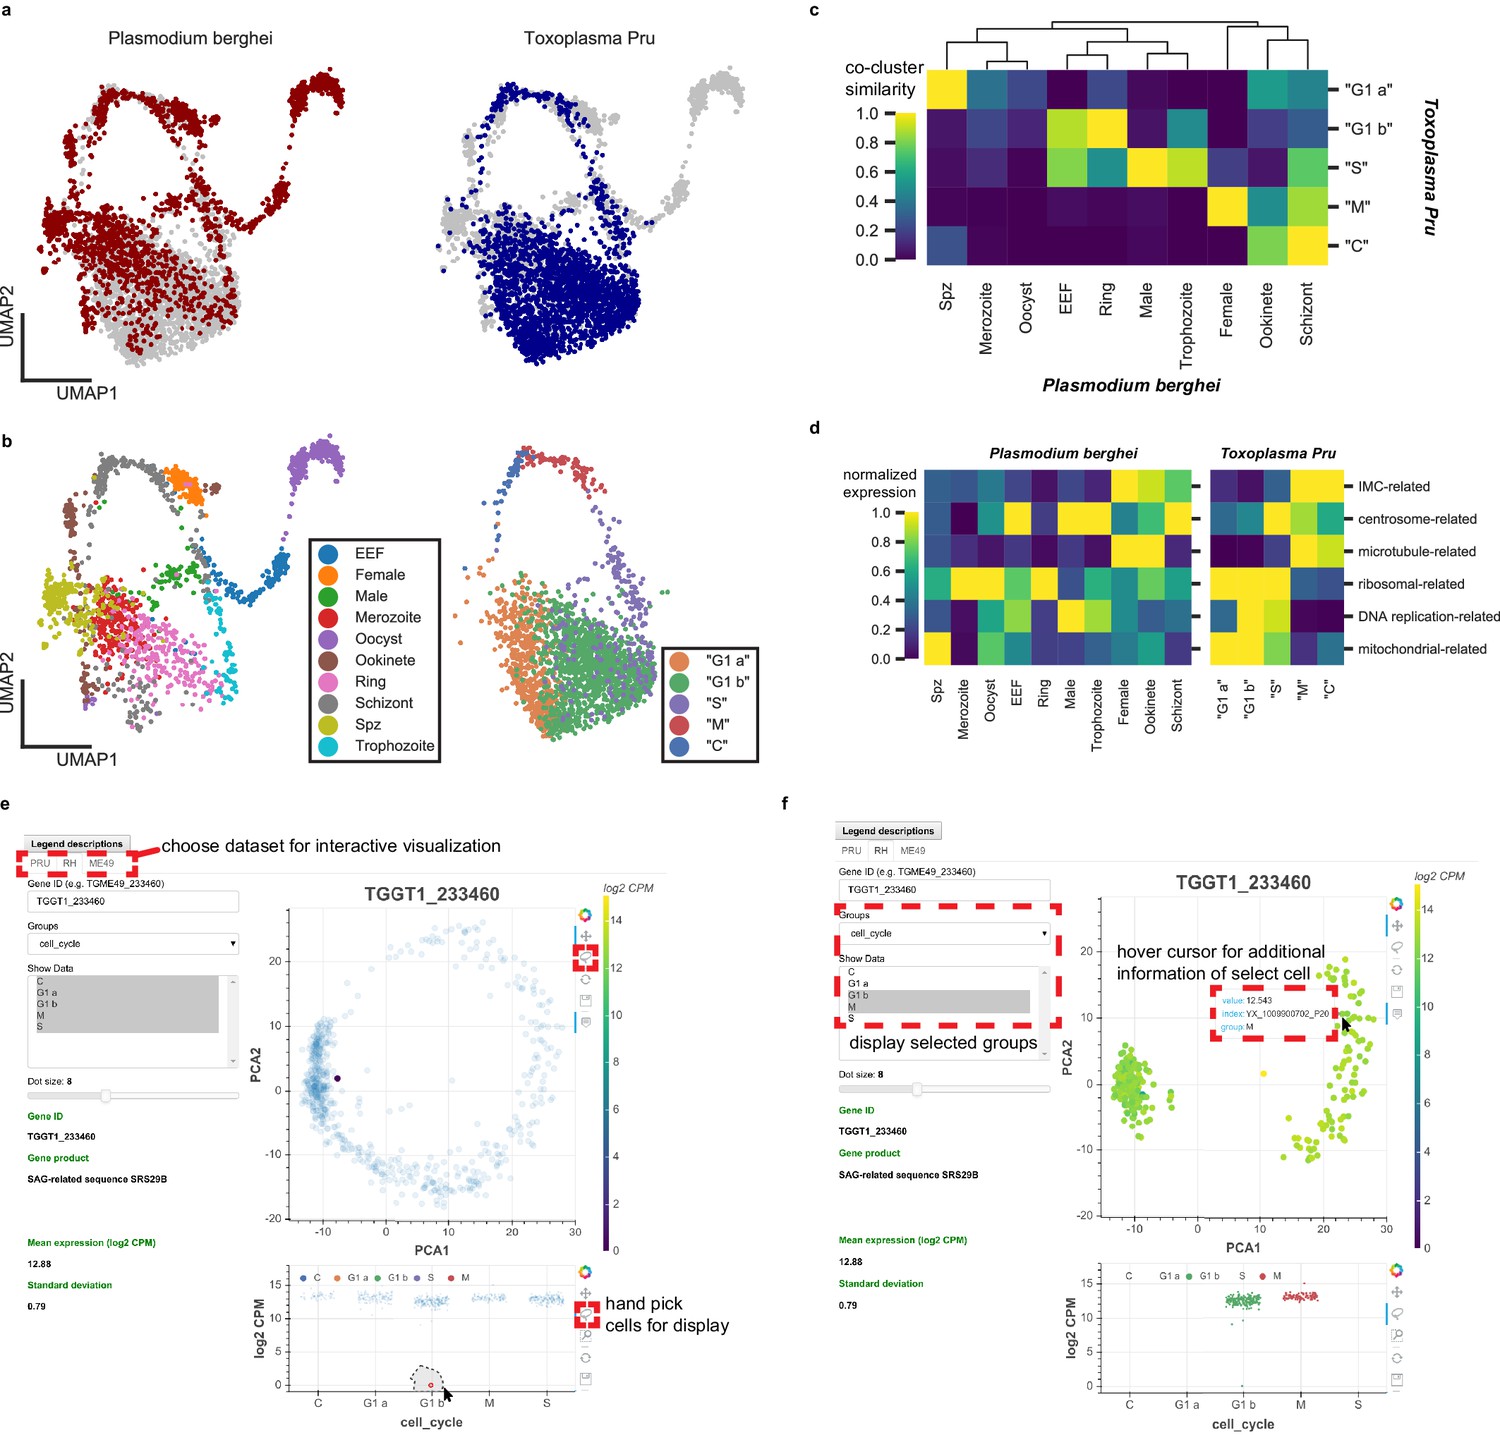
Comparative analysis of scRNA-seq in Toxoplasma gondii and Plasmodium berghei reveals concerted genetic programs underlying their life-cycles.
(a) Scanorama integration of Plasmodium berghei (red, left) and Toxoplasma gondii Pru (blue, right). (b) Cell cycle of Toxoplasma is well-aligned to the erythrocytic cycle of Plasmodium berghei, despite fundamental differences in cell cycle progression between these two apicomplexans. Each cell is colored by the original cluster assignment in the corresponding dataset. (c) Normalized cluster similarity between the original cluster assignment of Plasmodium berghei and Toxoplasma Pru. Cluster similarity is calculated by quantifying the fraction of cells that overlap in topological network in each cluster of the corresponding dataset. (d) Heatmap of concerted gene sets expression normalized to one within each cluster of cells in Plasmodium (left) and Toxoplasma (right). (e) Single-cell atlas of Toxoplasma gondii can be interactively visualized (http://st-atlas.org). Individual cells with distinct expression pattern can be highlighted using built-in graphical interface tools. (f) Groups of cells can be selectively displayed based on cell cycle state, developmental clusters, and other categories. Hovering over an individual cell with cursor reveals gene expression level, sample id, and group membership for further analysis. All our datasets are available for download on the atlas.
Figure 6—figure supplement 1
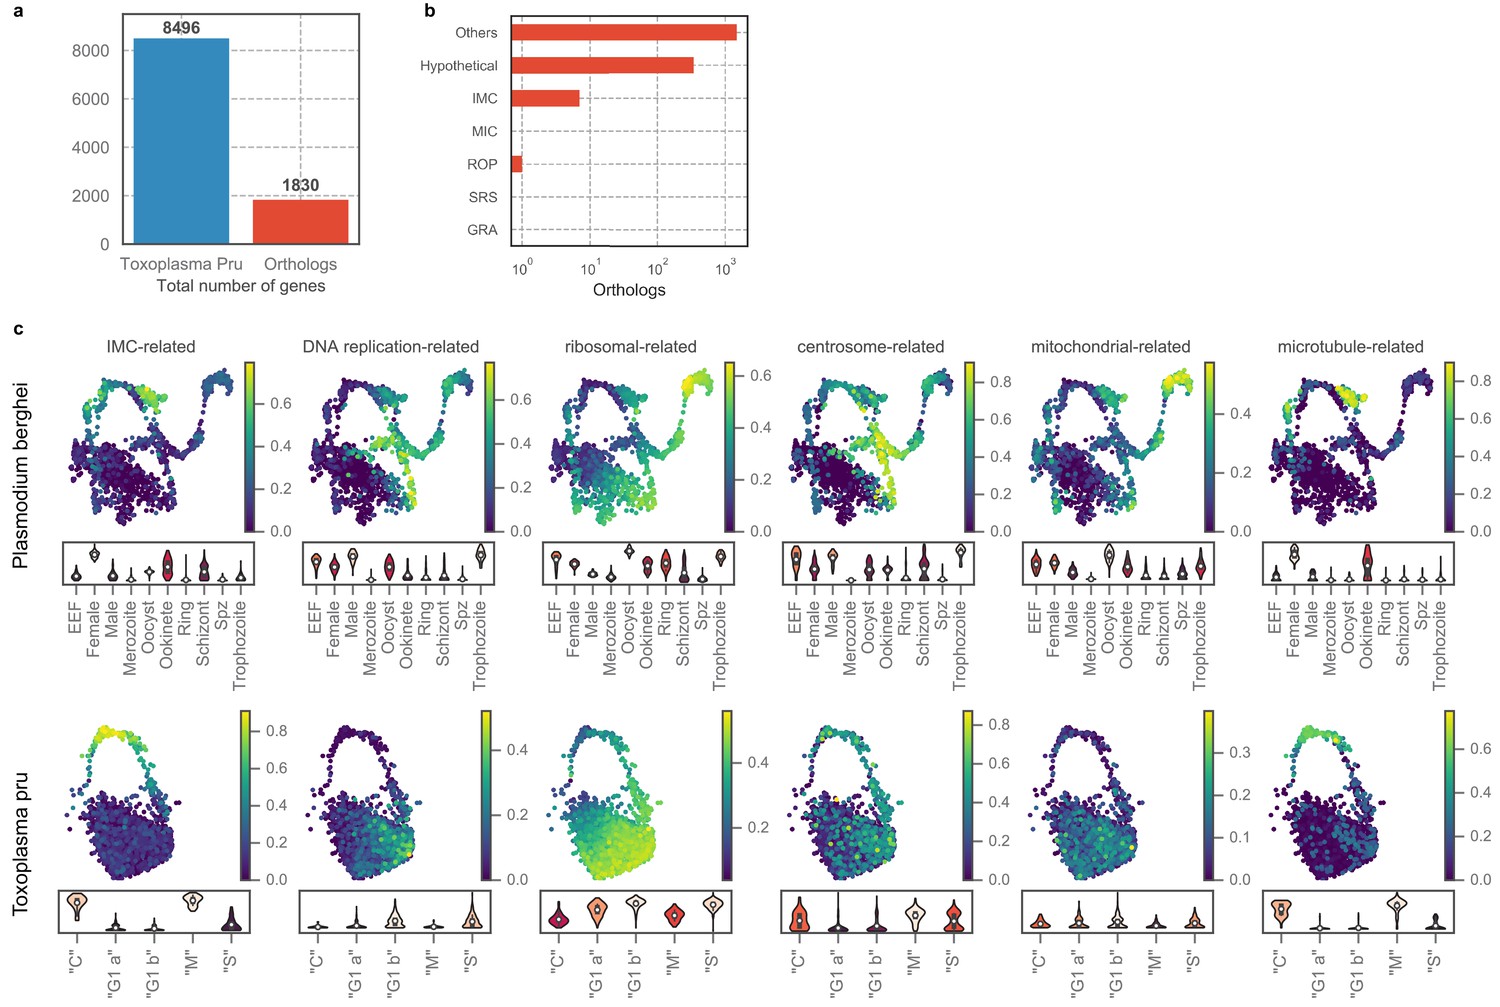
Concerted expression profile of orthologous gene sets across the two distantly-related apicomplexans.
(a) Number of total Toxoplasma genes and one-to-one orthologs in Plasmodium. (b) Number of ortholog genes grouped by annotation in Toxoplasma genome. (c) UMAP projection of Plasmodium berghei (top row) or Toxoplasma Pru (bottom row) with cells colored by the average expression level of ortholog gene sets. The expression value is normalized to a maximum of 1 for each gene before taking the average such that the normalized value is not skewed towards genes with high dynamic range. Bottom panel of each subplot shows a violin plot of the average gene sets expression distribution stratified by cluster assignment. Gene sets covary in closely related regions of the projection space in both organisms.
Tables
Key resources table
| Reagent type (species) or resource | Designation | Source or reference | Identifiers | Additional information |
|---|---|---|---|---|
| Cell line (Toxoplasma gondii) | ME49 | PMID:15664907 | ||
| Cell line (Toxoplasma gondii) | Pru | PMID:18347037 | ||
| Cell line (Toxoplasma gondii) | RH mCherry/RH | This work. | ||
| Cell line (Toxoplasma gondii) | RH ∆hxgprt | PMID:8662859 | ||
| Cell line (Toxoplasma gondii) | RH GFP | Gift of Michael W Panas. | ||
| Recombinant DNA reagent | pGRA-AP2I × 1-V5 | This work. | Constitutive expression plasmid carrying AP2I × 1 in tandem fusion to V5 tag. | |
| Chemical compound, drug | Propidium iodide (PI) | ThermoFisher | P3566 | |
| Chemical compound, drug | Sytox Green | ThermoFisher | S7020 | |
| Chemical compound, drug | Fixable blue dead cell stain kit | ThermoFisher | L34962 | |
| Chemical compound, drug | Vybrant DyeCycle Violet (DCV) | ThermoFisher | V35003 | |
| Chemical compound, drug | VECTASHIELD Antifade Mounting Medium with DAPI | Vector Laboratories | H-1200–10 | |
| Chemical compound, drug | Nuclease-free water | IDT | 11-04-02-01 | For SmartSeq2 protocol |
| Chemical compound, drug | recombinant RNase inhibitor | Takara Clonetech | 2313A | For SmartSeq2 protocol |
| Chemical compound, drug | 10 mM dNTP | ThermoFisher | R0194 | For SmartSeq2 protocol |
| Chemical compound, drug | ERCC RNA Spike-in Mix | ThermoFisher | 4456740 | For SmartSeq2 protocol |
| Chemical compound, drug | 10% Triton X-100 | Sigma-Aldrich | 93443 | For SmartSeq2 protocol |
| Chemical compound, drug | Buffer EB (elution buffer) | QIAGEN | 19086 | For SmartSeq2 protocol |
| Chemical compound, drug | AMPure XP nucleic acid purification beads | Beckman Coulter | A63880 | For SmartSeq2 protocol |
| Chemical compound, drug | Nucleofector Solution | Lonza | P3 Primary Cell solution | For transient transfection of Toxoplasma gondii |
| Antibody | Rabbit anti-SAG1 polyclonal antibody | PMID:15944311 | (1:500) | |
| Antibody | Mouse anti-V5 tag monoclonal antibody | Invitrogen | R960-25 | (1:1000) |
| Antibody | Goat polyclonal Alexa 488 Fluor-conjugated secondary antibodies | Invitrogen | A28175 | (1:1000) |
| Commercial assay, kit | SsoAdvanced Universal SYBR Green Supermix | Bio-rad | 1725271 | qPCR mastermix |
| Sequence-based reagent | All oligos used in this study | See ‘supplementary_file1_oligos.csv’ | ||
| Software | Analysis algorithm | www.github.com/xuesoso/singleToxoplasmaSeq | ||
| Software | Interactive browser | st-atlas.org |
Additional files
-
Supplementary file 1
A list of sequence-based reagents (e.g. oligos) used in this study.
- https://cdn.elifesciences.org/articles/54129/elife-54129-supp1-v2.csv
-
Supplementary file 2
A table of summary statistics and fold change of genes that are found to be differentially expressed between ‘G1 a’ and ‘G1 b’ parasites in RH.
Genes are considered differentially expressed only if the adjusted p-values of Kruskal-Wallis test are less than 0.05 and that they are at least 2-fold over-expressed in either of the cell states.
- https://cdn.elifesciences.org/articles/54129/elife-54129-supp2-v2.csv
-
Supplementary file 3
A table of summary statistics and fold change of genes that are found to be differentially expressed between across all cell cycle states in RH parasites.
Genes are considered differentially expressed only if the adjusted p-values of Kruskal-Wallis test are less than 0.05 and that they are at least 2-fold over-expressed in any of the cell states.
- https://cdn.elifesciences.org/articles/54129/elife-54129-supp3-v2.csv
-
Supplementary file 4
A table summarizing the hierarchical clustering results and encoded gene products.
Clustering is performed on smoothened gene expression based on biological pseudotime in RH parasites.
- https://cdn.elifesciences.org/articles/54129/elife-54129-supp4-v2.csv
-
Supplementary file 5
A table of summary statistics and fold change of genes that are found to be differentially expressed between across all clusters in Pru parasites.
Genes are considered differentially expressed only if the adjusted p-values of Kruskal-Wallis test are less than 0.05.
- https://cdn.elifesciences.org/articles/54129/elife-54129-supp5-v2.csv
-
Supplementary file 6
A table of summary statistics and fold change of genes that are found to be differentially expressed between across all clusters in ME49 parasites.
Genes are considered differentially expressed only if the adjusted p-values of Kruskal-Wallis test are less than 0.05.
- https://cdn.elifesciences.org/articles/54129/elife-54129-supp6-v2.csv
-
Transparent reporting form
- https://cdn.elifesciences.org/articles/54129/elife-54129-transrepform-v2.docx
Download links
A two-part list of links to download the article, or parts of the article, in various formats.
Downloads (link to download the article as PDF)
Open citations (links to open the citations from this article in various online reference manager services)
Cite this article (links to download the citations from this article in formats compatible with various reference manager tools)
A single-parasite transcriptional atlas of Toxoplasma Gondii reveals novel control of antigen expression
eLife 9:e54129.
https://doi.org/10.7554/eLife.54129


